Embed Size (px)
Citation preview

Wireless Tire Temperature Sensor Patchand System for Aircraft Landing Gear Testing
Item Type text; Proceedings
Authors Sulcs, Peter; Palmer, Carl; Naber, John; Jackson, Doug; Fuller,Lynn; Jones, Charles H.
Publisher International Foundation for Telemetering
Journal International Telemetering Conference Proceedings
Rights Copyright © held by the author; distribution rights InternationalFoundation for Telemetering
Download date 03/06/2018 14:43:42
Link to Item http://hdl.handle.net/10150/604251
1
WIRELESS TIRE TEMPERATURE SENSOR PATCH AND SYSTEM FOR AIRCRAFT LANDING GEAR TESTING
Peter Sulcs and Carl Palmer Impact Technologies, LLC
John Naber and Doug Jackson
University of Louisville
Lynn Fuller Rochester Institute of Technology
Charles H. Jones
Edwards AFB
ABSTRACT
Testing aircraft brake and tire systems often results in tire temperatures that makes the aircraft unsafe to approach (due to explosion risk) for up to 45 minutes; this complicates cost effective test execution. This paper describes work on a wireless sensor system that measures multiple tire temperatures and transmits the data to someone at a safe distance (>300 ft). The solution consists of a sensor patch adhered directly to the tire which measures the tire temperature. The patch transmits these measurements to off-tire reader/relay nodes that subsequently sends the data to a system controller and display device.
KEYWORDS
Wireless, sensor, tire temperature measurement
INTRODUCTION
Aircraft tires are designed to simultaneously meet the two most demanding challenges tires are exposed to: high speed and high loads. As such, aircraft tires lie in a unique design space [Figure 1]. The tradeoff that makes these design parameters jointly achievable is limited operational duration due to internal heat generation.
Approved for public release: distribution is unlimited. AFFTC‐PA‐10102
2
OFF-ROAD TIRE LOAD CAPACITY (X1000 LB)
TRUCK AND FARM TIRE LOAD CAPACITY
(X1000 LB)
RACE, PASSENGER AND
LIGHT TRUCK TIRE LOAD CAPACITY (X1000 LB)
TIRE OPERATIONAL SPEED (MPH)
AIRCRAFT TIRE LOAD CAPACITY (X1000 LB)
10
20
30
40
50
60
70
80
50 100 150 200 250 300
2
6
10
20
30
40
50
90
130
170
210
250
290
330
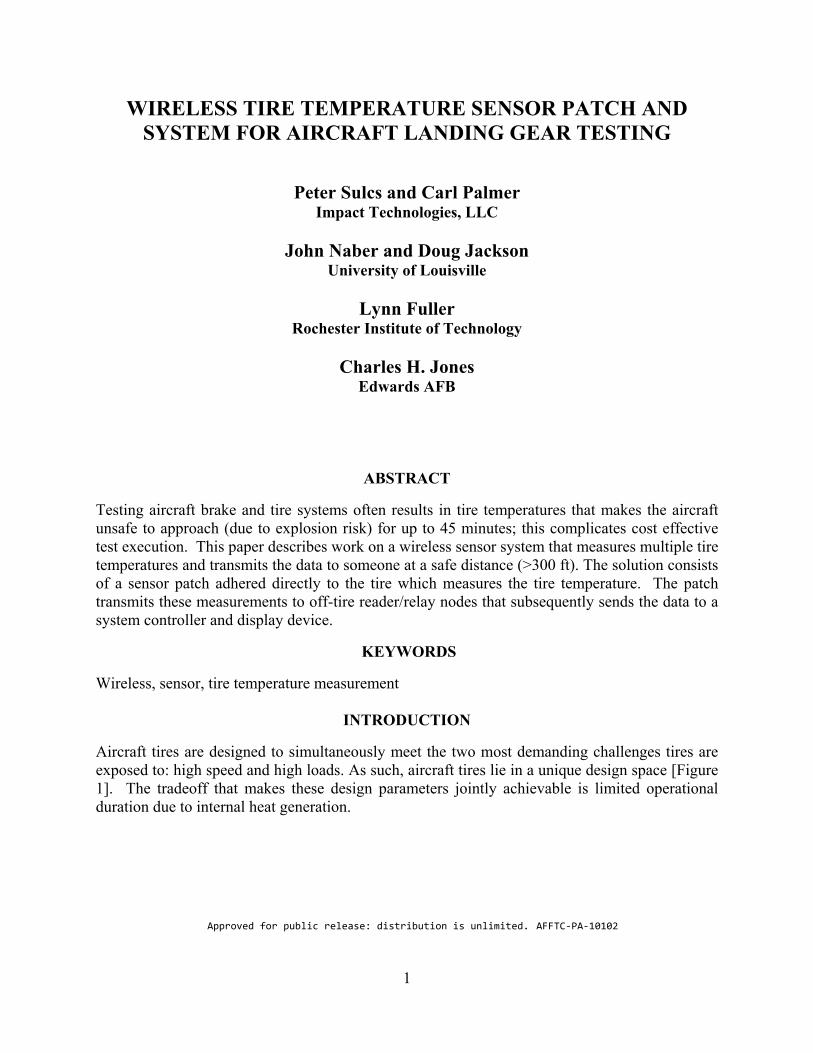
Figure 1: Fundamental Design Attributes for Different Tire Applications [1]
By weight, an aircraft tire is approximately 50% rubber, 45% fabric (usually nylon), and 5% steel [2]. Both rubber and nylon develop undesirable characteristics at high temperatures. Nylon exhibits reduced strength at a temperature above about 80 °F and starts to melt at temperatures slightly above 400 °F. Both the strength and adhesion properties of rubber are lost when rubber reverts to the uncured state at a temperature of around 300 °F; excessively high temperatures can cause catastrophic tire failures [Figure 3]. Because of the high pressures commonly found in aircraft tires (over 200 psi when cold) the lethal blast zone due to explosive failure is normally 300 feet to each side of the aircraft and the fuselage areas between the main landing gear struts.
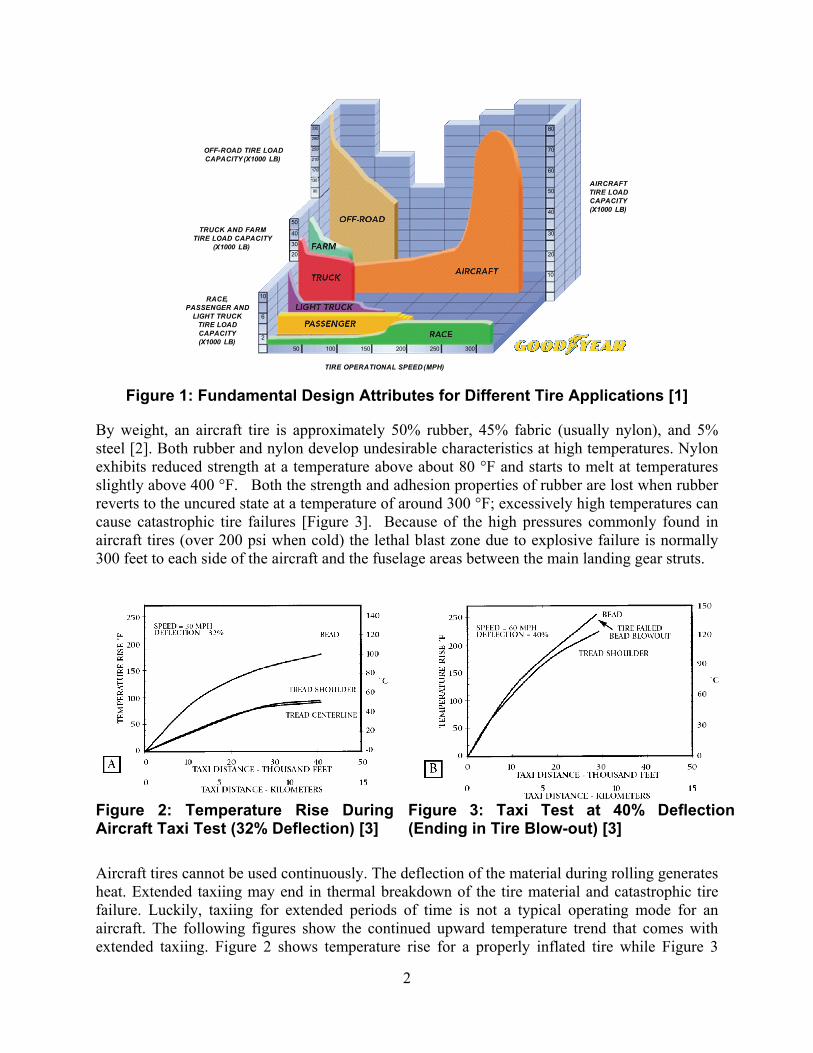
Figure 2: Temperature Rise During Aircraft Taxi Test (32% Deflection) [3]
Figure 3: Taxi Test at 40% Deflection (Ending in Tire Blow-out) [3]
Aircraft tires cannot be used continuously. The deflection of the material during rolling generates heat. Extended taxiing may end in thermal breakdown of the tire material and catastrophic tire failure. Luckily, taxiing for extended periods of time is not a typical operating mode for an aircraft. The following figures show the continued upward temperature trend that comes with extended taxiing. Figure 2 shows temperature rise for a properly inflated tire while Figure 3
3
shows the same for an underinflated tire. Note that the taxi distance in figure 2 is only 40,000 feet, less than 8 miles, and the temperature is still rising and did not reach a steady state. This observation illustrates the potential value of monitoring tire temperature even during routine aircraft operation. As an example, for specialized taxi test operations at facilities such as the Air Force Flight Test Center, Edwards Air Force Base (AFB), California, a 1 mile taxi out from a hangar to the runway, a single pass down a 3 mile long runway, and a 4 mile return to the test starting point can reach or exceed a combined 8 mile taxi distance.
In landing gear testing, the elements are purposely stressed and thus temperatures are frequently elevated enough to require ground personnel stay outside of the potential tire blast radius. Thus it is desired to monitor these temperatures to keep personnel safe and increase test efficiency. In addition, measuring these temperatures can enable collection of information pertinent to tire and landing gear design that has previously been too difficult and expensive to obtain.
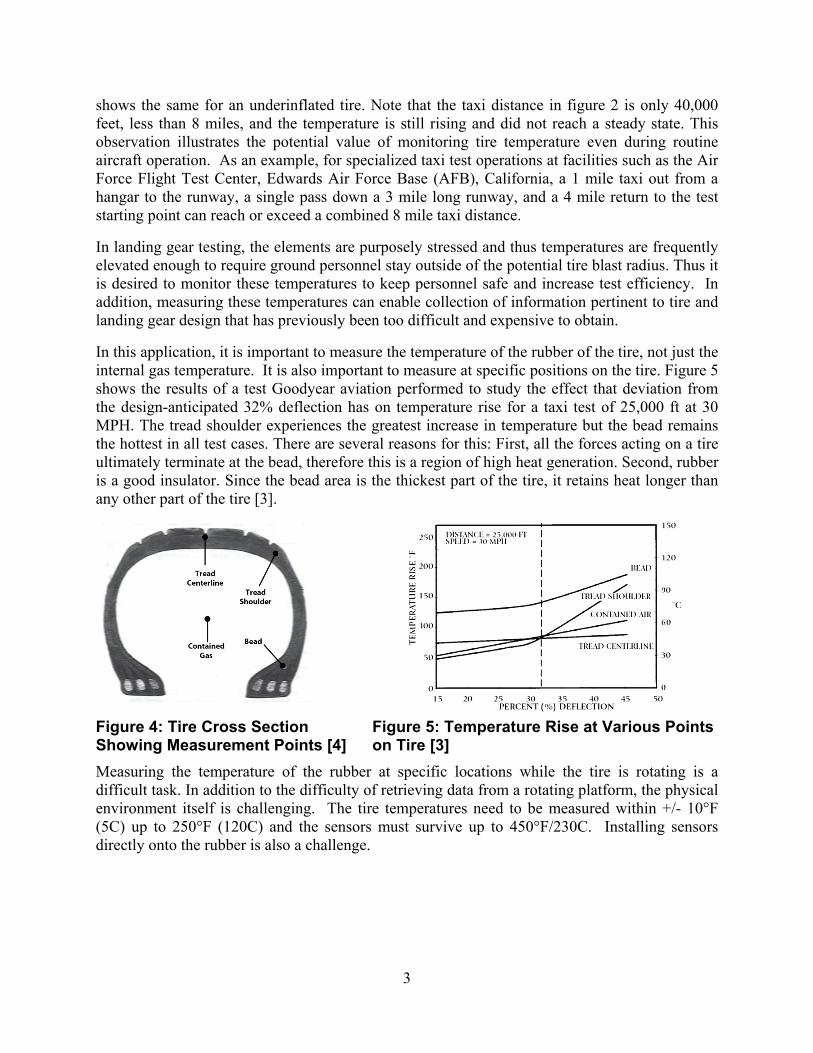
In this application, it is important to measure the temperature of the rubber of the tire, not just the internal gas temperature. It is also important to measure at specific positions on the tire. Figure 5 shows the results of a test Goodyear aviation performed to study the effect that deviation from the design-anticipated 32% deflection has on temperature rise for a taxi test of 25,000 ft at 30 MPH. The tread shoulder experiences the greatest increase in temperature but the bead remains the hottest in all test cases. There are several reasons for this: First, all the forces acting on a tire ultimately terminate at the bead, therefore this is a region of high heat generation. Second, rubber is a good insulator. Since the bead area is the thickest part of the tire, it retains heat longer than any other part of the tire [3].
Figure 4: Tire Cross Section Showing Measurement Points [4]
Figure 5: Temperature Rise at Various Points on Tire [3]
Measuring the temperature of the rubber at specific locations while the tire is rotating is a difficult task. In addition to the difficulty of retrieving data from a rotating platform, the physical environment itself is challenging. The tire temperatures need to be measured within +/- 10°F (5C) up to 250°F (120C) and the sensors must survive up to 450°F/230C. Installing sensors directly onto the rubber is also a challenge.

4
SYSTEM CONCEPT
The proposed solution, as shown in Figure 6, consists of several components necessary to overcome the challenges of wirelessly transferring measured parameters from rotating tires. A sensor patch adhered directly to the tire measures the tire temperature. The patch transmits these measurements to one or more off-tire reader/relay nodes which subsequently send these measurements to a system controller and display device up to three hundred feet away or in the manned areas of the aircraft.
Figure 6: Tire Temperature Monitoring System Concept
Two designs are being evaluated for measuring tire temperature: a passive patch and an active patch. The passive patch is an LC tank circuit utilizing a temperature-sensitive capacitor that provides predictable changes in resonant frequency as a function of temperature. The active patch is a more traditional wireless sensor design that includes a coin cell sized battery powering an ultra-low powered microcontroller and transmitter.
PASSIVE PATCH APPROACH
A method of passive wireless temperature sensing using a method that will be unaffected by pressure variations is being developed. LC circuits are being investigated, as they are a common method used in passive RFID (Radio Frequency Identification). They have a natural resonant frequency of
(1)
f 1
2 LC
5
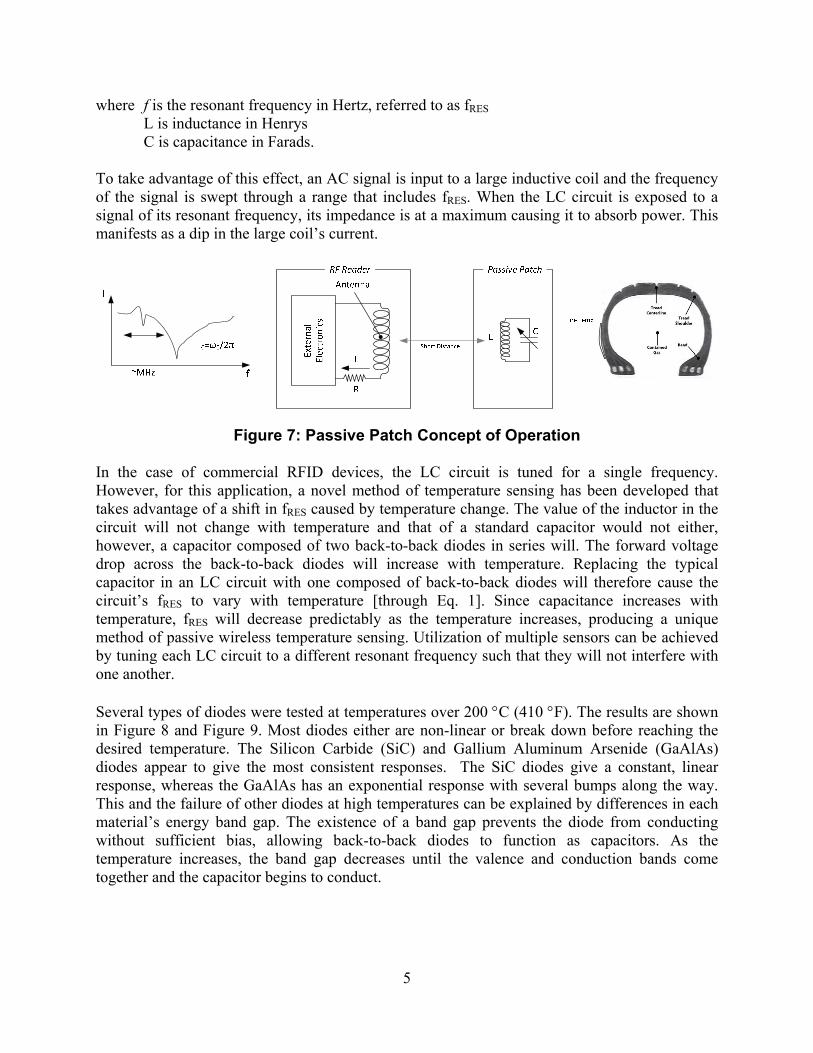
where f is the resonant frequency in Hertz, referred to as fRES L is inductance in Henrys C is capacitance in Farads. To take advantage of this effect, an AC signal is input to a large inductive coil and the frequency of the signal is swept through a range that includes fRES. When the LC circuit is exposed to a signal of its resonant frequency, its impedance is at a maximum causing it to absorb power. This manifests as a dip in the large coil’s current.
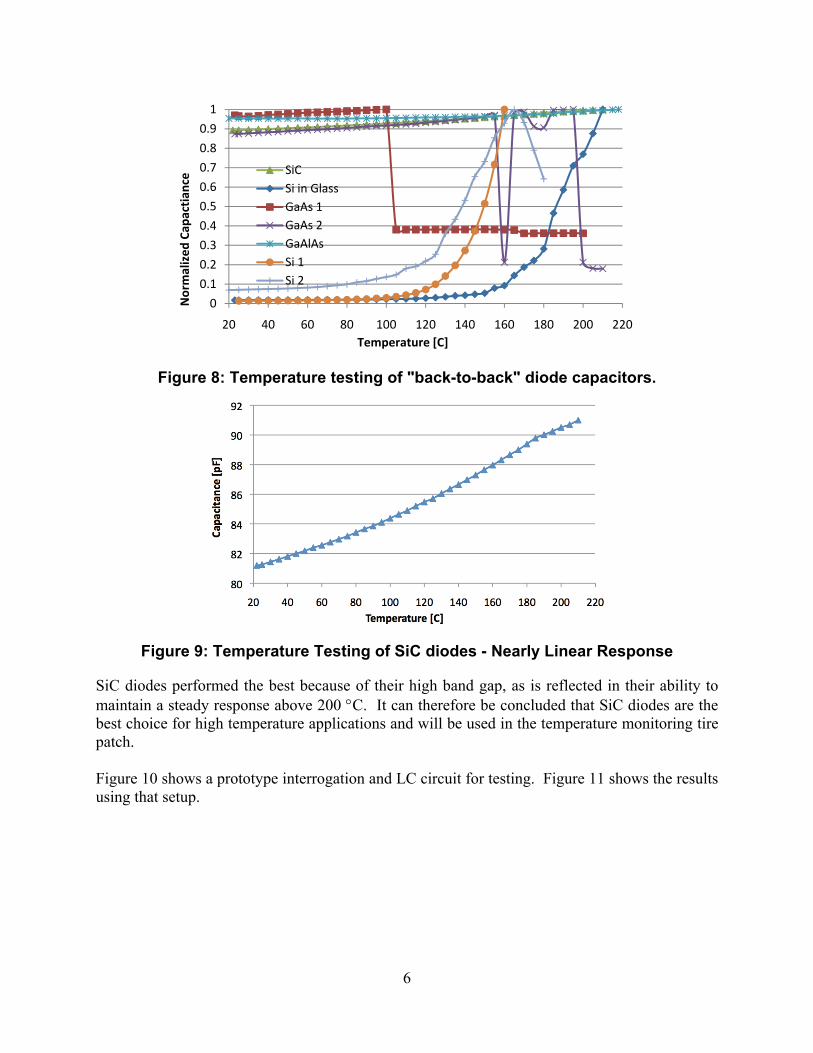
Figure 7: Passive Patch Concept of Operation In the case of commercial RFID devices, the LC circuit is tuned for a single frequency. However, for this application, a novel method of temperature sensing has been developed that takes advantage of a shift in fRES caused by temperature change. The value of the inductor in the circuit will not change with temperature and that of a standard capacitor would not either, however, a capacitor composed of two back-to-back diodes in series will. The forward voltage drop across the back-to-back diodes will increase with temperature. Replacing the typical capacitor in an LC circuit with one composed of back-to-back diodes will therefore cause the circuit’s fRES to vary with temperature [through Eq. 1]. Since capacitance increases with temperature, fRES will decrease predictably as the temperature increases, producing a unique method of passive wireless temperature sensing. Utilization of multiple sensors can be achieved by tuning each LC circuit to a different resonant frequency such that they will not interfere with one another. Several types of diodes were tested at temperatures over 200 C (410 F). The results are shown in Figure 8 and Figure 9. Most diodes either are non-linear or break down before reaching the desired temperature. The Silicon Carbide (SiC) and Gallium Aluminum Arsenide (GaAlAs) diodes appear to give the most consistent responses. The SiC diodes give a constant, linear response, whereas the GaAlAs has an exponential response with several bumps along the way. This and the failure of other diodes at high temperatures can be explained by differences in each material’s energy band gap. The existence of a band gap prevents the diode from conducting without sufficient bias, allowing back-to-back diodes to function as capacitors. As the temperature increases, the band gap decreases until the valence and conduction bands come together and the capacitor begins to conduct.
6
Figure 8: Temperature testing of "back-to-back" diode capacitors.
Figure 9: Temperature Testing of SiC diodes - Nearly Linear Response
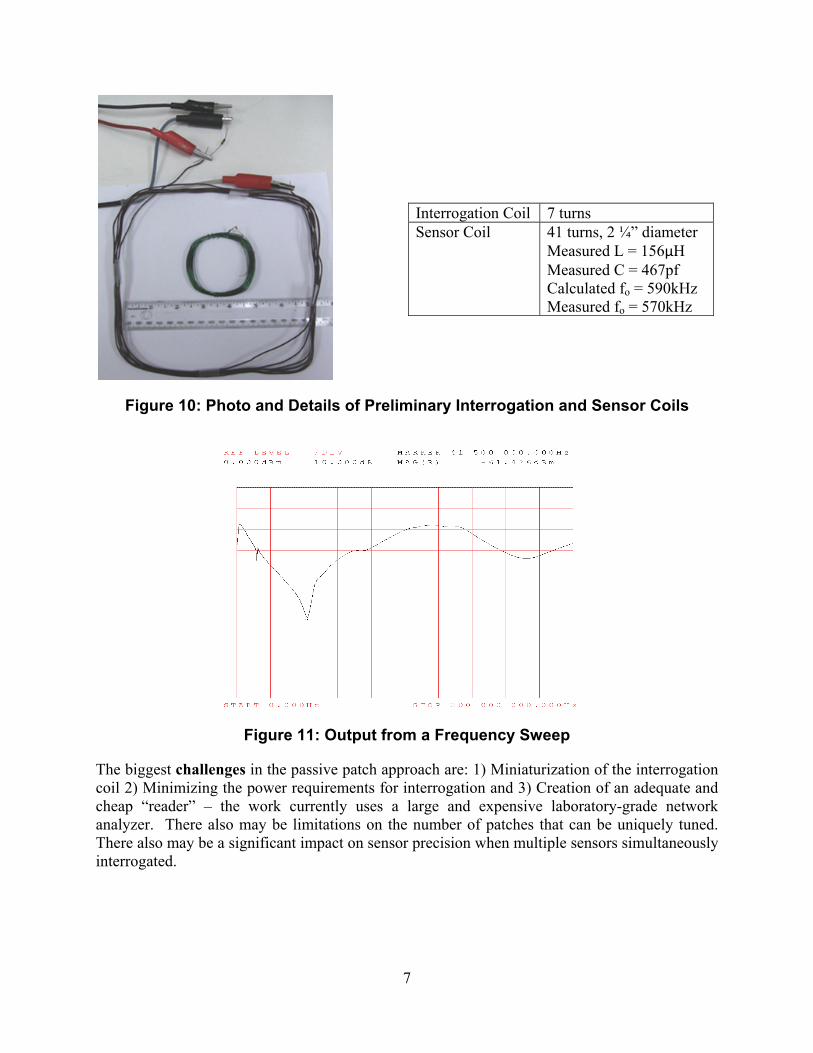
SiC diodes performed the best because of their high band gap, as is reflected in their ability to maintain a steady response above 200 C. It can therefore be concluded that SiC diodes are the best choice for high temperature applications and will be used in the temperature monitoring tire patch. Figure 10 shows a prototype interrogation and LC circuit for testing. Figure 11 shows the results using that setup.
0
0.1
0.2
0.3
0.4
0.5
0.6
0.7
0.8
0.9
1
20 40 60 80 100 120 140 160 180 200 220
Norm
alized Cap
actian
ce
Temperature [C]
SiC
Si in Glass
GaAs 1
GaAs 2
GaAlAs
Si 1
Si 2
7
Interrogation Coil 7 turns Sensor Coil 41 turns, 2 ¼” diameter
Measured L = 156μH Measured C = 467pf Calculated fo = 590kHz Measured fo = 570kHz
Figure 10: Photo and Details of Preliminary Interrogation and Sensor Coils
Figure 11: Output from a Frequency Sweep
The biggest challenges in the passive patch approach are: 1) Miniaturization of the interrogation coil 2) Minimizing the power requirements for interrogation and 3) Creation of an adequate and cheap “reader” – the work currently uses a large and expensive laboratory-grade network analyzer. There also may be limitations on the number of patches that can be uniquely tuned. There also may be a significant impact on sensor precision when multiple sensors simultaneously interrogated.
8
ACTIVE PATCH
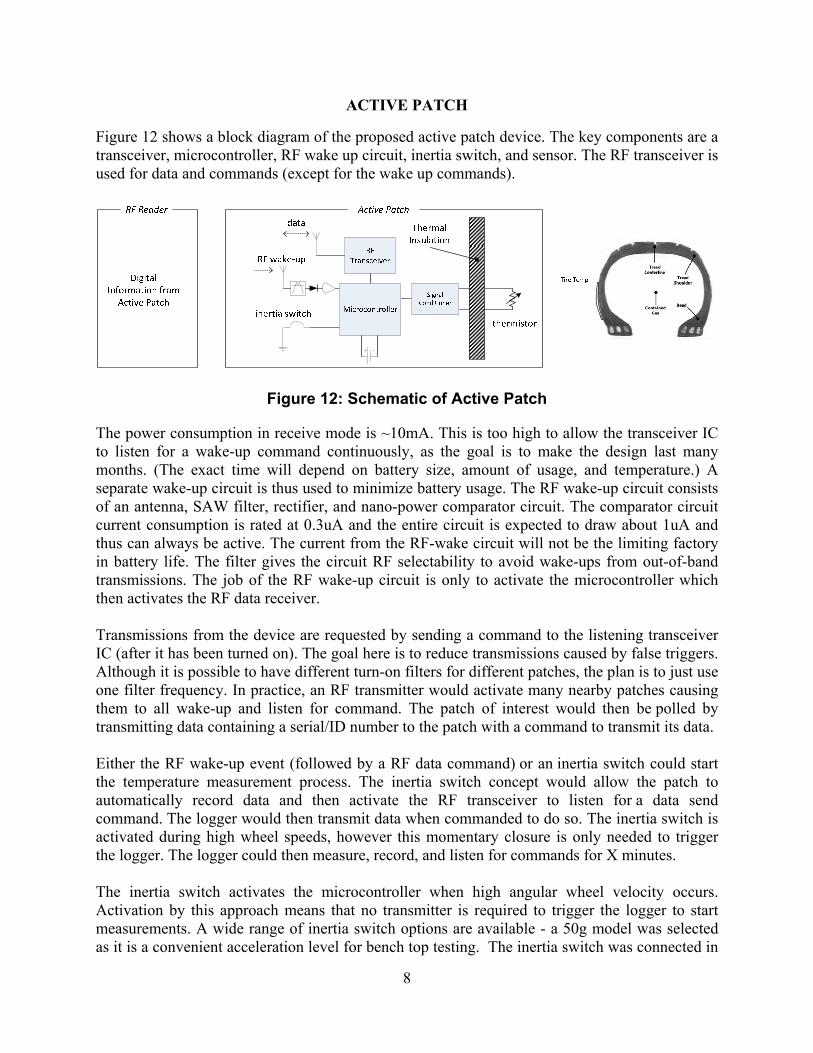
Figure 12 shows a block diagram of the proposed active patch device. The key components are a transceiver, microcontroller, RF wake up circuit, inertia switch, and sensor. The RF transceiver is used for data and commands (except for the wake up commands).
Figure 12: Schematic of Active Patch
The power consumption in receive mode is ~10mA. This is too high to allow the transceiver IC to listen for a wake-up command continuously, as the goal is to make the design last many months. (The exact time will depend on battery size, amount of usage, and temperature.) A separate wake-up circuit is thus used to minimize battery usage. The RF wake-up circuit consists of an antenna, SAW filter, rectifier, and nano-power comparator circuit. The comparator circuit current consumption is rated at 0.3uA and the entire circuit is expected to draw about 1uA and thus can always be active. The current from the RF-wake circuit will not be the limiting factory in battery life. The filter gives the circuit RF selectability to avoid wake-ups from out-of-band transmissions. The job of the RF wake-up circuit is only to activate the microcontroller which then activates the RF data receiver. Transmissions from the device are requested by sending a command to the listening transceiver IC (after it has been turned on). The goal here is to reduce transmissions caused by false triggers. Although it is possible to have different turn-on filters for different patches, the plan is to just use one filter frequency. In practice, an RF transmitter would activate many nearby patches causing them to all wake-up and listen for command. The patch of interest would then be polled by transmitting data containing a serial/ID number to the patch with a command to transmit its data. Either the RF wake-up event (followed by a RF data command) or an inertia switch could start the temperature measurement process. The inertia switch concept would allow the patch to automatically record data and then activate the RF transceiver to listen for a data send command. The logger would then transmit data when commanded to do so. The inertia switch is activated during high wheel speeds, however this momentary closure is only needed to trigger the logger. The logger could then measure, record, and listen for commands for X minutes. The inertia switch activates the microcontroller when high angular wheel velocity occurs. Activation by this approach means that no transmitter is required to trigger the logger to start measurements. A wide range of inertia switch options are available - a 50g model was selected as it is a convenient acceleration level for bench top testing. The inertia switch was connected in
9
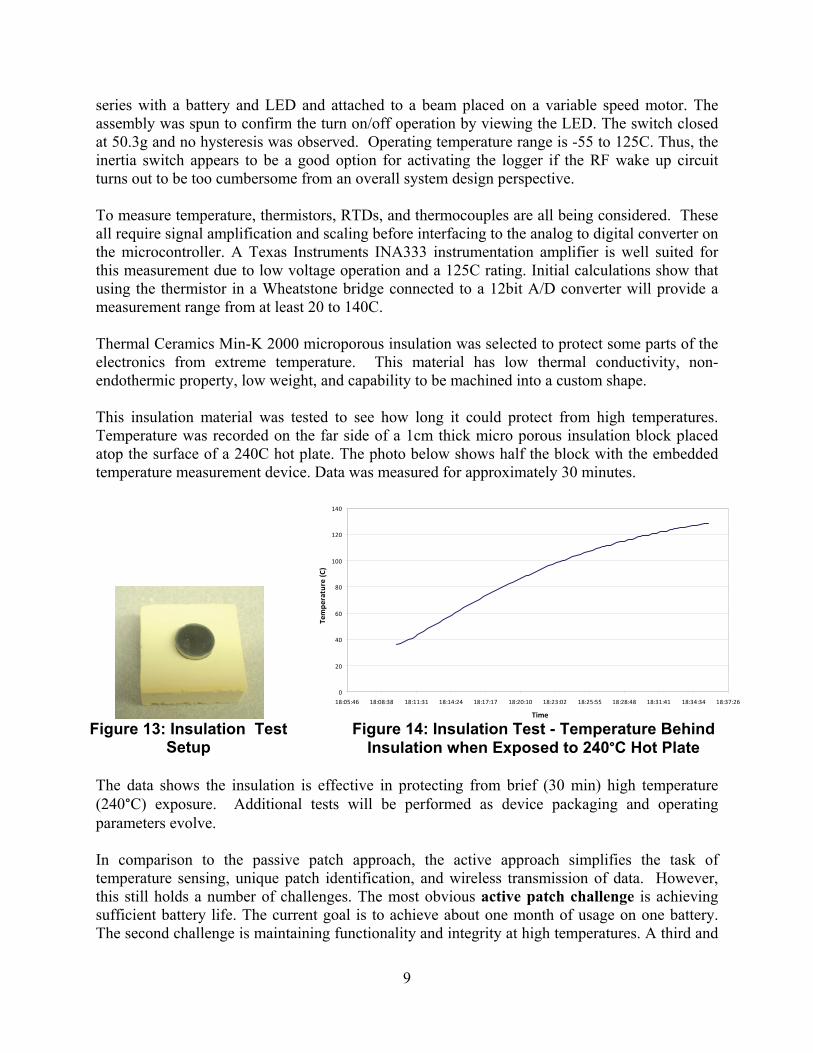
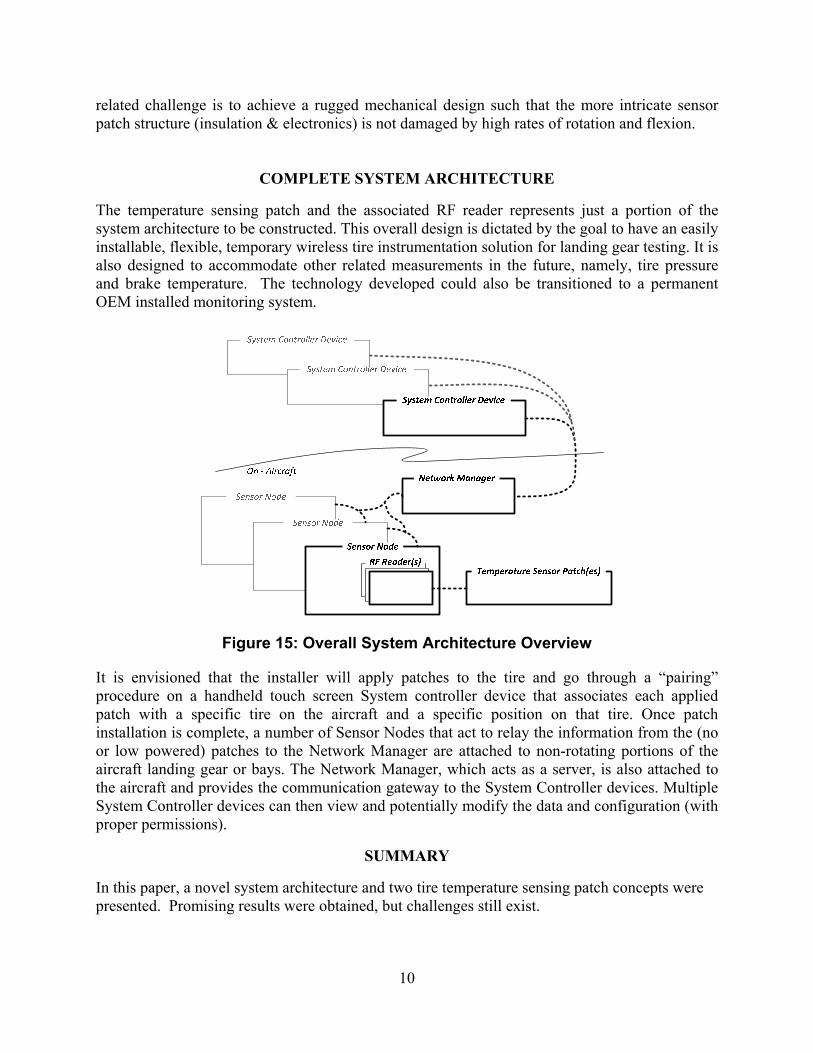
series with a battery and LED and attached to a beam placed on a variable speed motor. The assembly was spun to confirm the turn on/off operation by viewing the LED. The switch closed at 50.3g and no hysteresis was observed. Operating temperature range is -55 to 125C. Thus, the inertia switch appears to be a good option for activating the logger if the RF wake up circuit turns out to be too cumbersome from an overall system design perspective. To measure temperature, thermistors, RTDs, and thermocouples are all being considered. These all require signal amplification and scaling before interfacing to the analog to digital converter on the microcontroller. A Texas Instruments INA333 instrumentation amplifier is well suited for this measurement due to low voltage operation and a 125C rating. Initial calculations show that using the thermistor in a Wheatstone bridge connected to a 12bit A/D converter will provide a measurement range from at least 20 to 140C. Thermal Ceramics Min-K 2000 microporous insulation was selected to protect some parts of the electronics from extreme temperature. This material has low thermal conductivity, non-endothermic property, low weight, and capability to be machined into a custom shape. This insulation material was tested to see how long it could protect from high temperatures. Temperature was recorded on the far side of a 1cm thick micro porous insulation block placed atop the surface of a 240C hot plate. The photo below shows half the block with the embedded temperature measurement device. Data was measured for approximately 30 minutes.
Figure 13: Insulation Test
Setup Figure 14: Insulation Test - Temperature Behind
Insulation when Exposed to 240°C Hot Plate
The data shows the insulation is effective in protecting from brief (30 min) high temperature (240°C) exposure. Additional tests will be performed as device packaging and operating parameters evolve. In comparison to the passive patch approach, the active approach simplifies the task of temperature sensing, unique patch identification, and wireless transmission of data. However, this still holds a number of challenges. The most obvious active patch challenge is achieving sufficient battery life. The current goal is to achieve about one month of usage on one battery. The second challenge is maintaining functionality and integrity at high temperatures. A third and
0
20
40
60
80
100
120
140
18:05:46 18:08:38 18:11:31 18:14:24 18:17:17 18:20:10 18:23:02 18:25:55 18:28:48 18:31:41 18:34:34 18:37:26
Time
Temperature (C)
10
related challenge is to achieve a rugged mechanical design such that the more intricate sensor patch structure (insulation & electronics) is not damaged by high rates of rotation and flexion.
COMPLETE SYSTEM ARCHITECTURE
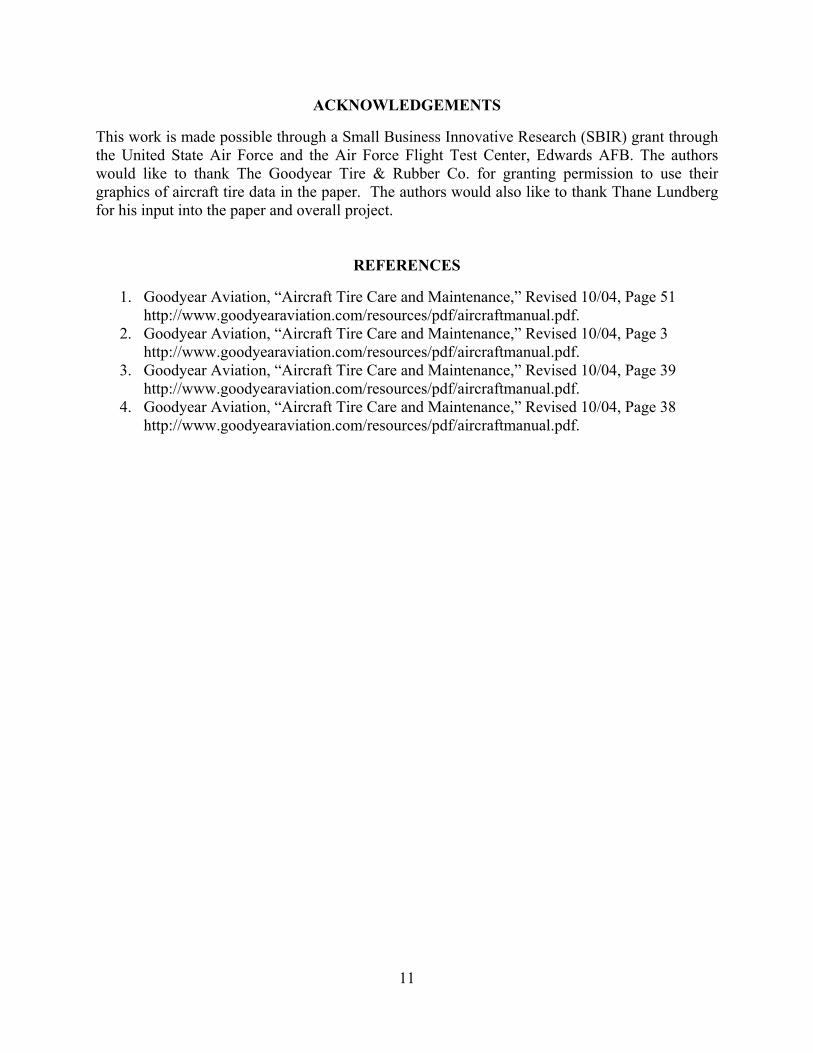
The temperature sensing patch and the associated RF reader represents just a portion of the system architecture to be constructed. This overall design is dictated by the goal to have an easily installable, flexible, temporary wireless tire instrumentation solution for landing gear testing. It is also designed to accommodate other related measurements in the future, namely, tire pressure and brake temperature. The technology developed could also be transitioned to a permanent OEM installed monitoring system.
Figure 15: Overall System Architecture Overview
It is envisioned that the installer will apply patches to the tire and go through a “pairing” procedure on a handheld touch screen System controller device that associates each applied patch with a specific tire on the aircraft and a specific position on that tire. Once patch installation is complete, a number of Sensor Nodes that act to relay the information from the (no or low powered) patches to the Network Manager are attached to non-rotating portions of the aircraft landing gear or bays. The Network Manager, which acts as a server, is also attached to the aircraft and provides the communication gateway to the System Controller devices. Multiple System Controller devices can then view and potentially modify the data and configuration (with proper permissions).
SUMMARY
In this paper, a novel system architecture and two tire temperature sensing patch concepts were presented. Promising results were obtained, but challenges still exist.
11
ACKNOWLEDGEMENTS
This work is made possible through a Small Business Innovative Research (SBIR) grant through the United State Air Force and the Air Force Flight Test Center, Edwards AFB. The authors would like to thank The Goodyear Tire & Rubber Co. for granting permission to use their graphics of aircraft tire data in the paper. The authors would also like to thank Thane Lundberg for his input into the paper and overall project.
REFERENCES
1. Goodyear Aviation, “Aircraft Tire Care and Maintenance,” Revised 10/04, Page 51 http://www.goodyearaviation.com/resources/pdf/aircraftmanual.pdf.
2. Goodyear Aviation, “Aircraft Tire Care and Maintenance,” Revised 10/04, Page 3 http://www.goodyearaviation.com/resources/pdf/aircraftmanual.pdf.
3. Goodyear Aviation, “Aircraft Tire Care and Maintenance,” Revised 10/04, Page 39 http://www.goodyearaviation.com/resources/pdf/aircraftmanual.pdf.
4. Goodyear Aviation, “Aircraft Tire Care and Maintenance,” Revised 10/04, Page 38 http://www.goodyearaviation.com/resources/pdf/aircraftmanual.pdf.