Embed Size (px)
Citation preview

Washington University in St. LouisWashington University Open Scholarship
All Theses and Dissertations (ETDs)
Summer 8-1-2013
Wireless Cyber-Physical Simulator and CaseStudies on Structural ControlBo LiWashington University in St. Louis
Follow this and additional works at: http://openscholarship.wustl.edu/etd
Part of the Computer Engineering Commons
This Thesis is brought to you for free and open access by Washington University Open Scholarship. It has been accepted for inclusion in All Theses andDissertations (ETDs) by an authorized administrator of Washington University Open Scholarship. For more information, please [email protected].
Recommended CitationLi, Bo, "Wireless Cyber-Physical Simulator and Case Studies on Structural Control" (2013). All Theses and Dissertations (ETDs). 1167.http://openscholarship.wustl.edu/etd/1167

Washington University in St. Louis
School of Engineering and Applied Science
Department of Computer Science and Engineering
Thesis Examination Committee:Dr. Roger D. Chamberlain
Dr. Christopher D. GillDr. Chenyang Lu, Chair
Wireless Cyber-Physical Simulator and Case Studies on Structural Control
by
Bo Li
A thesis presented to the Graduate School of Arts and Sciencesof Washington University in partial fulfillment of the
requirements for the degree of
Master of Science
August 2013Saint Louis, Missouri

Contents
List of Figures . . . . . . . . . . . . . . . . . . . . . . . . . . . . . . . . . . . . . . . iii
Acknowledgments . . . . . . . . . . . . . . . . . . . . . . . . . . . . . . . . . . . . . iv
Abstract . . . . . . . . . . . . . . . . . . . . . . . . . . . . . . . . . . . . . . . . . . . v
1 Introduction . . . . . . . . . . . . . . . . . . . . . . . . . . . . . . . . . . . . . . . 1
2 Related Works . . . . . . . . . . . . . . . . . . . . . . . . . . . . . . . . . . . . . 3
3 Wireless Cyber-Physical Simulator . . . . . . . . . . . . . . . . . . . . . . . . . . 5
4 Case Study Design . . . . . . . . . . . . . . . . . . . . . . . . . . . . . . . . . . . 84.1 Excitation Signal . . . . . . . . . . . . . . . . . . . . . . . . . . . . . . . . . . . 84.2 Design the Building Study . . . . . . . . . . . . . . . . . . . . . . . . . . . . . . 8
4.2.1 Wireless trace collection . . . . . . . . . . . . . . . . . . . . . . . . . . . 84.2.2 Building model . . . . . . . . . . . . . . . . . . . . . . . . . . . . . . . . 9
4.3 Design the Bridge Study . . . . . . . . . . . . . . . . . . . . . . . . . . . . . . . 114.3.1 Wireless trace collection . . . . . . . . . . . . . . . . . . . . . . . . . . . 124.3.2 Bridge model . . . . . . . . . . . . . . . . . . . . . . . . . . . . . . . . . 14
5 Wireless Control Approaches . . . . . . . . . . . . . . . . . . . . . . . . . . . . . 165.1 Sample Controller . . . . . . . . . . . . . . . . . . . . . . . . . . . . . . . . . . . 165.2 Optimal Time Delay Controller . . . . . . . . . . . . . . . . . . . . . . . . . . . . 18
6 Results of Case Studies . . . . . . . . . . . . . . . . . . . . . . . . . . . . . . . . . 216.1 Wireless Building Control . . . . . . . . . . . . . . . . . . . . . . . . . . . . . . 216.2 Wireless Bridge Control . . . . . . . . . . . . . . . . . . . . . . . . . . . . . . . 24
7 Conclusion . . . . . . . . . . . . . . . . . . . . . . . . . . . . . . . . . . . . . . . 27
References . . . . . . . . . . . . . . . . . . . . . . . . . . . . . . . . . . . . . . . . . 28
Vita . . . . . . . . . . . . . . . . . . . . . . . . . . . . . . . . . . . . . . . . . . . . . 31
ii
List of Figures
3.1 WSC System Model. . . . . . . . . . . . . . . . . . . . . . . . . . . . . . . . . . 63.2 Component architecture of WCPS. . . . . . . . . . . . . . . . . . . . . . . . . . . 7
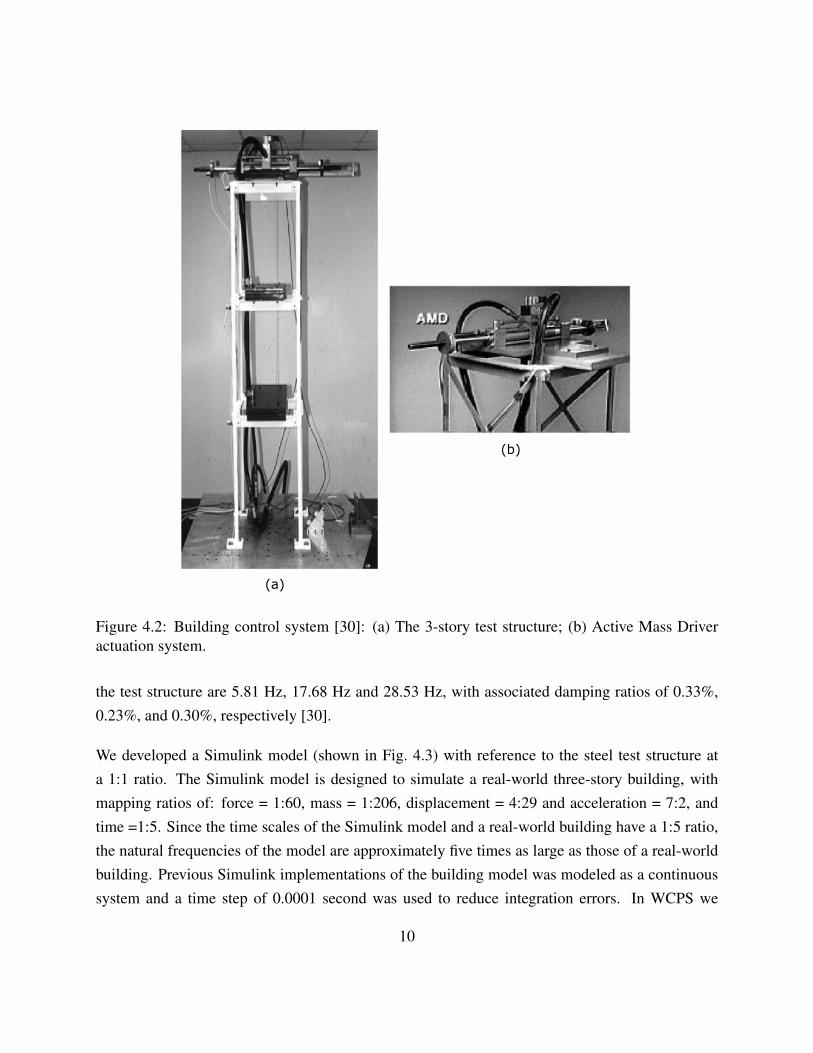
4.1 The El Centro earthquake as excitation signal of structural control [10] [30]. . . . . 94.2 Building control system [30]: (a) The 3-story test structure; (b) Active Mass Driver
actuation system. . . . . . . . . . . . . . . . . . . . . . . . . . . . . . . . . . . . 104.3 Simulink diagram for wireless building control. . . . . . . . . . . . . . . . . . . . 114.4 Wireless pylon sensor and base station placement on the Jindo bridge. . . . . . . . 124.5 Simulink diagram for wireless bridge control. . . . . . . . . . . . . . . . . . . . . 134.6 PRR Difference between field measurement and TOSSIM simulation. . . . . . . . 144.7 Cape Girardeau model in WCPS: (a) the Cape Girardeau bridge; (b) Simulink
model of the Cape Girardeau bridge [10]. . . . . . . . . . . . . . . . . . . . . . . 15
5.1 Example of baseline SC controller with Sequential Scheduler. . . . . . . . . . . . 175.2 Example of OTDC-1 with UDS scheduler. . . . . . . . . . . . . . . . . . . . . . . 185.3 Example of OTDC-2 with UDS scheduler. . . . . . . . . . . . . . . . . . . . . . . 19
6.1 End-to-End Packet Delivery Ratio of Sensors in Building Study . . . . . . . . . . 226.2 Required Resource for Wireless Building Control: (a) Required Control Power;
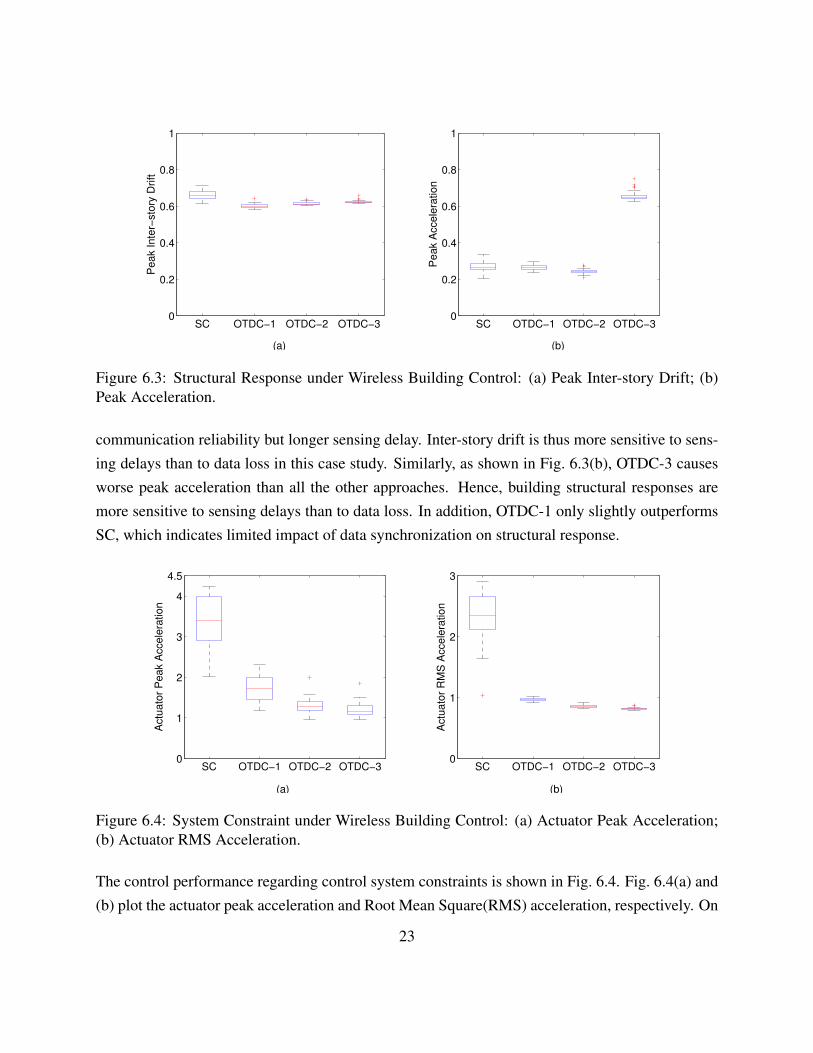
(b) Required Force Magnitude. . . . . . . . . . . . . . . . . . . . . . . . . . . . . 226.3 Structural Response under Wireless Building Control: (a) Peak Inter-story Drift;
(b) Peak Acceleration. . . . . . . . . . . . . . . . . . . . . . . . . . . . . . . . . 236.4 System Constraint under Wireless Building Control: (a) Actuator Peak Accelera-
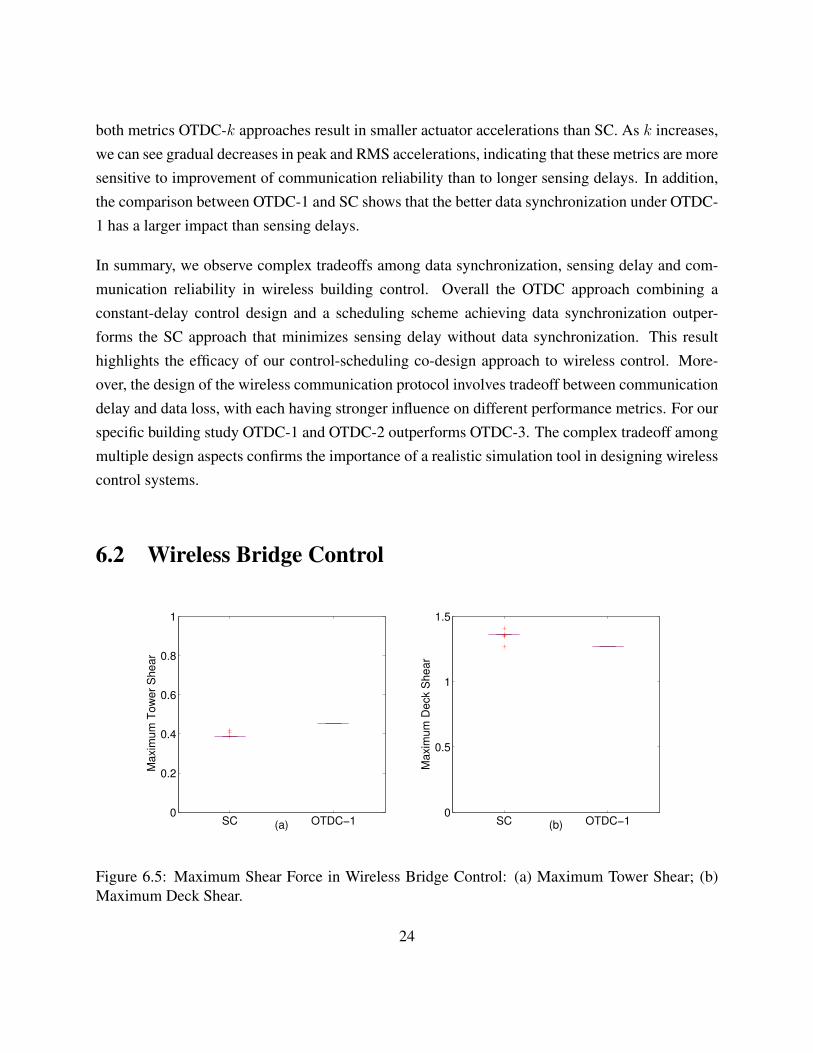
tion; (b) Actuator RMS Acceleration. . . . . . . . . . . . . . . . . . . . . . . . . 236.5 Maximum Shear Force in Wireless Bridge Control: (a) Maximum Tower Shear;
(b) Maximum Deck Shear. . . . . . . . . . . . . . . . . . . . . . . . . . . . . . . 246.6 Normalized Shear Force in Wireless Bridge Control: (a) Normalized Tower Shear;
(b) Normalized Deck Shear. . . . . . . . . . . . . . . . . . . . . . . . . . . . . . 256.7 Control Power Requirement Performances for Wireless Bridge Control: (a) Maxi-
mum Control Power; (b) Total Control Power. . . . . . . . . . . . . . . . . . . . . 26
iii

Acknowledgments
The work presented in this thesis is a team work. I do want to deliver my appreciation to ourcolleagues Mr. Zhuoxiong Sun and Dr. Shirley J. Dyke from School of Mechanical Engineering ofPurdue University, Dr. Kirill Mechitov and Dr. Gul Agha from Department of Computer Scienceof University of Illinois at Urbana-Champaign, Dr. Billie F. Spencer Jr. from Department of Civiland Environmental Engineering of University of Illinois at Urbana-Champaign, and last but notleast Dr. Gregory Hackmann and Dr. Chenyang Lu from Department of Computer Science andEngineering of Washington University in St. Louis.
I also want to deliver my thanks to my Master Thesis Committee: Dr. Roger D. Chamberlain, Dr.Christopher D. Gill, and Dr. Chenyang Lu.
The whole work of mine is dedicated to the Li’s family, for her always pursuing usefulness of theScience and goodness of the Human Being.
Bo Li
Washington University in Saint LouisAugust 2013
iv
ABSTRACT OF THE THESIS
Wireless Cyber-Physical Simulator and Case Studies on Structural Control
by
Bo Li
Master of Science in Computer Science
Washington University in St. Louis, August 2013
Research Advisor: Dr. Chenyang Lu
Wireless Structural Control (WSC) systems can play a crucial role in protecting civil infrastruc-
ture in the event of earthquakes and other natural disasters. Such systems represent an exemplary
class of cyber-physical systems that perform close-loop control using wireless sensor networks.
Existing WSC research usually employs wireless sensors installed on small lab structures, which
cannot capture realistic delays and data loss in wireless sensor networks deployed on large civil
structures. The lack of realistic tools that capture both the cyber (wireless) and physical (structural)
aspects of WSC systems has been a hurdle for cyber-physical systems research for civil infrastruc-
ture. This advances the state of the art through the following contributions. First, we developed
the Wireless Cyber-Physical Simulator (WCPS), an integrated environment that combines realis-
tic simulations of both wireless sensor networks and structures. WCPS integrates Simulink and
TOSSIM, a stateof- the-art sensor network simulator featuring a realistic wireless model seeded
by signal traces. Second, we performed two realistic case studies each combining a structural
model with wireless traces collected from real-world environments. The building study combines
a benchmark building model and wireless traces collected from a multi-story building. The bridge
v

study combines the structural model of the Cape Girardeau bridge over the Mississippi River and
wireless traces collected from a similar bridge (the Jindo Bridge) in South Korea. These case
studies shed light on the challenges of WSC and the limitations of a traditional structural control
approach under realistic wireless conditions. Finally, we proposed a cyber-physical co-design ap-
proach to WSC that integrates a novel holistic scheduling scheme (for sensing, communication
and control) and an Optimal Time Delay Controller (OTDC) that substantially improves structural
control performance.
vi

Chapter 1
Introduction
Wireless Structural Control (WSC) is a promising cyber-physical system technology for protectingour civil infrastructure in the event of earthquakes and other natural disasters. A WSC systememploys a feedback control loop to control the dynamic response of a civil structure based onsensor data collected through wireless sensor networks. As a representative example of cyber-physical systems, a WSC system requires holistic system designs that crosscut cyber (wireless andcontrol) and physical (structural dynamics) components.
Since deployments of control systems on large civil structures (e.g., bridges and buildings) arecostly and labor intensive, to date WSC systems have mostly been evaluated using wireless sen-sors installed on small lab structures. Unfortunately, such networks cannot capture the delays anddata loss in wireless sensor networks deployed on large civil structures in real-world environments.There is a critical need for simulation tools and case studies that realistically model wireless char-acteristics and the structural dynamics of WSC systems.
To meet this challenge in WSC research, we have developed a simulator specifically designed tosupport realistic simulations of wireless cyber-physical systems. Specifically, the contributions ofthis thesis are three-fold:
• First, we describe the Wireless Cyber-Physical Simulator(WCPS), an integrated environmentthat combines realistic simulations of both wireless sensor networks and structures. WCPSintegrates Simulink ?? and TOSSIM ??, a state-of-the-art sensor network simulator featuringa realistic wireless model seeded by real-world wireless traces.
1

• Second, we present two realistic case studies each matching a structural model with wirelesstraces collected from real-world environments. The building study combines a benchmarkbuilding model and wireless traces collected from a multi-story building. The bridge study
combines the structural model of the Cape Girardeau Bridge over the Mississippi River andwireless traces collected from a similar bridge (the Jindo Bridge) in South Korea. Thesecase studies shed lights on the challenges of WSC and the limitations of traditional structuralcontrol approaches.
• Finally, we propose a cyber-physical co-design approach to WSC that integrates a holisticscheduling scheme (including sensing, communication and control) and an Optimal TimeDelay Controller (OTDC), which substantially improves structural control performance inthe presence of wireless communication delay and packet loss.
While this thesis focuses on WSC as case studies, the WCPS tool can be used to simulate otherwireless control systems. Furthermore, our cyber-physical co-design approach and insights fromthe case studies can be generalized to other cyber-physical systems, especially large-scale wirelesscontrol systems. WCPS has been released as open-source software at
The rest of the thesis is organized as follows. Chapter 2 reviews related works. Chapter 3 presentsthe WCPS simulator. Chapter 4 describes explicit designs of the case studies. Chapter 5 details thecyber-physical co-design approach to wireless control. Chapter 6 presents the results of the casestudies. Chapter 7 concludes the thesis.
2

Chapter 2
Related Works
Wireless Structural Health Monitoring(WSHM) research has been active in the past decade [13,16]. Recent efforts for WSHM include: a distributed wireless sensing system for WSHM [22], thefirst wireless system deployed on a tower of over 600 meters tall [24] , a networked computingapproach in WSHM [15], a high quality sensor placement study for WSHM [21], a cyber-physicalco-design of wireless distributed structural health monitoring [12], the largest wireless bridge mon-itoring system in the world [14] and Torre Aquila deployment for heritage building monitoring [6],to name a few.
However, close-loop wireless control for civil structures is still in its infancy. While early effortsdeveloped control algorithms and prototype wireless control systems [23, 33, 34], all the previousexperiments were performed on small-scale lab structures. In the lab settings, wireless sensorswithin a single hop and experience no data loss due to physical proximity of the devices.
Wireless control has been studied with promising results in other domains [3–5,25]. The challengein realistic experimentation with WSC systems motivates the development of our WCPS and casestudies based on real-world wireless traces and realistic structural models. Our work thus expandsthe field of wireless control to the civil infrastructure domain. Moreover, WCPS can also be used tosimulate other large-scale wireless control systems, and our scheduling-control co-design approachmay be generalized to other wireless control systems. Research works using WCPS yet with morefocus on civil structural analysis are introduced in [31, 32]
Truetime [7] is a well established control system simulator that enables holistic studies of CPUscheduling, communication and control algorithms. While Truetime supports wirelss networks,its wireless models are relatively simple and do not capture complex properties of wireless sensor
3

networks such as probabilistic and bursty packet receptions and irregular radio properties [18]. Inaddition, Truetime implements wireless models within Simulink. While a native implementationmay improve efficiency, it cannot leverage existing wireless simulators that implement sophisti-cated wireless models.
NCSWT [11] is a recent simulator for wireless cyber-physical systems. Instead of implementingwireless simulations natively, it integrates with the NS-2 simulator with support for wireless net-works. While WCPS shares a similar federated approach to incorporate an existing wireless sim-ulator, we choose to integrate WCPS with TOSSIM [19] which features a more realistic wirelesssensor network model than NS-2. Despite its wide adoption as a network simulator, the wire-less models in NS-2 [11] suffers from being incapable of capturing the probabilistic and irregularpacket receptions that are common in low-power wireless networks. Leveraging noise traces andstatistical models, TOSSIM can capture complex temporal link dynamics that are crucial for re-alistic cyber-physical systems modeling. As the standard TinyOS simulator, TOSSIM has beenwidely used for wireless sensor network research and has been validated in diverse real-world en-vironments [18]. Moreover, the trace-driven simulation approach of TOSSIM enables us to studythe impacts of different wireless environments. We also provide the first set of realistic case studiesbased on real-world wireless traces, as well as a novel scheduling-control co-design approach toWSC.
4

Chapter 3
Wireless Cyber-Physical Simulator
WCPS supports a general wireless control system model shown in Fig. 3.1. A wireless controlsystem consists of a set of wireless sensors, a controller and a set of actuators. The sensors form awireless mesh network connected with a base station hosting the controller. Since the controller isusually located close to the actuators in WSC systems, we assume the base station and actuators areconnected by a wired network whose latency is negligible compared to that in the wireless sensornetwork. Following the centralized network management approach of the WirelessHART stan-dard [28,29], WCPS employs a centralized network manager to compute routing and transmissionschedules for the wireless sensor network.
This chapter describes the design and implementation of WCPS [1].
WCPS employs a federated architecture that integrates (1) Simulink for simulating the physicalsystem (structural) dynamics and the controller and (2) TOSSIM for simulating the wireless sen-sor network. Simulink has been widely used by control and structural engineers to design andstudy structural control systems, while TOSSIM is specifically designed to simulate wireless sen-sor networks based on realistic wireless link models that have been validated in diverse real-worldenvironments [18]. By combining Simulink and TOSSIM, WCPS provides an integrated environ-ment to simulate wireless control systems in a holistic and realistic fashion.
As shown in the architecture illustrated in Fig. 3.1, WCPS simulates the feedback control loopof the control system as follows. Sensor data is generated from structural models. Through across-platform function call from Simulink, sensor data is injected to the corresponding wirelesssensors in TOSSIM. Following the routes and transmission schedule calculated by the networkmanager module, TOSSIM simulates the end-to-end wireless communication of the sensor data
5

Actuator
Actuator
Basestation
Wireless node
Wireless node
Wireless node
Wire
connection
Wire
connection
Figure 3.1: WSC System Model.
packets from the sensors to the base station, and then return the packet delay and loss to theInterfacing Block in Simulink through the Python interface. The Packet Collector module then toextracts packet delivery information(the delay and loss) from the message pool of returned valuesin Simulink. Sensor data and their loss and delay are then provided to the Data Block, which thenfeed the sensor data to the controller at the right time based on the packet delay (if the packetis not lost). WCPS utilizes basic API (e.g., the dos, UNIX command) of MATLAB to do cross-platform function calls. In TOSSIM, we re-implement a printf method in TinyOS to send TOSSIMsimulation results to the Interfacing Block.
User inputs to WCPS includes excitation signals to the structure (e.g., acceleration caused byearthquakes) and wireless traces used as input to TOSSIM. Excitation signal of the structure isprovided to the structure models in the format of MAT files.
The scheduler module calculates transmission schedules. Networking schedule is then deployedinto the MAC layer code of wireless nodes and becomes effective after a TinyOS compilation.The TDMA MAC layer in WCPS is developed based on the MAC Layer Architecture (MLA)library [17] and further adapted for TOSSIM under TinyOS 2.1.1. Received Signal Strength Indi-cation(RSSI) and wireless noises traces are collected from real-world environments and providedto the wireless model [18] used by TOSSIM for realistic wireless network simulations.
6
Structural controller
Packet Collector
Message pool
Cross-platform function call
Python interface
Wireless signal
EarthquakesStructure model
Scheduling
Network Manager
Routing
Wireless noise
Routing layer
TDMA MAC layer
Wireless link model
Routing
Schedule
RSSI
Noise
Excitation
Sensor data
Controlinformation
Sensor data after delay and loss
Return values of function call TOSSIM
Simulink
User Inputs
Sensor data
Data Block
Interfacing Block
Data with SS/UDS decisions
Wireless Network
Figure 3.2: Component architecture of WCPS.
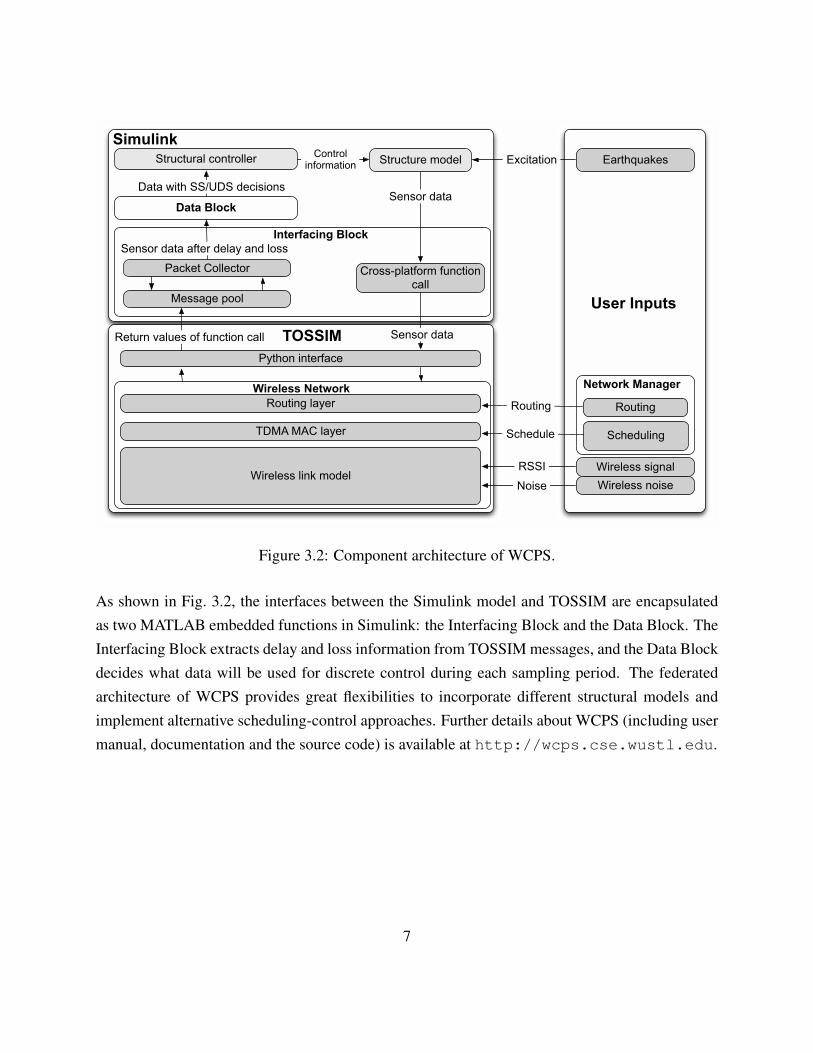
As shown in Fig. 3.2, the interfaces between the Simulink model and TOSSIM are encapsulatedas two MATLAB embedded functions in Simulink: the Interfacing Block and the Data Block. TheInterfacing Block extracts delay and loss information from TOSSIM messages, and the Data Blockdecides what data will be used for discrete control during each sampling period. The federatedarchitecture of WCPS provides great flexibilities to incorporate different structural models andimplement alternative scheduling-control approaches. Further details about WCPS (including usermanual, documentation and the source code) is available at http://wcps.cse.wustl.edu.
7

Chapter 4
Case Study Design
This chapter presents the design of the case studies on wireless control of a three-story buildingand a bridge, respectively.
4.1 Excitation Signal
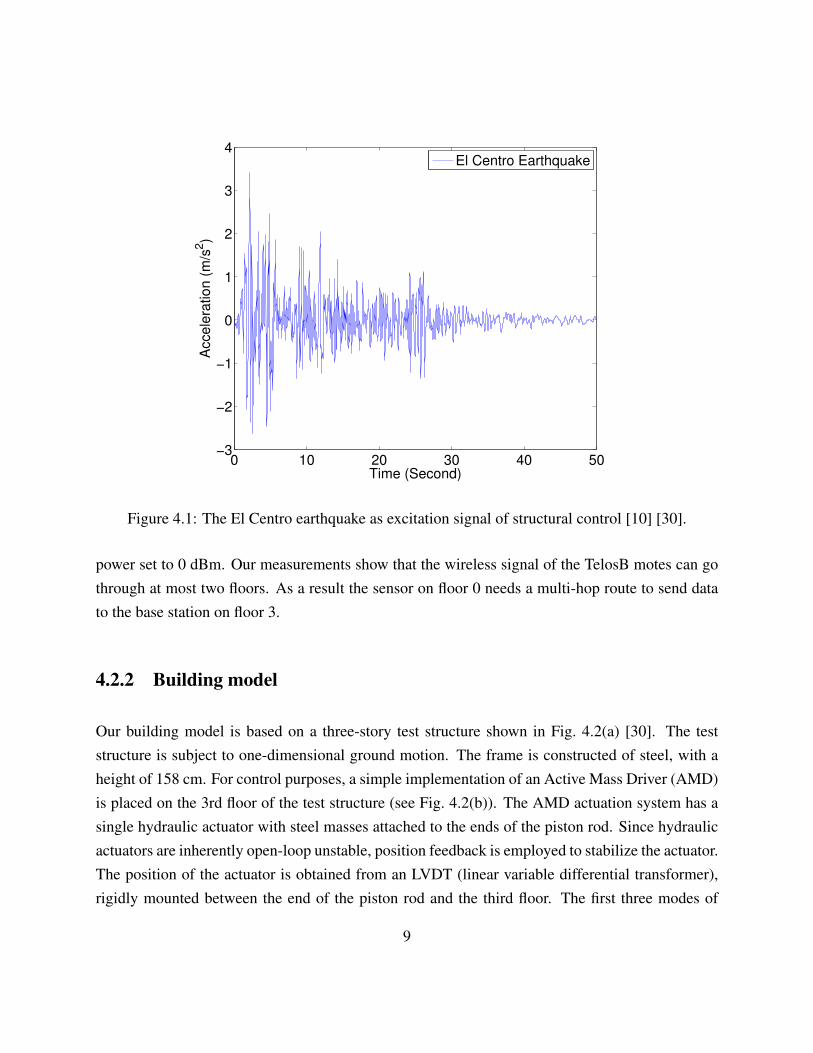
To study structural response to an earthquake, we use measurements from a real earthquake as theexcitation signal in both case studies. As shown in Fig. 4.1 the excitation signal was recorded at theImperial Valley Irrigation District substation in El Centro, California, during the Imperial Valley,California earthquake of May 18, 1940 [10]. The EI Centro earthquake lasted 50 seconds with amaximum acceleration of 3m/s2 at the beginning.
4.2 Design the Building Study
4.2.1 Wireless trace collection
The wireless sensor network in the building design comprises a base station and four distributedsensors. Wireless traces were collected from Bryan Hall of Washington University. The basestation is located on floor 3, and the wireless sensors (TelosB motes [26]) are placed on floor 0,1, 2, and 3, respectively. The sensors record RSSI and noise traces on channel 26 of the IEEE802.15.4 radio. Each TelosB mote is equipped with a Chipcon CC2420 radio with its transmission
8
0 10 20 30 40 50−3
−2
−1
0
1
2
3
4
Time (Second)
Acce
lera
tio
n (
m/s
2)
El Centro Earthquake
Figure 4.1: The El Centro earthquake as excitation signal of structural control [10] [30].
power set to 0 dBm. Our measurements show that the wireless signal of the TelosB motes can gothrough at most two floors. As a result the sensor on floor 0 needs a multi-hop route to send datato the base station on floor 3.
4.2.2 Building model
Our building model is based on a three-story test structure shown in Fig. 4.2(a) [30]. The teststructure is subject to one-dimensional ground motion. The frame is constructed of steel, with aheight of 158 cm. For control purposes, a simple implementation of an Active Mass Driver (AMD)is placed on the 3rd floor of the test structure (see Fig. 4.2(b)). The AMD actuation system has asingle hydraulic actuator with steel masses attached to the ends of the piston rod. Since hydraulicactuators are inherently open-loop unstable, position feedback is employed to stabilize the actuator.The position of the actuator is obtained from an LVDT (linear variable differential transformer),rigidly mounted between the end of the piston rod and the third floor. The first three modes of
9
(a)
(b)
Figure 4.2: Building control system [30]: (a) The 3-story test structure; (b) Active Mass Driveractuation system.
the test structure are 5.81 Hz, 17.68 Hz and 28.53 Hz, with associated damping ratios of 0.33%,0.23%, and 0.30%, respectively [30].
We developed a Simulink model (shown in Fig. 4.3) with reference to the steel test structure ata 1:1 ratio. The Simulink model is designed to simulate a real-world three-story building, withmapping ratios of: force = 1:60, mass = 1:206, displacement = 4:29 and acceleration = 7:2, andtime =1:5. Since the time scales of the Simulink model and a real-world building have a 1:5 ratio,the natural frequencies of the model are approximately five times as large as those of a real-worldbuilding. Previous Simulink implementations of the building model was modeled as a continuoussystem and a time step of 0.0001 second was used to reduce integration errors. In WCPS we
10

YmeaYout
Z Vector toWorkspace
ZOUT_in_r
Ydelay
Unit Delay
1/z
Time Vector to Workspace
TIME
SensorNoises
Saturation SaturationQuantizer2Quantizer1
Mux
Mux
Interfacing Block
ymea
ymea1
ydelay
Tossim_block
Earthquake
ELC_A.MAT
Discrete Controller
y(n)=Cx(n)+Du(n)x(n+1)=Ax(n)+Bu(n)
Demux
Data Block
yout
ydelay
yout_delay delay_block
Command Signal to Workspace
usignal
Clock
Building Model
x’ = Ax+Bu y = Cx+Du
Figure 4.3: Simulink diagram for wireless building control.
further discretize the Simulink model and perform step-by-step simulations with a step length of1 ms, which corresponded to 5 ms in a real-world building. As the network used 10 ms slotsfor TDMA, a slot in the simulated wireless network therefore correspond to two run steps of theSimulink model.
As shown in Fig. 4.3, the structural response signal is first generated by the building model,then converted by the Analog to Digital Converter (ADC) to digital values, and fed to TOSSIM.TOSSIM delivers the sensor data along with its status (loss and delay) to the discrete controller.The output of the controller is then converted from digital values to analog signals by the Digitalto Analog Converter (DAC). Eventually, sensor data with control information are fed back to thebuilding model, which closes the control loop.
4.3 Design the Bridge Study
The bridge study simulates wireless control of the Cape Girardeau bridge in Missouri, USA. Thecable-stayed bridge (see Fig. 4.7(b)) is the Missouri 74 Illinois 146 bridge spanning the Missis-sippi River near Cape Girardeau, Missouri, designed by the HNTB Corporation. Since no wirelesssensors have been deployed on the bridge, we opt to use wireless traces collected from a wireless
11

sensor network deployed on the Jindo bridge [14], South Korea, which shares similar dimen-sions (e.g., tower height and span range) and designs with the Cape Girardeau bridge. The sensorplacement of the Jindo deployment is then mirror mapped onto the Cape Girardeau bridge. Thisapproach takes advantage of the flexibility of WCPS to combine structural models and wirelesstraces from different (but similar) structures for integrated WSC simulations.
Pylon
Sensor
Base
Station
Figure 4.4: Wireless pylon sensor and base station placement on the Jindo bridge.
4.3.1 Wireless trace collection
The Jindo deployment utilizes the MEMSIC Imote2 platform and a total of 113 Imote2 sensornodes with 659 distinct sensor channels. Each node integrates the Imote2, the ISM400 sensorboard, and a rechargeable battery supplied by a solar panel. Combined with the Illinois SHMServices Toolsuite [2], these powerful nodes allow for synchronized data collection, aggregation,
12

First Generation Benchmark Control Problem for Cable−Stayed Bridges
S.J. Dyke, G. Turan, J.M. Caicedo, L.A. Bergan, and S. Hague
yout_d1
Ydelay_d
yout_d
Yout_d
yin_d
Yin_inte
discrete state estimator
y(n)=Cx(n)+Du(n)x(n+1)=Ax(n)+Bu(n)
To Workspace1
ysensor
To Workspace
Ysen_inte
Time
TIME
Sensors
ymys
Saturation1
Saturation
Quantizer1
Quantizer
Mux
MultiportSwitch1
1
2
*, 3
Interfacing Block
ymea
ymea1
ydelay
Tossim_block
Integer Delay1
−1Z
Gain
K*u
mexico.mat
band_noise.mat
elcentro.matEvaluation
Outputs
Ye
Discrete State−Space
y(n)=Cx(n)+Du(n)x(n+1)=Ax(n)+Bu(n)
Device Outputs
Yf
Data Block
yout
ydelay
yout_delay delay_block
Control Devices
u
f
yf
Eqnum
Clock
Bridge Model
Ground Excitation
Sim Outputs
ye
yc
ym
Figure 4.5: Simulink diagram for wireless bridge control.
synthesis and decision-making in real time. The system has successfully captured ambient trafficloading with peak acceleration ranging from less than 5 mg to over 30 mg. Further analysis of thedata resulted in the successful identification of the first twelve modes of vibration on the deck, aswell as tension forces of 10 cables with large tensile stresses [14]. To serve as input to the TOSSIMsimulation, a subset of Imote2 nodes located along deck of the bridge and sensors on the top ofthe pylons are selected for wireless trace collection. With wireless traces collected from the Jindobridge, we are able to build a 58-node routing network in TOSSIM for the Cape Girardeau bridge.
During our wireless trace collection on the Jindo bridge, sensors located on the top of the pylonspose a special case for trace collection. Whereas the sensors on the bridge deck form a connectedgraph, the pylon nodes are isolated. Due to the height of the pylons, these nodes are outside themaximum radio range of the deck nodes. In our Jindo deployment, pylon sensors are fitted withdirectional antennas, which are pointed away from the bridge deck towards a base station, locatedon the nearby Jindo Bridge(see Fig. 4.4). For the purpose of modeling a connected network, thereal link quality measurements between the pylon sensor and base station node are mapped ontoa virtual link in TOSSIM. During the network mapping, as the distances involved in Jindo bridgeand Cape Girardeau bridge are similar and both bridges are in open areas, we assume this networkmapping would correspond closely to a real wireless network setup.
Based on the structural model [10] we select sensor 240 and 353 located on the tow towers of theCape Girardeau bridge, sensors 151 and 185 at the foots of towers and sensor 34 in the mid-spanfor structural control. Acceleration and displacement readings from the five selected sensors aresent to the base station located near sensor 185 using routes with the minimum ETX in the network.
13

0 20 40 60 80 1000
0.2
0.4
0.6
0.8
1
Difference of PRR (%)
CD
F
Figure 4.6: PRR Difference between field measurement and TOSSIM simulation.
To test the accuracy of the TOSSIM simulation, we implement a test application in TOSSIM andcompare the Packet Reception Ratio (PRR) of the simulation with that from the field test in Jindo.Fig. 4.6 plots the Cumulative Distribution Function (CDF) of the PRR difference between the fieldmeasurements and the TOSSIM simulations for all 467 wireless links. Of all the wireless links,over 85% of them have the same PRR in the field measurements and the simulation, indicatingTOSSIM can deliver high fidelity link simulations based on real-world traces.
4.3.2 Bridge model
A high-fidelity Cape Girardeau bridge model (see Fig. 4.7(b)) was incorporated in WCPS forbridge control. A linear evaluation model was used for evaluation of the benchmark bridge model.However, the stiffness matrices used in this linear model are those of the structure determinedthrough a nonlinear static analysis corresponding to the deformed state of the bridge with deadloads. Experimental study indicates that the longitudinal direction of the bridge is most destruc-tive [10].
For control purposes the joints between the tower and the deck are disconnected and replaced bythe control devices. As expected, the frequencies of this model are much lower than those of
14

the nominal bridge model after incorporating the control device. The first ten frequencies of thissecond model are 0.1618, 0.2666, 0.3723, 04545, 0.5015, 0.5650, 0.6187, 0.6486, 0.6965, and0.7094 Hz [10].
(a)
(b)
Figure 4.7: Cape Girardeau model in WCPS: (a) the Cape Girardeau bridge; (b) Simulink modelof the Cape Girardeau bridge [10].
Fig. 4.5 shows the block diagram of the wireless bridge control system. Similar to the buildingcontrol, the structural response of the bridge will go through ADC, a wireless network simulatedin TOSSIM, and a discrete state estimator. The control inputs are converted by DAC to analogsignals sent to the actuator.
15

Chapter 5
Wireless Control Approaches
We implement and compare two alternative control approaches to WSC. Instead of isolating thedesigns of the control algorithm and wireless sensor networks, we study holistic cyber-physicalco-designs that integrate control algorithms and scheduling strategies for data collection, commu-nication and utilization. As a baseline design the first approach integrates a traditional structuralcontrol algorithm called the Sample Controller (SC) [30] and a scheduling strategy that minimizessensing delays. The second approach integrates the Optimal Time Delay Controller (OTDC) [9]and a novel scheduling strategy that lead to uniform sensing delays. Note that both SC and OTDCcontrollers were originally designed for wired structural control. Our work provides the first casestudies of these control algorithms when applied to wireless structural control.
5.1 Sample Controller
SC employs the Linear Quadratic Gaussian (LQG) optimal control algorithm [30]. LQG is acombination of linear quadratic estimator (LQE) and linear quadratic regulator (LQR). The costfunction to be minimized in SC is defined in Equation 5.1, where xr is the reduced states vector, uis the control force, CZ
r and DZr are system matrices for the regulated output vector, and Q and R
are weighting matrices. More details of SC controller can be found in [30] and [10] .
J = limτ→∞
1
τE[∫ τ
0
{(CZr x
r +DZr u)TQ(CZr x
r +DZr u)+ uTRu
}(dt)
](5.1)
16

ControlSensing
DelayData eligible for control use
Sensor1
1 2 3
Sensor 2
Sensor 3
Sensor 4
4->0
3->0
2->0
1->33->0
4 5 6 7 8 9 104->0
3->0
2->0
1->33->0
11
Figure 5.1: Example of baseline SC controller with Sequential Scheduler.
Specifically for SC, we implement a Sequential Scheduler (SS) which schedule one packet eachTDMA time slot. Key data utilization mechanism for SS is to transmit the latest available data.For example, given vector [yx1 , y
x2 , y
x3 , y
x4 ] as the data collected by sensor 1, 2, 3, 4 at the beginning
of slot x, sensor 3 at the beginning of slot 2 (see Fig. 5.1) chooses to transmit y23 instead of y13because y23 is the latest reading. Similarly, sensor 2 chooses to transmit y32 at the starting point ofslot 3 because y32 is the most up-to-date reading. SS makes sure that only latest sensor data is usedfor control, but it also sacrifices sensing synchronizations.
Fig. 5.1 illustrates working mechanism of SC and SS with a four-sensor network example. Sensor1, 2, 3, 4 are located on floor 1, 2, 3, 4 of a building while the base station is located on the 4thfloor. Since sensor 4, 3, and 2 have 1-hop distance to the base station, each needs one time slotto its data to the base station, while sensor 1 needs two because it is two hop away from the basestation. SC control (denoted by dark arrows in Fig. 5.1) starts at the end of slot 1 with data vector[0, 0, 0, y14] as only the first reading (collected in slot 1) of sensor 4 has arrived. By the end of theslot 2, SC computes its control input with [0, 0, y23, y
14] because the second reading (collected in slot
17

2) of sensor 3 has arrived. By the end of slot 3, SC uses [0, y32, y23, y
14] to compute its control input.
The same data vector is used again at the end of slot 4 because no reading from sensor 1 has arrivedyet. By the end of slot 5, SC uses [y41, y
32, y
23, y
14] for control, which completes a communication
cycle from all sensors. Starting from slot 6, another cycle of data collection and control occurusing the same schedule. Intuitively, the combination of SC and SS aims to reduce the delay of thesensor data used for control. Henceforth, we refer to the control scheme combining SC and SS asSC for simplicity.
5.2 Optimal Time Delay Controller
OTDC [9] was originally designed for constant-delay system as shown in Equation 5.2, where l isthe time delay. OTDC is designed to minimize the cost function J by selecting an optimal controlforce pd in Equation 5.3. However, in a wireless sensor network data from different sensors willbe delivered to the controller at different delays. To use OTDC to WSC effectively we design anovel scheduling strategy called the Uniform Delay Scheduler (UDS) that pushes sensor data tothe controller at uniform delays.
ControlSensing
DelayData eligible for control use
Sensor1
1 2 3
Sensor 2
Sensor 3
Sensor 4
4->0
3->0
2->0
1->3 3->0
4 5 6 7 8 9 10 11 12 13 14 15 16 17 18 19 204->0
3->0
2->0
1->3 3->0
Figure 5.2: Example of OTDC-1 with UDS scheduler.
18

z [k + 1] = Az [k] +Bpd [k − l] (5.2)
Fig. 5.2 illustrates the schedule produced by UDS for the same four-sensor example used in thelast subsection. UDS first buffers one batch of data (five readings for each sensor). Afterwards, acycle of five time slots is used to deliver the batched data to the base station. By the end of slot10, OTDC starts with data vector [y11, y
12, y
13, y
14], followed by [y21, y
22, y
23, y
24] in the next time slot,
and [y31, y32, y
33, y
34] in the time slot after. This pattern continues till the end of slot 14. In time slot
15 OTDC starts a new cycle and uses [y61, y62, y
63, y
64] by the end of time slot 15. Under UDS data
from different sensors shares a uniform network delay (10 time slots, or 100 ms in Fig. 5.2). UDStherefore trades one cycle of delay for uniform delays among sensors. This feature makes UDSparticularly suitable for OTDC specifically designed for systems with constant delays. As shownin our case studies this scheduling-control co-design approach leads to an effective WSC system.
J |pd =∞∑k=l
(zTd [k]Qzd (k) + pd
T [k − l]Rpd [k − l])
(5.3)
ControlSensing
DelayData eligible for control use
Sensor1
1 2 3
Sensor 2
Sensor 3
Sensor 4
4->0
3->0
2->0
1->33->0
4 5 6 7 8 9 104->0
3->0
2->0
1->33->0
11 12 13 14 15 16 17 18 19 20 21 22 23 24 254->0
3->0
2->0
1->33->0
4->0
3->0
2->0
1->33->0
Figure 5.3: Example of OTDC-2 with UDS scheduler.
Another challenge introduced by wireless networks is packet loss. Since the basic version of UDSdescribed above schedules only one transmission attempt for each sensor reading, a packet drop
19

means losing one batch of readings (e.g., 5 readings in Fig. 5.2). To deal with packet loss weextend UDS to support multiple transmissions per sensor reading. Henceforth we use OTDC-k todenote a design that integrates OTDC and UDS that transmit each sensor reading k times. Dueto the limited bandwidth of wireless sensor networks, OTDC-k retransmit sensor data from earliercycles by merging them into packets of later cycles. The simple packet-merging mechanism inOTDC-2 avoids costly retransmissions of entire packets (e.g., as in WirlessHART). The number ofbatches that can be merged into a packet merging is limited by the packet payload size, e.g., over100 bytes for IEEE 802.15.4 packets.
For example, in Fig. 5.3, though the batch of data [y11, y21, y
31, y
41, y
51] from sensor 1 may be available
by the end of slot 10, OTDC-2 waits for one more cycle (five time slots) before pushing the sensordata to the controller. At the same time [y11, y
21, y
31, y
41, y
51] is merged with [y61, y
71, y
81, y
91, y
101 ] and
goes through another cycle of network communication. In this way, [y11, y21, y
31, y
41, y
51] are trans-
mitted twice and thus has better chance to be successfully delivered. OTDC-2 therefore tradesadditional network delay for higher reliability, while maintaining uniform delays across sensors.Increasing k in OTDC-k increases network delays while achieving higher reliability.
20

Chapter 6
Results of Case Studies
This section presents the results of the case studies under realistic structural and wireless modelsin WCPS. In both case studies we compare the performance of alternative wireless control ap-proaches, SC and OTDC-1. We also study the tradeoff between delay and data loss by comparingOTDC with different numbers of retransmissions (OTDC-1, OTDC-2 and OTDC-3).
6.1 Wireless Building Control
The building remains stable under all control approaches throughout this case study. To evalu-ate the control performance we use three categories of metrics: resource requirement, structuralresponse, and constraints of the control system. We refer interested readers to [30] for detaileddefinitions of these metrics. We perform simulations using four different wireless control ap-proaches (SC, OTDC-1, OTDC-2, and OTDC-3). Experimental results presented below are from25 simulations for each control approach and each simulation lasts 10,000 control steps.
Fig. 6.1 shows the end-to-end packet delivery ratio of the wireless network. The end-to-end de-livery ratio means the fraction of packets from the sensors that are successfully delivered to thecontroller. As shown in Fig. 6.1 Sensor 1 has the lowest delivery ratio because it has a 2-hop routeto the controller. Recall that OTDC-1 does not perform any retransmission, while OTDC-2 andOTDC-3 performs retransmit each packet once and twice, respectively. Under OTDC-1 Sensors 1and 4 have delivery ratios of 70% and over 95%, respectively. As expected more retransmissionsimprove the deliver ratios of all sensors at the cost of longer delays as described earlier.
21

OTDC−1 OTDC−2 OTDC−3
0.2
0.4
0.6
0.7
0.8
0.9
1
Deliv
ery
Ratio
Sensor 1
OTDC−1 OTDC−2 OTDC−3
0.2
0.4
0.6
0.7
0.8
0.9
1
Deliv
ery
Ratio
Sensor 2
OTDC−1 OTDC−2 OTDC−3
0.2
0.4
0.6
0.7
0.8
0.9
1
Deliv
ery
Ratio
Sensor 3
OTDC−1 OTDC−2 OTDC−3
0.2
0.4
0.6
0.7
0.8
0.9
1
Deliv
ery
Ratio
Sensor4
Figure 6.1: End-to-End Packet Delivery Ratio of Sensors in Building Study
SC OTDC−1 OTDC−2 OTDC−30
0.2
0.4
0.6
0.8
1
1.2
Re
qu
ire
d C
on
tro
l P
ow
er
(a)
SC OTDC−1 OTDC−2 OTDC−30
0.2
0.4
0.6
0.8
1
Re
qu
ire
d F
orc
e M
ag
nitu
de
(b)
Figure 6.2: Required Resource for Wireless Building Control: (a) Required Control Power; (b)Required Force Magnitude.
Fig. 6.2 shows the resource requirement of different control approaches. OTDC-k approaches (seeFig. 6.2(a)) consistently require less control power than SC. As k increases, OTDC-k requiresslightly less control power. Similarly, as shown in Fig. 6.2(b), OTDC-1 reduces control force by80% when compared to SC. The differences in control force among different OTDC-k approachesare negligible. The results that OTDC-1 outperforms SC in both metrics indicate resource require-ments are more sensitive to data synchronization than to sensing delays in this building controlsystem. OTDC-k with larger k results in negligible reduction of control power and force, indicat-ing resource requirements are not sensitive to network reliability in this case study.
The control performance regarding structural response is shown in Fig. 6.3. In term of peak inter-story drift in Fig. 6.3(a), OTDC-k achieves more reduction in inter-story drift than SC. Interest-ingly, higher k in OTDC-k increases peak inter-story drift. Recall a higher k leads to higher
22
SC OTDC−1 OTDC−2 OTDC−30
0.2
0.4
0.6
0.8
1
Pe
ak I
nte
r−sto
ry D
rift
(a)
SC OTDC−1 OTDC−2 OTDC−30
0.2
0.4
0.6
0.8
1
Pe
ak A
cce
lera
tio
n
(b)
Figure 6.3: Structural Response under Wireless Building Control: (a) Peak Inter-story Drift; (b)Peak Acceleration.
communication reliability but longer sensing delay. Inter-story drift is thus more sensitive to sens-ing delays than to data loss in this case study. Similarly, as shown in Fig. 6.3(b), OTDC-3 causesworse peak acceleration than all the other approaches. Hence, building structural responses aremore sensitive to sensing delays than to data loss. In addition, OTDC-1 only slightly outperformsSC, which indicates limited impact of data synchronization on structural response.
SC OTDC−1 OTDC−2 OTDC−30
1
2
3
4
4.5
Actu
ato
r P
ea
k A
cce
lera
tio
n
(a)
SC OTDC−1 OTDC−2 OTDC−30
1
2
3
Actu
ato
r R
MS
Acce
lera
tio
n
(b)
Figure 6.4: System Constraint under Wireless Building Control: (a) Actuator Peak Acceleration;(b) Actuator RMS Acceleration.
The control performance regarding control system constraints is shown in Fig. 6.4. Fig. 6.4(a) and(b) plot the actuator peak acceleration and Root Mean Square(RMS) acceleration, respectively. On
23
both metrics OTDC-k approaches result in smaller actuator accelerations than SC. As k increases,we can see gradual decreases in peak and RMS accelerations, indicating that these metrics are moresensitive to improvement of communication reliability than to longer sensing delays. In addition,the comparison between OTDC-1 and SC shows that the better data synchronization under OTDC-1 has a larger impact than sensing delays.
In summary, we observe complex tradeoffs among data synchronization, sensing delay and com-munication reliability in wireless building control. Overall the OTDC approach combining aconstant-delay control design and a scheduling scheme achieving data synchronization outper-forms the SC approach that minimizes sensing delay without data synchronization. This resulthighlights the efficacy of our control-scheduling co-design approach to wireless control. More-over, the design of the wireless communication protocol involves tradeoff between communicationdelay and data loss, with each having stronger influence on different performance metrics. For ourspecific building study OTDC-1 and OTDC-2 outperforms OTDC-3. The complex tradeoff amongmultiple design aspects confirms the importance of a realistic simulation tool in designing wirelesscontrol systems.
6.2 Wireless Bridge Control
SC OTDC−10
0.2
0.4
0.6
0.8
1
(a)
Ma
xim
um
To
we
r S
he
ar
SC OTDC−10
0.5
1
1.5
(b)
Ma
xim
um
De
ck S
he
ar
Figure 6.5: Maximum Shear Force in Wireless Bridge Control: (a) Maximum Tower Shear; (b)Maximum Deck Shear.
24

SC OTDC−10
0.2
0.4
0.6
0.8
1
(a)
Norm
aliz
ed T
ow
er
Shear
SC OTDC−10
0.5
1
1.5
2
2.5
3
(b)
Norm
aliz
ed D
eck S
hear
Figure 6.6: Normalized Shear Force in Wireless Bridge Control: (a) Normalized Tower Shear; (b)Normalized Deck Shear.
Given the similarities in both the structural and wireless characteristics shared by the Jindo bridgeand the Cape Girardeau bridge, wireless traces collected from the Jindo bridge were used to sim-ulate the wireless sensor network used to control the Cape Girardeau bridge. The longest routingpath is 3-hop. The results presented below are from 25 simulations for each control case andeach simulation lasts 10,000 control steps. To mitigate large delays caused by large amount ofpacket deliveries for multiple sensors, network scheduling in bridge control adopts an in-networkaggregation approach [8] through packet merging.
The bridge network is highly reliable (99% PRR for almost all links with the Jindo trace) dueto the relatively clean wireless environment on the Jindo bridge as well as the fact that the Jindodeployment has line-of-sight sensor placement and strong radio antennas. As such, retransmissionis not needed to achieve reliable communication. Therefore we only present the results of SC andOTDC-1 in this case study.
Since buildings and bridges have distinct structural properties, we adopt three different sets ofmetrics for performance evaluation. The metrics include maximum shear force, normalized shearforce and required control power. We refer interested readers to [10] for the mathematical detailsof the metrics.
25

Fig. 6.5 plots the maximum shear force at the tower and the deck of the bridge. A smaller shearforce is desirable in structural control. SC performs slightly better in reducing the maximum towershear while OTDC-1 performs slightly better for reducing the maximum deck shear, respectively.Fig. 6.6 plots the normalized shear force at the tower and the deck. OTDC-1 slighly outperformsSC for reducing normalized shear force.
SC OTDC−10
0.5
1
1.5
2
2.5
3
3.5
4x 10
−3
(a)
Ma
xim
um
Co
ntr
ol P
ow
er
SC OTDC−10
1
2
3
4
5
x 10−4
(b)
To
tal C
on
tro
l P
ow
er
Figure 6.7: Control Power Requirement Performances for Wireless Bridge Control: (a) MaximumControl Power; (b) Total Control Power.
While OTDC-1 did not show significant advantage over SC in term of shear force, it reduces boththe required maximum control power and the total power requirement by nearly 50% comparedto SC (see Fig. 6.7). This result again demonstrated the effectiveness of the control-schedulingco-design approach adopted by the OTDC design.
26

Chapter 7
Conclusion
Wireless Structural Control (WSC) systems are a representative class of cyber-physical systemsthat have the promise to protect our civil infrastructure in the event of earthquake and other naturaldisasters. To develop WSC systems it is critical to capture both the cyber aspects (wireless commu-nication and control) and the physical aspects (structural dynamics) through realistic and holisticsimulations. We have developed the Wireless Cyber-Physical Simulator (WCPS) that integratesa high-fidelity wireless simulator (TOSSIM) and a standard control system simulator (Simulink).With WCPS, we performed two case studies on structural control systems. Each case study com-bines a realistic structural model and wireless simulations driven by traces collected from real-world deployments. Our case studies leads to three important insights. First, there exist complextradeoffs among data synchronization, sensing delay, and network reliability under realistic wire-less structural control settings. Second, a realistic, integrated wireless control simulator like WCPSis critical in exploring the design tradeoffs in wireless control design. Finally, a control-schedulingco-design approach is effective in wireless control design. In both case studies the integration of acontant-delay control design and a scheduling scheme achieving data synchronization lead to sub-stantial improvement in control performance when compared to a traditional control design. Ourcyber-physical simulation methodology and scheduling-control co-design approaches presented inthis work not only represent a promising step toward smart civil infrastructure, but also provideuseful insights and tools that can be generalized to other cyber-physical systems employing wire-less control. The WCPS tool and the case studies have been released as open source softwareat http://wcps.cse.wustl.edu. The work presented in this thesis has been publishedat [20].
27
References
[1] http://wcps.cse.wustl.edu.
[2] http://shm.cs.uiuc.edu.
[3] J. Araujo, A. Anta, M. Mazo, J. Faria, A. Hernandez, P. Tabuada, and K. Johansson. Self-triggered control over wireless sensor and actuator networks. In DCOSS, 2011.
[4] Jia Bai, Emeka P. Eyisi, Fan Qiu, Yuan Xue, and Xenofon D. Koutsoukos. Optimal cross-layer design of sampling rate adaptation and network scheduling for wireless networked con-trol systems. In ICCPS, 2012.
[5] Girish Baliga, Scott Graham, Lui Sha, and P.R. Kumar. Etherware: Domainware for wire-less control networks. In Proceedings of the 7th IEEE International Symposium on Object-oriented Real-time Distributed Computing, 2004.
[6] Matteo Ceriotti, G. P. Picco, Murphy L. Amy, S. Guna, Michele Corr, Matteo Pozzi, DanieleZonta, and Paolo Zanon. Monitoring heritage buildings with wireless sensor networks: Thetorre aquila deployment. In Proceedings of the 8th ACM/IEEE International Conference onInformation Processing in Sensor Networks (IPSN/SPOTS), San Francisco, CA, USA, 2009.
[7] Anton Cervin, Dan Henriksson, Bo Lincoln, Johan Eker, and Karl-Erik rzn. How does controltiming affect performance? analysis and simulation of timing using jitterbug and truetime.Proceedings of PWC 2003: Personal Wireless Communication, Lecture Notes in ComputerScience, 23(3):16 – 30, June 2003.
[8] Octav Chipara, Chenyang Lu, J.A. Stankovic, and G.-C. Roman. Dynamic conflict-free trans-mission scheduling for sensor network queries. IEEE Transactions on Mobile Computing,10(5):734–748, May 2011.
[9] L.L. Chung, C.C. Lin, and K.H. Lu. Time-delay control of structures. Earthquake Engineer-ing and Structural Dynamics, 24(5):687–701, 1995.
[10] S. Dyke, J. Caicedo, G. Turan, L. Bergman, and S. Hague. Phase I benchmark controlproblem for seismic response of cable-stayed bridges. Journal of Structural Engineering,129(7):857–872, 2003.
28
[11] Emeka Eyisi, Jia Bai, Derek Riley, Jiannian Weng, Yan Wei, Yuan Xue, Xenofon D. Kout-soukos, and Janos Sztipanovits. NCSWT: An integrated modeling and simulation tool fornetworked control systems. In The 15th International Conference on Hybrid Systems: Com-putation and Control (HSCC), 2012.
[12] Gregory Hackmann, Weijun Guo, Guirong Yan, Chenyang Lu, and Shirley Dyke. Cyber-physical codesign of distributed structural health monitoring with wireless sensor networks.In ICCPS, pages 119–128, April 2010.
[13] Gregory Hackmann, Fei Sun, Nestor Castaneda, Chenyang Lu, and Shirley Dyke. A holisticapproach to decentralized structural damage localization using wireless sensor networks. InRTSS, pages 35–46, December 2008.
[14] S. Jang, H. Jo, S. Cho, K. Mechitov, J. Rice, S.-H. Sim, H.-J. Jung, C.-B. Yun, B.F. Spencer,and G. Agha. Structural health monitoring of a cable-stayed bridge using smart sensor tech-nology: deployment and evaluation. Smart Structures and Systems, 6(5):439–460, 2010.
[15] A. Jindal and M. Liu. Networked computing in wireless sensor networks for structural healthmonitoring. In SPIE Symposium on Smart Structures and Materials, Nondestructive Evalua-tions and Health Monitoring, San Diego, CA, March 2011.
[16] Sukun Kim, Shamim Pakzad, David Culler, James Demmel, Gregory Fenves, Steven Glaser,and Martin Turon. Health monitoring of civil infrastructures using wireless sensor networks.In IPSN, 2007.
[17] Kevin Klues, Gregory Hackmann, Octav Chipara, and Chenyang Lu. A component-basedarchitecture for power-efficient media access control in wireless sensor networks. In Sensys,2007.
[18] HyungJune Lee, Alberto Cerpa, and Philip Levis. Improving wireless simulation throughnoise modeling. In IPSN, 2007.
[19] Philip Levis, Nelson Lee, Matt Welsh, and David Culler. TOSSIM: Accurate and ScalableSimulation of Entire TinyOS Applications. In Sensys, 2003.
[20] B Li, Z Sun, K Mechitov, C Lu, D Dyke, G Agha, and B Spencer. Realistic case studiesof wireless structural control. In ACM/IEEE International Conference on Cyber-PhysicalSystems (ICCPS’13), April 2013.
[21] Bo Li, Dan Wang, Feng Wang, and YiQing Ni. High quality sensor placement for struc-tural health monitoring systems: Refocusing on application demands. In Proc. IEEE INFO-COM’10, San Diego, CA, Mar., 2010.
[22] Xuefeng Liu, Jiannong Cao, Wen-Zhan Song, and Shaojie Tang. Distributed sensing forhigh quality structural health monitoring using wireless sensor networks. In The 33rd IEEEReal-Time Systems Symposium (RTSS’12), 2012.
29

[23] J.P. Lynch, Y. Wang, R.A. Swartz, K.-C. Lu, and C.-H. Loh. Implementation of a closed-loop structural control system using wireless sensor networks. Structural Control and HealthMonitoring, 15(4):518–539, 2011.
[24] YiQing Ni, Bo Li, K.H. Lam, Dapeng Zhu, Yang Wang, Jeremy Lynch, and K.H. Law. In-construction vibration monitoring of a super-tall structure using a long-range wireless sensingsystem. Smart Structures and Systems, 7(2):83–102, March 2011.
[25] M. Pajic, S. Sundaram, J. Ny, G. Pappas, and R. Mangharam. Closing the loop: A simpledistributed method for control over wireless networks. In IPSN, 2012.
[26] Joseph Polastre, Robert Szewczyk, and David Culler. Telos: enabling ultra-low power wire-less research. In Proceedings of the 4th international symposium on Information processingin sensor networks, IPSN ’05, Piscataway, NJ, USA, 2005. IEEE Press.
[27] J. Rice, K. Mechitov, S.-H. Sim, B.F. Spencer, and G. Agha. Enabling framework for struc-tural health monitoring using smart sensors. Structural Control and Health Monitoring,15(8):574–587, 2011.
[28] A. Saifullah, P. Tiwari, B. Li, C. Lu, and Y. Chen. Accounting for failures in delay analysis forwirelesshart networks. In Tech. Rep., WUCSE-2012-16, Washington University in St Louis,2012.
[29] Abusayeed Saifullah, You Xu, Chenyang Lu, and Yixin Chen. Real-time scheduling forwirelesshart networks. In RTSS, 2010.
[30] B.F. Spencer, S. Dyke, and H. Deoskar. Benchmark problems in structural control: part i-active mass driver system. Earthquake Engineering and Structural Dynamics, 27(11):1127–1139, 1998.
[31] Zhuoxiong Sun, Bo Li, S.J. Dyke, and Chenyang Lu. Evaluation of performances of struc-tural control benchmark problem with time delays from wireless sensor network. In Proc.EMI/PMC 2012, 2012.
[32] Zhuoxiong Sun, Bo Li, S.J. Dyke, and Chenyang Lu. A novel data utilization and controlstrategy for wireless structural control systems with tdma network. In Proc. ASCE IWCCE2013, 2013.
[33] Y. Wang and K.-H. Law. Structural control with multi-subnet wireless sensing feedback: ex-perimental validation of time-delayed decentralized h control design. Advances in StructuralEngineering,, 14(1):25–39, 2011.
[34] Y. Wang, R.A. Swartz, J.P. Lynch, K.H. Law, and C.-H. Loh. Performance evaluation ofdecentralized wireless sensing and control in civil structures. In Proceedings of SPIE 14thInternational Symposium on Smart Structures and Materials and Nondestructive Evaluationand Health Monitoring, March 2007.
30

Vita
Bo Li
Degrees B. Eng. Electrical Engineering, July 2006M. Eng. Electrical Engineering, July 2008M. Sc. Computer Science, August 2013
Publications A novel data utilization and control strategy for wireless structural controlsystems with TDMA network. Z. Sun, B. Li, S. J. Dyke, and C. Lu.2013 ASCE International Workshop on Computing in Civil Engineering(ASCE IWCCE 2013).
Realistic case studies of wireless structural Control. B. Li, Z. Sun, K.Mechitov, C. Lu, S. J. Dyke, G. Agha, and B. F. Spencer. ACM/IEEEInternational Conference on Cyber-Physical Systems (ICCPS’13), April2013.
Evaluation of performances of structural control benchmark problem withtime delays from wireless sensor network. Z. Sun, B. Li, S. J. Dyke, andC. Lu. in Proc. EMI/PMC 2012, Notre Dame, IN, June 17-20, 2012.
High quality sensor placement for structural health monitoring systems:refocusing on application demands. B. Li, D. Wang, F. Wang, and Y.Q.Ni. in Proc. IEEE INFOCOM’10, San Diego, CA, Mar. 2010.
A high speed DMA transaction method for PCI Express Devices. Y. Peng,B. Li, D. Liu, and X. Peng. in Proc. IEEE Circuits and Systems Interna-tional Conference on Testing and Diagnosis, Chengdu, China, Apr. 2009.
August 2013
31

WCPS and Case Studies on WSC, Bo Li, M.S. 2013