Embed Size (px)
Citation preview

Winning New CustomersStagecoach Group Annual Report and Financial Statements 2011
MEGA
£1VALUETRAVEL
NEWTECHNOLOGY
SMARTINNOVATION
iCUSTOMER
FOCUS

03/04
£m
04/05 05/06 06/07 07/08 08/09 09/10 10/110
10
20
30
40
50
60
70
80
90
Stagecoach Group overview
Stagecoach Group is a leading international public transport company with bus and rail operations in the UK and North America. We employ around 35,000 people and run nearly 13,000 buses and trains.
UK Bus North America
980mjourneys a year
100mvehicle miles a year
250mjourneys a year
23,000 employees
3,800employees
7,200employees
8,100buses and coaches
2,700buses and coaches
2,200train services a day
UK Rail
Note: all figures are approximate.Budget travel
North AmericaUK megabus.comUK megatrain.com
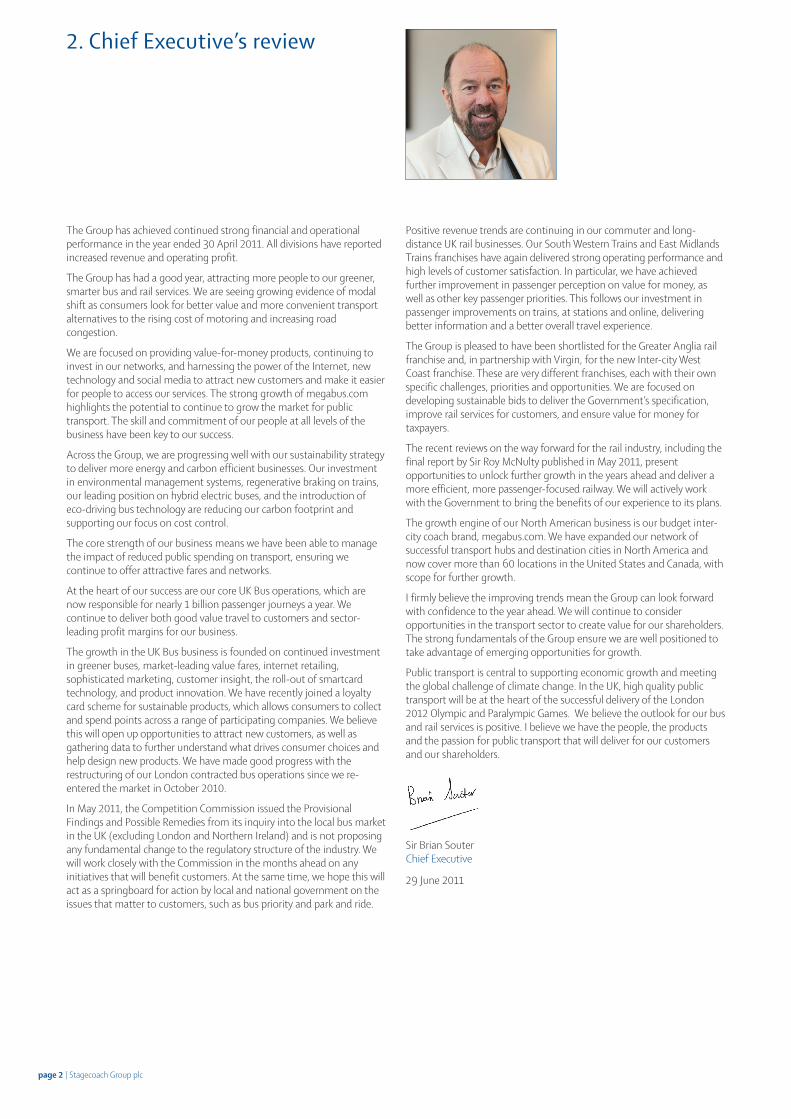
Total megabus.com revenue, 2010-11.
Total megabus.com brand revenues in UK and North America, 2003-04 to 2010-11.
62.2%
33.0%
4.8%
The chart includes all revenues from megabus.com branded services in the UK and North America, including 100% of megabus.com branded services within the Scottish Citylink joint venture.
80
90
95
2008-09 2009-10 2010-11
85
75
80
85
90
Spring 2009 Spring 2010 Spring 2011
Operational performanceUK rail punctuality South Western Trains
East Midlands TrainsVirgin TrainsNational Rail
Source: Network Rail, Public Performance Measure Moving Annual Average.
Customer serviceUK rail customer satisfaction
Source: National Passenger Survey, Spring Wave, 2009, 2010, 2011.
Note: figures used refer to the measure of train punctuality – also known as PPM (public performance measure) – which is commonly used throughout Europe. For long distance operators, such as East Midlands Trains and Virgin Trains, this shows the percentage of trains arriving within 10 minutes of timetabled arrival at final destination. London and South East operators (including South Western Trains), and regional operators show the percentage arriving within five minutes of the timetabled arrival. Data covers the period 1 April 2008 to 31 March 2011. National Rail average is for all franchised train operating companies.
Note: data extracted from National Passenger Survey, Spring Wave, 2009, 2010 and 2011. Percentages are for overall satisfaction. The National Passenger Survey (NPS) is conducted twice a year from a representative sample of passenger journeys across the UK. It surveys passengers’ overall satisfaction and satisfaction with 30 individual aspects of service for each individual train operating company (TOC). Passenger ratings are totalled for all TOCs across the country to provide a National Rail average.
South Western TrainsEast Midlands TrainsVirgin TrainsNational Rail

00%
00%00%
00%
00%
00%00%
00%
157.7%
-5.2%
-4.3%
-35.0%
3.9%
39.6%
Stagecoach Group
National Express
First Group
FTSE 350 Travel and Leisure
Go-Ahead
FTSE 250
Highlights
Financial overviewGroup revenue
UK Bus regionsUK Bus LondonUK RailNorth America
Operating profit
UK RailNorth AmericaOther (incl JVs)
Adjusted earnings per share
11
10
09
08
07
23.8p
18.7p
22.9p
20.3p
11.7p
11
10
09
08
07
7.1p
6.5p
6.0p
5.4p
4.1p
Dividend per ordinary share
Notes 1. Group revenue: Revenue is for the year ended 30 April 2011, excluding joint ventures. See Note 2 to the
consolidated financial statements. 2. Operating profit: The chart shows the breakdown of total operating profit for the year ended 30 April 2011,
excluding intangible asset expenses and exceptional items.UK Bus (London) reported an operating loss of £5.9m for the year ended 30 April 2011, and is excluded from the chart. See Note 2 to the consolidated financial statements.
3. Adjusted earnings per share: See Note 10 to the consolidated financial statements. 4. Dividend per ordinary share: See Note 9 to the consolidated financial statements. 5. Total shareholder return: The graph compares the performance of the Stagecoach Group Total Shareholder Return
(‘TSR’) (share value movement plus reinvested dividends) over the 5 years to 30 April 2011 compared with that of First Group, Go-Ahead, National Express, the FTSE Travel and Leisure All-Share Index, and the FTSE 250 Index.
Total shareholder return
UK Bus regions
37.3%62.2%19.7%
7.8%
10.3%
5.6%
44.8%
12.3%
78189_Front FINAL_78189_StCchV10_FRONT 05/07/2011 11:38 Page 1

Contents1 Chairman’s statement 2 Chief Executive’s review 3 Operating and Financial Review 18 Directors’ biographies 20 Directors’ report 24 Corporate governance report 29 Audit Committee report 30 Nomination Committee report 31 Health, Safety and Environmental
Committee report
32 Directors’ remuneration report 39 Responsibility statement 40 Group independent auditors’ report 41 Consolidated financial statements 46 Notes to the consolidated financial
statements 102 Company independent auditors’ report 103 Company financial statements 104 Notes to the Company financial statements 109 Shareholder information 110 Five year financial summary
STAGECOACH GROUP PLC Company No. SC100764 YEAR ENDED 30 APRIL 2011
Financial summary Results excluding intangible asset expenses and exceptional items* Reported results
Year ended 30 April 2011 2010 2011 2010
Revenue (£m) 2,398.8 2,164.4 2,398.8 2,164.4
Total operating profit (£m) 240.2 192.0 225.0 179.1
Non-operating exceptional items (£m) – – 0.7 (2.0)
Net finance costs (£m) (34.5) (30.7) (34.5) (51.2)
Profit before taxation from continuing operations (£m) 205.7 161.3 191.2 125.9
Discontinued operations (£m) – – 18.5 3.9
Profit before taxation (£m) 205.7 161.3 209.7 129.8
Earnings per share (pence) 23.8p 18.7p 24.6p 15.6p
Proposed final dividend (pence) 4.9p – 4.9p –
Full year dividend (pence) 7.1p 6.5p 7.1p 6.5p
*See definitions in Note 36 to the consolidated financial statements.
Stagecoach Group plc | page 2
78189_Front FINAL_78189_StCchV10_FRONT 05/07/2011 11:38 Page 2

I am delighted to report that the Group has continued its goodperformance. We have achieved revenue growth in all of ourdivisions in the UK and North America as a result of our focus onsafe, good value, high quality bus and rail travel.
The Group’s success is underpinned by the quality and breadth ofits management team, which as well as reducing costs inresponding to changing circumstances has continued to pursuenew opportunities whether those be new, fast-growing servicessuch as megabus.com or acquisitions such as the October 2010purchase of the under-performing East London bus business. Atthe same time, management has maintained a focus on strongoperational delivery and customer satisfaction.
We took forward-looking decisions during the economicdownturn to continue to invest heavily in our services, and tomaintain our focus on operational performance, customerservice and offering value-for-money travel options to ourpassengers. This has supported organic growth across ourtransport operations as economic conditions have improved.
Positive trends in the first half of the year have continued andthe Group has achieved good revenue and profit growth in thefull year. Revenue for the year to 30 April 2011 was £2,389.8m(2010: £2,164.4m). Total operating profit (before intangibleasset expenses and exceptional items) was up 25.1% at £240.2m(2010: £192.0m), reflecting increased profit in all divisions.Earnings per share before intangible asset expenses andexceptional items were 27.3% higher at 23.8p (2010: 18.7p).
In line with the Group’s good performance, the Directors haveproposed a final dividend of 4.9p per share, giving a totaldividend per share for the year up 9.2% at 7.1p (2010: 6.5p). Theproposed final dividend is payable to shareholders on the registerat 2 September 2011 and will be paid on 5 October 2011.
The Group is well funded and its net debt has reduced during theyear ended 30 April 2011. This is a further tangible sign of theGroup's success. We are completing our review of the Group'scapital structure and we expect to announce the conclusions ofour review at or before the Group's Annual General Meeting atthe end of August 2011.
Stagecoach has made a good start to the financial year ending30 April 2012 and current trading remains in line with ourexpectations.
I would like to pay tribute to our former Chairman, Bob Speirs,who retired from the Board on 31 December 2010 after almost16 years as a director. His insight, experience and wise advicehave been invaluable to the business and I would like to extendto him the gratitude and best wishes of the Board for the future.
In May 2011, Will Whitehorn joined the Board as a non-executivedirector of the Company. His background in brand development,together with his wide-ranging experience across a range ofbusiness sectors will bring valuable insight as we look to expandthe reach of our products and services.
On behalf of the Board, I would like to congratulate Sir BrianSouter, the Group's Chief Executive, on being awarded aknighthood in the recent Queen's Birthday honours list for hisservice to transport and the voluntary sector.
Political support and the environment for public transport arestrong, and the Group is in a good position to benefit fromsignificant opportunities ahead. Our employees, who serve themillions of customers we welcome on board our bus and railservices every day, are a key part of our success and are critical toour future. I would like to thank them for their strongcontribution over the past year and I am confident the Group willcontinue to deliver for our customers and shareholders.
Sir George MathewsonChairman
29 June 2011
Stagecoach Group plc | page 1
1. Chairman’s statement
* Exceptional items are defined in note 4 to the consolidated financial statements on page 58 of this Annual Report
78189_Front FINAL_78189_StCchV10_FRONT 05/07/2011 11:38 Page 1
The Group has achieved continued strong financial and operationalperformance in the year ended 30 April 2011. All divisions have reportedincreased revenue and operating profit.
The Group has had a good year, attracting more people to our greener,smarter bus and rail services. We are seeing growing evidence of modalshift as consumers look for better value and more convenient transportalternatives to the rising cost of motoring and increasing roadcongestion.
We are focused on providing value-for-money products, continuing toinvest in our networks, and harnessing the power of the Internet, newtechnology and social media to attract new customers and make it easierfor people to access our services. The strong growth of megabus.comhighlights the potential to continue to grow the market for publictransport. The skill and commitment of our people at all levels of thebusiness have been key to our success.
Across the Group, we are progressing well with our sustainability strategyto deliver more energy and carbon efficient businesses. Our investmentin environmental management systems, regenerative braking on trains,our leading position on hybrid electric buses, and the introduction ofeco-driving bus technology are reducing our carbon footprint andsupporting our focus on cost control.
The core strength of our business means we have been able to managethe impact of reduced public spending on transport, ensuring wecontinue to offer attractive fares and networks.
At the heart of our success are our core UK Bus operations, which arenow responsible for nearly 1 billion passenger journeys a year. Wecontinue to deliver both good value travel to customers and sector-leading profit margins for our business.
The growth in the UK Bus business is founded on continued investmentin greener buses, market-leading value fares, internet retailing,sophisticated marketing, customer insight, the roll-out of smartcardtechnology, and product innovation. We have recently joined a loyaltycard scheme for sustainable products, which allows consumers to collectand spend points across a range of participating companies. We believethis will open up opportunities to attract new customers, as well asgathering data to further understand what drives consumer choices andhelp design new products. We have made good progress with therestructuring of our London contracted bus operations since we re-entered the market in October 2010.
In May 2011, the Competition Commission issued the ProvisionalFindings and Possible Remedies from its inquiry into the local bus marketin the UK (excluding London and Northern Ireland) and is not proposingany fundamental change to the regulatory structure of the industry. Wewill work closely with the Commission in the months ahead on anyinitiatives that will benefit customers. At the same time, we hope this willact as a springboard for action by local and national government on theissues that matter to customers, such as bus priority and park and ride.
Positive revenue trends are continuing in our commuter and long-distance UK rail businesses. Our South Western Trains and East MidlandsTrains franchises have again delivered strong operating performance andhigh levels of customer satisfaction. In particular, we have achievedfurther improvement in passenger perception on value for money, aswell as other key passenger priorities. This follows our investment inpassenger improvements on trains, at stations and online, deliveringbetter information and a better overall travel experience.
The Group is pleased to have been shortlisted for the Greater Anglia railfranchise and, in partnership with Virgin, for the new Inter-city WestCoast franchise. These are very different franchises, each with their ownspecific challenges, priorities and opportunities. We are focused ondeveloping sustainable bids to deliver the Government’s specification,improve rail services for customers, and ensure value for money fortaxpayers.
The recent reviews on the way forward for the rail industry, including thefinal report by Sir Roy McNulty published in May 2011, presentopportunities to unlock further growth in the years ahead and deliver amore efficient, more passenger-focused railway. We will actively workwith the Government to bring the benefits of our experience to its plans.
The growth engine of our North American business is our budget inter-city coach brand, megabus.com. We have expanded our network ofsuccessful transport hubs and destination cities in North America andnow cover more than 60 locations in the United States and Canada, withscope for further growth.
I firmly believe the improving trends mean the Group can look forwardwith confidence to the year ahead. We will continue to consideropportunities in the transport sector to create value for our shareholders.The strong fundamentals of the Group ensure we are well positioned totake advantage of emerging opportunities for growth.
Public transport is central to supporting economic growth and meetingthe global challenge of climate change. In the UK, high quality publictransport will be at the heart of the successful delivery of the London2012 Olympic and Paralympic Games. We believe the outlook for our busand rail services is positive. I believe we have the people, the productsand the passion for public transport that will deliver for our customersand our shareholders.
Sir Brian SouterChief Executive
29 June 2011
page 2 | Stagecoach Group plc
2. Chief Executive’s review
78189_Front FINAL_78189_StCchV10_FRONT 05/07/2011 11:38 Page 2

3. Operating and Financial Review
3.1 IntroductionThe Directors are pleased to present their report on the Group for the yearended 30 April 2011.This section 3 contains the Operating and Financial Review, which includesthe information that the Group is required to produce to meet the need for abusiness review in accordance with the Companies Act 2006. The Operatingand Financial Review also provides significant information over and abovethe statutory minimum. Biographies of each director are contained in section4 of this Annual Report and the remainder of the Directors’ report is set outin section 5.The Operating and Financial Review that follows is intended largely to reflectthe recommendations of the Accounting Standards Board’s reportingstatement of best practice on the Operating and Financial Review.
3.2 Cautionary statementThe Operating and Financial Review has been prepared for the shareholders ofthe Company, as a body, and no other persons. Its purpose is to assistshareholders of the Company to assess the strategies adopted by the Companyand the potential for those strategies to succeed and for no other purpose.This Operating and Financial Review contains forward-looking statements thatare subject to risk factors associated with, amongst other things, the economicand business circumstances occurring from time to time in the countries,sectors and markets in which the Group operates. It is believed that theexpectations reflected in these statements are reasonable but they may beaffected by a wide range of variables which could cause actual results to differmaterially from those currently anticipated. No assurances can be given thatthe forward-looking statements in this Operating and Financial Review will berealised. The forward-looking statements reflect the knowledge andinformation available at the date of preparation.
3.3 Description of the businessStagecoach Group is a leading international public transportation group, withextensive operations in the UK, United States and Canada. The Group employsaround 34,000 people, and operates bus, coach, train and tram services. TheGroup has four main divisions – UK Bus (regional operations), UK Bus(London), North America and UK Rail.Stagecoach Group plc is a public limited company that is incorporated,domiciled and has its registered office in Scotland. Its ordinary shares arepublicly traded and it is not under the control of any single shareholder.Throughout this Annual Report, Stagecoach Group plc is referred to as “theCompany” and the group headed by it is referred to as “Stagecoach” and/or“the Group”.
3.3.1 UK Bus (regional operations)Our UK Bus (regional operations) division connects communities in more than100 towns and cities across the UK on networks stretching from the Highlandsof Scotland to south west England. These include major city bus operations inLiverpool, Newcastle, Hull, Manchester, Oxford, Sheffield, Cambridge andExeter.The current structure of the bus market in Great Britain (outside London) wasestablished by the Transport Act 1985. This is essentially a deregulatedstructure: any holder of a Public Service Vehicle operator’s license may operatebus services, having first registered various details with the relevant trafficcommissioner. The traffic commissioners are responsible for enforcingcompliance with these registered details, including standards of maintenance,reliability and punctuality.Our UK Bus (regional operations) division operates a fleet of around 7,000buses and coaches across a number of regional operating units. Each regionaloperating unit is managed independently and is led by a managing director,reporting directly to the head of the UK Bus division.In addition to local bus services in towns and cities, Stagecoach operatesexpress interurban services linking major towns within its regional operatingcompany areas. The Group also runs the budget inter-city coach service,megabus.com.Stagecoach’s bus and coach services in the UK are operated on a commercialbasis in a largely deregulated market. We also operate tendered services,including schools contracts, on behalf of local authorities. Around 11% of theUK Bus (regional operations) division’s revenue is receivable from localauthorities in respect of such tendered and school services. Around 26% of theUK Bus (regional operations) division’s revenue is earned from concessionaryfare schemes, whereby the Group is reimbursed by public authorities forcarrying the elderly and disabled free of charge.
3.3.2 UK Bus (London)We are the third largest operator in the London bus market, with an estimated15% share of that market. The UK Bus (London) business operates busservices under contract to Transport for London, receiving a fixed fee (subject
to adjustment for certain inflation indices) and taking the cost and capital risk.The business operates from 10 depots and has a fleet of around 1,250 busesserving routes in and around east and south-east London.
3.3.3 North AmericaThe Group provides transport services in North America. Our businessesinclude commuter/transit services, inter-city services, tour and charter,sightseeing and school bus operations.The North America business is headed by a Chief Operating Officer.Stagecoach (excluding its joint ventures) operates approximately 2,700vehicles in the United States and Canada where our operations are mainly inthe states of New York, New Jersey, Pennsylvania, West Virginia, Ohio, Indiana,Illinois and Wisconsin and the provinces of Quebec and Ontario. Our servicesoperate in major cities such as New York City, Newark, Pittsburgh, Chicago andMilwaukee.megabus.com operates budget inter-city coach services in North America andrepresents a growing proportion of the Division’s revenue.
3.3.4 UK Rail Stagecoach Group has major rail operations in the UK. The UK train operatingmarket is split into a number of separate franchises, which are awarded by theGovernment for set time periods to a specification set by the Department forTransport (“DfT”) on the basis of competitive bids. Train operating companiesoperate passenger trains on the UK rail network. The UK railway infrastructureis owned and operated by Network Rail, a “not for dividend” company thatinvests any profits into improving the railway. Network Rail runs, maintainsand develops tracks, signalling systems, bridges, tunnels, level crossings andkey stations.
Our principal wholly owned rail businesses are South Western Trains and EastMidlands Trains. South Western Trains incorporates the South West Trains andIsland Line networks. South West Trains runs around 1,700 train services a dayin south west England out of London Waterloo railway station, while IslandLine operates on the Isle of Wight. The South Western franchise is expected torun until February 2017. From 11 November 2007, we have operated the EastMidlands Trains franchise. The franchise comprises main line train servicesrunning to London St Pancras, regional rail services in the East Midlands areaand inter-regional services between Norwich and Liverpool. The East MidlandsTrains franchise is expected to run until 31 March 2015. We also operateSupertram, a 28km light rail network incorporating three routes in the city ofSheffield, on a concession running until 2024. In May 2007, we signed acontract with Greater Manchester Passenger Transport Executive (“GMPTE”) tooperate and maintain the Manchester Metrolink tram network andcommenced operations under the 10-year contract in July 2007.
South Western Trains, East Midlands Trains and the tram operations each havea managing director.
3.3.5 Joint Ventures3.3.5.1 Virgin Rail GroupStagecoach Group has a 49% shareholding in Virgin Rail Group, whichoperates the West Coast Trains rail franchise. The current West Coast Trainsrail franchise runs until March 2012. The other shareholder in Virgin RailGroup is the Virgin Group of Companies.
Stagecoach’s Group Finance Director is Joint Chairman of Virgin Rail Group.Virgin Rail Group has a Chief Executive, who reports to the Virgin Rail Groupboard, which includes Stagecoach Group and Virgin Group representatives.
3.3.5.2 Scottish Citylink Coaches LimitedIn Scotland, Stagecoach has a joint venture (Scottish Citylink CoachesLimited) with international transport group, ComfortDelGro, to operatemegabus.com and Scottish Citylink coach services. Stagecoach owns 35% ofthe share capital of Scottish Citylink Coaches Limited and ComfortDelGroowns the remaining 65%. The joint venture is the leading provider of expresscoach services in Scotland. Stagecoach is responsible for the day-to-dayoperational management of the business, which is overseen by a joint board.
3.3.5.3 New York Splash ToursIn North America, Stagecoach has a joint venture, New York Splash Tours LLC,with Port Imperial Duck Charters LLC. Splash Tours ceased operations inMarch 2010.
3.3.5.4 Twin AmericaIn North America, Stagecoach began operating a joint venture, Twin AmericaLLC, with CitySights NY on 31 March 2009. The joint venture operatessightseeing services in New York under both the Gray Line and CitySightsbrands. The Group holds 60% of the economic rights and 50% of the votingrights in the joint venture. Twin America LLC is headed by a Chief Executiveand overseen by a joint Board.
Stagecoach Group plc | page 3
78189_Front FINAL_78189_StCchV10_FRONT 05/07/2011 11:38 Page 3

Operating and Financial Review
3.4 Resources and relationships3.4.1 ResourcesStagecoach Group has a range of resources that underpin its business andsupport its strategy. These assist in giving the Group a competitive advantagein the markets in which it operates. 3.4.1.1 EmployeesStagecoach Group’s most important resource is its employees. We seek torecruit and retain the best employees in our sector, offering an excellentpackage of benefits, which allows us to deliver good customer service to ourpassengers. The Group’s individual divisions invest significantly in the trainingand development of our people and we operate a successful graduate trainingscheme which provides one source of training for the managers of the future.We also encourage our people to give something back to their localcommunity and many are regularly involved in fundraising, payroll giving andin-kind support to a wide range of good causes. Further information about ourcommitment to corporate social responsibility is set out on pages 16 and 17.3.4.1.2 Market researchAn important element of the Group’s success in growing its customer baselies in a track record of product innovation and new ideas on developingeffective public transport systems. The Group has an ongoing programme ofmarket research. We have a dedicated telemarketing unit in the UK thatcommunicates with current customers and non-users to build a detailedprofile of what attracts people to use our services.3.4.1.3 Corporate reputation, brand strength, and market positionStagecoach is one of the best-known public transport operators in the UK and isconsistently rated highly for the quality of its services in research by Governmentand other independent organisations. We value our reputation, both as a publictransport provider and as a key part of the communities in which we operate.Stagecoach has a strong set of brands that support our strategy of organicgrowth in our business and that help maintain our leading market position.3.4.1.4 Natural resources and manufacturing technologyOperating our bus and rail services requires considerable use of naturalresources, including diesel and electricity. We have arrangements in place toensure that these resources are sourced as efficiently as possible and that oursupplies are maintained to ensure the smooth functioning of our business. Anumber of experienced manufacturers supply our buses, coaches, trains andtrams, which are produced to detailed specifications relevant to the individualmarkets in which they are required.3.4.1.5 LicencesVarious licences are held by Stagecoach giving authority to operate our publictransport services and these are maintained up to date as required.
3.4.2 Contractual and other relationshipsStagecoach Group works closely with a range of bodies in each of the marketswhere we provide public transport services. Our stakeholders include:• Our People – we have established strong working relationships with trade
unions and work in partnership with them on a range of issues, includingtraining and development, occupational health matters, pensions and otheremployee benefits. We also communicate with our people face to face andthrough a number of internal publications.
• Investors and the Financial Community – our shareholders and lenders arecritical to our business success. We have a regular programme of meetingswith investors and provide frequent updates to the markets and financialcommunity on our performance. We are a constituent of the FTSE4Goodindex, which sets standards and tracks the performance of the leadingsocially responsible companies around the globe.
• Customers – millions of people use our services every day. We conductextensive customer research to monitor our performance and to determinehow we can improve the delivery and accessibility of our services.
• Customer Interest Groups – our businesses have a regular and ongoingdialogue with bus and rail user groups. This includes presentations frommanagers on detailed aspects of our service as well as consultation andinformation sharing on particular issues.
• Government – our managers have an ongoing dialogue with national andlocal government in all our countries of operation to ensure the effectivedelivery of government transport policy and to assist in meeting widerobjectives. In the UK, we work closely with the DfT, the Scottish Executive,Transport Scotland, the Welsh Assembly, and Transport for London (“TfL”).
• Transport Authorities – we work closely with local authorities, includingpassenger transport executives, regional transport committees and transitauthorities, in the delivery and planning of bus and rail services. Many of ourbusinesses have partnership agreements in place to improve the delivery ofpublic transport in their areas.
• Government Advisory Bodies and Lobbying Groups – we have constructivedialogue with organisations such as the Commission for IntegratedTransport, which provides advice to the UK Government, and lobbyinggroups such as the Campaign for Better Transport.
• Transport and Industry Representation Groups – we are active members ofindustry groups, such as the Confederation of Passenger Transport UK
(which covers buses and light rail), the Association of Train OperatingCompanies and the American Bus Association.
• Suppliers – we rely on a range of suppliers to provide goods and serviceslinked to our bus and rail operations. These include vehicle and rolling stockmanufacturers, fuel suppliers, IT companies and clothing manufacturers.
We have contractual relationships with a number of parties which are essentialto the business of the Group, including:• The operation of our rail franchises depends upon a number of contractual
relationships, the most critical of which include: contracts with the DfTgoverning the terms of the franchises; contracts with Network Railgoverning station and track access arrangements; leases with rolling stockcompanies for the lease of trains and; maintenance contracts for themaintenance of trains.
• All of our businesses have various contractual relationships includingpurchase contracts with fuel suppliers, vehicle suppliers, IT companies andspare part suppliers.
• We have contracts with local authorities, government bodies and otherparties for the supply of bus services on a contracted or tendered basis.
• We have contractual arrangements with banks and other finance providersfor the provision of funds and financial products to the Group.
We are committed to conducting business in a socially responsible way and webelieve this to be consistent with our business objectives and strategy. Indeed,by taking a responsible approach towards the environment and the widercommunity, we believe we will enhance our objective to deliver organic growth.
3.5 Group business objectives and long-termstrategy
3.5.1 Business objectives and long-term strategyThe key elements of Stagecoach Group’s business strategy to deliver long-termshareholder value are:• To deliver organic growth across all of the Group’s operations;• To acquire businesses that are complementary to the Group’s existing
operations, in areas where the Group’s management has proven expertiseand which offer prospective returns on capital in excess of the Group’sweighted average cost of capital;
• In addition to organic and acquisition growth, to maintain and grow theGroup’s Rail business by bidding for selected rail franchises and to seek tosecure new franchises where the risk/return trade-off is acceptable.
A fundamental objective underlying this strategy is the continued provision ofsafe and reliable services to passengers.Stagecoach Group has demonstrated particular strength in managing bus andcoach businesses that operate scheduled services in a relatively deregulatedenvironment, although it also operates more regulated bus services where itbelieves it can deliver good returns for shareholders. The Group’s focus is onoperations with critical mass in their own local markets. In rail, Stagecoach’s skillcentres on organic revenue and passenger volume growth, the management ofsignificant change projects, the delivery of improved operational performance,and driving up customer satisfaction.Our overall business strategy is supported by a financial strategy whereby weseek to maintain a long-term efficient capital structure.
3.5.2 Business modelThe Group’s business model varies to some extent by division. The businessmodel is intended to deliver the business objectives and long-term strategyexplained above in that it is designed to add value through organic growth,targeted acquisitions and rail franchise wins. The overall model of the Group isbased on a relatively decentralised management structure with short chains ofcommand and close monitoring and direction from the centre. Across theGroup, there is an emphasis on achieving strong operational performance asan underpin of strong financial performance.The business model for the Group’s UK Bus (regional operations) and NorthAmerica Divisions is designed to be sufficiently flexible to respond todevelopments in the markets in which they operate and to changes indemand. The key features of this business model are:
• A decentralised management structure enabling local managementto quickly identify and respond to developments in each local market;
• An emphasis on lightly regulated bus operations enablingmanagement to vary prices, operating schedules and timetables inresponse to developments in each local market without significanthindrance from regulation;
• A flexible cost base whereby operating mileage and operating costscan be flexed in response to changes in demand.
The business model of the UK Bus (London) and UK Rail Divisions is different.The businesses are more highly regulated and their cost base is less flexible sothere is greater management focus on agreeing the right contractualarrangements, including appropriate risk-sharing arrangements, and ensuringthese are appropriately managed for the duration of each contract.
page 4 | Stagecoach Group plc
78189_Front FINAL_78189_StCchV10_FRONT 05/07/2011 11:38 Page 4

3.5.3.3 Organic growthA key element underpinning the Group’s strategy is to deliver organic growth in revenue. Organic growth KPIs are not reported for businesses acquired ordisposed of in the year. The following measures of organic growth are monitored in respect of three of the Group’s divisions:
• UK Bus (regional operations) – growth in passenger journeys measured as the percentage increase in the number of passenger journeys relative to theequivalent period in the previous year.
• Rail – growth in passenger miles measured as the percentage increase in the number of miles travelled by passengers relative to the equivalent period in theprevious year.
• North America – growth in constant currency revenue from continuing operations measured as the percentage increase in revenue relative to the equivalentperiod in the previous year.
The measures vary by division reflecting differences in the underlying businesses – for example, a significant proportion of the revenue in North America is notdetermined on a “per passenger” basis.
Throughout this Annual Report, references to passenger volume growth for UK Bus or Rail businesses mean growth determined on the basis set out here.
All of these growth KPIs involve a degree of estimation in respect of passenger volumes and are normalised to exclude businesses that have not been held bythe Group for the whole of both periods.
Adjusted EPS was as follows:
Stagecoach Group plc | page 5
Adjusted EPS To increase in excess of inflation 23.8p 18.7p 22.9p
Year ended 30 April
2011 2010 2009pence pence penceTarget
UK Bus (regional operations) – number of blameworthy accidents per 1 million miles travelled 21.4 21.9 see below
US – number of blameworthy accidents per To decrease each year – 1 million miles travelled ultimate target is zero 7.3 8.8 9.3
South West Trains – workforce lost time injuries per 1,000 staff 1.8 2.0 1.7
East Midlands Trains – workforce lost time injuriesper 1,000 staff 1.5 1.6 2.6
Virgin Rail Group – West Coast – workforce lost timeinjuries per 1,000 staff 2.1 1.9 1.6
Year ended Year ended Year ended30 April 2011 30 April 2010 30 April 2009Target
3.5.3.1 SafetyThe safety of our passengers, staff and others is our first priority. Safety is monitored in various ways, including through a range of KPIs. Businesses acquired ordisposed of in the year are excluded from the safety KPIs.
3.5.3.2 ProfitabilityThe Group seeks to increase long-term value to its shareholders. While the Group aims to take a long-term perspective on shareholder value, it also monitorsthe financial performance of each of its businesses in the shorter term. For the Group as a whole, the key measure of short-term financial performance isearnings per share before exceptional items and intangible asset expenses (“Adjusted EPS”). Adjusted EPS is calculated based on the profit attributable to equityshareholders (adjusted to exclude exceptional items and intangible asset expenses) divided by the weighted average number of ordinary shares ranking fordividend during the relevant period.
Five of the more important safety KPI’s are reported below:
To decrease each year –ultimate target is zero
Due to development of our safety reporting systems to standardise and enhance the reporting of safety indicators, certain KPIs are not presented above as theywould not be comparable to later years.
3.5.3 Key Performance IndicatorsThe Group uses a wide range of key performance indicators (“KPIs”) across its various businesses and at a Group level. The most important of these KPIs at a Grouplevel focus on five key areas:
• Safety• Profitability• Organic growth• Service delivery• Staff retention
KPIs are also shown below for the Group’s largest joint venture, Virgin Rail Group.
78189_Front FINAL_78189_StCchV10_FRONT 05/07/2011 11:38 Page 5

Operating and Financial Review
3.5.3.4 Service deliveryWe aim to provide a reliable service to support our organic growth strategy. Our measures of service delivery include:
• UK Bus (regional operations) – reliability measured as the percentage of planned miles to be operated that were operated.
• Rail – punctuality measured on the basis of the DfT’s Public Performance Measure (moving annual average) being the percentage of trains that arrive at theirfinal destination within 5 minutes (or 10 minutes for inter-city services) of their scheduled arrival time having called at all scheduled stations. References torail punctuality throughout this Annual Report refer to punctuality calculated on this basis.
Due to the nature of the North American business, there is no single measure of service delivery for the North American division as a whole. Service deliveryKPIs are not reported for businesses acquired or disposed of in the year.
During the year ended 30 April 2009, Virgin Rail Group experienced numerous Network Rail possessions, over-runs and days of poor performance and this isreflected in the decline in passenger miles shown above for that year.
The declines in passenger volumes at UK Bus (regional operations) and UK Rail, and the decline in North America revenue, in the year ended 30 April 2010shows the impact of the tough economic conditions during the year. At Virgin Rail Group the impact has been offset by the increase in services following a newtimetable being introduced in December 2008.
3.5.3.5 Staff retentionThe strength of our business is built on the quality of our employees. We monitor staff turnover which is measured as the number of employees who left theGroup (other than through business disposals) during the period as a proportion of the total average employees during the period. Staff retention KPIs are notreported for businesses acquired or disposed of in the year.Staff turnover for the last three years in our continuing businesses was as follows:
page 6 | Stagecoach Group plc
UK Bus (regional operations)passenger journeys 0.9% (0.4)% 3.2%UK Rail passenger miles– South West Trains Positive growth 4.1% (1.1)% 2.2%– East Midlands Trains each year 6.9% (0.4)% 1.6%– Virgin Rail Group – West Coast Trains 9.3% 20.4% (1.5)%North America revenue 8.5% (3.4)% 7.2%
Year ended Year ended Year ended30 April 2011 30 April 2010 30 April 2009Growth % Growth % Growth %Target
UK Bus (regional operations) reliability >99.0% 99.1% 99.3% 99.5%UK Rail punctuality– South West Trains >90.0% 93.3% 93.0% 93.3%– East Midlands Trains >85.0% 92.0% 92.5% 89.3%– Virgin Rail Group – West Coast Trains >85.0% 86.3% 85.3% 79.7%
Target
The service delivery KPIs were as follows:
Service delivery at our UK businesses for the year ended 30 April 2011 was adversely affected by the severe winter weather in November and December 2010.
The organic growth KPIs were as follows:
Year ended 30 April
2011 2010 2009% % %
UK Bus (regional operations)staff turnover 15.0% 15.0% 18.3%UK Rail staff turnover– South West Trains To 7.4% 7.4% 11.3%– East Midlands Trains decrease 4.4% 7.3% 8.3%– Virgin Rail Group – West Coast each year 2.6% 3.6% 5.3%North America staff turnover 16.5% 20.1% 20.2%
Target
Year ended 30 April
2011 2010 2009% % %
78189_Front FINAL_78189_StCchV10_FRONT 05/07/2011 11:38 Page 6

Stagecoach Group plc | page 7
3.6 Overview of financial resultsStagecoach Group has achieved continued strong financial and operational performance for the year ended 30 April 2011.Revenue by division is summarised below:
REVENUE 2011 2010 2011 2010
Functional Functional currency Growth£m currency (m) %
Continuing Group operationsUK Bus (regional operations) 893.6 875.4 £ 893.6 875.4 2.1%UK Bus (London) 133.6 Nil £ 133.6 Nil –%North America 295.1 266.1 US$ 461.7 426.3 8.3%UK Rail 1,070.0 1,026.7 £ 1,070.0 1,026.7 4.2%%Intra-Group revenue (2.5) (3.8) £ (2.5) (3.8) (34.2)%
Group revenue 2,389.8 2,164.4
OPERATING PROFIT 2011 2010 2011 2010
% % Functional Functional currency£m margin £m margin currency (m)
Continuing Group operationsUK Bus (regional operations) 153.1 17.1% 126.1 14.4% £ 153.1 126.1UK Bus (London) (5.9) (4.4)% Nil – £ (5.9) NilNorth America 19.3 6.5% 9.1 3.4% US$ 30.2 14.6UK Rail 48.4 4.5% 41.6 4.1% £ 48.4 41.6Group overheads (11.3) (11.6)Restructuring costs (2.9) (1.2)
Total operating profit from continuing Group operations 200.7 164.0
Joint ventures – share of profit/(loss) after taxVirgin Rail Group 28.4 19.2Citylink 1.8 1.2New York Splash Tours Nil (0.9)Twin America 9.3 8.5
Total operating profit before intangible asset expenses and exceptional items 240.2 192.0
Intangible asset expenses (15.2) (11.1)Exceptional items Nil (1.8)
Total operating profit: Group operating profitand share of joint ventures’ profit after taxation 225.0 179.1
Operating profit by division is summarised below:
78189_Front FINAL_78189_StCchV10_FRONT 05/07/2011 11:38 Page 7

Operating and Financial Review
page 8 | Stagecoach Group plc
3.7 Divisional Performance3.7.1 UK Bus (regional operations)Financial performanceThe financial performance of the UK Bus (regional operations) division for theyear ended 30 April 2011 is summarised below:
2011 2010£m £m Change
Revenue 893.6 875.4 2.1%Like-for-like revenue* 883.0 864.7 2.1%Operating profit* 153.1 126.1 21.4%
Operating margin 17.1% 14.4% 270bp
Revenue from our UK Bus regional operations for the year ended 30 April 2011was up 2.1% to £893.6m, compared to £875.4m in the prior year. Like-for-likerevenue growth was 2.1%. Operating profit was up 21.4% at £153.1m (2010:£126.1m) which includes the benefit of a £14.3m year-on-year reduction infuel costs. Operating margin was 17.1%, compared to 14.4% in 2010. Passenger revenue growthWe have delivered further revenue and passenger volume growth at our UKBus regional operations. Over many years, our UK Bus (regional operations)volume growth and profit margins have been amongst the best in the sectorand we also offer the best value fares of any major operator. We have seenincreasing signs of modal shift from car to local bus services as roadcongestion, the high price of fuel and Government “green taxes” impact onthe cost of motoring. Consumers are seeing the convenience and financialbenefits of switching to a better value and more sustainable mode oftransport. Revenue growth in the year was consistent with our plan for modestfare rises. Like-for-like passenger volume growth for the year was 0.9%. Ourvalue fares strategy and focus on organic growth has ensured we have avibrant bus business in the UK and we believe the environment for publictransport will support continued modal shift to bus and coach travel. Cost controlReduced public sector spending is resulting in reductions in concessionaryrevenue, and cuts by local authorities in tendered services. All bus operatorshave also faced increasing pressure on fuel and energy costs and from April2012, will see a reduction in Bus Service Operators’ Grant (BSOG). However, wehave maintained a strong commercial bus network through a mixture of fareincreases at or below inflation and some limited mileage reductions. We willcontinue to manage the impact on our business proactively and take thesefactors into account in future decisions on bus services, tenders and fares, whileworking hard to minimise the effect on our passengers.
InvestmentWe are driving up the quality of travel for our customers by investing ingreener vehicles, better facilities and improved services. In January 2011, weannounced that we were investing £52m in 360 new Euro 5 buses andcoaches for our regional bus networks across the UK in year to 30 April 2012,further improving the standard of travel for passengers. This is in addition tothe purchase of more than 60 hybrid electric buses, which was announced inlate 2010. It means the UK Bus Division’s investment in new vehicles outsideLondon over four years will reach nearly £290m. Stagecoach is leading the wayon investing in new greener buses using state-of-the-art hybrid electrictechnology. More than 20% of the 542 vehicles supported by the Departmentfor Transport’s Green Bus Fund are being purchased by Stagecoach in what isthe biggest investment in low carbon buses outside London. Across ourregional operations, we have placed orders for 142 hybrid electric vehicles, at acost of £26.9m. We are also making a multi-million-pound investment in a hi-tech eco-driving system for our regional bus operations, which will help reducefuel consumption and carbon emissions, improve passenger comfort and cutthe risk of accidents. A key element of the initiative is an EcoDriver incentivescheme giving employees the chance to earn “green points” that are convertedinto financial benefits from a potential £900,000 annual bonus pot.
Pricing strategyStagecoach has been independently recognised as offering the best value busfares of any major UK bus operator. We are continuing to focus on our valuefares strategy to support organic passenger growth, offering our customersgood value travel options through our multi-journey megarider discountedtravel tickets. Investment in smartcard technology is a key part of our ticketing
plans for the future and Stagecoach was the first major UK bus operator tocomplete the installation of Government-standard smartcard ticket machineson its entire UK bus fleet outside London. In London, all of the Group’s busesaccept Transport for London’s Oyster card. We have launched our ownsmartcard, StagecoachSmart, which can be used by passengers to store theirtickets electronically. Customers also have the option to pay for their travelthrough automatic monthly payments. We are rolling out StagecoachSmarttravel cards across our regional bus operations, offering potential for furtherintegration with other operators’ services where infrastructure and commercialagreements are in place.
Regulatory developmentsThe Group continues to respond to the Competition Commission on itsconsideration of the local bus market in the UK (excluding London andNorthern Ireland). The Commission published its Provisional Findings andPossible Remedies in May 2011. Local bus services in the UK have beensubject to detailed and unprecedented scrutiny by the competitionauthorities for more than eighteen months and we note that theCommission is not proposing any fundamental change to the regulatorystructure of the industry. At this stage, the Commission has ruled out bothprice controls and forced divestments of bus operations. In addition, theCommission has acknowledged that there are existing agencies, mechanismsand legislation, which can address a number of its recommendations. Wehave consistently attracted more passengers by investing in our buses andnetworks, providing innovative products and offering good value fares. Wewill engage with the Commission on measures that we believe will deliverfurther improvements to bus passengers, while retaining the many positiveexisting initiatives that benefit our customers as a result of the competitivemarket in which we operate. At the same time, we will continue to press localand national government for action on the issues that matter to customers.We believe the Commission’s report should be a starting point for serious,consistent and extensive measures to tackle road congestion and delivermore bus priority.
Business developmentStagecoach has been awarded a major contract to provide transport at theLondon 2012 Olympic and Paralympic Games. The contract will involvetransferring the world’s athletes and media between their accommodationand various Olympic and Paralympic venues in London, as well as transportingthem to and from airports as they arrive and leave the Games. Stagecoach willbe responsible for managing two depots in London, with a total of 1,100 busesand coaches in operation throughout the event. Around half of the buses andcoaches required will be provided by Stagecoach with the remainder beingsupplied by other UK and Irish bus operators.We are building further on our successful direct marketing and telemarketingcampaigns to attract new customers and retain existing business. We havebuilt up a database of more than one million customers and targeted specificdemographic groups, such as commuters and mothers, with tailoredcampaigns to encourage them to switch from driving to taking publictransport. We are joining the Ice loyalty card scheme for sustainable products,which brings together companies with superior ethical and environmentalcredentials and allows consumers to collect and spend points across a range ofbusinesses. In addition, we have launched pilot projects in Scotland andOxford using social media channels to inform passengers about marketingpromotions and assist the management of customer service, including issuesaffecting service reliability. Our budget services are continuing to attract more and more people lookingfor an affordable, reliable and greener travel alternative. In April 2011, weannounced a further expansion of our budget transport services across the UK.megabus.com added five new locations and now serves over 60 locationsacross the UK.
OutlookUK Bus operators undoubtedly face a number of challenges in the monthsahead. We forecast that in the year ending 30 April 2012, concessionaryrevenue and tendered revenue will reduce by around £15m and that fuel costswill increase. However, we remain positive on the prospects for the Division.The flexibility we have on fares and service patterns, the rising cost of running aprivate car and the strength of our management team, mean that the Division iswell positioned to at least deliver operating profit in the year to 30 April 2012 ata level similar to that of the year to 30 April 2011. Whilst fares will increase at ahigher average rate than the previous year, our services will remain good value.
* See definitions in note 36 to the consolidated financial statements.
78189_Front FINAL_78189_StCchV10_FRONT 05/07/2011 11:38 Page 8

3.7.2 UK Bus (London)The financial performance of UK Bus (London) since the Group acquired it inOctober 2010 to 30 April 2011 is summarised below:Financial performance
14 October 2010 to 30 April 2011
£m
Revenue 133.6Operating loss (5.9)
Operating margin (4.4)%
The reported operating loss of £5.9m is after taking account of (i) a £3.2mrelease from the provision that was recorded as at acquisition in respect ofacquired customer contracts and (ii) £9.9m of costs in relation to rebasing ofstaff terms and conditions.
In October 2010, the Group completed the acquisition of the bus businessformerly owned by East London Bus Group Limited (in administration),acquiring four companies that together operate the business. The cash paid inrespect of the acquisition was £59.5m, inclusive of amounts to settle inter-company liabilities payable by the acquired business to its former parentcompany. The closing enterprise value (being the aggregate of theconsideration paid and the net debt assumed with the acquisition) on the dateof completion was £56.0m, taking account of the cash in the acquiredbusiness at completion. We operated a successful and profitable bus businessin London for several years and are pleased to re-enter the London bus marketat an attractive price.
We have made significant progress in restructuring the acquired business to bothmaximise synergies with the wider Group and tackle the structurally high costbase. Our first step was to put in place a new management team, comprisingStagecoach personnel from other areas and also incumbent members of theLondon management team. The head office accounting and administrationstructure of the business was then reduced, with all accounting functions beingintegrated with our Shared Service Centre in Stockport.
We have held discussions with the employee trade union representatives andare pleased with the constructive response to our plans to improve employeeproductivity and reduce unit costs significantly, and in doing so secure thebusiness and jobs for the future. The results include the financial cost ofimplementing these changes in working terms and conditions and we will seematerial reduction in future payroll costs.
We have also undertaken a full review of the integrity of the financial modelssupporting the contract costing and budgeting for bids and set a realisticreturn criteria for future tenders. As we have previously reported, it will takesome time for the existing low margin contracts to work through to re-tender,and the business has already lost some sizeable contracts which will impactfrom the year to 30 April 2012.
We have recently announced the planned closure of one of the ten bus depotsfrom which the business operates. This property rationalisation planrecognises the significant extra capacity the business has, and will allow us toimprove efficiency by better spreading overheads, yet still leaves sufficientcapacity for future requirements.
In the next six months our focus remains on the cost base of the business, inparticular fleet maintenance costs and working practices, where we anticipatefurther economies and efficiency improvements can be achieved.As a sign of our confidence in the future of the business, in January 2011 weannounced plans to lease more than 160 new state-of-the-art vehicles for ourLondon operations. Our long-term aspirations are for mid to upper single-digit operating margins. While we do not underestimate the challenges weface in improving the financial performance of the acquired business, our plansare firmly on track and we remain confident we can deliver a good return toshareholders from the acquisition.OutlookAs we anticipated when we acquired the London Bus Division, the annual rateof revenue is likely to fall in the year ending 30 April 2012 but there is goodpotential to generate a small operating profit by reducing costs andrelinquishing some under-performing contracts.
3.7.3 North AmericaFinancial performanceThe financial performance of the North America division and North Americajoint ventures for the year ended 30 April 2011 is summarised below:
2011 2010 Change
US$m US$m %
RevenueWholly owned 461.7 426.3 8.3%Share of joint ventures 67.7 64.1 5.6%
Total 529.4 490.4 8.0%
Like-for-like revenue 457.0 421.1 8.5%
Operating profitWholly owned 30.2 14.6 106.8%Share of joint ventures 15.2 12.8 18.8%
Total 45.4 27.4 65.7%
Operating margin 8.6% 5.6% 300bp
Revenue from our wholly owned North American operations for the year to30 April 2011 was up 8.3% at US$461.7m (2010: US$426.3m), and theequivalent like-for-like revenue was up by 8.5%. Operating profit wasUS$30.2m (2010: US$14.6m), resulting in an operating margin of 6.5%,compared to 3.4% the previous year. The increased profit and margin reflectsthe benefits of revenue growth and reduced fuel costs. Converted to sterling,revenue for the 12 months to 30 April 2011 was £295.1m (2010: £266.1m).Operating profit for the 12 months was £19.3m (2010: £9.1m).
megabus.commegabus.com revenue in the year ended 30 April 2011 was US$75.4m (2010:US$45.1m) and it continues to be the growth engine of our business in NorthAmerica. Passenger demand is strong and we are continuing to expand ourrange of destinations. megabus.com now covers around 60 cities from hubs inChicago, New York, Philadelphia, Washington D.C. and Pittsburgh. Our strategyof using transport hubs has helped support the rapid expansion of the product,maximise the productivity of our fleet and control start-up costs. The marketfor budget travel has bucked the trend of the wider economy and we havecreated more than 250 jobs over the past two years. Moving forward, we expectmegabus.com to account for an increasing proportion of our North Americanbusiness and we are now focusing on the best strategy to exploit furthergrowth opportunities in other parts of North America.
Other operationsWe continue to take steps to match services to demand in the non-megabus.com parts of our business, as well as focusing on cost control. Wehave a flexible business model and have taken action to reduce costs and milesoperated, with vehicles in charter operations redeployed as part of ourmegabus.com growth strategy. The economic environment has improved andin the second half of the year, we have seen positive revenue trends.
OutlookWe are looking to grow megabus.com revenue from US$75.4m in the yearended 30 April 2011 to over US$110m in the year to 30 April 2012. This willstill largely be served by our existing depot infrastructure but we are alreadyworking on the further expansion of megabus.com beyond April 2012, whichmight involve new partnerships and/or infrastructure. New megabus.comroutes are expected to be loss-making initially, which partly masks the successof the established routes.Although megabus.com offers the greatest potential to grow the NorthAmerican business, the remainder of the business is well positioned to offsethigher fuel costs. The rate at which megabus.com is rolled out to newlocations will have a bearing on the North America operating profit for theyear to 30 April 2012 with a more rapid roll-out resulting in higher start-uplosses. Overall, however, the Division remains well placed to deliver a goodoperating profit in the year ending 30 April 2012.
Stagecoach Group plc | page 9
78189_Front FINAL_78189_StCchV10_FRONT 05/07/2011 11:38 Page 9

Operating and Financial Review
page 10 | Stagecoach Group plc
3.7.4 UK Rail Financial performanceThe financial performance of the UK Rail division for the year ended 30 April2011 is summarised below:
2011 2010£m £m Change
Revenue 1,070.0 1,026.7 4.2%Like-for-like revenue, excluding tram 1,026.9 968.9 6.0%Operating profit 48.4 41.6 16.3%
Operating margin 4.5% 4.1% 40bp
Revenue from our UK Rail subsidiaries for the year to 30 April 2011 was up by4.2% to £1,070.0m (2010: £1,026.7m). On a like-for-like basis, revenueexcluding our tram operations is up 6.0%. Operating profit was £48.4m(2010: £41.6m), giving an operating margin of 4.5% (2010: 4.1%). We havebenefitted from improving passenger volume trends at our South WesternTrains and East Midlands Trains franchises. South Western Trains, whichmakes premium payments to the DfT, qualifies for revenue support paymentunder the terms of its contract as revenues remain below that forecast whenthe contract was originally awarded. The first revenue support payment wasreceived in March 2011, which covered the period from 1 April 2010. Asexpected, East Midlands Trains has made a loss during the year. It qualifies forrevenue support from November 2011.
Operational performanceOperational performance at our East Midlands Trains and South WesternTrains franchises is consistently amongst the highest of the UK train operators.East Midlands Trains continues to run the most punctual trains of any longdistance franchised train operator in the UK. For the year to 31 March 2011,punctuality on East Midlands Trains was 92.1%, compared to 87.7% for long-distance operators. Following the improvements made on its regional routes,East Midlands Trains has also been named as the UK’s most improved regionaltrain operator. South Western Trains recorded a record punctuality figure of93.7% for the same period. The average for London and South East operatorswas 91.1% and was 90.9% for all UK franchised rail operators.
Customer satisfactionSatisfaction amongst our passengers also remains high. The latest NationalPassenger Survey, carried out during Autumn 2010, shows South West Trainspassengers are amongst the most satisfied in the London and South Eastregion. Overall satisfaction was 87% compared to the London and South Eastaverage of 83%. At East Midlands Trains, satisfaction is at its highest everlevel, with 88% of passengers satisfied, compared to a long-distance averageof 87%, marking the biggest improvement of any UK rail operator.Satisfaction with punctuality continues to be rated highly on both franchises.
Value travelOur marketing strategy continues to focus on acquiring new customersthrough the promotion of value for money fares and on-board services. Ourbudget megatrain.com and megabusplus.com tickets, priced from just £1(plus 50p booking fee), are continuing to prove popular. We have alsolaunched successful promotions, such as the Red Dot Days at East MidlandsTrains, which have seen almost 20,000 passengers travelling for £5, £10 or£15. In May 2011, we rolled out a new competitively priced on board cateringoffer at East Midlands Trains, where our new online Best Fare Finder and theintroduction of WiFi on board all London services is also having a positiveimpact on passenger perception and volumes. The latest National PassengerSurvey found that the perception of value for money has increased by 9% and4% year-on-year respectively for East Midlands Trains and South West Trains.
Passenger improvementsWe are continuing to progress investment of more than £22m to improvestations across the East Midlands Trains and South West Trains networks. Weare making rail travel better for our customers through a package ofaccessibility enhancements, additional car parking spaces and refurbishedtoilets and waiting rooms. At East Midlands Trains, we are currently in theprocess of a £2.2m project to install new Customer Information Screens (CIS)at a number of stations. At South West Trains, we have invested in anindustry-leading software innovation at London Waterloo to improvepassenger information during times of major disruption. Passengers are alsobenefitting from improvements to our fleet. East Midlands Trains is investingmore than £30m to improve every single train in passenger service across thefranchise. The £10m refurbishment of the Class 158 trains, which are used tooperate services on the busy Liverpool to Norwich route, has now beencompleted, as has the £9m refurbishment of the High Speed Trains used onour main line services to London. We have received a positive response from
passengers to the improved levels of comfort and on-board benefits, such asthe WiFi now available on all trains to London. The refurbishment of theMeridian fleet is now well underway, and includes luxury leather seats andimprovements to the luggage space as a result of feedback from passengers.At South West Trains, we are also carrying out an interior refresh of our Class458 trains to deliver an improved travelling environment.
Policy & Regulatory DevelopmentsThe Group has engaged extensively with the Department for Transport and SirRoy McNulty on the way forward for reform of the rail industry. The final reportby Sir Roy McNulty on value for money in the UK Rail industry was published inMay 2011, and we believe its recommendations are a major opportunity tounlock further growth in the years ahead and deliver a more efficient, morepassenger-focused railway. We are supportive of efforts to reduce industry costsand we believe our achievements at our own franchises demonstrate our abilityto drive out efficiencies in areas under our control, whilst maintaining highlevels of performance and customer satisfaction. We would welcome radicalreform to deliver greater alignment of track and train, which we believe wouldbenefit all stakeholders in the UK rail network. Our vision of vertical integrationdoes not necessarily envisage the train operator taking ownership of theinfrastructure or delivering major infrastructure projects but rather it foreseesthe train operator having responsibility for infrastructure maintenance andrenewals thereby improving accountability and efficiency. We would relish theopportunity to participate in a pilot of such vertical integration. We lookforward to working with the Government to improve the railway for thebenefit of passengers, taxpayers and our shareholders.As part of the Comprehensive Spending Review, the Government retainedthe Retail Price Index (“RPI”) +1% formula for regulated fare increases forJanuary 2011. However, this will change to RPI +3% from January 2012 as partof a wider policy to shift the funding of the railways more towards thepassenger, so that the taxpayer pays less. All additional income raised by thedecision will be passed through by train operating companies to Government.Regulated fares account for roughly half of all rail journeys and we willcontinue to offer a range of good value fares to suit the different budgets ofour customers.
Rail franchising The Government announced in December 2010 its early thoughts on railfranchise reform and its intention for the tendering of specific franchises. Wewill continue to evaluate franchise opportunities as they emerge in light ofthese policy decisions. As a major rail operator with a good track record of delivery, we were pleasedto have been shortlisted for the Greater Anglia rail franchise and, inpartnership with Virgin, for the new West Coast franchise. The Greater Angliafranchise is expected to commence in February 2012 and will run for between17 and 29 months. The current West Coast franchise is due to end on 31March 2012. However, the start of the new West Coast franchise has beendelayed until 9 December 2012. Virgin Rail Group (“VRG”) has entered intobilateral negotiations with the DfT to agree acceptable terms for theextension of the current franchise to 8 December 2012. The new West Coastfranchise is expected to commence in December 2012 and will run for 14years (expiring in March 2026) with an option to extend for a further year.Greater Anglia and West Coast are very different franchises, each with theirown specific challenges, priorities and opportunities. We will continue to workwith local communities and other stakeholders to develop sustainable bids todeliver the Government’s specification, improve rail services for customers,and ensure value for money for taxpayers.The new Greater Anglia franchisee will not take significant passenger revenuerisk, consistent with the short-term nature of the franchise. It will, however,take cost risk and will operate the train service during the London 2012Olympics.The new West Coast franchise will likely include a risk-sharing mechanismbased on GDP rather than revenue and will give the train operator someincreased flexibility to change timetables and fares.
TramStagecoach is Britain’s biggest tram operator and the light rail systems weoperate in Manchester and Sheffield are important to their localcommunities. The new management team we appointed for our light railoperations last year has helped deliver further improvements and iscontinuing to work successfully with our Passenger Transport Executivepartners.Supertram continues to deliver exceptional levels of service reliability and hasachieved good revenue growth. At Metrolink, trams now serve the majoremployment centre at Media City in Salford Quay and further trackextensions are scheduled to be completed later in 2011.
78189_Front FINAL_78189_StCchV10_FRONT 05/07/2011 11:38 Page 10

Stagecoach Group plc | page 11
OutlookOperating profit in the UK Rail Division has been expected for some time toreduce in the year ending 30 April 2012 and this remains the case given thechange in the premium payments to Government. Thereafter, the availabilityof revenue support should help limit the risk of profit falling short ofexpectations but the scope to significantly increase UK Rail profit (newfranchise wins excepted) is already recognised as being limited.
3.7.5 Joint Ventures3.7.5.1 Virgin Rail GroupFinancial performanceThe Group's share of the financial performance of Virgin Rail Group for theyear ended 30 April 2011 is summarised below:
2011 2010£m £m Change
49% share of Revenue 392.7 355.3 10.5%
Operating profit 39.5 25.5 54.9%Net finance income 0.2 0.2 -Taxation (11.3) (6.5) 73.8%
Profit after tax 28.4 19.2 47.9%
Operating margin 10.1% 7.2% 290bp
Our share of VRG’s profit after tax for the 12-month period was £28.4m(2010: £19.2m). Our share of operating profit was £39.5m (2010: £25.5m),our share of finance income was £0.2m (2010: £0.2m) and our share oftaxation charges was £11.3m (2010: £6.5m).Passenger revenue growthVRG has continued to achieve strong passenger revenue growth. Improvedjourney times, more frequent services, and good value deals, have all had apositive impact on passenger trends. Passenger volume growth has been wellahead of other long-distance train operators, and Business and First Classtraffic has grown in particular as the economy has improved and betterinfrastructure performance has delivered more reliable services. Virgin iswinning further market share from domestic airlines as passengers turn theirback on out of town airports and opt instead for city-centre to city-centretravel. Figures issued by the Association of Train Operating Companies in April2011 show that on London to Manchester, rail’s market share rose from 69%in 2008 to 79% in 2010.Passenger improvementsInvestment has continued to improve the Virgin Trains website, provide morefast ticket machines and increase the number of car parking spaces at stationsto meet the growing demand. As a result, Virgin West Coast continues to berated highly by its passengers, with 90% of passengers satisfied in the latestNational Passenger Survey. Business developmentVRG has a proven track record over the last 14 years of providing better railservices for customers, including the renewal of the entire train fleet and theintroduction of a high-frequency timetable. In the last six years alone, annualpassenger numbers have doubled from 14 million to over 28 million andVirgin is now delivering industry-leading levels of customer satisfaction. VRG isnegotiating an extension to its existing West Coast franchise and has beenshortlisted for the new West Coast franchise, as explained in section 3.7.4. VRGis committed to submitting a strong bid to retain the West Coast franchise,building on the investment and customer improvements made in recent yearsand working with local communities along the route, as well as otherstakeholders, to develop these plans.
OutlookVRG’s profit in the year ended 30 April 2011 benefited from some contractualsettlements with Network Rail that will not repeat in the year to 30 April 2012.While this might mean a fall in short-term profit, the main strategic focus ofVRG is now on the opportunities presented by the new franchise which VRG isbidding for.
3.7.5.2 Twin AmericaFinancial performance
2011 2010US$m US$m Change
60% share of Revenue 67.7 63.6 6.4%
Operating profit 15.2 14.2 7.0%Taxation (0.6) (0.6) –
Profit after tax 14.6 13.6 7.4%
Operating margin 22.5% 22.3% 20bp
We are pleased by the strong financial performance of our Twin America jointventure in the year ended 30 April 2011. The business has benefited from anincreased number of visitors to New York City. Our share of operating profitfor the year increased to US$15.2m (2010: US$14.2m). The tax treatment ofour share of profit is such that the joint venture’s own profit is partially taxedbut an additional tax charge falls on the joint venture partners and the effectof that on the Group is included within “taxation” in the consolidated incomestatement.TwinAmerica was notified by the United States Surface Transportation Board("STB") in February 2011 that its application for formal approval of the jointventure had not been approved. The STB confirmed that the joint venture, ascurrently structured, did require its approval and therefore, having decided notto approve the joint venture, the STB gave Twin America the option ofseparating the business, assets and management of the joint venture.Alternatively, the joint venture could divest its interstate services, which accountfor around 1% of the joint venture's revenues. The latter option would removethe transaction from STB jurisdiction and place it within the authority of theNew York State Attorney General. The Chairman of the STB agreed on 9 March2011 to grant an application for a stay of the February decision pending aforthcoming decision by the STB on Twin America's request to undertake afurther detailed review of the case. Twin America believes customers havebenefitted from good quality, high value, and better co-ordinated services, whilethe joint venture has achieved cost savings and other synergies. We willcontinue to assist the STB should it move forward with a fresh consideration ofthis matter and are prepared to present any further evidence as appropriate tohelp inform any future decision. Twin America continues to look foropportunities to expand both in its current market and beyond New York. On 17May 2011, Twin America commenced a joint venture in Los Angeles offeringopen top double deck, hop on hop off, sightseeing bus services and on 1 June2011, it started to offer sightseeing tours by boat on the River Hudson aroundManhattan. We believe the outlook for Twin America remains positive and weare confident of further growth in its revenue and profit.
3.8 Other financial matters3.8.1 Depreciation and intangible asset expensesEarnings before interest, taxation, depreciation, intangible asset expenses andexceptional items (pre-exceptional EBITDA) amounted to £330.5m (2010:£283.9m) including the Group’s share of its joint ventures’ profit after tax.Depreciation, including non-exceptional impairment charges, for the year was£90.3m (2010: £91.9m). The income statement charge for intangible assetsincreased from £11.1m to £15.2m, of which £5.1m (2010: £5.1m) related tojoint ventures. The year on year increase reflects amortisation of intangibleassets acquired during the year, primarily as part of acquiring the East Londonbus business.
3.8.2 Exceptional itemsThe following exceptional items, before taxation, arose in the year ended 30April 2010:• A loss of £0.1m in relation to the disposal of land and buildings across the
Group.• A gain of £4.6m being the revision to the estimated insurance provision in
relation to pre-acquisition liabilities.• A loss of £0.6m being expenses incurred in relation to the acquisition of
our UK Bus (London) operations.• A loss of £3.2m in relation to the disposal of certain operations in the
United Kingdom.• A gain of £18.5m on the release of a liability related to previous disposals
of businesses.The net effect of exceptional items was a pre-tax profit of £19.2m (2010: lossof £20.4m), of which a gain of £18.5m (2010: £3.9m) was reported as profitfrom discontinued operations. A tax charge of £1.3m (2010: credit of £7.4m)arose in respect of exceptional items resulting in a net after-tax gain fromexceptional items of £17.9m (2010: loss of £13.0m).
3.8.3 Net finance costsPre-exceptional net finance costs increased from £30.7m to £34.5m. Theratio of pre-exceptional EBITDA to net finance costs was 9.6 times for theyear ended 30 April 2011 (2010: 9.2 times), reflecting increased profit.
78189_Front FINAL_78189_StCchV10_FRONT 05/07/2011 11:38 Page 11

Operating and Financial Review
page 12 | Stagecoach Group plc
3.8.4 TaxationThe tax charge is analysed in Table A below:
3.8.5 Earnings per shareEarnings per share before intangible asset expenses and exceptional itemswere 23.8p, compared to 18.7p in 2010. Basic earnings per share increasedfrom 15.6p to 24.6p.
3.8.6 Fuel CostsThe Group’s operations as at 30 April 2011 consume approximately 370mlitres of diesel fuel per annum. As a result, the Group’s profit is exposed tomovements in the underlying price of fuel.
The proportion of the Group’s projected fuel usage that is currently hedgedusing fuel swaps is as follows:
Year ending 30 April 2012 2013 2014 2015
UK Bus (regional operations) 96% 51% – –UK Bus (London) 50% 38% 25% 13%North America 77% 28% – –UK Rail 76% 61% 5% –
The Group has no fuel hedges in place for periods beyond 30 April 2015.The Group’s fuel costs include the costs of delivery and duty as well as thecosts of the underlying product. Accordingly, not all of the cost varies withmovements in oil prices.The Group’s like-for-like diesel fuel costs for the year ending 30 April 2012 arelikely to be higher than for the year ended 30 April 2011 because after takingaccount of the fuel hedges in place, the average fuel cost per litre will be higher. Further information on the Group’s exposure to movements in fuel prices isprovided in note 27 to the consolidated financial statements.
3.8.7 Cash flowsThe strong cash generative nature of the Group is once again highlighted bynet cash from operating activities after tax of £231.8m (2010: £216.4m). Netcash outflows from investing activities were £198.2m (2010: £37.2m) andnet cash used in financing activities was £49.7m (2010: £79.9m).
3.8.8 Net debtNet debt (as analysed in note 31 to the consolidated financial statements)reduced from £296.7m at 30 April 2010 to £280.9m at 30 April 2011.The Group’s net debt at 30 April 2011 is further analysed below:
Net cash from operating activities before tax for the year ended 30 April 2011was £252.2m (2010: £217.1m) and can be further analysed as follows:
The impact of purchases of property, plant and equipment for the year on netdebt was £164.4m (2010: £154.9m). This comprised cash outflows of£156.3m (2010: £89.2m) and new hire purchase and finance lease debt of£8.1m (2010: £65.7m). £14.7m (2010: £53.0m) was received from thedisposal of property, plant and equipment.
3.8.9 LiquidityThe Group has comfortably complied with all of its banking covenantsthroughout the financial year. The Group is subject to certain market standardbanking covenants, which include a limit on the level of net debt comparedto EBITDA and a minimum level of EBITDA to interest, in each case asdefined in the relevant agreements.Our strong financial position is evidenced by:• The ratio of net debt at 30 April 2011 to pre-exceptional EBITDA for the
year ended 30 April 2011 was 0.8 times (2010: 1.0 times).• Pre-exceptional EBITDA for the year ended 30 April 2011 was 9.6 times
(2010: 9.2 times) pre-exceptional net finance costs.• Undrawn, committed bank facilities analysed below totalled £491.5m at
30 April 2011 (2010: £345.9m). This included £67.9m (2010: £24.9m)that is only available for non-cash utilisation. In addition, the Groupcontinues to secure new asset finance.
• In February 2011, the Group saw strong appetite from banks for the re-financing of its core bank facilities and entered into £510.0m of new five-year, committed facilities.
• The three main credit rating agencies continue to assign investment gradecredit ratings to the Group.
• The Group is cash generative and has the flexibility to vary capitalexpenditure and other cash outflows where appropriate.
The Group’s principal lines of credit have been arranged on a bi-lateral basiswith a group of relationship banks which provide bank facilities for generalcorporate purposes. These arranged lines of credit allow cash drawdowns tofinance the Group and also include facilities which are dedicated to issuingperformance/season ticket bonds, guarantees and letters of credit.
2011 2010
£m £m
Operating profit of Group companies 190.6 156.2Depreciation 90.3 77.2Intangible asset expenses 10.1 6.0Impairment of plant and equipment Nil 14.7EBITDA of Group companies 291.0 254.1Loss on disposal of plant and equipment 0.9 2.0Equity–settled share based payment expense 4.7 6.3Working capital movements (22.7) (10.7)Net interest paid (30.1) (53.1)Dividends from joint ventures 28.8 35.7
Net cash from operating activities beforeexcess pension contributions 272.6 234.3Pension contributions in excess ofpension costs (20.4) (17.2)
Net cash inflow from operating activitiesbefore taxation 252.2 217.1
TABLE A Year ended 30 April 2011 Year ended 30 April 2010SUMMARY OF TAX ON PROFIT Pre-tax profit Tax Rate Pre-tax profit Tax Rate
£m £m % £m £m %
Excluding intangible asset expenses and exceptional items 218.1 (47.5) 21.8% 168.7 (34.6) 20.5%Intangible asset expenses (15.2) 3.1 20.4% (11.1) 1.7 15.3%
202.9 (44.4) 21.9% 157.6 (32.9) 20.9%Exceptional items 0.7 (1.3) 185.7% (24.3) 7.4 30.5%
203.6 (45.7) 22.4% 133.3 (25.5) 19.1%Reclassify joint venture taxation for reporting purposes (12.4) 12.4 n/a (7.4) 7.4 n/a
Reported in income statement 191.2 (33.3) 17.4% 125.9 (18.1) 14.4%
Fixed Floating Totalrate rate£m £m £m
Unrestricted cash Nil 174.9 174.9Cash held within train operatingcompanies Nil 163.1 163.1Restricted cash Nil 20.3 20.3
Total cash and cash equivalents Nil 358.3 358.3Sterling bond* (244.8) (150.0) (394.8)Sterling hire purchase (8.4) (168.5) (176.9)US dollar finance leases (40.4) Nil (40.4)Canadian dollar finance leases (3.4) Nil (3.4)Loan notes Nil (21.1) (21.1)Preference shares Nil (2.6) (2.6)
Net debt (297.0) 16.1 (280.9)
* The split between fixed rate and floating rate sterling bonds is after taking account of the effect ofinterest rate derivates that synthetically convert £150.0m of fixed rate debt to floating rate debt.
78189_Front FINAL_78189_StCchV10_FRONT 05/07/2011 11:38 Page 12

The Group’s committed bank facilities and related surety arrangements as at30 April 2011 are analysed below:
The Group’s main bank facilities are committed through to 2016. The Groupissued a £400m 5.75% bond in December 2009, which matures in December2016.The Group also maintains facilities in relation to asset finance (“Asset FinanceFacilities”). Asset Finance Facilities are typically agreed in principle one year inadvance and are arranged for the purpose of funding bus vehicle expenditureand for specific UK Rail operating assets. Asset Finance Facilities includefinance leases, hire purchase agreements and operating leases. The terms ofAsset Finance Facilities are dependent on the underlying assets and typicallyrange between five and ten years.Although there is an element of seasonality in the Group’s bus and railoperations, the overall impact of seasonality on working capital and liquidityis not considered significant.The rail operations maintain cash balances to meet working capitalrequirements and the franchise agreements restrict the transfer of this cash.Unless DfT consent is obtained, cash can only be transferred by loan ordividend to the extent that the relevant train operating company hasdistributable profits, and the franchise is compliant with the liquiditycovenants specified in its franchise agreement.
3.8.10 Capital expenditureAdditions to property, plant and equipment for the year were:
3.8.11 Business combinationsOn 14 October 2010, Stagecoach Bus Holdings Limited ("SBHL"), a Groupsubsidiary, completed the acquisition of the bus business formerly owned byEast London Bus Group Limited (in administration). SBHL acquired 100% ofthe voting equity interests in four companies that together operate theacquired business. The cash paid in respect of the acquisition was £59.5m, comprising £5.4mfor the entire share capital of the acquired companies and £54.1m to settleinter-company liabilities payable by the acquired companies to their formerparent company. Further details are given in note 16 to the consolidatedfinancial statements.The Group has made no other material acquisitions in the year ended30 April 2011.
3.8.12 Shares in issueThe weighted average number of ordinary shares during the year used tocalculate basic earnings per share was 717.5m (2010: 716.2m). The number ofordinary shares ranking for dividend at 30 April 2011 was 717.9m (2010:
717.8m), with a further 2.2m (2010: 2.3m) of ordinary shares held byemployee trusts and not ranking for dividend.
3.8.13 Net assetsNet assets at 30 April 2011 were £246.2m (2010: £12.7m) with the increaseprimarily reflecting the strong results for the year, movements on cash flowhedges of £23.4m after tax and actuarial gains on Group defined benefitpension schemes of £52.5m after tax.
3.8.14 Retirement benefitsThe reported net assets of £246.2m (2010: £12.7m) that are shown on theconsolidated balance sheet are after taking account of net retirement benefitliabilities of £97.1m (2010: £202.1m) as analysed in note 26 to theconsolidated financial statements.The Group recognised pre-tax actuarial gains of £76.5m (2010: losses of£138.7m) on Group defined benefit pension schemes in the year ended30 April 2011.
3.8.15 CapitalThe Group regards its capital as comprising its equity, cash, gross debt andany similar items. As at 30 April 2011, the Group’s capital comprised:
The Group manages its capital centrally. Its objective in managing capital is tooptimise the returns to its shareholders whilst safeguarding the Group’s abilityto continue as a going concern and as such its ability to continue to generatereturns for its shareholders. The Group also takes account of the interests ofother stakeholders when making decisions on its capital structure.
The capital structure of the Group is kept under regular review and will beadjusted from time to time to take account of changes in the size or structureof the Group, economic developments and other changes in the Group’s riskprofile. The Group will adjust its capital structure from time to time by any ofthe following: issue of new shares, dividends, return of value to shareholdersand borrowing/repayment of debt. There are a number of factors that theGroup considers in evaluating capital structure. The principal ratios that theDirectors consider are (1) Net Debt to EBITDA, (2) EBITDA to interest and (3)Net Debt to market capitalisation. It is a matter of judgement as to what theoptimal levels are for these ratios.
3.8.16 Treasury policies and objectivesRisk management is carried out by a treasury committee and a centraltreasury department (“Group Treasury”) under policies approved by theBoard. Group Treasury identifies, evaluates and hedges financial risks in closeco-operation with the Group’s operating units. The Board provides writtenprinciples for overall treasury risk management, as well as written policiescovering specific areas, such as foreign exchange risk, interest rate risk, creditrisk, use of derivative financial instruments and investing excess liquidity.
The funding policy is to finance the Group through a mixture of bank, leaseand hire purchase debt, capital markets issues and cash generated by thebusiness.See note 27 to the consolidated financial statements, for details of• the Group’s treasury risk management;• the Group’s management of interest rate risk;• the Group’s fuel hedging;• the Group’s management of foreign currency risk; and• the Group’s management of credit risk.
Major financing transactionsDuring the year, the Group entered into various hire purchase and financelease arrangements for new assets as described in note 31(f) to theconsolidated financial statements.
Stagecoach Group plc | page 13
2011 2010£m £m
UK Bus (regional operations) 85.1 97.1UK Bus (London) 17.0 NilNorth America 31.4 14.5UK Rail 34.2 45.1Other 0.1 Nil
167.8 156.7
Performance Available forbonds, non-cash Available for
guarantees utilisation cashFacility etc. drawn only drawings
Expiring in £m £m £m £m
MAIN GROUP FACILITIES– 2016 510.0 (66.9) (33.0) 410.1– 2014 42.0 (34.8) (7.2) Nil– 2013 80.7 (70.8) (9.9) Nil– 2012 69.6 (51.8) (17.8) Nil
702.3 (224.3) (67.9) 410.1
LOCAL & SHORT-TERM FACILITIES– Various 15.7 (2.2) Nil 13.5
718.0 (226.5) (67.9) 423.6
2011 2010£m £m
Market value of ordinary shares in issue 1,778.0 1,418.6
Cash 358.3 375.7Gross debt (639.2) (672.4)
Net debt (see section 3.8.8) (280.9) (296.7)
78189_Front FINAL_78189_StCchV10_FRONT 05/07/2011 11:38 Page 13

Operating and Financial Review
page 14 | Stagecoach Group plc
The following new financing arrangements were put in place during the yearended 30 April 2011 and subsequently:• In May 2010, a new c.£20m 3.5-year rail bonding arrangement was agreed
to replace a bank facility that was due to expire in November 2010.• In February 2011, the Group entered into £510m of new, unsecured bi-
lateral bank facilities that are committed for five years to February 2016.These new facilities replaced the bank facilities that were due to expire inMarch 2012.
• In February 2011, two new one-year rail bonding arrangements of c.£63mand c.£7m were entered into to replace two arrangements that were dueto expire in March 2011.
• In June 2011, the Group sold vehicles to a bank for c.£8m and leased themback on an operating lease.
3.8.17 Critical accounting policies and estimatesThe Group’s material accounting policies are set out in note 1 to theconsolidated financial statements.Preparation of the consolidated financial statements in accordance withInternational Financial Reporting Standards (“IFRS”) as adopted by theEuropean Union requires directors to make estimates and assumptions thataffect the reported amounts in the consolidated financial statements andaccompanying notes. Actual outcomes could differ from those estimated. TheDirectors believe that the accounting policies and estimation techniquesdiscussed below represent those that require the greatest exercise ofjudgement. The Directors have used their best judgement in determining theestimates and assumptions used in these areas but a different set ofjudgements could result in material changes to the Group's reported financialperformance and/or financial position. The discussion below should be read inconjunction with the full statement of accounting policies.
Taxation The Group’s tax charge is based on the pre-tax profit for the year and tax ratesin force. Estimation of the tax charge requires an assessment to be made of thepotential tax consequences of certain items that will only be resolved whenagreed by the relevant tax authorities. Assessment of the likely outcome isbased on historical experience, professional advice from external advisors, andthe current status of any judgmental issues. However, the final tax cost to theGroup may differ from the estimates.
Acquired customer contracts and onerous contractsThe Group has a number of contractual commitments, most significantly inrespect of its rail franchises and its acquired East London bus business. Incertain circumstances, IFRS requires a provision to be recorded for a contractthat is “onerous” or when acquired as part of a business combination, that isunfavourable to market terms. A contract is considered onerous where it isprobable that the future economic benefits to be derived from the contract areless than the unavoidable costs under the contract. Determining the amountof any contract provision necessitates forecasting future cash flows andapplying an appropriate discount rate to determine a net present value. Thereis uncertainty over future cash flows. Estimates of cash flows are consistentwith management’s plans and forecasts. The estimate of future cash flows andthe discount rate involves a significant degree of judgment. Actual results candiffer from those assumed and there can be no absolute assurance that theassumptions used will hold true.
Goodwill and impairmentIn certain circumstances, IFRS requires property, plant, equipment andintangible assets to be reviewed for impairment. When a review forimpairment is conducted, the recoverable amount is assessed by reference tothe net present value of the expected future cash flows of the relevant cashgenerating unit (“CGU”) or net realisable value, if higher. The discount rateapplied in determining the present value of future cash flows is based on theGroup’s estimated weighted average cost of capital with appropriateadjustments made to reflect the specific risks associated with the CGU.Estimates of cash flows are consistent with management’s plans and forecasts.The estimation of future cash flows and the discount rate involves a significantdegree of judgement. Actual results can differ from those assumed and therecan be no absolute assurance that the assumptions used will hold true.
InsuranceThe Group receives claims in respect of traffic incidents and employeeincidents. The Group protects against the cost of such claims through thirdparty insurance policies. An element of the claims is not insured as a result ofthe “excess” or “deductible” on insurance policies. Provision is made for theestimated cost to the Group (net of insurance recoveries) to settle claims for
incidents occurring prior to the balance sheet date. The estimation of thebalance sheet insurance provisions is based on an assessment of the expectedsettlement on known claims together with an estimate of settlements thatwill be made in respect of incidents occurring prior to the balance sheet datebut for which claims have not been reported to the Group. The eventualsettlements on such claims may differ from the amounts provided for at thebalance sheet date. This is of greater risk in “younger” operations with ashorter claims history from which to make informed estimates of provisions.
PensionsThe determination of the Group’s pension benefit obligation and expense fordefined benefit pension plans is dependent on the selection by the Directorsof certain assumptions used by actuaries in calculating such amounts. Thoseassumptions are described in note 26 to the consolidated financialstatements and include among others, the discount rate, expected long-termrate of return on plan assets, annual rate of increase in future salary levelsand mortality rates. A portion of the plan assets is invested in equitysecurities. Equity markets have experienced volatility, which has affected thevalue of the pension plan assets. This volatility may make it difficult toestimate the long-term rate of return on plan assets. The Directors’assumptions are based on actual historical experience and external data.While we believe that the assumptions are appropriate, significant differencesin actual experience or significant changes in assumptions may materiallyaffect the pension obligation and future expense.
Property, plant and equipmentProperty, plant and equipment, other than land, are depreciated on astraightline basis to write off the cost or valuation less estimated residualvalue of each asset over their estimated useful lives. Useful lives are estimatedbased on a number of factors, including the expected usage of the asset,expected deterioration and technological obsolescence. If anotherdepreciation method (for example, reducing balance) was used or differentuseful lives or residual values were applied, this could have a material effecton the Group’s depreciation charge and net profit.
Rail contractual positionsThe UK Rail industry is subject to a complex matrix of contractualrelationships. The Group’s train operating companies are party to contractualrelationships with, amongst others, the DfT, Network Rail and rolling stocklessors. The nature of these contracts is such that there can be uncertaintyand/or disagreement as to amounts receivable or payable by the Group inaccordance with the contracts. The Group makes estimates of the amountsreceivable or payable taking account of the available, relevant information.Actual outcomes can differ from the estimates made by the Group and therecan be no absolute assurance that the assumptions made by the Group willhold true.
3.9 Current trading and outlookCurrent trading remains in line with our expectations. The improving trendsmean the Group can look forward with confidence to the year ahead. We willcontinue to consider opportunities in the transport sector to create value forour shareholders. The strong fundamentals of the Group ensure we are wellpositioned to take advantage of emerging opportunities for growth. Public transport is central to supporting economic growth and meeting theglobal challenge of climate change. In the UK, high quality public transport willbe at the heart of the successful delivery of the London 2012 Olympic andParalympic Games. We believe the outlook for our bus and rail services ispositive. We have the people, the products and the passion for public transportthat will deliver for our customers and our shareholders.
3.10 Principal risks and uncertaintiesLike most businesses, there are a range of risks and uncertainties facing theGroup and the matters described below are not intended to be an exhaustivelist of all possible risks and uncertainties.
Generally, the Group is subject to risk factors both internal and external to itsbusinesses. External risks include global political and economic conditions,competitive developments, supply interruption, regulatory changes, foreignexchange, materials and consumables (including fuel) prices, pensionsfunding, environmental risks, industrial action, litigation and the risk ofterrorism. Internal risks include risks related to capital expenditure,acquisitions, regulatory compliance and failure of internal controls. Details ofrisk management procedures are given on page 27.The focus below is on those specific risks and uncertainties that the Directorsbelieve are the most significant to the Group, taking account of the likelihoodof occurrence of each risk and the potential effect on the Group.
78189_Front FINAL_78189_StCchV10_FRONT 05/07/2011 11:38 Page 14

Stagecoach Group plc | page 15
3.10.1 Catastrophic eventsThere is a risk that the Group is involved (directly or indirectly) in a majoroperational incident resulting in significant human injuries or damage toproperty. This could have a significant impact on claims against the Group, thereputation of the Group and its chances of winning and retaining contracts orfranchises.
The Group has a proactive culture that puts health and safety at the top of itsagenda in order to mitigate the potential for major incidents. In the unlikelyevent that a major incident did occur, the Group has procedures in place forresponding to such incidents.
3.10.2 TerrorismThere have been multiple acts of terrorism on public transport systems andother terrorist attacks that whilst not directly targeting public transport havediscouraged travel. There is a risk that the demand for the Group’s servicescould be adversely affected by a significant terrorist incident. Such a fall indemand would have a negative effect on the Group’s revenue and financialperformance. The Group has plans in place designed to reduce the financialimpact of a terrorist incident and these plans take account of the Group’sexperience of managing the North American business during the period ofdepressed demand following the major terrorist attack on 11 September 2001.
3.10.3 EconomyThe economic environment in the geographic areas in which the Groupoperates affects the demand for the Group’s bus and rail services. In particular,the revenue of the Group’s UK rail operations is historically correlated withfactors such as UK GDP and Central London Employment. In North America, agreater proportion of the revenue is derived from tour, charter and sightseeingservices than in the UK and these services tend to be more susceptible toeconomic changes. The revenue and profit of the Group could therefore bepositively or negatively affected by changes in the economy.Management monitors actual and projected economic trends in order tomatch capacity to demand and where possible, minimise the impact ofadverse economic trends on the Group.
3.10.4 Rail cost baseA substantial element of the cost base in the Group’s UK Rail Division isessentially fixed because under its UK rail franchise agreements, the Group isobliged to provide a minimum level of train services and is therefore unable toflex supply in response to short-term changes in demand. In addition, asignificant part of the cost base is comprised of payments to the infrastructureprovider, Network Rail, and payments under train operating leases which arecommitted and do not vary with revenue. Accordingly, a significant proportionof any change in revenue (for example, arising as a result of the risks describedin sections 3.10.2 and 3.10.3) will impact profit in the UK Rail Division.This risk is taken account of when bidding for new rail franchises (see 3.10.5)and for current franchises we look to closely manage those variable costs thatwe can control.
3.10.5 Sustainability of rail profitsA significant element of the Group’s revenue and profit is generated by UK railfranchises. There is a risk that the Group’s revenue and profit could besignificantly affected (either positively or negatively) as a result of the Groupwinning new franchises, failing to retain its existing franchises or winning newfranchises on unattractive terms. In order to manage the risks, the Group hasdevoted significant management resource and financial investment to biddingfor new rail franchises.Appropriately experienced personnel are retained to work on rail bids and thirdparty consultants are engaged to provide additional expertise. The Boardapproves the overall rail bidding strategy and the key parameters for each bid.
3.10.6 Breach of franchiseThe Group is required to comply with certain conditions as part of its railfranchise agreements. If it fails to comply with these conditions, it may beliable to penalties including the potential termination of one or more of therail franchise agreements. This would result in the Group losing the right tocontinue operating the affected operations and consequently, the relatedrevenues and cash flows. The Group may also lose some or all of the amountsset aside as security for the shareholder loan facilities, the performance bondsand the season ticket bonds. The Group can do more to prevent breaches offranchise where it has sole control than where it has joint control. As theholder of a 49% joint venture interest in Virgin Rail Group, the Group has lesscontrol over the joint venture’s operations and that means the Group’smanagement may be less able to prevent a breach of the Virgin Rail Groupfranchise agreement.
Our UK Rail businesses are subject to complex contractual arrangements.Contractual management is an important part of our rail activities because theway in which contracts are managed can be a significant determinant offinancial performance.Compliance with franchise conditions is closely managed and monitored andprocedures are in place to minimise the risk of non-compliance.
3.10.7 Pension scheme fundingThe Group participates in a number of defined benefit pension schemes. Thereis a risk that the cash contributions required to these schemes increases ordecreases due to changes in factors such as investment performance, the ratesused to discount liabilities and life expectancies. Any increase in contributionswill reduce the Group’s cash flows.Decisions on pension scheme funding, asset allocation and benefit promisesare taken by management and/or pension scheme trustees in consultationwith trade unions and suitably qualified advisors. A Pensions OversightCommittee has been established comprising the Finance Director, a Non-Executive Director and other senior executives, to oversee the Group’s overallpensions strategy. The Board participates in major decisions on the fundingand design of pension schemes.
3.10.8 Insurance and claims environmentThe Group receives claims in respect of traffic incidents and employee claims.The Group protects itself against the cost of such claims through third partyinsurance policies. An element of the claims is not insured as a result of the“excess” on insurance policies.There is a risk that the number or magnitude of claims are not as expected andthat the cost to the Group of settling these claims is significantly higher orlower than expected. In the US, in particular, there is a risk that given the size ofthe “excess”, that a small number of large-value claims could have a materialimpact on the Group’s financial performance and/or financial position.The Group has a proactive culture that puts health and safety at the top of itsagenda and this helps mitigate the potential for claims arising. Where claimsdo arise, they are managed by dedicated insurance and claims specialists inorder to minimise the cost to the Group. Where appropriate, legal advice isobtained from appropriately qualified advisors. The balance between insuredand retained risks is re-evaluated at least once a year and insurance and claimsactivity is monitored closely.
3.10.9 Regulatory changes and availability of public funding
Public transport is subject to varying degrees of regulation across the locationsin which the Group operates. There is a risk that changes to the regulatoryenvironment could impact the Group’s prospects.Similarly, many of the Group’s businesses benefit from some form of financialsupport from government including direct financial support, the provision ofequipment, government contracts and concessionary fare schemes. There is arisk that the availability of sufficient government financial support changes dueto regulatory or other reasons. The UK Government’s stated policy to reducespending has increased the likelihood of this risk crystallising. The UK Bus(regional operations) profit for the year ended 30 April 2011 included £78.7m(2010: £80.m) of Bus Services Operators Grant, £231.4m (2010: £230.0m) ofconcessionary revenue and £101.8m (2010: £106.3m) of tendered and schoolbus revenue. In the UK, the study of the UK bus market by the competition authorities is anexample of a regulatory matter affecting our business. Whilst at this stage, wedo not expect this to have a material impact on the Group’s financialperformance or financial position, we continue to monitor developmentsclosely.
Management closely monitors relevant proposals for changes in the regulatoryenvironment and communicates the Group’s views to key decision makers andbodies. The Group actively participates in various industry and national tradebodies along with domestic and international government forums. The Groupseeks to maintain good, co-operative relationships with all levels ofgovernment, by developing and promoting ideas that offer cost effective waysof improving public transport.
3.10.10 Management and Board successionThe Group values the continued services of its senior employees, including itsDirectors and management who have operational, marketing, engineering,technical, project management, financial and administrative skills that areimportant to the operation of the Group’s business.
78189_Front FINAL_78189_StCchV10_FRONT 05/07/2011 11:38 Page 15

Operating and Financial Review
page 16 | Stagecoach Group plc
Succession planning for the Directors and senior management is an importantissue and as such is considered by the Nomination Committee (as described insection 8.3) and the Board. The appropriate level of management deals withrecruitment and retention of other staff.
3.10.11 DiseaseThere have been concerns in recent years about the risk of a swine flupandemic, which follows previous concerns over bird flu and SARS. There is arisk that demand for the Group’s services could be adversely affected by asignificant outbreak of disease. Such a fall in demand would have a negativeimpact on the Group’s revenue and financial performance. The Group hasplans in place to respond to any significant outbreak of disease.
3.10.12 Information technologyThe Group is reliant on information technology for sales, operations and backoffice functions. Information technology failures or interruptions couldadversely affect the Group.An increasing proportion of the Group's sales are made via the Internet. Thereis a risk that the Group's capability to make Internet sales either fails or cannotmeet levels of demand and the time taken to implement restorative actions isunacceptably long due to insufficient resource being available and/or overreliance on a small number of service providers. This risk could result insignificant levels of lost revenue at a time when the Group is investing inmegabus.com coach operations in North America, of which Internet sales is afundamental part. A significant and ongoing megabus.com website failurecould severely affect the megabus.com brand and also give a competitor anadvantage during the time of the failure.The Group is continually investing in its information technology systems,people and suppliers to ensure the robustness of its information technology.It is developing new Internet sales platforms and continues to look to ensurethat it secures reliable service provision.
3.10.13 Treasury risksDetails of the Group’s treasury risks are discussed in note 27 to theconsolidated financial statements, and include the risks arising frommovements in fuel prices.
3.11 Corporate social responsibilityResponsible business remains central to what we do every day – from theprinciples that underpin our business, to the way we support our employeesand the steps we take to engage with our stakeholders. The Group has published separate documents outlining its sustainabilitystrategy and its approach to corporate social responsibility. These documentsand additional information and case studies are provided on our website athttp://www.stagecoachgroup.com/scg/csr. As a result, this section includesexamples of our initiatives to illustrate our approach to these issues.We are a key part of communities in the UK and North America, providinglifeline transport services and significant job opportunities. People andpartnership are central to the success of our approach. Our focus is on growingour business sustainably, enhancing the communities in which we operate,delivering value to our shareholders and helping to meet the global challengeof climate change.Stagecoach Group is consistently rated highly against the other UK majortransport groups in comparative studies examining social, environmental andethical policies and performance. For the second time in three years, the Groupheaded the transport sector in the Britain’s Most Admired Companies awards.Stagecoach was rated in the top 20 companies in 2010 out of the full survey ofmore than 200 businesses assessed. The Group was ranked first in thetransport sector for the quality of goods and services, community andenvironmental responsibility, and use of corporate assets. Our corporate responsibility strategy focuses on a number of specific key areas:• Our people and our customers• Safety and security• Accessibility and affordability• Environmental performance• Building community relationships• Corporate governanceMany stakeholders are involved in the success of our business and informationon how we build relationships with them can be found on our website athttp://www.stagecoachgroup.com/scg/csr/stakeholders
During the past year, we have undertaken further initiatives to improve andmake a difference in many of these areas. The information below provides justa few highlights of our commitment in action.
3.11.1 New Code of Business ConductStagecoach Group has a set of core values and policies in a number of areas:how we deal with our employees, suppliers, customers, competitors, and thewider communities in which we work. These values apply to every director andemployee in all our companies across our global operations. The Board ofDirectors remains committed to ensuring the correct processes, controls,governance and culture exist to support the maintenance of these values andbehaviours.The Group will shortly finalise a new Code of Conduct setting out these keyprinciples and providing practical examples and advice to act as a guide toemployees’ corporate behaviour. The Code of Conduct will include informationon Stagecoach’s anti-corruption policy and programme, which is supported byits Board of Directors and overseen by the Group Company Secretary. TheBoard of Directors does not tolerate bribery or corruption and periodicallyassesses the risk of bribery and corruption. The new Code of Conduct will besupported by a communications programme to raise awareness amongemployees of the importance of living up to the Company's values.
3.11.2 Supporting and recognising our peopleOur Healthy Heart Bus initiative – the first of its kind in the UK – is continuingto benefit employees across the country. The voluntary heart health screeningprogramme for employees in our UK Bus division is delivered in partnershipwith the UK's largest independent hospital provider, BMI Healthcare. A busrefurbished as a mobile cardio-screening unit is touring our bus depots,providing free heart health check-ups for thousands of staff. During the year,we have extended the scope of the scheme to cover all UK Bus employeesregardless of length of service. Employees receive individual advice on ways toimprove their heart health and access further medical tests through their GP ifrequired.
We also believe it is important to recognise the excellent work our employeesdo across our operations in the UK and North America. This year, we extendedthe scope of our Stagecoach Champions recognition awards to cover newcategories. Gold, Silver and Bronze awards were presented for excellence in theareas of safety, environment, community, health, customer service andinnovation.
3.11.3 Promoting safety A commitment to the highest standards of safety is at the heart of ourbusiness. Public transport remains the safest way to travel and we have agood safety record. We have a proactive culture across the Group thatensures the health and safety of our customers and our employees is our toppriority and goes beyond strict adherence to legislative regulations. Health and safety is monitored and reported on across Stagecoach Group andimmediate action is taken to address issues in our business processes. OurHealth, Safety and Environmental Committee, chaired by a non-Executivedirector, considers these issues and monitors a range of relevant performanceindicators. It reports to the Board on these matters.
Our employees are provided with appropriate health and safety training andencouraged to report any concerns. We expect our suppliers and contractorsto have a similar commitment to complying with appropriate regulations inthis area.
In the UK, we have in place an engineering maintenance regime which isstricter than legal requirements and this is bolstered by a rolling programmeof operational and engineering audits at our depots. Trials have been conducted in North America of a device to support existingprocesses to promote safety among drivers on overnight duties. The “Nap-Zapper” device is clipped to the ear of a driver and emits a loud buzz if it detectssigns of driver fatigue. We have also undertaken analysis of lifestyle risks todrivers, including irregular sleep or work hours and poor exercise and diet. We were one of a number of bus operators who took part in a multi-agencyexercise in November 2010 to simulate the evacuation of New Jerseyresidents from New York City during a man-made or natural disaster.
78189_Front FINAL_78189_StCchV10_FRONT 05/07/2011 11:38 Page 16

Stagecoach Group plc | page 17
3.11.4 Affordable travelWe believe promoting affordable travel is a key part of driving modal shiftfrom the private car to greener, smarter public transport. During the yearended 30 April 2011, Stagecoach has extended the footprint of its budgettravel services in the UK and North America.megabus.com, our low-cost inter-city coach service, now covers around 60 locations in the UK and around afurther 60 locations in the United States and Canada. megabus.com in NorthAmerica won the Leading Provider of Outstanding Car Rental and Bus Dealscategory at the Travelzoo awards for the second year in a row, beating offcompetition from major global brands. Passengers can also use our discountrail service, megatrain.com, to travel for as little as £1 (plus booking fee) toaround 30 locations in the UK on the South West Trains, East Midlands Trainsand Virgin Trains networks. megabusplus.com, our innovative budget coachand rail service, has also expanded during the year. We continue to focus onoffering value-for-money local bus travel in our regional networks acrossthrough the UK. The Group is also investing in technology to make it easier forcustomers to find good travel deals. East Midlands Trains’ award-winningonline Best Fare Finder provides a quick and easy way for passengers to accessthe cheapest available fare for around 450 different UK train journeys.
3.11.5 Sustainable businessThe Group’s five-year sustainability strategy, launched in April 2010, isprogressing well and we have made further progress towards reaching ourgoals. We are investing £11m in a range of measures and have set specifictargets for each of our businesses. The Group is targeting an overall reduction of8% in buildings CO2e (carbon dioxide equivalent) emissions and a cut of 3% inannual fleet transport CO2e emissions by April 2014. It follows significantreductions already achieved in previous years. As well as ensuring we meet ourregulatory obligations, we believe our initiatives can help improve efficiency, cutcosts and contribute to the growth of our business.We held our third annual Green Week in May 2011 to drive forward awarenessof environmental issues in the UK and North America among employees andcustomers. As well as demonstrating the measures we are taking across theGroup, Green Week highlighted the environmental and financial benefits ofusing public transport. Green roadshows, events, competitions anddemonstrations were held at a number of the Group's bus and rail operations.Employees were also given the chance to put forward their own greensuggestions, while proceeds from fund-raising initiatives were donated toenvironmental charities.Stagecoach Group continues to take steps to ensure compliance with itsobligations under the Carbon Reduction Commitment Energy EfficiencyScheme. The Group’s achievement of the prestigious Carbon Trust Standard,which covers all of its UK operations, will give the business a higher ranking inthe performance league table. The Group intends to apply for recertification forthe Standard or an alternative standard certified by the Department of Energyand Climate Change during the year ending 30 April 2012.During the year ended 30 April 2011, the Group’s initiatives to reduce theimpact of its businesses on the environment have included:• a multi-million-pound investment in a hi-tech eco-driving system in the UK
designed to reduce fuel consumption and improve safety.The scheme alsooffers employees the chance to earn “green points” that are converted intofinancial benefits from a potential £900,000 annual bonus pot.
• leading the way on investing in greener vehicles, placing orders for morethan 140 hybrid electric buses which deliver a 30% reduction in carbonemissions compared to standard vehicles.
• launching a fleet of greener buses powered by household rubbish and animalwaste converted into biomethane.
• installing new ‘intelligent’ lighting systems at bus depots and at railwaystations, which use movement sensors to determine the amount of lightrequired.
• issuing bus drivers across the UK with fleece jackets made from recycledplastic bottles.
• investing £2.2m in a major regenerative braking project at South WestTrains. The technology, being installed on to more than 200 trains, returnselectricity to the third rail system, allowing trains in close proximity to drawon the electrical supply.
• using an innovative fuel additive to reduce fuel consumption at EastMidlands Trains, as well as testing an energy-saving train engine standbymode.
• introducing energy wardens and greener driver training measures at EastMidlands Trains.
• installing new energy efficient hand-driers in facility toilets in the UnitedStates, as well as water coolers which cut landfill waste by removing the needfor bottles.
• introducing energy saving lighting and schemes to recycle oil filters andaerosol cans at our Canadian operations.
The Group is working with industry partners and the UK Government onclimate change issues, including contributing to the development of policies onadapting infrastructure to mitigate the impacts of climate change. Stagecoachis also seeking more pro-bus and coach policies through the Greener Journeyscampaign (www.greenerjourneys.com) and highlighting the need to tackleenergy security risks through its work as part of the UK Industry taskforce onPeak Oil and Energy Security (www.peakoiltaskforce.net).We continue to report annually through our website on our carbon footprintand our progress in reaching our carbon reduction targets. In addition, wedisclose details of our strategy and performance through the Carbon DisclosureProject ("CDP"), the world’s largest corporate greenhouse gas emissionsdatabase. The Group is the only UK public transport group in the FTSE350selected for the CDP’s Carbon Disclosure Leadership Index.Stagecoach has received further independent recognition in the past year for itsenvironmental initiatives. It won the Travel and Transport category at the 2010Green Business Awards for its innovative Bio-bus scheme in Kilmarnock wherea fleet of buses run on 100% sustainable biofuel made from used cooking oiland other food industry by-products. Stagecoach was also a finalist in theCompany of the Year category at the 2011 BusinessGreen Leaders Awards, whilewhile the Chief Executive, Sir Brian Souter, was shortlisted as Leader of the Year.
3.11.6 Supporting community projectsWe help local people share in our success by funding the vital work of local,national and international charities. During the year ended 30 April 2011,£0.6m (2010: £0.6m) was donated by the Group to help many worthwhilecauses, including many health charities and local community projects. The Group has provided financial support for the road safety charity, Brake, aswell as the Railway Children, which works for runaway and abandoned childrenwho live in or around the world's railway stations. Our funding is also helpingsupport the work of the National Rail Chaplaincy Service, whose welfare supportis available to all current and retired rail staff members, their families and thetravelling public. During the year, we have made significant donations to Marie Curie CancerCare’s Big Build Appeal, Down’s Syndrome Scotland and Help for Heroes, whichraises money to support members of the Armed Forces who have beenwounded in the service of their country.We have also provided backing for dozens of smaller initiatives, as well asoffering match funding to complement many fund-raising activities by ouremployees for national campaigns or local good causes.
3.11.7 Corporate GovernanceStagecoach Group is committed to the principles of good corporategovernance, as described in section 6.
3.11.8 Further informationFull details of our corporate social responsibility strategy and further case studiescan be found on the Stagecoach Group website athttp://www.stagecoachgroup.com/scg/media/publications/policydocs/csr-strategy.pdfA copy of the Group’s sustainability strategy is available online athttp://www.stagecoachgroup.com/scg/media/publications/policydocs/sustainability_strategy_v2.pdf.Annual updates on our environmental measures and performance are availableat http://www.stagecoachgroup.com/scg/csr/environment/performance/.
78189_Front FINAL_78189_StCchV10_FRONT 05/07/2011 11:38 Page 17

4 Directors’ biographiesDetails of corporate governance, including the operation of the Board of Directors, are given in section 6 of this Annual Report. A brief biography of each director is given below.
4.1
4.3
4.9
4.6
4.8
4.5
4.2
4.4
4.7
Executive Directors4.1 Sir Brian SouterPosition: Chief ExecutiveAppointment to the Board: n/a (co-founder)Age: 57Committee Membership: None.External appointments: Chairman, Souter Investments.Previous experience: A Chartered Accountant, Sir Brian co-founded Stagecoach, Scottish plc of the year 2008. Sir Brian was named Businessman of the year at the Insider Elite Awards 2004.Executive responsibilities: Sir Brian is the architect of the Group’s strategy and philosophy. He has extensive knowledge of the ground transportation industry around the world and is responsible for managing all of the Group’s operations.
4.2 Martin GriffithsPosition: Finance DirectorAppointment to the Board: 2000Age: 45Committee Membership: Pension Oversight and Health, Safety and Environmental. External appointments: Virgin Rail Group (Co-Chairman), Robert Walters plc (Senior Independent Non-Executive Director), AG Barr plc (Non-Executive Director).Previous experience: A Chartered Accountant, Martin Griffiths is a member and former Chairman of the Group of Scottish Finance Directors and former Director of Troy Income & Growth Trust plc, Trainline Holdings Limited, RoadKing Infrastructure (HK) Limited and Citybus (HK) Limited. He was young Scottish Finance Director of the year in 2004.Executive responsibilities: Martin Griffiths is responsible for the Group’s overall financial policy, taxation, treasury, employee benefits and pensions management. He supports the Chief Executive in all aspects of the management of the Group’s operations and new business development.
o
o
o
a
(
u N
a
i
a
page 18 | Stagecoach Group plc
78189_Front FINAL_78189_StCchV10_FRONT 05/07/2011 11:39 Page 18

o s o
c
S
R
i
a o
Non-Executive Directors4.3 Sir George MathewsonPosition: Non-Executive ChairmanAppointment to the Board: 2006Age: 71Committee Membership: Nomination.External Appointments: Cheviot Asset Management (Chairman), Arrow global Ltd (Chairman), DBRS Inc (Board member).Previous Experience: Former Chairman of the Royal Bank of Scotland Group plc. Former Chief Executive of the Scottish Development Agency (now Scottish Enterprise). Former Director of Scottish Investment Trust plc. Former member of the Board of Directors of the Institute of International Finance. Former member of the Financial Reporting Council. Former Chairman of Wood Mackenzie Limited. Former Chairman of Council of Economic Advisors, Past President of the International Monetary Conference.
4.4 Ewan Brown CBEPosition: Non-Executive DirectorAppointment to the Board: 1988Age: 69Committee Membership: Pension Oversight (Chair) and Nomination.External appointments: Noble Grossart Holdings Ltd (Non-Executive Director), Royal Society of Edinburgh (Treasurer) Senior Governor of St Andrew University, Deputy Chair of the Edinburgh International Festival.Previous experience: Executive Director of Noble Grossart until 2003, a former Chairman of TIE and Lloyds TSB Scotland, Non-Executive Director of the Wood Group and Lloyds Banking Group plc, Chairman of Creative Scotland 2009 Limited.
4.5 Ann Gloag OBEPosition: Non-Executive DirectorAppointment to the Board: n/a (co-founder)Age: 68Committee Membership: Health, Safety and Environmental. External appointments: Mercy Ships (International Board Member).Previous experience: Ann Gloag co-founded Stagecoach and served as executive director until 2000.
4.6 Garry Watts MBE Position: Non-Executive Director (Senior Independent) Appointment to the Board: 2007 Age: 54 Committee Membership: Audit (Chair), Remuneration and Nomination. External appointments: Spire Healthcare Limited (Executive Chairman), Coca-Cola Enterprises, Inc (Non-Executive Director). Previous experience: A Chartered Accountant, Garry Watts is a former Chief Executive of SSL International plc, Non-Executive Director of the Medicines and Healthcare Products Regulatory Agency and Protherics plc and Executive Director of Celltech plc, Finance Director of Medeva plc and partner with KPMG.
4.7 Helen MahyPosition: Non-Executive DirectorAppointment to the Board: 2010Age: 50Committee Membership: Health, Safety and Environmental (Chair), Audit.External appointments: National Grid plc (Group Company Secretary and General Counsel, member of Executive Committee); advisory Board member of Opportunity Now.Previous experience: Former Non-Executive Director of Aga Rangemaster Group plc and Group General Counsel and Company Secretary of Babcock International Group PLC.
4.8 Phil White CBEPosition: Non-Executive DirectorAppointment to the Board: 2010Age: 61Committee Membership: Audit, Remuneration (Chair) and Health, Safety and Environmental.External appointments: Lookers plc (Non-Executive Chairman), Kier Group plc (Non-Executive Chairman), Unite Group plc (Non-Executive Chairman).Previous experience: A Chartered Accountant, Phil White served as Chief Executive of National Express Group plc from 1997 to 2006.
4.9 Will WhitehornPosition: Non-Executive DirectorAppointment to the Board: 2011Age: 51Committee Membership: Remuneration, Nomination.External Appointments: Loewy Group Ltd (Chairman), Scottish Exhibition Centre Ltd (Non-Executive Director), ILN Group Limited (Non-Executive Director). Member of the Science Technology Facilities Council and member of the First Minister of Scotland’s ‘GlobalScot’ business mentoring network.Previous Experience: Former President of Virgin Galactic and Brand Development and Corporate Affairs Director at Virgin Group. Former Non-Executive Chairman of Next Fifteen Communications Group plc.
Stagecoach Group plc | page 19
78189_Front FINAL_78189_StCchV10_FRONT 05/07/2011 11:39 Page 19

5. Directors’ report
5.1 Principal activity The Group’s principal activity is the provision of public transport services inthe UK and North America. A fuller description of the Group’s business isprovided in section 3.3 of this Annual Report.
5.2 Business reviewThe Group is required to produce a business review complying with therequirements of the Companies Act 2006. The Group has complied withthese minimum requirements as part of the Operating and Financial Review,which also provides significant information over and above the statutoryminimum. The Operating and Financial Review, which forms part of theDirectors’ report, is contained in section 3 of this Annual Report.
5.3 Group results and dividends The results for the year are set out in the consolidated income statement onpage 41.
An interim dividend of 2.2p per ordinary share was paid on 9 March 2011.The Directors recommend a final dividend of 4.9p per share, making a totaldividend of 7.1p per share in respect of the year ended 30 April 2011. Subjectto approval by shareholders, the final dividend will be paid on 5 October 2011to those shareholders on the register on 2 September 2011.
5.4 Directors and their interests The names, responsibilities and biographical details of the current membersof the Board of Directors appear on pages 18 and 19. Janet Morgan and IainDuffin left the Board on 30 June 2010. Bob Speirs left the Board on31 December 2010. Will Whitehorn joined the Board on 1 May 2011. Theparticipation in full Board meetings and meetings of committees for alldirectors who served during the year is provided on page 26. Table A showsthe current directors' interests in the Company’s shares.
Following the introduction of the Financial Reporting Council’s UK CorporateGovernance Code in 2010, all members of the Board shall stand for electionor re-election at every Annual General Meeting, including the Annual GeneralMeeting to be held in 2011:
The Board reviews its development plans at least annually as part of itsperformance evaluation. The assessment involves a consideration of thebalance of skills, knowledge and experience of the Directors. The Board alsoconsiders whether the Directors have sufficient time to properly dischargetheir duties, which includes a consideration of any other appointments thateach director has. The Board believes that the performance of each directorcontinues to be effective and that they continue to demonstratecommitment to their respective roles. The Board therefore considers it isappropriate that each of the directors be elected or re-elected at the 2011Annual General Meeting.
Ewan Brown has an indirect interest in the share capital of the Company. Heand his connected parties own approximately 22% (2010: 22%) of theordinary shares of Noble Grossart Holdings Limited, which in turn through itssubsidiary, Noble Grossart Investments Limited, held 4,084,999 shares in theCompany at 30 April and 29 June 2011 (2010: 4,084,999).The Listing Rules of the Financial Services Authority (LR 9.8.6 R(1)) requirelisted companies to disclose in their Annual Reports the interests of each
director. The Directors’ interests set out in Table A above have beendetermined on the same basis as in previous years and are intended to complywith the requirements of LR 9.8.6 R(1), which is not the basis used todetermine voting rights for the purposes of notifying major interests in sharesin accordance with the Disclosure and Transparency Rules of the FinancialServices Authority. Accordingly, the interests of Sir Brian Souter and Ann Gloagshown below do not represent their voting rights determined in accordancewith the Disclosure and Transparency Rules which as at 30 April 2011 were99,757,689 (2010: 99,651,620) and 66,477,292 (2010: 66,426,031)respectively.
Full details of options and other share based awards held by the Directors at30 April 2011 are contained in the Directors’ remuneration report on pages 32to 38. No Non-Executive Director had an interest in share options or theExecutive Participation Plan at 30 April 2010, 23 June 2010, 30 April 2011 and29 June 2011.
In addition to their individual interests in shares, Sir Brian Souter and MartinGriffiths are potential beneficiaries of the Stagecoach Group Employee BenefitTrust 2003, which held 1,854,213 (2010: 2,003,075) ordinary shares of56/57th pence each as at 30 April 2011. Martin Griffiths is also a potentialbeneficiary of the Stagecoach Group Qualifying Employee Share Trust(“QUEST”), which held 333,372 (2010: 333,372) ordinary shares of 56/57thpence each as at 30 April 2011.
No director had a material interest in the loan stock or share capital of anysubsidiary company.
5.5 Indemnification of directors and officersThe Company maintains Directors’ and Officers’ Liability Insurance in respectof legal action that might be brought against its directors and officers. Inaccordance with the Company’s Articles of Association, and as permitted bylaw, the Company has indemnified each of its directors and other officers ofthe Group against certain liabilities that may be incurred as a result of theirpositions with the Group. In May 2010, the indemnities were extended to thefullest extent permitted by law.
5.6 Substantial shareholdings By 29 June 2011 (being the latest practical date prior to the date of this report),the Company had been notified of the following major interests in votingrights in the Company (other than certain Directors’ shareholdings details ofwhich are set out in section 5.4 of this report):
Standard Life Investments Ltd 6.15%Aegon UK Group of Companies 5.04%Blackrock Inc 4.90%JPMorgan Chase & Co 4.74%Legal & General Group plc 3.99%
5.7 Employment policiesThe Group employs around 34,000 people.The Group strives to meet its business objectives by motivating andencouraging its employees to be responsive to the needs of its customers andto maintain and, where possible, improve operational performance. The Groupis also committed to providing equality of opportunity to employees. Thisapplies to appropriate training, career development and promotionopportunities for all employees regardless of physical disability, gender, sexualorientation, religion, belief, age, nationality, race or ethnic origin. The Groupgives full consideration to applications for employment from disabled personswhere a disabled person can adequately fulfil the requirements of the job.Where existing employees become disabled, it is the Group’s policy whereverpracticable to provide continuing employment under normal terms andconditions and to provide training, career development and promotion todisabled employees wherever appropriate.
The Group is committed to employee participation and uses a variety ofmethods to inform, consult and involve its employees. Employees participatedirectly in the success of the business through the Group’s bonus and otherremuneration schemes and are encouraged to invest through participation inshare option schemes.
page 20 | Stagecoach Group plc
Sir Brian Souter 108,625,564 108,574,304Martin Griffiths 202,337 200,160Ewan Brown See below See belowAnn Gloag 78,192,161 78,125,900Sir George Mathewson 35,800 35,800Helen Mahy 5,749 5,691Garry Watts 20,000 20,000Phil White 5,088 5,088Will Whitehorn (holding onappointment on 1 May 2011 and29 June 2011) 90,361 n/a
TABLE A
30 April and 30 April and29 June 2011 24 June 2010
Number of ordinary shares
78189_Front FINAL_78189_StCchV10_FRONT 05/07/2011 11:39 Page 20

The Group periodically arranges meetings that bring together representativesfrom management and trade unions. Discussions take place regularly with thetrade unions representing the vast majority of the Group’s employees on awide range of issues. The Group also produces a range of internal newslettersand information circulars that keep employees abreast of developments.Employees are encouraged to discuss matters of interest to them and subjectsaffecting day-to-day operations of the Group with management.
The Group is committed to developing a culture of openness across all itsbusinesses and ensuring the highest standards of probity and accountability.The Board actively encourages employees with serious concerns about theinterests of others or the Group to come forward. The Group has a policy inplace called ‘‘Speaking Up” which is designed to ensure processes existwhereby employees can raise serious concerns constructively without fear ofvictimisation, subsequent discrimination or disadvantage.
5.8 Statement of Directors’ responsibilities inrespect of the Annual Report, the Directors’remuneration report and the financialstatementsThe Directors are responsible for preparing the Annual Report, the Directors’remuneration report and the consolidated and the parent company financialstatements in accordance with applicable law and regulations.
Company law requires the Directors to prepare financial statements for eachfinancial year. Under that law the Directors have elected to prepare theconsolidated financial statements in accordance with International FinancialReporting Standards (“IFRSs”) as adopted by the European Union, and theparent company financial statements and the Directors’ remuneration reportin accordance with applicable law and United Kingdom Accounting Standards(United Kingdom Generally Accepted Accounting Practice). Under companylaw the Directors must not approve the financial statements unless they aresatisfied that they give a true and fair view of the state of affairs of theCompany and the Group and of the profit or loss of the Group for that period.
In preparing those financial statements, the Directors are required to:
• select suitable accounting policies and then apply them consistently;
• make judgements and estimates that are reasonable and prudent;
• state whether IFRSs as adopted by the European Union, and applicable UKAccounting Standards have been followed, subject to any materialdepartures disclosed and explained in the consolidated and parentcompany financial statements respectively; and
• prepare the consolidated and parent company financial statements on thegoing concern basis unless it is inappropriate to presume that the Group oras the case may be, the Company, will continue in business
The directors are responsible for keeping adequate accounting records that aresufficient to show and explain the Company’s transactions and disclose withreasonable accuracy at any time the financial position of the Company and theGroup and enable them to ensure that the financial statements and theDirectors’ remuneration report comply with the Companies Act 2006 and, asregards the Group financial statements, Article 4 of the IAS Regulation. Theyare also responsible for safeguarding the assets of the Company and the Groupand hence for taking reasonable steps for the prevention and detection offraud and other irregularities.
The Directors are responsible for the maintenance and integrity of financialinformation on the Company’s corporate website, www.stagecoachgroup.com.Legislation in the United Kingdom governing the preparation anddissemination of financial statements may differ from legislation in otherjurisdictions.
Each of the Directors, whose names and functions are listed in section 4 ofthe annual report confirm that, to the best of their knowledge:
• the consolidated financial statements, which have been prepared inaccordance with IFRSs as adopted by the EU, give a true and fair view ofthe assets, liabilities, financial position and profit of the Group; and
• the Directors’ report contained in sections 3 to 5 of this Annual Reportincludes a fair review of the development and performance of the businessand the position of the Group, together with a description of the principalrisks and uncertainties that it faces.
5.9 Conflicts of interestUnder the Companies Act 2006, a director has a statutory duty to avoid asituation where he or she has, or can have, a direct or indirect interest thatconflicts, or may possibly conflict, with the relevant company’s interests. TheCompanies Act 2006 allows directors of public companies to authoriseconflicts and potential conflicts where appropriate, if the relevant company’sarticles of association contain a provision to this effect. The Company’sarticles of association give the Directors authority to approve conflictsituations including other directorships held by the Directors.
There are safeguards in place that apply when the Directors decide whether toauthorise a conflict or potential conflict. Firstly, only the Directors who haveno interest in the matter being considered are able to take the relevantdecision and secondly, in taking any decision, the Directors must act in a waythat they consider, in good faith, will be most likely to promote theCompany’s success. The Directors are able to impose limits or conditionswhen giving authorisation if they think that this is appropriate.
From the period from 1 May 2010 until the date of this report, the Boardconsiders that the Directors’ powers of authorisation of conflicts haveoperated effectively and those procedures set out above have been properlyfollowed.
5.10 Suppliers payment policy and practiceIt is the Group’s policy to agree appropriate terms of payment with suppliersfor each transaction or series of transactions, and to abide by those termsbased on the timely submission of satisfactory invoices. The policies followedby each of the major UK operating subsidiaries are disclosed in the financialstatements of those companies. The Company normally settles trade creditorson 30 to 45 day terms. For the Group as a whole, the trade creditorsoutstanding at the year end represented 36 days’ purchases (2010: 35 days).
5.11 Land and buildings In the opinion of the Directors, there is no material difference between theopen market value of the Group’s interest in land and buildings and its netbook value.
5.12 Financial risk managementInformation regarding the Group’s use of financial instruments, financial riskmanagement objectives and policies and exposure to price, credit, liquidity andcash flow risks can be found in note 27 to the consolidated financialstatements.
5.13 Charitable and political contributions The Group made charitable donations of £0.6m (2010: £0.6m) during theyear.
It is the Group’s policy not to make political contributions and, accordingly,there were no contributions for political purposes during the year (2010: £Nil).
5.14 Authority for company to purchase its own shares
At the 2010 Annual General Meeting, the Company was granted authority byits shareholders to repurchase up to 72,006,618 of its ordinary shares. Duringthe year, no ordinary shares were repurchased. Under the existing authority,the Company may therefore repurchase up to 72,006,618 ordinary shares.This authority will expire at the conclusion of the 2011 Annual GeneralMeeting unless revoked, varied or renewed prior to this date.
A resolution will be proposed at the next Annual General Meeting that theCompany be authorised to repurchase up to approximately 10% of its ordinaryshares at the Directors’ discretion. If passed, the resolution will replace theauthority granted at the 2010 Annual General Meeting and will lapse at theconclusion of the 2012 Annual General Meeting.
Stagecoach Group plc | page 21
78189_Front FINAL_78189_StCchV10_FRONT 05/07/2011 11:39 Page 21

Directors’ report
5.15 Shareholder and control structureAt 30 April 2011, the Company’s issued share capital comprised two classes ofshares, referred to as “ordinary shares” and “B shares”.
As at 30 April 2011, there were 720,124,950 (2010: 720,066,186) ordinaryshares in issue with a nominal value of 56/57th pence each. The ordinaryshares are admitted to trading on the London Stock Exchange.
On a show of hands at a general meeting of the Company, every holder (andproxy) of ordinary shares present in person and entitled to vote shall have onevote (except that in certain circumstances a proxy may have one vote “for” andone vote “against”) and on a poll, every member present in person or by proxyand entitled to vote shall have one vote for every ordinary share held. Thenotice of a general meeting will specify any deadlines for exercising votingrights in respect of the meeting concerned.
The holders of ordinary shares are entitled to be paid the profits of theCompany available for distribution and determined to be distributed pro-ratato the number of ordinary shares held.
There are no restrictions on the transfer of ordinary shares other than:
• certain restrictions may from time to time be imposed by laws andregulations (for example, insider trading laws);
• pursuant to the Listing Rules of the Financial Services Authority wherebycertain employees of the Group require the approval of the Company todeal in the Company’s securities; and
• shares held by employee benefit trusts may only be transferred by thosetrusts in accordance with the relevant trust deeds.
None of the ordinary shares in issue provide the holders with special controlrights.
As at 30 April 2011, there were 4,087,302 (2010: 5,187,055) B shares in issuewith a nominal value of 63 pence each. On 31 May 2011 all of the remaining BShares were redeemed at their nominal value of 63p per share.
Section 5.6 of this Directors’ report gives details of any shareholders (otherthan the Directors) that hold major interests in the voting rights in theCompany.
Details of each director’s interests in the share capital of the Company aregiven in section 5.4 of this Directors’ report. Two directors of the Company,Sir Brian Souter and Ann Gloag, who are siblings were interested in 25.9% ofthe ordinary shares in issue as at 30 April 2011 (2010: 25.9%). The otherdirectors of the Company held less than 0.1% of the ordinary shares in issue asat 30 April 2011 (2010: less than 0.1%).
In addition to the Directors’ individual interests in shares, two employeebenefit trusts held a further 0.3% of the ordinary shares in issue as at 30 April2011 (2010: 0.3%). The shares held by the trusts are for the benefit ofemployees of the Group, and the voting rights are exercised by the trustees.
The Company is not aware of any agreements between shareholders that mayresult in restrictions on the transfer of securities and/or voting rights.
Directors are elected by ordinary resolution at a general meeting of holders ofordinary shares. The Directors have the power to appoint a director but anyperson so appointed by the Directors shall hold office only until the nextannual general meeting and shall then be eligible for election by ordinaryresolution at that meeting.
The Company’s Articles of Association may only be amended by specialresolution at a general meeting of holders of ordinary shares.
The powers of the Directors to issue or repurchase ordinary shares are set byan ordinary resolution at a general meeting of holders of ordinary shares.Section 5.14 of this Directors’ report sets out the current authority for theCompany to purchase its own shares.
There are a number of agreements that take effect, alter or terminate on achange of control of the Company such as commercial contracts, bank loanagreements and employee share plans. The most significant of these are:
• The Group operates the South Western Trains and East Midlands Trains railfranchises. The Group’s joint venture, Virgin Rail Group, operates the WestCoast Trains franchise. The franchise agreements in respect of these threefranchises each contain provisions that would enable the Department forTransport to terminate the franchises on a change of control of thefranchise.
• Each of the three rail franchises referred to above lease trains. The leasesgenerally contain termination rights for the benefit of the lessor on achange of control of the Group.
• The Group’s bank facilities (including asset finance) contain provisions thatwould require repayment of outstanding borrowings and other drawingsunder the facilities following a change of control of the Group.
• The Group’s arrangements with surety companies for the issue of railperformance bonds and season ticket bonds would terminate following achange of control of the Group.
• The Company’s £400m 5.750% Guaranteed Bonds due 2016 containprovisions that would require repayment of the outstanding bondsfollowing a change of control of the Group that was accompanied by aspecified downgrade of certain of the Company’s credit ratings.
The impact of a change of control of the Group on remunerationarrangements is explained in section 10.19.
page 22 | Stagecoach Group plc
78189_Front FINAL_78189_StCchV10_FRONT 05/07/2011 11:39 Page 22

At 30 April 2011, the Company had 720,124,950 ordinary shares in issue. The cumulative shares issued on a non pre-emptive basis as a percentage of theordinary shares in issue at 30 April 2011 were:
Year ended 30 April 2011 <0.1%Three years ended 30 April 2011 0.3%Five years ended 30 April 2011 2.7%
During the year ended 30 April 2008, the ordinary shares of the Company were consolidated with 9 shares issued for every 14 shares previously held. Noadjustments have been made to the shares issued as shown in the table above to take account of the consolidation.
5.17 Post balance sheet eventsOn 31 May 2011, all of the remaining 4,087,302 redeemable ‘B’ preference shares were redeemed at their nominal value of 63p per share. No redeemable ‘B’preference shares remain in issue.
5.18 Going concernOn the basis of current financial projections and the facilities available, the Directors are satisfied that the Group has adequate resources to continue for theforeseeable future and, accordingly, consider it appropriate to adopt the going concern basis in preparing the financial statements. As part of the assessment ofgoing concern, executive management provided a paper to the Audit Committee covering matters such as financial projections, sensitivity analysis, availabledebt facilities, credit ratings, financial risk management and bank covenants. The Board’s assessment of going concern takes account of its view of the principalbusiness risks facing the Group. Section 3.8.9 of this Annual Report comments on liquidity, a key element of the Directors’ assessment of going concern.
5.19 Auditors In the case of each of the persons who were directors of the Company at the date when this report was approved:
• so far as each of the Directors is aware, there is no relevant audit information (as defined in section 418 of the Companies Act 2006) of which the Company’sauditors are unaware; and
• each of the Directors has taken all the steps that he/she ought to have taken as a director to make himself/herself aware of any relevant audit information (asdefined) and to establish that the Company’s auditors are aware of that information.
A resolution to re-appoint PricewaterhouseCoopers LLP as auditors to the Company will be proposed at the next Annual General Meeting. A resolution will alsobe proposed that the Directors be authorised to fix the remuneration of the auditors.
By order of the Board
Ross PatersonCompany Secretary
29 June 2011
Stagecoach Group plc | page 23
Shares issued on anon pre-emptive basisin connection with
employeee share schemesYear ended 30 April
2011 58,764 720,066,186 <0.1%2010 587,752 719,478,434 0.1%
2009 1,333,135 718,145,299 0.2%
Total last 3 years 1,979,651 0.3%
2008 10,360,416 1,100,998,707 0.9%
2007 7,398,394 1,093,600,313 0.7%
Total last 5 years 19,738,461 1.9%
Shares issued on a nonpre-emptive basis as a percentage
of shares in issue
Shares in issue at start of year
5.16 Disapplication of pre-emption rightsThe Company seeks approval at least annually from its shareholders for the disapplication of pre-emption rights. The approval sought is generally to disapplypre-emption rights in respect of the issue of equity securities for cash up to approximately 5% of those in issue. The following ordinary shares have been issuedon a non pre-emptive basis over the last five years:
78189_Front FINAL_78189_StCchV10_FRONT 05/07/2011 11:39 Page 23

Date of Independentappointment Non-if later than Independent Executive Other1 May 2010 Chairman Director Director
6.1 IntroductionThe Stagecoach Board is accountable to shareholders for the Group’sactivities and is responsible for the effectiveness of corporate governancepractices within the Group. This section of the report sets out StagecoachGroup’s corporate governance arrangements. It also includes the disclosuresrecommended by the Financial Reporting Council (“FRC”) Combined Code onCorporate Governance (the “Combined Code”), and describes how theprinciples of good corporate governance that are set out in the CombinedCode have been applied. In line with best practice, separate reports areprovided from each of the Audit Committee, Nomination Committee,Health, Safety and Environmental Committee and Remuneration Committee.
The Stagecoach Board is committed to maintaining a corporate governancestructure appropriate to the Group and its strategy. Good corporategovernance remains central to delivering the Group’s objectives. As explainedlater in this report, we have again reviewed the effectiveness of the Board andits Committees and we consider the corporate governance structure toremain appropriate for the Group.
6.2 Compliance with the Combined CodeThe FRC issued the current edition of the Combined Code in June 2008,which applies to accounting periods beginning on or after 29 June 2008 andis available on the FRC’s website athttp://www.frc.org.uk/corporate/combinedcode.cfm. The Directors believethat throughout the year ended 30 April 2011 the Group complied with all ofthe recommendations of the Combined Code. The Group also complies withthe corporate governance requirements of the Financial Services Authority’sListing Rules, and Disclosure and Transparency Rules.
In May 2010, the FRC renamed the Combined Code as the UK CorporateGovernance Code and made changes to it. This new edition of the Code (the“2010 Code”) applies to the Company’s financial year that began on 1 May2011. Where appropriate, this report sets out changes made to comply withthe 2010 Code.
Janet Morgan and Iain Duffin left the Board on 30 June 2010. Robert Speirsleft the board on 31 December 2010.
The Combined Code suggests that independent non-executive directorsshould make up at least half of the Board (excluding the Chairman).Throughout the period from 1 May 2010 to 30 April 2011, the Boardconsiders that it complied with this Combined Code requirement. The currentposition is shown in the above table. In determining the independence of non-executive directors, the Boardconsiders a number of factors. In particular the Board satisfies itself on thefollowing questions:
• Does the director provide a robust and effective challenge to executivemanagement?
• Is the director prepared to challenge others’ beliefs, assumptions andviewpoints for the overall good of the Group and its shareholders?
• Does the director effectively contribute to constructive debate by theBoard and its Committees?
• Is the director willing to defend his or her own beliefs and viewpoints forthe overall good of the Group and its shareholders?
• Does the director have a sufficiently sound and detailed knowledge of theGroup’s business that enables him or her to effectively question strategyand executive management’s running of the business?
Ewan Brown, one of the five independent non-executive directors shown inthe above table, has served on the Board since 1988 and is a non-executivedirector of Noble Grossart, which is an advisor to the Company. The Companyrecognises and understands investor concerns over longer-serving non-executive directors but nevertheless continues to regard Ewan Brown asindependent. Ewan Brown’s long association with the Group enables him toprovide a robust and effective challenge to management because of thesound and detailed knowledge of the Group’s business that he has developed.The Board believes that Ewan Brown’s length of service, when taken in thecontext of the Board as a whole, enhances his effectiveness as a non-executive director and that he remains independent in character andjudgement. During the period from the resignation of Bob Speirs asChairman on 31 December 2010 until the appointment of Will Whitehorn asa non-executive director on 1 May 2011 the Board, excluding the Chairman,comprised seven directors of whom four, including Ewan Brown, wereconsidered by the Board to be independent. Without the inclusion of EwanBrown as independent, the majority of the Board would not have beenindependent during this period. Following the appointment of WillWhitehorn on 1 May 2011, five of the eight of the members of the Board,excluding the Chairman, are considered by the Board to be independent. .
In recognition of the factors suggested by the Combined Code fordetermining independence, Ewan Brown does not serve on theRemuneration Committee or the Audit Committee and stood for annualelection in 2010. Following the introduction of the 2010 Code, all directorswill stand for election or re-election at the 2011 Annual General Meeting.
6.4 Operation of the BoardThe Board is generally scheduled to meet six times each year. Additionalmeetings of the Board are held to consider matters arising between scheduledBoard meetings, where a decision of the Board is required prior to the nextscheduled meeting. In addition to the formal meetings of the Board and itsCommittees, the Directors are in more frequent but less formal contact witheach other and with the Group’s management on a range of matters.
The Chairman ensures that meetings of the Board and shareholders areproperly conducted and is responsible for setting and moving forward theBoard’s agenda. Leadership of the Board (by the Chairman) is not the same asthe leadership required (from the Group Chief Executive) to turn the Board’sstrategic and policy decisions into actions. The Group Chief Executive has day-to-day responsibility for all business of the Group and carries out the agreedstrategy and policies of the Board. The split of the Chairman’s and ChiefExecutive’s responsibilities is in writing and has been approved by the Board.
The Directors’ biographies appear on pages 18 and 19 of this Annual Reportand illustrate the Directors’ range of experience, which ensures an effectiveBoard to lead and control the Group. The Non-Executive Directors bring anindependent viewpoint and create an overall balance.
6. Corporate governance report
page 24 | Stagecoach Group plc
Sir George MathewsonChairman 3
Ewan BrownNon-Executive Director 3
Helen MahyNon-Executive Director 3
Garry WattsSenior IndependentNon-Executive Director 3
Phil WhiteNon-Executive Director 1 June 2010 3
Will WhitehornNon-Executive Director 1 May 2011 3
Ann GloagNon-Executive Director 3
Sir Brian SouterChief Executive 3
Martin GriffithsFinance Director 3
6.3 Composition of the BoardThe Company’s Board now comprises the following directors:
78189_Front FINAL_78189_StCchV10_FRONT 05/07/2011 11:39 Page 24

The Executive and Non-Executive Directors have a complementary range ofexperience that ensures no one director or viewpoint is dominant in thedecision-making process. The Chairman and the Non-Executive Directorsperiodically meet without the Executive Directors being present. In addition,the Non-Executive Directors, led by the Senior Independent Non-ExecutiveDirector, meet without the Chairman at least annually.
All the Directors meet regularly with other senior management and staff ofthe Group, have access to confidential advice from the Company Secretaryand may take independent legal or other professional advice at the Group’sexpense where it is considered necessary for the proper discharge of theirduties as directors. The Company Secretary, whose appointment and removalis a matter for the Board as a whole, is responsible to the Board for ensuringthe Board procedures are complied with.
All the Directors submit themselves for election by shareholders at theAnnual General Meeting following their appointment. Following theintroduction of the 2010 Code, all directors will stand for election or re-election at the 2011 Annual General Meeting and future Annual GeneralMeetings.
Each director receives induction training on appointment and subsequentlysuch training, briefings and site visits as are considered necessary to keepabreast of matters affecting their roles as directors. Training can encompasshealth, safety, environmental, social and governance matters. The Chairmanendeavours to ensure that all the Directors attend the Annual GeneralMeeting, providing an opportunity for shareholders to meet the Directorsand to address questions to them.
The number of full Board meetings during the year was six. The full Boardtypically meets once a year at an operational location and regularcommunication is maintained by the Chairman with other directors betweenmeetings to ensure all directors are well informed on strategic andoperational issues. In May 2011, the Board visited the Group’s NorthAmerican operations. Some of the Directors also attended health and safetymeetings of operating companies during the year. The Health, Safety andEnvironmental Committee visits operating locations around the Group togain greater understanding of the how the Group addresses health, safetyand environmental matters.
The Board has a number of matters reserved for its consideration, withprincipal responsibilities being to agree the overall strategy and investmentpolicy, to approve major capital expenditure, to monitor performance and riskmanagement procedures of senior management, to ensure that there areproper internal controls in place and to consider major acquisitions ordisposals. The Directors have full and timely access to information with Boardpapers distributed in advance of meetings. Notable matters that the Boardconsidered during the year ended 30 April 2011 included:• The acquisition of the East London Bus Group, completed in October 2010;• Approval of the new bank facilities committed to February 2016,
completed in February 2011;• Consideration of the ongoing Greater Anglia and West Coast rail franchise
bids;• Assessing the Group’s overall strategy in light of developments in the bus
and rail sector;• Reviewing the composition of the Board and agreeing the appointment of
new directors;• Evaluating the Group’s capital structure.
The Board keeps the roles and contribution made by each director underreview and changes in responsibilities are made where necessary to improvethe Board’s effectiveness. To provide a more manageable process and bettercontrol, certain of the Board’s powers have been delegated to committees.
Minutes are taken of each meeting of the Board and its Committees. Whereany director has significant concerns that cannot be resolved about therunning of the Group or a proposed action, these concerns are recorded inthe minutes. It is also the Group’s policy that where a director resigns, thedirector is asked to provide a written statement to the Chairman of anyconcerns leading to his or her resignation.
6.5 Operational management of the GroupThe Board delegates the operational management of the Group to the GroupChief Executive and Group Finance Director (“Executive Directors”). TheExecutive Directors maintain day-to-day contact and meet regularly face-to-face or in video conferences with non-board senior management. There arethree principal operating divisions (UK Bus: headed by a Managing Director,North America: headed by a Chief Operating Officer and UK Rail: headed by theExecutive Directors,) which each comprise a varying number of autonomousbusiness units, each headed by a chairman or managing director who isresponsible for the day-to-day performance of the business unit. Each chairmanor managing director is supported by his/her own management teams.
Two of the joint ventures in which the Group has an interest, Virgin RailGroup and Twin America LLC, are managed independently of the Group. Eachis headed by its own Chief Executive. The Group has two representatives onthe Board of Virgin Rail Group and three representatives on the Board of TwinAmerica LLC. The other trading joint venture in which the Group has aninterest, Scottish Citylink Coaches Limited, has a joint board. The Group isresponsible for the day-to-day management of that business.
6.6 Performance evaluationThe Board assesses its own performance and the performance of eachindividual Board members; this assessment is co-ordinated and directed by theChairman with the support of the Company Secretary. The Senior IndependentNon-Executive Director co-ordinates the Board’s assessment of theperformance of the Chairman. As part of the assessment process, the Non-Executive Directors meet without the Executive Directors being present. TheNon-Executive Directors also meet without the Chairman being present. TheChairman obtains feedback from each individual director on the performanceof the Board and other Board members – this involves the completion of aquestionnaire and a follow-up discussion. In the same way, the SeniorIndependent Non-Executive Director obtains feedback from each individualdirector on the performance of the Chairman. A similar process is undertakento assess the performance of each of the Board’s committees. From theeffective date of the 2010 Code, the Group plans to use external facilitation ofits performance evaluation no less frequently than every third year.
The Directors have reviewed the effectiveness of the Board as a whole and itscommittees. Each director has assessed the effectiveness of the Board andeach committee of which he or she is a member.
The assessment of effectiveness included consideration of:
• The effectiveness of the formal Board and committee meetings;
• The nature and extent of the Board’s interaction with the management ofthe Group;
• The timeliness, relevance and accuracy of the information provided to theBoard and its committees;
• The allocation of the Board’s time between differing priorities includingthe time spent on strategic considerations relative to other matters; and
• The composition of the Board and its committees.
The Board has considered the results of these assessments and has concludedthat overall the Board and its committees continue to operate in an effectiveand constructive manner.
Succession planning for the Chairman was identified as an important areaand the Nomination Committee oversaw the retirement of Bob Speirs, theappointment of George Mathewson as Chairman and the appointment ofWill Whitehorn as an additional Non-Executive Director.
Stagecoach Group plc | page 25
78189_Front FINAL_78189_StCchV10_FRONT 05/07/2011 11:39 Page 25

Corporate governance report
Audit Committee
Number of members of Committee: 3
All members are independent Non-Executive Directors.
Chairman and designated member with recent
and relevant financial experience
Garry Watts
Other members
Helen Mahy
Phil White
Nomination Committee
Number of members of Committee: 4
All members are independent Non-Executive
except Sir George Mathewson who is
Chairman of the Company
Chairman
Sir George Mathewson
Other members
Ewan Brown
Garry Watts
Will Whitehorn
Remuneration Committee
Number of members of Committee: 3
All members are independent Non-Executive Directors.
Chairman
Phil White
Other members
Garry Watts
Will Whitehorn
Health, Safety and Environmental Committee
Number of members of Committee: 4
Chairman
Helen Mahy
Other members
Martin Griffiths
Ann Gloag
Phil White
Health, SafetyPARTICIPATION Full Board Audit Remuneration and Environmental Nomination Annual GeneralIN MEETINGS meetings Committee Committee Committee Committee Meeting
Actual Possible Actual Possible Actual Possible Actual Possible Actual Possible Actual Possible
Robert Speirs 5 5 n/a n/a n/a n/a n/a n/a 1 1 1 1
Sir Brian Souter 6 6 n/a n/a n/a n/a n/a n/a n/a n/a 1 1
Martin Griffiths 6 6 n/a n/a n/a n/a 5 5 n/a n/a 1 1
Ewan Brown 6 6 n/a n/a n/a n/a n/a n/a 1 1 1 1
Iain Duffin 2 2 2 2 2 2 1 1 n/a n/a 0 0
Ann Gloag 5 6 n/a n/a n/a n/a 5 5 n/a n/a 1 1
Helen Mahy 6 6 3 3 n/a n/a 5 5 n/a n/a 1 1
Sir George Mathewson 6 6 n/a n/a 4 4 n/a n/a 1 1 1 1
Janet Morgan 2 2 2 2 n/a n/a 1 1 0 1 0 0
Garry Watts 6 6 4 4 4 4 n/a n/a 1 1 1 1
Phil White 5 5 2 2 2 2 3 4 n/a n/a 1 1
6.9 Individual director participation at meetingsThe following is a table of participation in full Board meetings, meetings of committees and the Annual General Meeting by director during the year ended30 April 2011:
page 26 | Stagecoach Group plc
6.8 Reports from the CommitteesReports from each of the Committees of the Board are set out on pages 29 to 38 of this Annual Report.
6.7 Composition of CommitteesThe composition of the various Board Committees has been updated to reflect the changes in the composition of the Board, as summarised below:
78189_Front FINAL_78189_StCchV10_FRONT 05/07/2011 11:39 Page 26

6.10 Relations with shareholdersThe Board endeavours to present a balanced and understandable assessmentof the Group’s position and prospects in communications with shareholders.The Group holds periodic meetings with representatives of majorinstitutional shareholders, other fund managers and representatives of thefinancial media.
The programme of investor relations includes presentations in London of thefull-year and interim results and meetings with institutional investors in theUK and overseas. Investor and analyst feedback is sought after presentationsto ensure key strategies, market trends and actions being taken are beingeffectively communicated and shareholder objectives are known. Writtenresponses are given to letters or e-mails received from shareholders. Theannual report is published in hard copy and on the Group’s website.
The Board receives regular updates on the views of shareholders throughbriefings from the Chairman and the Executive Directors, reports from theCompany’s brokers and reports from the Company’s Financial PR consultants.The Senior Independent Non-Executive Director is available to shareholderswhere contact through the normal channels is inappropriate, or has failed toresolve concerns.
All shareholders are welcome to attend and participate at the Annual GeneralMeeting and any other general meetings. The Group aims to ensure that allthe Directors are available at the Annual General Meeting to answerquestions. The Annual General Meeting provides an opportunity forshareholders to question the Chairman and other directors on a variety oftopics and further information is provided at the Annual General Meeting onthe Group’s principal business activities. It is the Company’s policy to proposea separate resolution at the Annual General Meeting for each substantiallyseparate issue. Resolutions are taken on a show of hands and details of allproxy votes lodged forand against, or withheld, in respect of each resolutionare given to the meeting. Details of the proxy votes are also published on theGroup’s website athttp://www.stagecoachgroup.com/scg/ir/shareholder/agm/. The Companyand its registrars have established procedures to ensure that votes cast areproperly received and recorded.
6.11 Risk managementThe Group has an ongoing process for identifying, evaluating and managingthe significant risks that it faces. The Board regularly reviews the process.
The principal risks and uncertainties facing the Group are discussed on pages14 to 16.
The Board considers acceptance of appropriate risks to be an integral part ofbusiness and unacceptable levels of risk are avoided or reduced and, in somecases, transferred to third parties. Internal controls are used to identify andmanage risk. The Directors acknowledge their responsibility for establishingand maintaining the Group’s system of internal control, and for reviewing itseffectiveness. The Group’s system cannot provide absolute assurance but isdesigned to provide the Directors with reasonable assurance that any risks orproblems are identified on a timely basis and dealt with appropriately. TheGroup has established an ongoing process of risk review and certification bythe business heads of each operating unit.
Certain of the Group’s businesses are subject to significant risk. Each identifiedbusiness risk is assessed for its probability of occurrence and its potentialseverity of occurrence. Where necessary, the Board considers whether it isappropriate to accept certain risks that cannot be fully controlled or mitigatedby the Group.
The Group’s risk management process was embedded throughout thebusinesses for the whole of the financial year ended 30 April 2011 and up tothe date of the approval of this report. The Board has carried out a review ofthe effectiveness of the Group’s internal control environment and such reviewsare supported on an ongoing basis by the work of the Audit Committee. TheBoard is satisfied that processes are in place to ensure that risks areappropriately managed.
The Board has designated specific individuals to oversee the internal controland risk management processes, while recognising that it retains ultimateresponsibility for these. The Board believes that it is important that theseprocesses remain rooted throughout the business and the managing directorof each operating unit is responsible for the internal control framework withinthat unit.
Self-assessment of risk conducted by the Directors and senior management isongoing and has been considered at several levels, with each divisionmaintaining a separate risk profile.
The Group Risk Assurance (or internal audit) function, which is outsourced toand managed by Deloitte LLP, reports to the Audit Committee and is utilised inmonitoring risk management processes to determine whether internalcontrols are effectively designed and properly implemented. A risk-basedapproach is applied to the implementation and monitoring of controls. Themonitoring process also forms the basis for maintaining the integrity andimproving where possible the Group’s risk management process in the contextof the Group’s overall goals.
The Audit Committee reviews Group Risk Assurance plans, as well as externalaudit plans and any business improvement opportunities that arerecommended by the external auditors.
The Group’s risk management process does not specifically cover jointventures, but the Group maintains an overview of joint ventures' business riskmanagement processes through representation on the boards and in the caseof Virgin Rail Group, its audit committee. Stagecoach managementrepresentatives also meet regularly with representatives of joint ventures toensure that they follow appropriate risk management procedures.
6.12 Internal controlThe wider process described above and the key procedures noted below,enable the Directors to confirm that they have reviewed the effectiveness ofthe system of internal control of the Group during the year. The keyprocedures, which the Directors have established, are as follows:
• an annual budgeting process with periodic re-forecasting of out-turn,identifying key risks and opportunities. All budgets are presented to apanel consisting of executive directors and/or senior managers by eachbusiness unit’s management team, before being approved by the Board.
• reporting of financial information to the Board encompassing incomestatement, cash flow, balance sheet and key performance indicators. Groupmanagement monitors the results throughout each financial year.
• a Risk Assurance function which reviews key business processes andbusiness controls, reporting directly to the Audit Committee.
• third party reviews commissioned periodically by the Group of areas wheresignificant inherent risks have been identified, such as health and safety,treasury management, insurance provisioning, pensions strategy andcompetition policy.
• a decentralised organisational structure with clearly defined limits ofresponsibility and authority to promote effective and efficient operations.
• control over the activities of joint ventures through Stagecoachrepresentation on the boards of the entities together with regular contactbetween Stagecoach management and the management of the relevantentities.
• a performance management appraisal system, which covers the Group’ssenior management based on agreed financial and other performanceobjectives, many of which incorporate managing risk.
• significant emphasis on cash flow management. Bank balances arereviewed on a daily basis and cash flows are compared to budget on a four-weekly basis.
• reporting to the Board and/or its Committees on specific matters includingupdated key risks, taxation, pensions, insurance, treasury management,foreign exchange, interest and commodity exposures. The Board regulatestreasury management policies and procedures.
Stagecoach Group plc | page 27
78189_Front FINAL_78189_StCchV10_FRONT 05/07/2011 11:39 Page 27

• defined capital expenditure and other investment approval procedures,including due diligence requirements where material businesses are beingacquired or divested.
• each operating unit maintains internal controls and proceduresappropriate to the business. A written certificate is provided at leastannually by the management of each business confirming that they havereviewed the effectiveness of the system of internal control during theyear.
• a competition compliance programme, which the Board has approved andwhich is subject to regular monitoring.
Any control weaknesses that these procedures identify are monitored andaddressed in the normal course of business. None of the weaknessesidentified in the year to 30 April 2011 have resulted in any material losses,contingencies or uncertainties that would require disclosure in the Group’sAnnual Report. This process is considered to be an integral part of themaintenance and improvement of our risk management procedures.
6.13 Process for preparing consolidated financialstatements
The Group has established internal control and risk management systems inrelation to the process for preparing consolidated financial statements. Thekey features of these internal control and risk management systems are:
• The Risk Assurance function and management conducts various checks oninternal financial controls periodically.
• Management regularly monitors and considers developments inaccounting regulations and best practice in financial reporting, and whereappropriate, reflects developments in the consolidated financialstatements. Appropriate briefings and/or training are provided to keyfinance personnel on relevant developments in accounting and financialreporting. The Audit Committee is also kept appraised of suchdevelopments.
• A written certificate is provided annually by the management of eachbusiness unit confirming that the internal financial controls have beenreviewed and highlighting any departures from the controls system thatthe Group has determined to be appropriate practice.
• The financial statements of each business unit are subject to review by alocal finance manager prior to being submitted to the Group Financefunction.
• The financial statements of each business unit are subject to review by theGroup Finance function for unusual items, unexplained trends andcompleteness. Any unexplained items are referred back to localmanagement to explain.
• The Group Finance function compares the financial statements of eachbusiness unit to the management accounts received during the year andobtains explanations for any material differences.
• The Group’s consolidation, which consolidates the results of each businessunit and makes appropriate adjustments, is subject to various levels ofreview by the Group Finance function.
• The draft consolidated financial statements are reviewed by an individualindependent from those individuals who were responsible for preparingthe financial statements. The review includes checking internalconsistency, consistency with other statements, consistency with internalaccounting records and arithmetical accuracy.
• The Audit Committee and the Board review the draft consolidatedfinancial statements. The Audit Committee receives reports frommanagement and the external auditors on significant judgements,changes in accounting policies, changes in accounting estimates and otherpertinent matters relating to the consolidated financial statements.
• The financial statements of all material business units are subject toexternal audit.
The Group uses the same firm of auditors to audit all Group companies. TheGroup auditors review the audit work papers for material joint ventures thatare audited by a different firm of auditors.
6.14 Pension schemesThe assets of the Group’s pension schemes are held under trust, separatefrom the assets of the Group and are invested with a number of independentfund managers. There are eleven trustees for the principal UK scheme ofwhom three are employee representatives nominated by the members on aregional basis and two are pensioner trustees. The chairman of the trustees ofthe principal UK scheme is a professional trustee who served for eight years asa fund member elected representative on the National Association of PensionFunds’ investment council. He also sits independently as an electedrepresentative of all railway employers on the board of the Railways PensionScheme, of which he is the Trustee Chairman of the Railways Pension Schemetrustees. The other trustees of the principal UK scheme include senior Groupand UK Bus executives.
A Pensions Oversight Committee was in operation throughout the year. ThisCommittee is chaired by a non-executive director, Ewan Brown, and alsocomprises one executive director and other members of senior management.The Committee operates at a strategic level and its remit covers all mattersaffecting the Group’s pension schemes from the perspective of the Group’sshareholders and other stakeholders, and it will consider, develop andpropose recommendations to the Board in respect of such issues as mayarise. The Committee reviews pension scheme funding, investment strategy,risk management, internal controls surrounding pension matters and therelated administration for all of the employee pension schemes of the Group.
page 28 | Stagecoach Group plc
Corporate governance report
78189_Front FINAL_78189_StCchV10_FRONT 05/07/2011 11:39 Page 28

7.1 Composition of the Audit CommitteeThe membership of the Audit Committee is summarised in section 6.7. GarryWatts is the current Chairman of the Audit Committee and is a CharteredAccountant, a former audit partner, a former Finance Director and ChiefExecutive of FTSE 350 companies and is also a member of the auditcommittee of a large quoted (NYSE listed) company. He is competent in bothaccounting and auditing matters. The designated Committee member withrecent and relevant financial experience is therefore Garry Watts. Phil White isa former Finance Director and former Chief Executive of a FTSE 350 companyand is also a Chartered Accountant.
7.2 Operation of the Audit CommitteeThe Audit Committee met four times during the year and has also met afurther time in June 2011. The Committee retains discretion as to who fromoutside the Committee should attend its meetings but generally invites thefollowing to attend:• The Group Finance Director;• The Director of Finance & Company Secretary;• The Deputy Company Secretary, who is Secretary to the Committee;• Representatives from the external auditors;• Representatives from the Risk Assurance Function.In addition, the Group Tax Director is expected to present to the Committeeat least annually.Other directors, including the Chairman of the Company, are also welcome toattend meetings of the Committee and do so from time to time.The Committee receives reports from major business functions including theRisk Assurance Function (internal audit), which is outsourced and managedby Deloitte. It also receives reports from the external auditors. It considers thescope and results of the audit, the half-year and annual financial statementsand the accounting and internal control systems in place throughout theGroup. The Audit Committee reviews the cost effectiveness, independenceand objectivity of the internal and external auditors.The terms of reference of the Audit Committee are available on the Group’swebsite athttp://www.stagecoachgroup.com/scg/csr/corpgov/committees/audit.pdf
7.3 Review of External AuditorsThe Audit Committee has responsibility delegated from the Board for makingrecommendations on the appointment, reappointment, removal andremuneration of the external auditors. There have been no instances ofdisagreements between the Board and the Audit Committee relating to theexternal auditors.Subject to the annual appointment of auditors by the shareholders, the AuditCommittee conducts a continuous review of the relationship between theGroup and the auditors. This review includes:• the consideration of audit fees that should be paid and advance approval
of any other fees in excess of £50,000 per annum which are payable toauditors or affiliated firms in respect of non-audit activities;
• the consideration of the auditors’ independence and objectivity;• the nature and scope of the external audit and the arrangements which
have been made to ensure co-ordination where more than one audit firmor offices of the same firm are involved; and
• discussions on such issues as compliance with accounting standards.
The Committee formally assesses the effectiveness of the external auditprocess on an annual basis.
Whilst the Group has no set frequency for tendering the external audit, theGroup’s external audit was last tendered in 2002 and resulted in a change ofexternal auditors. The audit engagement partner last changed in 2006 andwill change again in 2011. The Group is not aware of any restrictions thatwould limit its choice of external auditors.
The Audit Committee, having considered the external auditors’ performanceduring their period in office, recommends re-appointment. The audit fees of£0.8m (2010: £0.7m) for PricewaterhouseCoopers LLP and non-audit related
fees of less than £0.1m (2010: £0.4m) were discussed by the AuditCommittee and considered appropriate given the current size of the Groupand the level of corporate activity undertaken during the year. TheCommittee believes that the level and scope of non-audit services does notimpair the objectivity of the auditors and that there is a clear benefit obtainedfrom using professional advisors who have a good understanding of theGroup’s operations. Other accounting or consulting firms have been usedwhere the Group recognises them as having particular areas of expertise orwhere potential conflicts of interest for the auditors are identified.
7.4 Policy on the Auditors Providing Non-Audit Services
Procedures in respect of other services provided by the auditors are:
• Audit related services – These are services that the auditors must undertakeor are best placed to undertake by virtue of their role as auditors. Suchservices include formalities relating to bank financing, regulatory reports,and certain shareholder circulars. The auditors would generally provide allsuch services.
• Tax consulting – It is the Group’s policy to select the advisor for eachspecific piece of tax consulting work who has the most appropriate skillsand experience for the work required. The Group uses a range of advisorsfor tax consulting, including the auditors where they are best suited to thework being undertaken.
• General consulting – For other consulting work, the Group will select anadvisor after taking account of the skills and experience required and theexpected cost of the work. The Group uses a range of advisors for generalconsulting, including the auditors where they are best suited to the workbeing undertaken. The auditors are only permitted to provide generalconsulting when the Group, the Audit Committee and the auditors aresatisfied that there are no circumstances that would lead to a threat to theaudit team’s independence or a conflict of interest that could not beeffectively mitigated.
7.5 Review of Risk Assurance FunctionThe Audit Committee has the responsibility for making recommendations onthe appointment, reappointment, removal and remuneration of the GroupRisk Assurance Function (internal auditors). There have been no instances ofdisagreements between the Board and the Audit Committee relating to theRisk Assurance Function.The Audit Committee conducts a continuous review of the relationshipbetween the Group and the Risk Assurance Function. This review includes aconsideration of independence and objectivity, the overall level of fees, thequality of the risk assurance process, and the role of the function in thecontext of the broader sources of risk assurance.The Committee formally assesses the effectiveness of the risk assurancefunction on an annual basis.
7.6 “Speaking Up” PolicyThe Audit Committee reviews the Group’s “Speaking Up” policy, whichprovides a mechanism for employees with serious concerns about theinterests of others or the Group to come forward. The Committee ensuresthat appropriate arrangements are in place to receive and act proportionatelyupon a complaint about malpractice. The Committee takes a particularinterest in any reports of possible improprieties in financial reporting. Anyknown instances of fraud affecting the Group are reported to the AuditCommittee.
Garry WattsChairman of the Audit Committee
29 June 2011
7. Audit Committee report
Stagecoach Group plc | page 29
78189_Front FINAL_78189_StCchV10_FRONT 05/07/2011 11:39 Page 29

8. Nomination Committee report
8.1 Composition of the NominationCommittee
The membership of the Nomination Committee is summarised in section6.7. The Committee also includes, by invitation, the other Non-ExecutiveDirectors, as necessary.
8.2 Operation of the Nomination CommitteeThe Nomination Committee is responsible for evaluating the balance of skills,knowledge and experience of the Board, and where appropriate suggestingnew appointments. Based on its assessment, the Committee will prepare adescription of the role and the required attributes for each particularappointment. The description will include a job specification, the estimate ofthe time commitment expected, and the Group’s policy on directors havingother significant commitments. Potential candidates will be asked to disclosetheir other commitments and confirm that they will have sufficient time tomeet what is expected of them. The Directors are also required to report anysignificant changes in their other commitments as they arise. The Committeewill identify suitable candidates and make proposals for each appointment,although final appointments are the responsibility of the Board as a whole.
Potential new non-executive directors are chosen based on a shortlistcompiled by the Nomination Committee taking account of known candidatesand candidates suggested by the Group’s advisors. For example, the selectionof the directors appointed to the Board over the last two years were madefollowing a recruitment process that involved the use of external recruitmentconsultants and the consideration of a number of candidates.
Non-executive directors receive a letter of appointment. For any newappointments, the letter of appointment sets out the expected timecommitment.
No Director of the Company is currently a chairman of a FTSE 100 company.
The terms of reference of the Nomination Committee are available on theGroup’s website at
http://www.stagecoachgroup.com/scg/csr/corpgov/committees/nom.pdf
Following the retirement of Robert Speirs as Chairman and his replacement asChairman by Sir George Mathewson, one of the Company’s independent non-executive directors, the appointment of Will Whitehorn as an additional non-executive director to the Board helps maintain the balance of skills andexperience of the Board. Will brings with him a background in branddevelopment and wide-ranging experience across a range of business sectorsthat will bring valuable insight to the Board.
8.3 Succession Planning ArrangementsThe Board and the Nomination Committee recognise the importance ofsuccession planning to ensure that the Group continues to prosper in thelonger term. The Group operates a decentralised organisational structure withclearly defined limits of responsibility and authority, and oversight from headoffice. This structure provides the opportunity for managers to develop insome of the Group’s smaller business units before progressing to wider andmore responsible roles. The Group has a history of developing good managerswho have progressed to take on senior positions within the Group. The Groupoperates a graduate recruitment programme, and some of the graduatesrecruited have gone on to become managing directors of individual businessunits, both in the UK and North America.
The Nomination Committee is mindful of the need to ensure appropriatesuccession arrangements are in place for the Directors. The NominationCommittee and the Board seeks to identify new directors and senior managersto ensure succession of directors is conducted in a managed way, withoutsignificant disruption to the ongoing business of the Group.
The succession of Sir George Mathewson as the Chairman of the Company,taking the place of Robert Speirs with effect from 1 January 2011, wasconsidered by the Committee and recommended to the Board. In the light ofSir George’s experience with and knowledge of the Group, the Committeeconsidered that he was the best candidate for the role.
The Committee also recognises that as co-founder of the Company, the ChiefExecutive has had a long and integral association with the Company. This closeassociation of Chief Executive and Company brings different challenges inplanning for the succession of the Chief Executive. Whilst the Committeerecognises that the Chief Executive remains committed to his role for theforeseeable future, it nevertheless reviews the succession plans for the ChiefExecutive and other executive management. Given the importance ofsuccession planning, the views of all directors are considered and not just theviews of the members of the Committee.
Sir George MathewsonChairman of the Nomination Committee
29 June 2011
page 30 | Stagecoach Group plc
78189_Front FINAL_78189_StCchV10_FRONT 05/07/2011 11:39 Page 30

9.1 Composition of the Health, Safety and Environmental Committee
The membership of the Health, Safety and Environmental Committee issummarised in section 6.7.
The terms of reference of the Health, Safety and Environmental Committeeare available on the Group’s website at http://www.stagecoachgroup.com/scg/csr/corpgov/committees/health07.pdf
9.2 Operation of the Health, Safety andEnvironmental Committee
The Committee considers health, safety and environmental issues across theGroup and reports to the Board on these matters. The Committee alsoapproves the Group’s overall strategic safety framework. It has access tointernal safety executives and also external consultants, where required.
Executive management is responsible for ensuring that local health andsafety policies and procedures are consistent with the overall framework.
Managers from each of the Group’s key divisions attend meetings of theCommittee, providing the Committee with an opportunity to question andchallenge management on health, safety and environmental matters. TheCommittee also receives reports from the Group’s Environmental StrategyGroup, which comprises a number of managers and is responsible foroverseeing the development and implementation of the Group’senvironmental strategy.
The Committee and its members visit operational locations to observehealth, safety and environmental management in practice. Committeemembers attend meetings of the Safety Committees of individual businessunits from time to time, such as the East Midlands Trains Board Safety SubCommittee.
The Committee reviews the Group’s analysis of health, safety andenvironmental risks and its strategies to address those risks. The Committeereceives reports on trends in health and safety indicators across the Group aswell as information on significant incidents involving the Group. Keyperformance indicators are provided and reviewed in respect of each majoroperating division. Training is provided to the Committee on health, safetyand environmental matters. The Committee liaises with the RemunerationCommittee in determining any health and safety objectives to form part ofthe Executive Directors’ personal objectives.
The safety and security of our customers, our people and others isfundamental to our business. Public transport is the safest way to travel andhealth and safety is at the top of our agenda.
Helen MahyChairman of the Health, Safety and Environmental Committee
29 June 2011
9. Health, Safety and Environmental Committee report
Stagecoach Group plc | page 31
78189_Front FINAL_78189_StCchV10_FRONT 05/07/2011 11:40 Page 31

80
85
90
100
105
110
115
120
125
130
Apr 10 May 10 Jun 10 Jul 10 Aug 10 Sep 10 Oct 10 Nov 10 Dec 10 Jan 11 Feb 11 Mar 11 Apr 11
The Board supports the principles of good corporate governance relating todirectors’ remuneration and has applied them as described below. Thoseparagraphs that have been audited have been highlighted as such.
10.1 Composition of the Remuneration Committee
The membership of the Remuneration Committee is summarised insection 6.7.The Committee has responsibility for approving the remuneration and termsof employment for the Executive Directors and the Chairman, includingpensions rights and any compensation payments for loss of office. TheRemuneration Committee also monitors and makes appropriaterecommendations with respect to the remuneration of other seniormanagement.The Committee retained Addleshaw Goddard LLP as its remunerationconsultant to provide access to independent research and advice. AddleshawGoddard LLP provided no other services to the Group. Both the constitution and operation of the Remuneration Committee complywith the principles and provisions incorporated in the Combined Code. Inpreparing the Directors’ remuneration report, the Remuneration Committeehas followed the provisions of the Combined Code. The terms of reference ofthe Remuneration Committee are available on the Group’s website athttp://www.stagecoachgroup.com/scg/csr/corpgov/committees/remun.pdf.
10.2 Remuneration of Non-Executive DirectorsOther than the Chairman, each non-executive director generally receives thesame level of fixed annual fee. The fee for each non-executive director is set
out in Table 2 on page 34. The Board balances the responsibilities of eachnon-executive director (for example, Chairmanship and/or membership ofCommittees) such that over the medium-term each non-executive directorhas a similar level of workload and commitment.
The Board of Directors as a whole, having given due regard to the requiredtime commitment and responsibilities, sets the fees and expenses payable tothe non-executive directors. Non-executive directors do not hold any shareoptions, nor do they participate in any incentive plans or pension schemeswith the exception of Ann Gloag who receives a pension accrued when shewas an executive director. The members of the Remuneration Committeehave no personal interest in the matters to be decided by the Committeeother than as shareholders, have no conflicts of interest arising from cross-directorships and no day-to-day involvement in running the businesses of theStagecoach Group.
10.3 Performance graphThe graph below charts the performance of the Stagecoach Group TotalShareholder Return (‘‘TSR’’) (share value movement plus reinvested dividends)over the 5 years to 30 April 2011 compared with that of the FTSE Travel andLeisure All-Share Index, and the FTSE 250 Index. The FTSE 250 Index has beenselected for this comparison because it is the index used by the Company forthe performance criterion for the 2005 LTIP Scheme, while the FTSE Travel andLeisure All-Share Index is shown as the Company and a number of its peersmake up a significant element of that index. We have included a further graphto highlight the Company’s more recent performance, charting TSR for theyear up to 30 April 2011.
Stagecoach 5-Year TSR Comparative Performance to 30 April 2011
10. Directors’ remuneration report
Stagecoach 1-Year TSR Comparative Performance to 30 April 2011
0
50
100
150
200
250
300
350
400
Apr 06 Jul 06 Oct 06 Jan 07 Apr 07 Jul 07 Oct 07 Jan 08 Apr 08 Jan 10 Apr 10Jul 08 Oct 08 Jan 09 Apr 09 Jul 09 Oct 09 Jan 11 Apr 11Jul 10 Oct 10
Stagecoach TSR FTSE 250 TSRFTSE Travel & Leisure TSR
Stagecoach TSR FTSE 250 TSRFTSE Travel & Leisure TSR
page 32 | Stagecoach Group plc
78189_Front FINAL_78189_StCchV10_FRONT 05/07/2011 11:40 Page 32

10.4 Remuneration PolicyThe Remuneration Policy was approved by our shareholders at the 2010Annual General Meeting. The Remuneration Committee follows theCombined Code in designing performance-related remuneration schemes.
In determining appropriate levels of remuneration for the Executive Directors,the Remuneration Committee aims to provide overall packages of terms andconditions that are competitive in the UK and will attract, retain and motivatehigh quality executives capable of achieving the Group’s objectives and toensure that they are fairly rewarded for their individual responsibilities andcontributions to the Group’s overall performance. The RemunerationCommittee believes that packages for Executive Directors should containsignificant performance-related elements and that these performance-relatedelements should be designed to align the interests of the Executive Directorsand other senior managers with the interests of shareholders. TheRemuneration Committee is able to consider all relevant factors when settingExecutive Directors’ remuneration, including environmental, social andgovernance matters. Performance targets are established to achieveconsistency with the interests of shareholders, with an appropriate balancebetween short-term and long-term targets. Performance targets can includefinancial measures as well as personal targets, such as successful investment,innovation, staff development, customer satisfaction, regulatoryrequirements and achievement of health, safety and environmental targets.The incentive arrangements for the Executive Directors are structured so asnot to unduly increase environmental, social and governance risks byinadvertently motivating irresponsible behaviour. A separate Health, Safetyand Environmental Committee report is included in section 9 of this annualreport.
The Remuneration Committee regularly reviews the remuneration of theExecutive Directors, in consultation with the Chief Executive, makingcomparisons with peer companies of similar size and complexity and withother companies in the public transport industry. Proposals for theforthcoming year are then discussed in the light of the prospects for theGroup. The Remuneration Committee is also kept informed of the salarylevels of other senior executives employed by the Group. With regard topensions, the Remuneration Committee has access to reports from pensionscheme trustees and scheme actuaries regarding the cost of pensionobligations.
10.5 Intended balance of remuneration packageThe total remuneration for each Executive Director includes meaningfulelements of performance related pay.
It is intended that the balance of the overall remuneration package of theExecutive Directors is broadly structured as shown in Figure 1, with theproportions shown being based on the expected value of awards. Forexample, where the Remuneration Committee has made awards of IncentiveUnits under the Long Term Incentive Plan to the Executive Directorsequivalent to say 150% of basic salary, the expected value of the IncentiveUnits at the time of award to a director is less than 150% of basic salarybecause of the challenging performance conditions that apply. Likewise, whileExecutive Directors can earn a cash settled annual bonus of up to 50% ofbasic salary, the maximum award is only earned to the extent that thechallenging performance objectives are met.
Figure 2 provides a further analysis of the intended balance of ExecutiveDirectors’ pay between fixed elements (for example, basic salary and pensionbenefits), variable short-term elements (for example, annual cash bonuses)and variable long-term elements (for example, awards under share basedincentive schemes).
Shareholders are invited specifically to approve all new long-termremuneration plans (whether equity-settled or cash-settled plans) and anysignificant changes to existing plans, except where changes are otherwisepermitted by the Listing Rules. The current arrangements were approved byshareholders at the 2005 Annual General Meeting and the Committeeconsiders that they remain appropriate.
The Remuneration Committee believes that remuneration packages shouldreward the efforts of all staff since a motivated workforce is a key element ofGroup performance. The Committee recognises that the Executive Directorsbear the greatest responsibility for delivering corporate strategy thatunderpins long-term sustainable performance. So while the RemunerationCommittee’s report focuses on the incentive schemes for Executive Directorsand senior executives, there are also a number of other performance-relatedbonus schemes of more general application within Group companies notdiscussed in this report.
10.6 Remuneration of Executive Directors and other executives (audited)
The remuneration of the Executive Directors and other executives maycomprise a number of elements from the following:
• Basic salary;
• Performance-related annual cash bonuses;
• The Executive Participation Plan (“EPP”);
• Benefits in kind and other allowances;
• Pension arrangements;
• Share options (no awards made since 2004); and
• The Long Term Incentive Plan (“LTIP”).
The participation of the two Executive Directors in the above arrangementsduring the year ended 30 April 2011 is summarised in Table 1 on page 34.The Executive Directors have not received executive share options sinceDecember 2004.
Each Executive Director’s remuneration package is tailored to the individualto ensure an appropriate balance of reward for responsibilities, motivation,retention and share participation, whilst ensuring the overall packages areappropriate to recruit and retain high quality executives capable ofachieving the Group’s objectives.
Directors’ remuneration for the year ended 30 April 2011 is shown in Table2 and Table 3 on page 34, along with information on share options andLTIP awards in sections 10.12 and 10.14 respectively.
0%10%20%30%40%50%60%70%80%90%
100%
Elements of pay
Figure 2: Balance of Executive Directors’ remuneration package
Variable - long-term Variable - short-term Fixed
Elements of pay
Basic salary and otherbenefits/allowancesCash–settled performance-related bonusDeferred shares settledperformance-related bonusLong term incentive planPension benefits accrued inyear (excluding inflation)
Figure 1: Balance of Executive Directors’ expected remunerationpackage
Stagecoach Group plc | page 33
78189_Front FINAL_78189_StCchV10_FRONT 05/07/2011 11:40 Page 33

Executive directorsSir Brian Souter 564 553 129 96 129 96 22 17 Nil Nil 844 762Martin Griffiths 382 374 172 187 172 187 23 19 87 85 836 852Non-Executive Directors Ewan Brown 47 44 Nil Nil Nil Nil Nil Nil Nil Nil 47 44Iain Duffin (resigned 30 June 2010) 8 44 Nil Nil Nil Nil Nil Nil Nil Nil 8 44Ann Gloag 47 44 Nil Nil Nil Nil Nil Nil Nil Nil 47 44Helen Mahy 47 15 Nil Nil Nil Nil Nil Nil Nil Nil 47 15Sir George Mathewson 84 44 Nil Nil Nil Nil Nil Nil Nil Nil 84 44Janet Morgan (resigned 30 June 2010) 8 44 Nil Nil Nil Nil Nil Nil Nil Nil 8 44Robert Speirs (retired 31 December 2010) 207 150 Nil Nil Nil Nil Nil Nil Nil Nil 207 150Garry Watts 47 44 Nil Nil Nil Nil Nil Nil Nil Nil 47 44Phil White (appointed 1 June 2010) 43 Nil Nil Nil Nil Nil Nil Nil Nil Nil 43 Nil
Total 1,484 1,356 301 283 301 283 45 36 87 85 2,218 2,043
† Non-pensionable allowances represent additional taxable remuneration paid to provide pension benefits. The non-pensionable allowance for Martin Griffiths above of £87,080(2010: £84,660) is stated gross of notional pension contributions under the salary sacrifice arrangements, which is in practice deducted from the allowance that is made to him,so he actually received £78,107 (2010: £73,824).** Sir Brian Souter waived elements of his remuneration, with the amounts waived being used to support funding medical screening for the employees of the UK Bus division.The amounts shown in Table 2 for Sir Brian Souter therefore reflect reductions of £250,000 for both 2010 and 2011 apportioned equally to the cash and deferred sharesbonus.The salary for Sir Brian Souter above of £564,000 (2010: £553,000) is stated gross of notional pension contributions that are deducted as part of participating in thepension salary sacrifice arrangement. His notional pension contributions during the year were £49,605 (2010: £49,522). These contributions are shown within the increase intransfer value less pension contributions in Table 3.
Directors’ remuneration report
Sir Brian Souter YES YES YES YES NO* YESMartin Griffiths YES YES YES YES NO* YES*The Executive Directors have not received awards of executive share options following the approval of the EPP and LTIP at the 2005 AGM.
BasicSalary/Annual Benefits in Share
TABLE 1 – DIRECTORS’ PARTICIPATION bonus EPP kind Pension Options LTIP
TABLE 2 – DIRECTORS’ REMUNERATION Performance Performance related Benefits in Non-pensionable(amounts in £000) Salary/fees related bonus bonus - deferred kind allowances† Total
(cash)** shares (EPP)**
2011 2010 2011 2010 2011 2010 2011 2010 2011 2010 2011 2010
TABLE 3 – DIRECTORS’ PENSION Additional Transfer value Increase in TransferBENEFITS (amounts in £000) accrued benefits Accrued Accrued lump of increase transfer value less value of
in the year pension sum (excluding inflation) Directors’ contributions pension
Excluding Includinginflation inflation 2011 2010 2011 2010 2011 2010 2007 2006 2011 2010+
Executive directorsSir Brian Souter* 44 77 369 348 761 705 144 300 94 5,817 5,673Martin Griffiths* 14 19 50 45 149 135 28 30 17 443 415*Sir Brian Souter and Martin Griffiths participated in pension salary sacrifice arrangements during the year. The Directors’ contributions set against the increase in transfer value inthe table above include salary sacrificed by the directors and paid directly to the pension scheme by the employer.+The transfer value of pension for 2010 has been updated to reflect market conditions at 30 April 2011.
Martin Griffiths was subject to the statutory pensionable earnings cap thatexisted until 5 April 2006 and since then the Company has continued toimpose a notional pensionable earnings cap. The Company makes cashcontributions to Martin Griffiths for the part of his salary that exceeds thenotional earnings cap. Only basic salary is pensionable. The additional cashcontribution equates to one-third of the excess above the notional earningscap. Sir Brian Souter joined the pension scheme prior to the application of thestatutory pensionable earnings cap and was therefore not subject to such capand is therefore not subject to the notional earnings cap.
Directors who are members of the Stagecoach Group Pension Scheme have theoption to pay additional voluntary contributions (‘‘AVCs’’). Neither the contributionsnor the resulting benefits of any AVCs are included in the tables above.
Each of the elements of remuneration is discussed further below.
10.7 Basic salaryThe salary of each Executive Director is reviewed at 1 May each year. Accountis taken of individual achievements, together with any changes inresponsibilities that may have occurred and, as stated above, the salaries for
similar roles in comparable companies. The Remuneration Committee alsotakes into account pay conditions throughout the Group. In recognition ofthe challenging macro-economic environment and the need for strong costcontrols and restraint on pay settlements across the Group, the pay reviewperformed as of 1 May 2010 determined that there should be a 2% increaseto basic salaries of the Executive Directors and other senior executives.
10.8 Performance-related annual cash bonusesAt the start of each financial year, the Committee agrees specific objectivesfor each Executive Director. Following the end of each financial year, theRemuneration Committee determines the performance-related annual bonusfor each Executive Director for the year just ended. This is based on theDirector’s performance in achieving the objectives agreed. These compriseboth financial objectives for the Group and personal objectives for eachdirector. For each Executive Director, the Group financial objectives for theyear ended 30 April 2011 were to better the Group’s financial targets withrespect to measures of earnings before interest and taxation, earnings pershare, and net debt. The personal objectives are specific to each ExecutiveDirector and may cover matters such as safety targets, environmental targets,
page 34 | Stagecoach Group plc
78189_Front FINAL_78189_StCchV10_FRONT 05/07/2011 11:40 Page 34

successful investment, innovation, staff development, customer satisfaction,successful business acquisitions/disposals and regulatory requirements.For the year ended 30 April 2011, Sir Brian Souter and Martin Griffiths eachhad a maximum potential bonus of up to 100% of basic salary, 70% formeeting demanding financial objectives and 30% for meeting personalobjectives. In accordance with the rules of the EPP, 50% of any actual bonuswill be deferred as shares under the EPP.
In making its judgement of performance for the last financial year, theRemuneration Committee had particular regard to the results as recordedelsewhere in the Annual Report, and relative total return to shareholders overthe year, as well as other strategic developments and operatingimprovements. Performance related bonuses awarded to the ExecutiveDirectors in respect of the year ended 30 April 2011 are shown in Table 4below.
10.9 Executive Participation PlanThe 2005 Executive Participation Plan (‘‘EPP’’) was approved at the 2005Annual General Meeting.
The intention of the EPP is to further align the interests of managers withshareholders by ensuring managers have a greater direct interest in theperformance of the Group’s shares purchased out of an element of theirbonus awards. The EPP is such that the executives can benefit from bothcapital growth (i.e. increases in share price) and dividend yield. The EPP is alsodesigned to provide an incentive for managers to remain with the Group andforms a core part of the Group’s succession and management developmentplans.
Awards under the EPP can be made to Executive Directors and othermanagers. Participants are required to sacrifice part of their actual annualbonus award and are awarded deferred shares with an initial market valueapproximately equal to the amount of the actual cash bonus foregone.
Absolute and full entitlement to the shares is deferred for three years.
There are no specific performance conditions attaching to the release ofdeferred shares because the annual bonus is already subject to performanceconditions and there are no awards of matching shares in respect of annualbonuses - the EPP requires executives to invest an element of their annual
bonus (normally a minimum of 50% of any annual bonus award) in theCompany’s shares. The EPP is an effective retention programme in thatparticipants would lose their entitlement to the deferred shares if they left oftheir own volition during the three-year deferral period.
Where an individual receives an award under the EPP, he or she generally doesnot also receive an award of executive share options in the same financialyear. Awards made to the Executive Directors under the EPP, are shown inTable 5.
10.10 Benefits in kind and other allowancesThe benefits in kind shown in Table 2 on page 34 for the year ended 30 April2011 are made up as follows:
• Sir Brian Souter received £21,600 (2010: £17,200) of cash allowance in lieuof company car and £256 (2010: £252) in re-imbursement of hometelephone expenses.
• Martin Griffiths received £21,670 (£2010: £18,000) of cash allowance inlieu of company car, £995 (2010: £884) of healthcare benefits and £530(2010: £556) in re-imbursement of home telephone expenses.
10.11 Pension arrangementsUnder the terms of their service agreements Executive Directors are entitledto become members of one of the Stagecoach Group’s defined benefitpension schemes or, if preferred, to receive payment of a proportion of salaryfor personal pension schemes. For pension purposes, the Executive Directorshave a normal retirement age of 60. The Stagecoach Group pensionschemes were designed to provide a pension for Executive Directorsequivalent to up to two-thirds of final pensionable salary completed up tonormal retirement age.
Following the new pensions regime introduced in the UK by the Pensions Act2004, the Group introduced a notional pensionable earnings cap to replacethe previous statutory pensionable earnings cap in the Group’s main pensionscheme. Further to this, during the year ended 30 April 2007, the Group alsointroduced an annual cap of 3.5% on pensionable salary growth under thescheme and this cap also applies to the notional pensionable earnings cap.
Pension benefits accruing to Martin Griffiths under the Stagecoach Groupdefined benefit scheme are limited both by the notional pensionableearnings cap and by the 3.5% cap on pensionable salary growth as explainedabove. The Company makes cash contributions to Martin Griffiths for thepart of his basic salary that exceeds the notional cap. Life assurance of fourtimes basic annual salary is provided under the scheme.
10.12 Share options (audited)Executive Share OptionsThe Executive Directors are generally not expected to receive further awardsof executive share options following the approval of the EPP and LTIP byshareholders at the 2005 Annual General Meeting.
Stagecoach Group plc | page 35
Maximum potentialActual bonus as a bonus as a
percentage of percentage ofbasic salary basic salary
Director Cash Shares Cash Shares
Sir Brian Souter 23%* 23%* 50% 50%Martin Griffiths 45% 45% 50% 50%
*As noted in Table 2, Sir Brian Souter waived entitlement to cash and deferred sharesbonus awards during the year. Save for the waiver, he would have been entitled to abonus of 90% of basic salary divided equally between cash and deferred shares.
TABLE 4 – DIRECTORS’ BONUSES
Sir Brian Souter26 June 2008 104,944 Nil 1,105 Nil 106,049 26 June 2011 252,527 2.682510 Dec 2009 344,599 Nil 3,630 Nil 348,229 10 Dec 2012 525,259 1.606028 June 2010 Nil 49,552 522 Nil 50,074 28 June 2013 96,222 1.9020
449,543 49,552 5,257 Nil 504,352
Martin Griffiths26 June 2008 74,803 Nil 788 Nil 75,591 26 June 2011 179,998 2.682510 Dec 2009 245,626 Nil 2,588 Nil 248,214 10 Dec 2012 374,400 1.606028 June 2010 Nil 96,465 1,016 Nil 97,481 28 June 2013 187,000 1.9020
320,429 96,465 4,392 Nil 421,286
TABLE 5 –– As at Awards granted Dividends Vested As at Expected total Closing share EPP AWARDS 1 May 2010 in year in year in year 30 April 2011 Vesting value of award at price on dateGrant Date (deferred shares) (deferred shares) (deferred shares) (deferred shares) (deferred shares) Date time of grant of grant
Stagecoach Group plc | page 35
78189_Front FINAL_78189_StCchV10_FRONT 05/07/2011 11:40 Page 35

TABLE 8 Awards Expected ClosingLTIP As at 30 April granted in Dividends As at 30 April total value of Share price
2010 year in year 2011 award at on date of(incentive (incentive (incentive (incentive time of grant grant
Grant date units) units) units) units) Vesting Date* £ £
Directors’ remuneration report
TABLE 6 – Options Granted At 1 May 2010 SAYE OPTIONS At 1 May 2009 over No. or and 30 April 2011 Exercise Date from which Expiry
No.of ordinary shares ordinary shares No of ordinary shares price £ excercisable date
Martin Griffiths 3,733 2.51775 1 Oct 2011 31 March 2012
SAYE Share OptionsIn August 2008, all eligible UK employees were invited to participate in a newSAYE scheme with a three-year duration starting in September 2008. Onedirector held options issued under this SAYE scheme. Further details on thisare shown in Table 6 below
10.13 Satisfaction of share awardsUnder the rules of the Company’s share schemes, and consistent withguidance issued by the Association of British Insurers (‘‘ABI’’), there are limitson the number of share options and other awards that can be granted thatmay be satisfied by the issue of new shares. Following the consolidation ofordinary shares related to the returns of value in 2004 and 2007, whicheffectively halved the number of ordinary shares in issue, the number ofexecutive share options that had been granted in the previous 10 yearsexceeded 5% of the issued number of ordinary shares. Also, the running totalof share capital allocated to all share options including all-employee SAYEoptions in the previous 10 years was effectively doubled through theconsolidation process to 10.2%, and so exceeded the 10% guideline for theissued ordinary shares. It was not possible, therefore, to satisfy any newgrants of share options or EPP awards with newly issued shares since to do sowould have exceeded both the 5% and 10% limits under the share schemesrules. Accordingly, the Board and the Remuneration Committee determinedthat all future grants of executive share options and EPP awards will besatisfied with existing shares until such time as there is sufficient headroomavailable under the original limits for the issue of new shares.
However, and in order to support the issuance of shares for all-employeeschemes, such as the SAYE, Shareholder approval to change the limit to12.8% was obtained at the 2008 Annual General Meeting on 29 August2008 so that 5% of the new 12.8% limit may be allocated for issuing newshares to satisfy all-employee share schemes, such as the SAYE.
In the 10 years prior to 30 April 2011, the Company had granted shareoptions (not lapsed) over executive and SAYE share schemes as follows:
TABLE 7 Executive Options SAYE Options Total
Share options to be satisfiedfrom new issue shares 49,248,108 22,583,542 71,831,650
Expressed as a percentage ofthe issued share capital asat 30 April 2011 6.9% 3.1% 10.0%
The Group’s Employee Share Ownership Trusts are used to acquire andfinance shares to meet contingent obligations under share based incentiveschemes that are not expected to be satisfied through the issue of newshares. At 30 April 2011, these trusts held 2,187,585 (2010: 2,336,447)56/57th ordinary shares in the Company, representing 0.3% (2010: 0.3%) ofthe total issued ordinary shares. The Company follows the ABI guideline thatthe shares held by Employee Share Ownership Trusts should not exceed 5% ofthe total shares in issue. The Employee Share Ownership Trusts have waivedthe right to receive dividends on the shares held by them.
10.14 Long Term Incentive PlanTo be used for Executive Directors and a small number of senior executives,the 2005 Long Term Incentive Plan (‘‘LTIP’’) was approved at the 2005Annual General Meeting. The LTIP introduces stringent performance criteriarelated to total shareholder return (‘‘TSR’’) over a three-year assessmentperiod. TSR is calculated as the movement in share value after taking accountof re-invested dividends. TSR is measured against a comparator group, whichis the list of FTSE 250 companies. Details of LTIP awards made to theDirectors are shown in Table 8 below.
Under the LTIP, executives are awarded Incentive Units at the discretion of theRemuneration Committee with each Incentive Unit having a nominal value
Sir Brian Souter30 June 2008 216,372 Nil 2,227 218,599 30 June 2011 213,856 2.800010 Dec 2009 534,482 Nil 5,502 539,984 10 Dec 2012 238,382 1.606028 June 2010 Nil 222,281 2,288 224,569 28 June 2013 115,275 1.90309 Dec 2010 Nil 203,512 2,095 205,607 9 Dec 2013 121,863 2.0785
750,854 425,793 12,112 1,188,759
Martin Griffiths30 June 2008 146,516 Nil 1,508 148,024 30 June 2011 144,812 2.800010 Dec 2009 361,925 Nil 3,725 365,650 10 Dec 2012 161,421 1.606028 June 2010 Nil 150,552 1,549 152,101 28 June 2013 78,076 1.90309 Dec 2010 Nil 137,840 1,419 139,259 9 Dec 2013 82,539 2.0785
508,441 288,392 8,201 805,034
The LTIP awards granted on 28 June 2007 would in the normal course of events have vested on 28 June 2010. As noted in the 2010 Remuneration Report, the Remuneration Committeeconsidered it appropriate to bring forward the vesting date of the award to 31 March 2010. The awards were re-tested on the original due vesting date to consider whether vesting on 28 June2010 would have delivered a lower or different amount and it was found that the earlier vesting had resulted in an understatement of the award level and unit price. Adjusting payments weremade to reflect vesting of 100% of the available units at a unit price of £1.903 to reflect actual performance over the original performance period.
page 36 | Stagecoach Group plc
78189_Front FINAL_78189_StCchV10_FRONT 05/07/2011 11:40 Page 36

equal to one of the Company’s ordinary shares. The maximum awardsgranted in relation to any financial year for an individual is limited toIncentive Units with an aggregate nominal value not exceeding 1.5 times theindividual’s basic salary.
The Company intends to settle all such awards in cash but would support thesettlement in shares via an employee share ownership trust where executiveswish to increase their holdings in the Company’s shares. The individual wouldalso need to remain with the Company for three years from the date of anaward in order to receive full entitlement to the LTIP units.
For all LTIP awards granted up to 30 April 2009, vesting of the LTIP units issubject to two quantitative TSR-based performance criteria and also to aqualitative underpin. The qualitative underpin was that LTIP units will onlyvest if the Remuneration Committee is satisfied with the underlying financialperformance of the Group. The two quantitative conditions for LTIP awardsgranted up to 30 April 2009 are:
• Firstly, no awards vest unless the total shareholder return of the Groupover the three-year testing period is positive.
• Secondly, the element of the awards that vest is based on how the Group’stotal shareholder return compares to a comparator group, being the list ofFTSE 250 companies.
For LTIP awards granted up to 30 April 2009, the number of LTIP units thatwould be released after the three years is calculated as follows:
• If TSR is negative no LTIP units are released;
• If TSR is positive but is less than the median TSR of the comparator group,no LTIP units are released;
• If TSR exceeds the median of the comparator group, 33% of the LTIP unitsare released;
• If TSR is in the top quartile of the comparator group, 100% of the LTIPunits are released;
• If TSR is higher than the median but less than the top quartile, theproportion of LTIP units to be released would be between 33% and 100%depending on the exact ranking against the comparator group.
For LTIP awards granted from 1 May 2009 the performance conditions areset so as to provide a lower payout for median performance against thecomparator group, and to increase the performance target from top quartileto top decile at which maximum payout levels may occur based on grantingIncentive Units with an aggregate nominal value of 1.5 times basic salary. Inaddition the use of a positive TSR has been replaced with the requirement forthe Committee to have the authority to reduce any awards if it is not satisfiedthat the TSR performance is consistent with the underlying financialperformance of the Group.
For LTIP awards granted from 1 May 2009 the number of LTIP units thatwould be released after the three years is calculated as follows:
• If TSR exceeds the median of the comparator group, then only one-sixth(16.67%) of the LTIP units awarded will be released;
• For 100% of the LTIP units awarded to be released then the TSR must be inthe top decile of the comparator group;
• If TSR is higher than the median but less than the top decile then theproportion of LTIP units to be released would be between 16.67% and100% of the units awarded depending on the actual ranking against thecomparator group.
An independent third party will calculate the TSR measures for the purposesof determining the extent to which the performance condition is satisfied.Other than on retirement, if participants choose to leave the Group, theawards would lapse.
10.15 Review of share based incentive schemesThe principal share based incentive schemes for the Executive Directors andother executives are the EPP and the LTIP, which are described earlier in thisDirectors’ remuneration report. The EPP and the LTIP schemes were adoptedby shareholders at the Annual General Meeting of the Company held inAugust 2005 following a review by the Remuneration Committee of theGroup’s share based payments and other incentive arrangements.
The Remuneration Committee believes that the operation of the Group’sshare based incentive schemes, the potential award levels under the schemes,the nature of the performance conditions and timing of vesting remainappropriate in light of the Group’s circumstances and future prospects.
To support participation by its employees in the shares of the Company,shareholder approval shall be sought at the 2011 Annual General Meeting fortwo new employee share schemes as follows:
• A new Share Incentive Plan ("SIP") intended to take advantage of the taxbeneficial status of a share incentive plan approved by Her Majesty'sRevenue & Customs. Participation to this approved plan will be open to alleligible UK employees; and
• A new Unapproved Share Option Plan to replace the existing executiveshare option plan that expired on 25 June 2011.
The new Unapproved Share Option Plan will be available for use with allemployees other than directors of the Company who may not participate. Therules of each of the above new plans will contain provisions consistent withrelevant ABI guidelines such that the use of new ordinary shares will belimited to ten per cent of the issued share capital of the Company from timeto time, taking into account ordinary shares issued or to be issued over theprevious ten year period under any other employees' share plans adopted bythe Company. Furthermore, no employee may during a financial year receivein aggregate awards under the Unapproved Option Plan and awards underthe Company’s 2005 Long Term Incentive Plan over shares worth more thanone and a half times his or her total remuneration in that period.
10.16 Shareholding targetsThe Executive Directors and certain other senior executives are expected toaccumulate significant shareholdings in the Company. In the case ofExecutive Directors, they are each expected to accumulate shares in theCompany with a value of at least 100% of basic salary. These targets were firstintroduced in 2005 and Executive Directors were allowed five years toaccumulate the appropriate level of shares.
The Executive Directors have significant effective interests in the Company’sordinary shares ensuring alignment of Executive Directors’ and Shareholders’objectives. The effective interests of Executive Directors as at 30 April 2011were:
Stagecoach Group plc | page 37
Sir Brian Souter Martin Griffiths
Ordinary shares 108,625,564 202,337
Shares held under shareoptions Nil 3,733
Deferred Shares underExecutive Participation Plan 504,352 421,286
109,129,916 627,356
TABLE 9
78189_Front FINAL_78189_StCchV10_FRONT 05/07/2011 11:40 Page 37

Directors’ remuneration report
10.17 Directors’ service agreementsThe details of the Executive Directors’ service contracts are summarised in thetable below:
It is the Company’s policy that Executive Directors should have 12-monthrolling service contracts providing for a maximum of one year’s notice. Due tothe nature of the Group’s businesses, the service contracts contain restrictivecovenants that will be rigorously applied.
Non-executive directors are appointed by a letter, which makes no specificprovision for notice periods. The letters of appointment do not contain anycontractual entitlement to a termination payment and the directors can beremoved in accordance with the Company’s Articles of Association. Non-executive directors are subject to election and re-election by shareholders asdescribed on pages 24 and 25.
10.18 Early terminationIf the Company terminates an executive director’s contract, the costs forwhich the Company is liable will vary depending on length of service. Thecosts will include a termination payment of up to one times annual salary andthe value of one year’s additional retirement benefits. There are noarrangements otherwise to enhance or accelerate pension benefits ontermination or early retirement.
10.19 Change of controlThe following apply where there is a change in control of the Company:
• Executive directors are entitled to normal termination benefits as outlinedabove, except where the director is offered and has refused employmenton terms and conditions that were no less favourable to those in placeprior to the change of control;
• With respect to Executive Share Options, options can be exercised withinsix months of the change of control. For options currently outstanding,the extent to which the performance condition is applied shall bedetermined by the Remuneration Committee;
• Under the EPP, shares deferred would automatically vest on a change ofcontrol;
• Under the LTIP, Incentive Units would vest on a pro-rata basis takingaccount of the proportion of the vesting period that had expired and theTSR performance condition.
10.20 Outside appointmentsExecutive directors are able to accept substantive external appointments,provided that approval is given by the Board. The fees from suchappointments are retained by the director, recognising the level of personalcommitment and expertise required for non-executive roles. Details ofremuneration earned where an Executive Director serves as a non-executivedirector elsewhere are disclosed in note 34 to the consolidated financialstatements.
10.21 Transactions in which Directors have had amaterial interest (audited)
10.21.1 Noble Grossart Limited Ewan Brown (Non-Executive Director) is a former executive director andcurrent non-executive director of Noble Grossart Limited that has previouslyprovided advisory services to the Group. Total fees payable to Noble GrossartLimited in respect of the year ended 30 April 2011 amounted to £Nil (2010:£13,333). At 30 April 2011, Noble Grossart Investments Limited, a subsidiary ofNoble Grossart Limited, held 4,084,999 (2010: 4,084,999) ordinary shares inthe Company, representing 0.6% (2010: 0.6%) of the Company’s issuedordinary share capital.
10.21.2 Alexander Dennis Limited Sir Brian Souter (Chief Executive) and Ann Gloag (Non-Executive Director)collectively hold 37.9% (30 April 2010: 37.9%) of the shares and voting rightsin Alexander Dennis Limited. Noble Grossart Investments Limited (see10.21.1 above) controls a further 28.4% (30 April 2010: 28.4%) of the sharesand voting rights of Alexander Dennis Limited. None of Sir Brian Souter, AnnGloag or Ewan Brown is a director of Alexander Dennis Limited nor do theyhave any involvement in the management of Alexander Dennis Limited.Furthermore, they do not participate in deciding on and negotiating theterms and conditions of transactions between the Group and AlexanderDennis Limited.
For the year ended 30 April 2011, the Group purchased £87.1m (2010:£48.9m) of vehicles from Alexander Dennis Limited and £5.7m (2010:£3.4m) of spare parts and other services. As at 30 April 2011, the Group had£1.3m (2010: £0.4m) payable to Alexander Dennis Ltd.
10.21.3 Argent Energy Group LimitedSir Brian Souter (Chief Executive) and Ann Gloag (Non-Executive Director)collectively hold 39.3% (30 April 2010: 39.3%) of the shares and voting rightsin Argent Energy Group Limited. Neither Sir Brian Souter nor Ann Gloag is adirector of Argent Energy Group Limited nor do they have any involvement inthe management of Argent Energy Group Limited. Furthermore, they do notparticipate in deciding on and negotiating the terms and conditions oftransactions between the Group and Argent Energy Group Limited.
For the year ended 30 April 2011, the Group purchased £2.0m (2010: £0.4m)of biofuel from Argent Energy Group. As at 30 April 2011, the Group had£0.2m (2010: £Nil) payable to Argent Energy Group.
10.22 Remuneration policy approval An ordinary resolution to receive and approve this Directors’ remunerationreport will be proposed at the 2011 Annual General Meeting.
On behalf of the Board
Phil WhiteChairman of the Remuneration Committee
29 June 2011
page 38 | Stagecoach Group plc
Name of director Date of contract Notice period
Sir Brian Souter 2 April 1993 (amended 12 months 26 January 1996)
Martin Griffiths 8 August 2000 (amended29 November 2001 and 10 April 2003) 12 months
TABLE 10 – EXECUTIVE DIRECTORS’ SERVICE CONTRACTS
78189_Front FINAL_78189_StCchV10_FRONT 05/07/2011 11:40 Page 38

The Directors confirm that to the best of their knowledge:
• The consolidated financial statements, prepared in accordance with the applicable United Kingdom law and in conformity with IFRS, as adopted by theEuropean Union, give a true and fair view of the assets, liabilities, financial position and profit of the Group and the undertakings included in theconsolidation taken as a whole; and
• The Chairman’s statement, Chief Executive’s review and Directors’ report (incorporating the Operating and Financial Review) include a fair review of thedevelopment and performance of the business and the position of the Group and the undertakings included in the consolidation taken as a whole, togetherwith a description of the principal risks and uncertainties that they face.
Signed on 29 June 2011 on behalf of the Board by:
Sir Brian Souter Martin A GriffithsChief Executive Finance Director
11. Responsibility statement
Stagecoach Group plc | page 39
78189_Front FINAL_78189_StCchV10_FRONT 05/07/2011 11:40 Page 39

We have audited the consolidated financial statements of Stagecoach Groupplc for the year ended 30 April 2011 which comprise the Consolidated incomestatement, the Consolidated statement of comprehensive income, theConsolidated balance sheet, the Consolidated statement of changes in equity,the Consolidated statement of cash flows and the related notes. The financialreporting framework that has been applied in their preparation is applicablelaw and International Financial Reporting Standards (“IFRSs”) as adopted bythe European Union.
Respective responsibilities of directors andauditorsAs explained more fully in the Statement of Directors’ responsibilities inrespect of the Annual Report, the Directors’ remuneration report and thefinancial statements set out on page 21, the Directors are responsible for thepreparation of the consolidated financial statements and for being satisfiedthat they give a true and fair view. Our responsibility is to audit and expressan opinion on the consolidated financial statements in accordance withapplicable law and International Standards on Auditing (UK and Ireland).Those standards require us to comply with the Auditing Practices Board’sEthical Standards for Auditors.
This report, including the opinions, has been prepared for and only for theCompany’s members as a body in accordance with Chapter 3 of Part 16 of theCompanies Act 2006 and for no other purpose. We do not, in giving theseopinions, accept or assume responsibility for any other purpose or to anyother person to whom this report is shown or into whose hands it may comesave where expressly agreed by our prior consent in writing.
Scope of the audit of the financial statements An audit involves obtaining evidence about the amounts and disclosures inthe financial statements sufficient to give reasonable assurance that thefinancial statements are free from material misstatement, whether caused byfraud or error. This includes an assessment of: whether the accountingpolicies are appropriate to the Group’s circumstances and have beenconsistently applied and adequately disclosed; the reasonableness ofsignificant accounting estimates made by the Directors; and the overallpresentation of the financial statements. In addition, we read all the financialand non-financial information in the Annual Report to identify materialinconsistencies with the audited financial statements. If we become aware ofany apparent material misstatements or inconsistencies we consider theimplications for our report.
Opinion on financial statements In our opinion the consolidated financial statements:
• give a true and fair view of the state of the Group’s affairs as at 30 April2011 and of its profit and cash flows for the year then ended;
• have been properly prepared in accordance with IFRSs as adopted by theEuropean Union; and
• have been prepared in accordance with the requirements of theCompanies Act 2006 and Article 4 of the lAS Regulation.
Opinion on other matters prescribed by theCompanies Act 2006 In our opinion:
• the information given in the Directors’ report for the financial year forwhich the consolidated financial statements are prepared is consistentwith the consolidated financial statements; and
• the information given in the Corporate governance report set out onpages 24 to 28 with respect to internal control and risk managementsystems and about share capital structures is consistent with the financialstatements.
Matters on which we are required to report byexceptionWe have nothing to report in respect of the following:
Under the Companies Act 2006 we are required to report to you if, in ouropinion:
• certain disclosures of directors’ remuneration specified by law are notmade; or
• we have not received all the information and explanations we require forour audit; or
• a corporate governance statement has not been prepared by the parentcompany.
Under the Listing Rules we are required to review:
• the Directors’ statement, set out on page 23, in relation to going concern;
• the part of the Corporate governance statement relating to the company’scompliance with the nine provisions of the June 2008 Combined Codespecified for our review; and
• certain elements of the report to shareholders by the Board on Directors’remuneration.
Other matter We have reported separately on page 102 on the parent company financialstatements of Stagecoach Group plc for the year ended 30 April 2011 and onthe information in the Directors’ remuneration report that is described ashaving been audited.
Michael Timar (Senior Statutory Auditor)for and on behalf of PricewaterhouseCoopers LLPChartered Accountants and Statutory AuditorsGlasgow
29 June 2011
Independent auditors’ report to the members of Stagecoach Group plc (Company No. SC100764)
page 40 | Stagecoach Group plc
78189_STC_Back FINAL_78189_StCchV13_BACK 05/07/2011 11:46 Page 40

Consolidated income statementFor the year ended 30 April 2011
Revenue 2 2,389.8 Nil 2,389.8 2,164.4 Nil 2,164.4Operating costs 3 (2,066.7) (10.1) (2,076.8) (1,947.2) (7.8) (1,955.0)Other operating expense 5 (122.4) Nil (122.4) (53.2) Nil (53.2)
Operating profit of Group companies 2 200.7 (10.1) 190.6 164.0 (7.8) 156.2Share of profit of joint venturesafter finance income and taxation 2 39.5 (5.1) 34.4 28.0 (5.1) 22.9
Total operating profit: Group operating profit andshare of joint ventures’ profit after taxation 2 240.2 (15.2) 225.0 192.0 (12.9) 179.1Non-operating exceptional items 4 Nil 0.7 0.7 Nil (2.0) (2.0)
Profit before interest and taxation 240.2 (14.5) 225.7 192.0 (14.9) 177.1Finance costs 6 (39.9) Nil (39.9) (41.5) (20.5) (62.0)Finance income 6 5.4 Nil 5.4 10.8 Nil 10.8
Profit before taxation 205.7 (14.5) 191.2 161.3 (35.4) 125.9Taxation 8 (35.1) 1.8 (33.3) (27.2) 9.1 (18.1)
Profit for the year from continuing operations 170.6 (12.7) 157.9 134.1 (26.3) 107.8
Profit for the year from discontinued operations 4 Nil 18.5 18.5 Nil 3.9 3.9
Profit after taxation for the year attributable to equity shareholders of the parent 170.6 5.8 176.4 134.1 (22.4) 111.7
Earnings per share from continuing and discontinued operations – Adjusted basic/Basic 10 23.8p 24.6p 18.7p 15.6p– Adjusted diluted/Diluted 10 23.5p 24.3p 18.5p 15.4p
Earnings per share from continuing operations– Adjusted basic/Basic 10 23.8p 22.0p 18.7p 15.1p– Adjusted diluted/Diluted 10 23.5p 21.7p 18.5p 14.9p
Dividends per ordinary share– Interim paid 9 2.2p 6.5p– Final proposed 9 4.9p Nil
The accompanying notes form an integral part of this consolidated income statement.
Interim dividends of £15.8m were paid during the year ended 30 April 2011 (2010: £46.6m).
A final dividend of 4.9 pence per share is proposed in respect of the year ended 30 April 2011 (2010: Nil).
Performance Performance pre intangibles Intangibles and pre intangibles Intangibles and
and exceptional Results for and exceptional Results forexceptional items items (note 4) the year exceptional items items (note 4) the year
Notes £m £m £m £m £m £m
2011 2010
CONTINUING OPERATIONS
DISCONTINUED OPERATIONS
TOTAL OPERATIONS
Stagecoach Group plc | page 41
78189_STC_Back FINAL_78189_StCchV13_BACK 05/07/2011 11:46 Page 41

Consolidated statement of comprehensive incomeFor the year ended 30 April 2011
Profit for the year attributable to equity shareholders of the parent 176.4 111.7
Other comprehensive income/(expense)Foreign exchange differences on translation of foreign operations (net of hedging) (5.4) 6.0Actuarial gains/(losses) on Group defined benefit pension schemes 26 76.5 (138.7)Share of actuarial (losses)/gains on joint ventures’ defined benefit pension schemes (0.7) 0.2Share of other comprehensive (expense)/income on joint ventures’ cash flow hedges (0.1) 1.8Net fair value gains on cash flow hedges 27(j) 52.6 38.3Net fair value losses on available for sale investments 15 Nil (0.2)
122.9 (92.6)
Transfers to the income statementCash flow hedges reclassified and reported in profit for the year 27(j) (21.8) 61.8
Tax on items taken directly to or transferred from equityTax on foreign exchange differences on translation of foreign operations (net of hedging) (0.4) NilTax effect of actuarial (gains)/losses on Group defined benefit pension schemes (24.0) 38.8Tax effect of share of actuarial losses/(gains) on joint ventures’ defined benefit pension schemes 0.2 (0.1)Tax effect of share of other comprehensive (expense)/income on joint ventures’ cash flow hedges Nil (0.5)Tax effect of share based payments Nil 0.7Tax effect of cash flow hedges 27(j) (7.4) (28.0)
(31.6) 10.9
Total comprehensive income for the year attributable toequity shareholders of the parent 245.9 91.8
The accompanying notes form an integral part of the consolidated statement of comprehensive income.
Notes £m £m
2011 2010
page 42 | Stagecoach Group plc
78189_STC_Back FINAL_78189_StCchV13_BACK 05/07/2011 11:46 Page 42

Consolidated balance sheet (statement of financial position)As at 30 April 2011
ASSETSNon-current assetsGoodwill 11 95.3 99.4Other intangible assets 12 24.2 16.1Property, plant and equipment 13 924.3 796.2Interests in joint ventures 14 58.1 56.7Available for sale and other investments 15 2.1 1.9Derivative instruments at fair value 27(j) 20.7 5.5Retirement benefit asset 26 23.7 NilDeferred tax asset 24 Nil 1.3Other receivables 20 19.4 17.6
1,167.8 994.7
Current assetsInventories 19 26.6 24.1Trade and other receivables 20 221.5 200.3Derivative instruments at fair value 27(j) 50.8 25.7Foreign tax recoverable 1.4 1.4Cash and cash equivalents 21 358.3 375.7
658.6 627.2
Total assets 1,826.4 1,621.9
LIABILITIESCurrent liabilitiesTrade and other payables 22 529.6 524.6Current tax liabilities 20.4 19.1Borrowings 23 62.5 50.8Derivative instruments at fair value 27(j) 0.1 4.0Provisions 25 56.9 46.6
669.5 645.1
Non-current liabilitiesOther payables 22 24.3 20.4Borrowings 23 592.1 626.1Derivative instruments at fair value 27(j) 0.1 7.3Deferred tax liabilities 24 46.8 19.2Provisions 25 126.6 89.0Retirement benefit obligations 26 120.8 202.1
910.7 964.1
Total liabilities 1,580.2 1,609.2
Net assets 246.2 12.7
EQUITYOrdinary share capital 28 7.1 7.1Share premium account 30 9.8 9.8Retained earnings 30 (217.4) (433.5)Capital redemption reserve 30 416.3 415.6Own shares 30 (14.6) (13.3)Translation reserve 30 1.7 7.1Cash flow hedging reserve 30 43.3 19.9
Total equity 246.2 12.7
These financial statements have been approved for issue by the Board of Directors on 29 June 2011. The accompanying notes form an integral part ofthis consolidated balance sheet.
Sir Brian Souter Martin A GriffithsChief Executive Finance Director
Notes £m £m
2011 2010
Stagecoach Group plc | page 43
78189_STC_Back FINAL_78189_StCchV13_BACK 05/07/2011 11:46 Page 43

page 44 | Stagecoach Group plc
Balance at 30 Ap
ril 200
9 and 1 May 200
97.1
9.5
(374
.9)
413.5
(13.9)
1.1
0.2
(52.2)
(9.6)
Profit for the ye
ar–
–11
1.7
––
––
–11
1.7
Other co
mprehensive income/(expense), net o
f tax
––
(97.8)
––
6.0
(0.2)
72.1
(19.9)
Total com
prehensive income/(expense)
––
13.9
––
6.0
(0.2)
72.1
91.8
Own ordinary sh
ares purchased
––
––
(0.2)
––
–(0.2)
Own ordinary sh
ares so
ld–
––
–0.8
––
–0.8
Preference sh
ares redeem
ed–
–(2.1)
2.1
––
––
–Arising on new ordinary share issues
–0.3
––
––
––
0.3
Credit in relatio
n to equity-settled share based paym
ents
––
6.3
––
––
–6.3
Dividends p
aid on
ordinary shares
9–
–(76.7)
––
––
–(76.7)
Balance at 30 Ap
ril 2010 and 1 May 2010
7.1
9.8
(433
.5)
415.6
(13.3)
7.1
–19
.912
.7
Profit for the ye
ar–
–17
6.4
––
––
–17
6.4
Other co
mprehensive income/(expense), net o
f tax
––
51.5
––
(5.4)
–23
.469
.5
Total com
prehensive income/(expense)
––
227.9
––
(5.4)
–23
.424
5.9
Own ordinary sh
ares purchased
––
––
(1.8)
––
–(1.8)
Own ordinary sh
ares so
ld–
––
–0.5
––
–0.5
Preference sh
ares redeem
ed–
–(0.7)
0.7
––
––
–Credit in relatio
n to equity-settled share based paym
ents
––
4.7
––
––
–4.7
Dividends p
aid on
ordinary shares
9–
–(15.8)
––
––
–(15.8)
Balance at 30 Ap
ril 2011
7.1
9.8
(217
.4)
416.3
(14.6)
1.7
–43
.324
6.2
The accompanying no
tes form an integral part o
f this con
solidated statem
ent o
f changes in equity.
Consolidated statem
ent o
f chang
es in
equ
ity
Share
Capital
Available
Cash flow
Ordinary share
prem
ium
Retained
redemption
Translatio
nfor
hedging
Total
capital
account
earnings
reserve
Own shares
reserve
sale reserve
reserve
equity
Notes
£m£m
£m£m
£m£m
£m£m
£m
78189_STC_Back FINAL_78189_StCchV13_BACK 05/07/2011 11:46 Page 44

Consolidated statement of cash flowsFor the year ended 30 April 2011
Cash flows from operating activitiesCash generated by operations 31 253.5 234.5Interest paid (35.6) (58.5)Interest received 5.5 5.4Dividends received from joint ventures 28.8 35.7
Net cash flows from operating activities before tax 252.2 217.1Tax paid (20.4) (0.7)
Net cash from operating activities after tax 231.8 216.4
Cash flows from investing activitiesAcquisition of subsidiaries, net of cash acquired 16 (57.0) (2.5)Disposals and closures of subsidiaries and other businesses, net of cash disposed of 17 1.2 1.6Purchase of property, plant and equipment (156.3) (89.2)Disposal of property, plant and equipment 31 14.7 53.0Purchase of intangible assets (0.4) (0.9)Purchase of other investments (0.4) (0.6)Movement in loans to joint ventures Nil 1.4
Net cash outflow from investing activities (198.2) (37.2)
Cash flows from financing activitiesIssue of ordinary shares for cash Nil 0.3Redemption of ‘B’ shares (0.7) (2.1)Investment in own ordinary shares by employee share ownership trusts (1.8) (0.2)Sale of own ordinary shares by employee share ownership trusts 0.5 0.8Repayments of hire purchase and lease finance (24.1) (58.7)Proceeds of sale and leaseback transaction Nil 3.6Movement in other borrowings (5.1) 53.3Dividends paid on ordinary shares 9 (15.8) (76.7)Sale of tokens 1.4 3.2Redemption of tokens (4.1) (3.4)
Net cash used in financing activities (49.7) (79.9)
Net (decrease)/increase in cash and cash equivalents (16.1) 99.3Cash and cash equivalents at the beginning of year 375.7 277.3Exchange rate effects (1.3) (0.9)
Cash and cash equivalents at the end of year 21 358.3 375.7
Cash and cash equivalents for the purposes of the consolidated cash flow statement comprise cash at bank and in hand, overdrafts and other short-term highly liquid investments with maturities at the balance sheet date of twelve months or less.
The accompanying notes form an integral part of this consolidated statement of cash flows.
Notes £m £m
2011 2010
Stagecoach Group plc | page 45
78189_STC_Back FINAL_78189_StCchV13_BACK 05/07/2011 11:46 Page 45

Notes to the consolidated financial statementsNote 1 IFRS accounting policies These consolidated financial statements are presented in accordance with International Financial Reporting Standards (“IFRS”), as adopted by theEuropean Union.The principal accounting policies adopted in the preparation of these consolidated financial statements are set out below. These policies have beenconsistently applied to all the years presented, unless otherwise stated.
• Basis of preparationThe consolidated financial statements have been prepared in accordance with IFRS and International Financial Reporting Interpretations Committee(“IFRIC”) interpretations as adopted by the European Union (and therefore comply with Article 4 of the EU IAS Regulation), and with those parts of theCompanies Act 2006 applicable to companies reporting under IFRS. The consolidated financial statements have been prepared under the historicalcost convention as modified by financial assets and financial liabilities (including derivative instruments) at fair value.The consolidated financial statements are presented in pounds sterling, the presentational currency of the Group, and the functional currency of theCompany and all values are rounded to the nearest one hundred thousand (£0.1m) except where otherwise indicated.
• New accounting standards adopted during the yearThe following new standard has been applied by the Group for the first time for the financial year beginning 1 May 2010:• IFRS 3 (revised), ‘Business combinations’. The revised standard continues to apply the acquisition method to business combinations but with somesignificant changes compared with the previous version of IFRS 3. For example, all acquisition-related costs should be expensed. The standard wasapplied to the acquisition of the East London bus business on 14 October 2010. Acquisition-related costs of £0.6m have been recognised in theconsolidated income statement, which previously would have been included in the consideration for the business combination.
The following new standards, amendments to standards and interpretations are mandatory for the first time for the financial year beginning 1 May2010, but do not have any significant effect on the consolidated financial statements of the Group:• Amendments resulting from April 2009 Annual Improvements to IFRSs• IFRS 1 (revised), ‘First time adoption of IFRSs – revised and restructured’• IFRS 1 (amended), ‘First time adoption of IFRSs – amendments relating to oil and gas assets and determining whether an arrangement contains alease’
• IFRS 2 (amended), ‘Share-based payment – amendments relating to group cash-settled share-based payment transactions’• IAS 27 (amended), ‘Consolidated and separate financial statements – consequential amendments arising from amendments to IFRS 3’• IAS 28 (amended), ‘Investments in associates – consequential amendments arising from amendments to IFRS 3’• IAS 31 (amended), ‘Investments in joint ventures – consequential amendments arising from amendments to IFRS 3’• IAS 32 (amended), ‘Financial instruments: presentation – amendments relating to classification of rights issues’• IAS 39 (amended), ‘Financial instruments: recognition and measurement – amendments for eligible hedged items’• IAS 39 (amended), ‘Financial instruments: recognition and measurement – amendments for embedded derivatives when reclassifying financialinstruments’
• IFRIC 17, ‘Distributions of non-cash assets to owners’• IFRIC 18, ‘Transfers of assets from customers’
• New standards and interpretations not appliedThe International Accounting Standards Board (“IASB”) and IFRIC have issued the following standards and interpretations with an effective date forfinancial years beginning on or after the dates disclosed below and therefore after the date of these financial statements.International Accounting Standards and Interpretations Effective dateAmendments resulting from May 2010 Annual Improvements to IFRSs 1 January 2011 and laterIFRS 1 First-time adoption of International Financial Reporting Standards (revised January 2010) 1 July 2010IFRS 1 First-time adoption of International Financial Reporting Standards (revised May 2010) 1 January 2011IFRS 1 First-time adoption of International Financial Reporting Standards (revised December 2010) 1 July 2011IFRS 7 Financial Instruments: Disclosures – Amendments enhancing disclosures
about transfers of financial assets. 1 July 2011IFRS 9 Financial Instruments – Classification and measurement (revised November 2009) 1 January 2013IFRS 10 Consolidated Financial Instruments 1 January 2013IFRS 11 Joint Arrangements 1 January 2013IFRS 12 Disclosures of interests in other entities 1 January 2013IFRS 13 Fair value measurement 1 January 2013IAS 1 Presentation of Financial Statements (revised June 2011) 1 July 2012IAS 12 Income Taxes – Limited scope amendment (recovery of underlying assets) 1 January 2012IAS 19 Employee Benefits (revised June 2011) 1 January 2013IAS 24 Related Party Disclosures (revised November 2009) 1 January 2011IAS 27 Consolidated and separate financial statements (amended in 2011) 1 January 2013IAS 28 Investments in Associates and joint ventures (amended in 2011) 1 January 2013IAS 32 Financial Instruments: Presentation – Amendment re classification of rights issue. 1 February 2011 IFRIC14 Amendment re Prepayments of a Minimum Funding Requirement 1 July 2010IFRIC19 Extinguishing Financial Liabilities with Equity Instruments 1 July 2010
The Directors are currently reviewing the requirements of the above standards and interpretations to determine whether they will have a materialimpact on the Group’s financial statements in the period of initial application.
• ComparativesWhere appropriate, comparative figures for the previous year have been adjusted to conform to changes in presentation. These changes have noimpact on the consolidated income statement or on consolidated net assets.
page 46 | Stagecoach Group plc
78189_STC_Back FINAL_78189_StCchV13_BACK 05/07/2011 11:46 Page 46
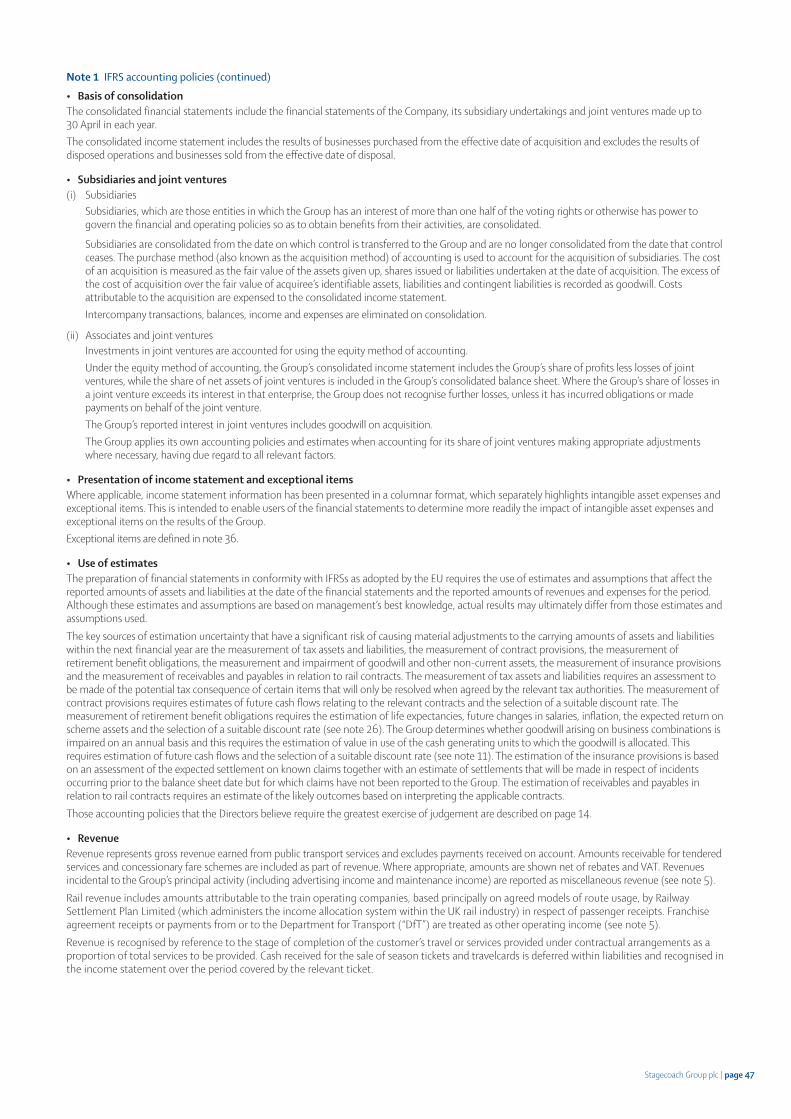
Note 1 IFRS accounting policies (continued)
• Basis of consolidationThe consolidated financial statements include the financial statements of the Company, its subsidiary undertakings and joint ventures made up to30 April in each year.The consolidated income statement includes the results of businesses purchased from the effective date of acquisition and excludes the results ofdisposed operations and businesses sold from the effective date of disposal.
• Subsidiaries and joint ventures(i) Subsidiaries
Subsidiaries, which are those entities in which the Group has an interest of more than one half of the voting rights or otherwise has power togovern the financial and operating policies so as to obtain benefits from their activities, are consolidated.
Subsidiaries are consolidated from the date on which control is transferred to the Group and are no longer consolidated from the date that controlceases. The purchase method (also known as the acquisition method) of accounting is used to account for the acquisition of subsidiaries. The costof an acquisition is measured as the fair value of the assets given up, shares issued or liabilities undertaken at the date of acquisition. The excess ofthe cost of acquisition over the fair value of acquiree’s identifiable assets, liabilities and contingent liabilities is recorded as goodwill. Costsattributable to the acquisition are expensed to the consolidated income statement.Intercompany transactions, balances, income and expenses are eliminated on consolidation.
(ii) Associates and joint venturesInvestments in joint ventures are accounted for using the equity method of accounting.Under the equity method of accounting, the Group’s consolidated income statement includes the Group’s share of profits less losses of jointventures, while the share of net assets of joint ventures is included in the Group’s consolidated balance sheet. Where the Group’s share of losses ina joint venture exceeds its interest in that enterprise, the Group does not recognise further losses, unless it has incurred obligations or madepayments on behalf of the joint venture.The Group’s reported interest in joint ventures includes goodwill on acquisition.The Group applies its own accounting policies and estimates when accounting for its share of joint ventures making appropriate adjustmentswhere necessary, having due regard to all relevant factors.
• Presentation of income statement and exceptional itemsWhere applicable, income statement information has been presented in a columnar format, which separately highlights intangible asset expenses andexceptional items. This is intended to enable users of the financial statements to determine more readily the impact of intangible asset expenses andexceptional items on the results of the Group.Exceptional items are defined in note 36.
• Use of estimatesThe preparation of financial statements in conformity with IFRSs as adopted by the EU requires the use of estimates and assumptions that affect thereported amounts of assets and liabilities at the date of the financial statements and the reported amounts of revenues and expenses for the period.Although these estimates and assumptions are based on management’s best knowledge, actual results may ultimately differ from those estimates andassumptions used.The key sources of estimation uncertainty that have a significant risk of causing material adjustments to the carrying amounts of assets and liabilitieswithin the next financial year are the measurement of tax assets and liabilities, the measurement of contract provisions, the measurement ofretirement benefit obligations, the measurement and impairment of goodwill and other non-current assets, the measurement of insurance provisionsand the measurement of receivables and payables in relation to rail contracts. The measurement of tax assets and liabilities requires an assessment tobe made of the potential tax consequence of certain items that will only be resolved when agreed by the relevant tax authorities. The measurement ofcontract provisions requires estimates of future cash flows relating to the relevant contracts and the selection of a suitable discount rate. Themeasurement of retirement benefit obligations requires the estimation of life expectancies, future changes in salaries, inflation, the expected return onscheme assets and the selection of a suitable discount rate (see note 26). The Group determines whether goodwill arising on business combinations isimpaired on an annual basis and this requires the estimation of value in use of the cash generating units to which the goodwill is allocated. Thisrequires estimation of future cash flows and the selection of a suitable discount rate (see note 11). The estimation of the insurance provisions is basedon an assessment of the expected settlement on known claims together with an estimate of settlements that will be made in respect of incidentsoccurring prior to the balance sheet date but for which claims have not been reported to the Group. The estimation of receivables and payables inrelation to rail contracts requires an estimate of the likely outcomes based on interpreting the applicable contracts.Those accounting policies that the Directors believe require the greatest exercise of judgement are described on page 14.
• RevenueRevenue represents gross revenue earned from public transport services and excludes payments received on account. Amounts receivable for tenderedservices and concessionary fare schemes are included as part of revenue. Where appropriate, amounts are shown net of rebates and VAT. Revenuesincidental to the Group’s principal activity (including advertising income and maintenance income) are reported as miscellaneous revenue (see note 5).Rail revenue includes amounts attributable to the train operating companies, based principally on agreed models of route usage, by RailwaySettlement Plan Limited (which administers the income allocation system within the UK rail industry) in respect of passenger receipts. Franchiseagreement receipts or payments from or to the Department for Transport (“DfT”) are treated as other operating income (see note 5).Revenue is recognised by reference to the stage of completion of the customer’s travel or services provided under contractual arrangements as aproportion of total services to be provided. Cash received for the sale of season tickets and travelcards is deferred within liabilities and recognised inthe income statement over the period covered by the relevant ticket.
Stagecoach Group plc | page 47
78189_STC_Back FINAL_78189_StCchV13_BACK 05/07/2011 11:46 Page 47

Notes to the consolidated financial statementsNote 1 IFRS accounting policies (continued)
• Revenue (continued)
Income from advertising and other activities is recognised as the income is earned.Finance income is recognised using the effective interest method as interest accrues.Under the contractual terms of its franchise agreements to operate rail services, the Group has revenue sharing arrangements with the DfT. As aresult of these arrangements, the Group may be liable to make payments to the DfT or receive amounts from the DfT based on calculations thatinvolve comparison of actual revenue with the target revenue specified in the relevant franchise agreement. The Group recognises revenue shareamounts payable or receivable in the income statement in the same period in which it recognises the related revenue. Revenue share amountspayable (if any) are classified within other operating expense and revenue share amounts receivable (if any) are classified within other operatingincome.
• Performance incentive paymentsPerformance incentive payments made to Network Rail by the Group in respect of train service delivery are recognised in the same period that theperformance relates to and are shown as other operating costs.
• Government grantsGrants from government are recognised where there is reasonable assurance that the grant will be received and the Group will comply with all attachedconditions. Government grants relating to costs are deferred and recognised in the income statement over the period necessary to match them withthe costs they are intended to compensate. Government grants relating to the purchase of property, plant and equipment are recorded as liabilities andare credited to the income statement on a straight-line basis over the expected lives of the related assets. Amounts are held as deferred grant incomewithin trade and other payables.
Revenue grants receivable in respect of the operation of rail franchises in the UK are credited to the income statement in the period in which the relatedexpenditure is recognised in the income statement or where they do not relate to any specific expenditure, in the period in respect of which the grant isreceivable. These rail franchise grants are classified within other operating income.
• Share based paymentsThe Group issues equity-settled and cash-settled share based payments to certain employees.
Equity-settled transactionsThe cost of equity-settled transactions with employees is measured by reference to the fair value at the date at which they are granted and isrecognised as an expense over the vesting period. In valuing equity-settled transactions, no account is taken of any non-market based vesting conditions and no expense is recognised for awards that do not ultimately vest as a result of a failure to satisfy a non-market based vesting condition.None of the Group’s equity-settled transactions have any market based performance conditions.Fair value for equity-settled share based payments is estimated by use of the Black-Scholes pricing model. At each balance sheet date, before vesting, the cumulative expense is calculated based on management’s best estimate of the number of equityinstruments that will ultimately vest taking into consideration the likelihood of achieving non-market based vesting conditions. The movement in thiscumulative expense is recognised in the income statement, with a corresponding entry in equity.Where an equity-settled award is cancelled by the Group or the holder, it is treated as if it had vested on the date of cancellation and any cost not yetrecognised in the income statement for the award is expensed immediately. Any compensation paid up to the fair value of the award at thecancellation or settlement date is deducted from equity, with any excess over fair value being treated as an expense in the income statement.
Cash-settled transactionsThe cost of cash-settled transactions is measured at fair value. Fair value is estimated initially at the grant date and at each balance sheet datethereafter until the awards are settled. Market based performance conditions are taken into account when determining fair value. Fair value for cash-settled share based payments (being only those that relate to the Long Term Incentive Plan) is estimated by use of a simulation model.During the vesting period, a liability is recognised representing the estimated fair value of the award and the portion of the vesting period expired as atthe balance sheet date. Changes in the carrying amount of the liability are recognised in the income statement for the period.
Choice of settlementThe Company can choose to settle awards under the Long Term Incentive Plan in either cash or equity, although it currently expects to settle all suchawards in cash. Awards under the Long Term Incentive Plan are accounted for as cash-settled transactions (see above).
• Operating profitOperating profit is stated after charging restructuring costs and after the share of after-tax results of joint ventures but before finance income, financecosts, non-operating exceptional items, taxation and profit from discontinued operations.
• TaxationTax, current and deferred, is calculated using tax rates and laws enacted or substantively enacted at the balance sheet date. Management periodicallyevaluates positions taken in tax returns with respect to situations in which applicable tax regulation is subject to interpretation.Corporation tax is provided on taxable profit at the current rate applicable. Tax charges and credits are accounted for through the same primarystatement as the related pre-tax item.Deferred income tax is provided in full, using the liability method, on temporary differences arising between the tax bases of assets and liabilities andtheir carrying amounts in the financial statements. Deferred income tax is measured at tax rates that are expected to apply in periods in which thetemporary differences reverse based on tax rates and law enacted or substantively enacted at the balance sheet date.Deferred tax assets are recognised to the extent that it is probable that future taxable profit will be available against which the temporary differencescan be utilised.
page 48 | Stagecoach Group plc
78189_STC_Back FINAL_78189_StCchV13_BACK 05/07/2011 11:46 Page 48

Note 1 IFRS accounting policies (continued)
• Taxation (continued)
Deferred income tax is provided on temporary differences arising on investments in subsidiaries and joint ventures, except where the timing of thereversal of the temporary difference can be controlled and it is probable that the temporary difference will not reverse in the foreseeable future.
• Segment reportingOperating segments are reported in a manner consistent with the internal reporting provided to the chief operating decision-maker, who is responsiblefor allocating resources and assessing performance of operating segments, which for this purpose has been identified as the Board of Directors.
• Foreign currency translationThe financial statements of foreign operations are maintained in the functional currencies in which the entities transact business. The trading results offoreign operations are translated into sterling using average rates of exchange. The assets and liabilities of foreign operations, including goodwill and fairvalue adjustments arising on acquisition, are translated into sterling using rates of exchange at the relevant balance sheet date. Exchange differences arisingon the translation of the opening net assets and results of overseas operations, together with exchange differences arising on net foreign currencyborrowings and foreign currency derivatives, to the extent they hedge the Group’s investment in overseas operations, are recognised as a separatecomponent of equity being the translation reserve. Further information on the Group’s accounting policy on hedges of net investments in a foreign entityis provided on page 53.Foreign currency monetary assets and liabilities are translated into the respective functional currencies of the Group entities at the rates of exchangeruling at the balance sheet date. Foreign currency transactions arising during the year are translated into the respective functional currencies of Groupentities at the rate of exchange ruling on the date of the transaction. Foreign currency differences arising on retranslation are recognised in profit or loss.On disposal of a foreign subsidiary, the amount of any exchange differences relating to the subsidiary that has been deferred in the translation reserve isrecognised in the income statement within the reported gain or loss on disposal. The principal rates of exchange applied to the consolidated financial statements were:
• Business combinations and goodwillOn the acquisition of a business, fair values are attributed to the identifiable assets, liabilities and contingent liabilities of the acquiree. Goodwillrepresents the excess of the fair value of the consideration given for a business over the fair value of such net assets. The fair value of intangible assetsand acquired customer contract provisions on the acquisition of a business are amortised to the income statement in line with the projected cash flows.Goodwill arising on acquisitions is capitalised and is subject to impairment review, both annually and when there are indications that the carrying valuemay not be recoverable. Prior to 1 May 2004, goodwill was amortised over its estimated useful life; such amortisation ceased on 30 April 2004 butgoodwill amortisation expensed prior to 1 May 2004 was not reversed. Goodwill that arose prior to 1 May 2004 is measured at the amount recognisedunder the Group’s previous accounting framework, UK GAAP.Goodwill arising on acquisitions in the year ended 30 April 1998 and earlier periods was written off directly to equity in accordance with the UKaccounting standards then in force. Under IFRS 1 and IFRS 3, such goodwill remains eliminated against reserves.For the purpose of impairment testing, goodwill is allocated to each of the Group’s cash generating units expected to benefit from the combination.Cash generating units to which goodwill has been allocated are tested for impairment annually, or more frequently when there is an indication that theunit may be impaired. If the recoverable amount of the cash generating unit is less than the carrying amount of the unit, then the impairment loss isallocated first to reduce the carrying amount of any goodwill allocated to the unit and then to the other assets of the unit pro-rata on the basis of thecarrying amount of each asset in the unit. The recoverable amount is the higher of fair value less costs to sell and value in use. In assessing value in use,the estimated future cash flows are discounted to their present value using a pre-tax discount rate that reflects current market assessments of the timevalue of money and the risks specific to the cash generating unit. An impairment loss recognised for goodwill is not reversed in a subsequent period.Any impairment of goodwill is recognised immediately in the income statement. Where goodwill (other than that already written off directly to equity) forms part of a cash generating unit and all or part of that unit is disposed of, theassociated goodwill is included in the carrying amount of the disposed operation when determining the overall gain or loss on disposal.
• Impairment of non-current assetsProperty, plant and equipment, intangible assets (excluding goodwill), financial assets and other non-current assets are reviewed for impairmentwhenever events or changes in circumstances indicate that the carrying amount may not be recoverable. An impairment loss is recognised for the amount by which the carrying amount of the asset exceeds its recoverable amount, which is the higher of fairvalue less costs to sell and value in use. For the purposes of assessing impairment, assets are grouped at the lowest level for which there are separatelyidentifiable cash flows. Non-financial assets other than goodwill that have suffered an impairment are reviewed for possible reversal at each reportingdate.In assessing value in use, the estimated future cash flows are discounted to their present value using a pre-tax discount rate that reflects current marketassessments of the time value of money and the risks specific to the asset. Any impairment loss is recognised immediately in the income statement.Marketing costs incurred during the start-up phase of a new activity are charged to the income statement as incurred.
Stagecoach Group plc | page 49
2011 2010
US Dollar:Year end rate 1.6680 1.5307Average rate 1.5646 1.6020Canadian Dollar:Year end rate 1.5827 1.5504Average rate 1.5823 1.7189
78189_STC_Back FINAL_78189_StCchV13_BACK 05/07/2011 11:46 Page 49

Notes to the consolidated financial statementsNote 1 IFRS accounting policies (continued)• Intangible assetsIntangible assets acquired separately from a business combination are initially capitalised at cost and subsequently measured at cost less accumulatedamortisation and accumulated impairment losses. The initial cost recognised is the aggregate amount paid plus the fair value of any otherconsideration given to acquire the asset. Intangible assets acquired as part of a business combination are capitalised, separately from goodwill, at fairvalue at the date of acquisition if the asset is separable or arises from contractual or legal rights and its fair value can be measured reliably and aresubsequently measured at fair value less accumulated amortisation and accumulated impairment losses.Amortisation is calculated on the straight-line method to write-off the cost or fair value at acquisition (as the case may be) of each asset over theirestimated useful lives shown below. Intangible assets relating to rail franchises of a finite duration are amortised over the life of the franchise.Customer contracts over the life of the contract (1 to 5 years for current contracts)Right to operate rail franchises over the life of the franchise (10 years from February 2007 to February 2017 for South Western
Trains franchise and 7 years and 4 months from November 2007 to March 2015 for East Midlands Trains franchise)
Non-compete contracts between 2 and 5 years for current contractsSoftware costs 2 to 7 years
• Property, plant and equipmentProperty, plant and equipment acquired as part of a business combination is stated at fair value at the date of acquisition and is subsequently measuredat fair value on acquisition less accumulated depreciation and any provision for impairment. All other property, plant and equipment is stated at costless accumulated depreciation and any provision for impairment. Cost includes the original purchase price of the asset and the costs attributable tobringing the asset to its working condition for its intended use.
Depreciation is calculated on the straight-line method to write off the cost, fair value at acquisition or deemed cost of each asset to their residual valuesover their estimated useful lives as follows:Heritable and freehold buildings and long leasehold properties 50 yearsShort leasehold properties period of leaseIT and other equipment, furniture and fittings 3 to 10 yearsPassenger Service Vehicles (“PSVs”) and transportation equipment 7 to 16 yearsMotor cars and other vehicles 3 to 5 years
Freehold land is not depreciated.
The useful lives and residual values of property, plant and equipment are reviewed at least annually and, where applicable, adjustments are made on aprospective basis.
An item of property, plant or equipment is derecognised upon disposal. An item on which no future economic benefits are expected to arise from thecontinued use of the asset is impaired if it is continued to be used by the Group. Gains and losses on disposals are determined by comparing theproceeds received with the carrying amount of the asset and are included in the income statement. Any gain or loss on derecognition of the asset isincluded in the income statement in the period of derecognition.
Repairs and maintenance are charged to the income statement during the financial period in which they are incurred. The cost of major renovations isincluded in the carrying amount of the asset when it is probable that future economic benefits in excess of the originally assessed standard ofperformance of the existing asset will flow to the Group. Major renovations are depreciated over the remaining useful life of the related asset.
• InventoriesInventories are stated at the lower of cost and net realisable value after making due allowance for obsolete or slow moving items. Cost is determinedusing the first-in, first-out (“FIFO”) or average cost method. Net realisable value is the estimated selling price in the ordinary course of business, less thecosts of completion and selling expenses.
• Pre-contract costsThe costs associated with securing new rail franchises are expensed as incurred, except when at the time the costs are incurred it is probable that acontract will be awarded, in which case they are recognised as an asset and are charged to the income statement over the life of the franchise.
• Hire purchase and lease obligationsAssets acquired under hire purchase and finance lease arrangements, where substantially all the risks and rewards of ownership of the asset have passedto the Group, are capitalised at the commencement of the lease at the fair value of the leased asset or, if lower, at the present value of the minimumlease payments. Fixed lease payments are apportioned between the finance costs, and the reduction of the lease liability so as to achieve a constantrate of interest on the remaining balance of the liability. Finance costs are charged directly against income and are reported within finance costs in theconsolidated income statement.Assets capitalised under finance leases and other similar contracts are depreciated over the shorter of the lease terms and their useful economic lives.Assets capitalised under hire purchase contracts are depreciated over their useful economic lives.Rentals under operating leases are charged on a straight-line basis over the lease term.The principal restriction on assets held under finance lease or hire purchase agreements is a restriction on the right to dispose of the assets during theperiod of the agreement.
• TokensTokens issued by National Transport Tokens Limited, a subsidiary of the Group, to facilitate public passenger travel in the United Kingdom are creditedto a token redemption provision to the extent they are expected to be redeemed by customers. Redemptions are offset against this provision andassociated handling commission paid to third parties is included in operating costs. Funds from the sale of tokens required for token redemption areincluded as a financing activity in the consolidated statement of cash flows.
page 50 | Stagecoach Group plc
78189_STC_Back FINAL_78189_StCchV13_BACK 05/07/2011 11:46 Page 50
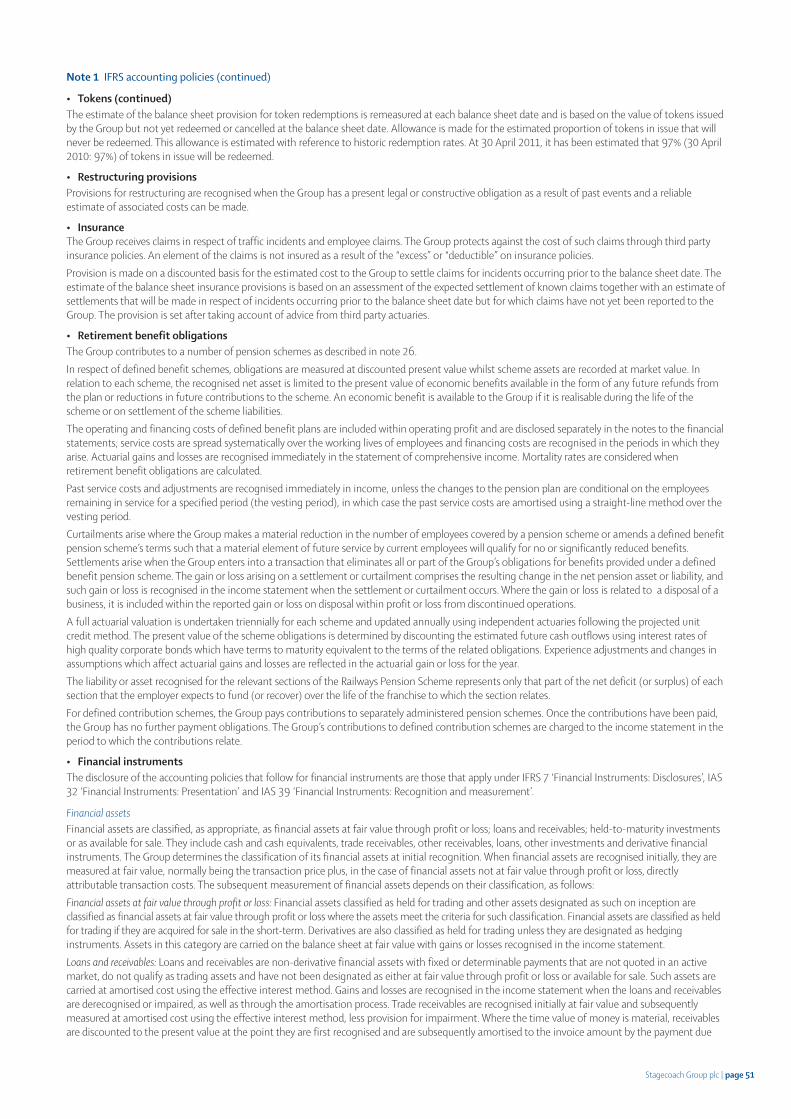
Note 1 IFRS accounting policies (continued)
• Tokens (continued)The estimate of the balance sheet provision for token redemptions is remeasured at each balance sheet date and is based on the value of tokens issuedby the Group but not yet redeemed or cancelled at the balance sheet date. Allowance is made for the estimated proportion of tokens in issue that willnever be redeemed. This allowance is estimated with reference to historic redemption rates. At 30 April 2011, it has been estimated that 97% (30 April2010: 97%) of tokens in issue will be redeemed.
• Restructuring provisionsProvisions for restructuring are recognised when the Group has a present legal or constructive obligation as a result of past events and a reliableestimate of associated costs can be made.
• InsuranceThe Group receives claims in respect of traffic incidents and employee claims. The Group protects against the cost of such claims through third partyinsurance policies. An element of the claims is not insured as a result of the “excess” or “deductible” on insurance policies.Provision is made on a discounted basis for the estimated cost to the Group to settle claims for incidents occurring prior to the balance sheet date. Theestimate of the balance sheet insurance provisions is based on an assessment of the expected settlement of known claims together with an estimate ofsettlements that will be made in respect of incidents occurring prior to the balance sheet date but for which claims have not yet been reported to theGroup. The provision is set after taking account of advice from third party actuaries.
• Retirement benefit obligationsThe Group contributes to a number of pension schemes as described in note 26.In respect of defined benefit schemes, obligations are measured at discounted present value whilst scheme assets are recorded at market value. Inrelation to each scheme, the recognised net asset is limited to the present value of economic benefits available in the form of any future refunds fromthe plan or reductions in future contributions to the scheme. An economic benefit is available to the Group if it is realisable during the life of thescheme or on settlement of the scheme liabilities.The operating and financing costs of defined benefit plans are included within operating profit and are disclosed separately in the notes to the financialstatements; service costs are spread systematically over the working lives of employees and financing costs are recognised in the periods in which theyarise. Actuarial gains and losses are recognised immediately in the statement of comprehensive income. Mortality rates are considered whenretirement benefit obligations are calculated.Past service costs and adjustments are recognised immediately in income, unless the changes to the pension plan are conditional on the employeesremaining in service for a specified period (the vesting period), in which case the past service costs are amortised using a straight-line method over thevesting period.Curtailments arise where the Group makes a material reduction in the number of employees covered by a pension scheme or amends a defined benefitpension scheme’s terms such that a material element of future service by current employees will qualify for no or significantly reduced benefits.Settlements arise when the Group enters into a transaction that eliminates all or part of the Group’s obligations for benefits provided under a definedbenefit pension scheme. The gain or loss arising on a settlement or curtailment comprises the resulting change in the net pension asset or liability, andsuch gain or loss is recognised in the income statement when the settlement or curtailment occurs. Where the gain or loss is related to a disposal of abusiness, it is included within the reported gain or loss on disposal within profit or loss from discontinued operations.A full actuarial valuation is undertaken triennially for each scheme and updated annually using independent actuaries following the projected unitcredit method. The present value of the scheme obligations is determined by discounting the estimated future cash outflows using interest rates ofhigh quality corporate bonds which have terms to maturity equivalent to the terms of the related obligations. Experience adjustments and changes inassumptions which affect actuarial gains and losses are reflected in the actuarial gain or loss for the year.The liability or asset recognised for the relevant sections of the Railways Pension Scheme represents only that part of the net deficit (or surplus) of eachsection that the employer expects to fund (or recover) over the life of the franchise to which the section relates. For defined contribution schemes, the Group pays contributions to separately administered pension schemes. Once the contributions have been paid,the Group has no further payment obligations. The Group’s contributions to defined contribution schemes are charged to the income statement in theperiod to which the contributions relate.
• Financial instrumentsThe disclosure of the accounting policies that follow for financial instruments are those that apply under IFRS 7 ‘Financial Instruments: Disclosures’, IAS32 ‘Financial Instruments: Presentation’ and IAS 39 ‘Financial Instruments: Recognition and measurement’.
Financial assetsFinancial assets are classified, as appropriate, as financial assets at fair value through profit or loss; loans and receivables; held-to-maturity investmentsor as available for sale. They include cash and cash equivalents, trade receivables, other receivables, loans, other investments and derivative financialinstruments. The Group determines the classification of its financial assets at initial recognition. When financial assets are recognised initially, they aremeasured at fair value, normally being the transaction price plus, in the case of financial assets not at fair value through profit or loss, directlyattributable transaction costs. The subsequent measurement of financial assets depends on their classification, as follows:Financial assets at fair value through profit or loss: Financial assets classified as held for trading and other assets designated as such on inception areclassified as financial assets at fair value through profit or loss where the assets meet the criteria for such classification. Financial assets are classified as heldfor trading if they are acquired for sale in the short-term. Derivatives are also classified as held for trading unless they are designated as hedginginstruments. Assets in this category are carried on the balance sheet at fair value with gains or losses recognised in the income statement.Loans and receivables: Loans and receivables are non-derivative financial assets with fixed or determinable payments that are not quoted in an activemarket, do not qualify as trading assets and have not been designated as either at fair value through profit or loss or available for sale. Such assets arecarried at amortised cost using the effective interest method. Gains and losses are recognised in the income statement when the loans and receivablesare derecognised or impaired, as well as through the amortisation process. Trade receivables are recognised initially at fair value and subsequentlymeasured at amortised cost using the effective interest method, less provision for impairment. Where the time value of money is material, receivablesare discounted to the present value at the point they are first recognised and are subsequently amortised to the invoice amount by the payment due
Stagecoach Group plc | page 51
78189_STC_Back FINAL_78189_StCchV13_BACK 05/07/2011 11:46 Page 51

Notes to the consolidated financial statementsNote 1 IFRS accounting policies (continued)
• Financial instruments (continued)Financial assets (continued)date. A provision for impairment of trade receivables is established when there is objective evidence that the Group will not be able to collect allamounts due according to the original terms of the receivables. Significant financial difficulties of the debtor, probability that the debtor will enterbankruptcy or financial reorganisation, and default or delinquency in payments are considered in evaluating whether a trade receivable is impaired. Theamount of the provision is the difference between the asset’s carrying amount and the present value of estimated future cash flows, discounted at theoriginal effective interest rate. The carrying amount of the asset is reduced through the use of an allowance account, and the amount of the loss isrecognised in the income statement within ‘Other external charges’. When a trade receivable is uncollectable, it is written off against the allowanceaccount for trade receivables. An impairment loss is reversed if the reversal can be related objectively to an event occurring after the impairment losswas recognised. For financial assets measured at amortised cost, the reversal is recognised in profit or loss.Held-to-maturity investments: The Group has no financial assets classified as held-to-maturity investments.Available for sale financial assets: Available for sale financial assets are those non-derivative financial assets that are designated as such or are notclassified in any of the above categories. These are included in non-current assets unless the Group intends to dispose of them within 12 months of thebalance sheet date. After initial recognition, available for sale financial assets are measured at fair value, with gains or losses being recognised as aseparate component of equity until the asset is derecognised or until the asset is determined to be impaired, at which time the cumulative gain or lossreported in equity is included in the income statement.
The Group assesses at each balance sheet date whether there is objective evidence that a financial asset or group of financial assets is impaired. In thecase of equity securities classified as available for sale, a significant or prolonged decline in the fair value of the security below its cost is considered anindicator that the securities are impaired. If any such evidence exists for available for sale financial assets, the cumulative loss - measured as thedifference between the acquisition cost and the current fair value, less any impairment loss on that financial asset previously recognised in profit or loss- is removed from equity and is recognised in the income statement. Impairment losses recognised in the income statement on equity instruments arenot reversed through the income statement.
Financial liabilitiesWhen a financial liability is recognised initially, the Group measures it at its fair value plus, in the case of a financial liability not at fair value throughprofit or loss, transaction costs that are directly attributable to the issue of the financial liability. Financial liabilities include trade payables, otherpayables, borrowings and derivative financial instruments. Subsequent measurement depends on its classification as follows:Financial liabilities at fair value through profit or loss: Financial liabilities classified as held for trading and derivative liabilities that are not designated aseffective hedging instruments are classified as financial liabilities at fair value through profit or loss. Such liabilities are carried on the balance sheet atfair value with gains or losses being recognised in the income statement.Other: All other financial liabilities not classified as fair value through profit or loss are measured at amortised cost using the effective interest method.
Fair valuesThe fair value of quoted investments is determined by reference to appropriate market prices at the close of business on the balance sheet date. Wherethere is no active market, fair value is determined using valuation techniques. These include using pricing models and discounted cash flow analysis.
Derivative financial instrumentsDerivative financial instruments are initially recognised at fair value on the date on which a derivative contract is entered into and are subsequently re-measured at fair value. Derivatives are carried as assets when the fair value is positive and as liabilities when the fair value is negative.For those derivatives designated as hedges and for which hedge accounting is desired, the hedging relationship is documented at its inception. Thisdocumentation identifies the hedging instrument, the hedged item or transaction, the nature of the risk being hedged and how effectiveness will bemeasured throughout its duration. Such hedges are expected at inception to be highly effective.For the purpose of hedge accounting, hedges are classified as:– Fair value hedges when hedging the exposure to changes in the fair value of a recognised asset or liability;– Cash flow hedges when hedging exposure to variability in cash flows that is either attributable to a particular risk associated with a recognised
asset or liability or a highly probable forecast transaction, including intra-group transactions; or– Hedges of net investment in a foreign entity.
Net gains or losses arising from changes in the fair value of all other derivatives, which are classified as held for trading, are taken to the incomestatement. These may arise from derivatives for which hedge accounting is not applied because they are either not designated or not effective ashedging instruments from an accounting perspective.The treatment of gains and losses arising from revaluing derivatives designated as hedging instruments depends on the nature of the hedgingrelationship, as follows:Fair value hedges: For fair value hedges, the carrying amount of the hedged item is adjusted for gains and losses attributable to the risk being hedged;the derivative is remeasured at fair value and gains and losses from both the derivative and the hedged item are taken to the income statement. The Group discontinues fair value hedge accounting if the hedging instrument expires or is sold, terminated or exercised, the hedge no longer meetsthe criteria for hedge accounting or the Group revokes the designation.For hedged items carried at amortised cost, the hedge adjustment is amortised through the income statement such that it is fully amortised bymaturity. Cash flow hedges: For cash flow hedges, the effective portion of the gain or loss on the hedging instrument is recognised in the statement ofcomprehensive income, while the ineffective portion is recognised in the income statement. Amounts recorded in the statement of comprehensiveincome are transferred to the income statement when the hedged transaction affects profit or loss, such as when a forecast sale or purchase occurs. Forcash flow hedges of forecast fuel purchases, the transfer is to operating costs within the income statement.If the hedging instrument expires or is sold, terminated or exercised without replacement or rollover, or if its designation as a hedge is revoked,amounts previously recorded in the statement of recognised income remain in equity until the forecast transaction occurs and are then transferred tothe income statement. If a forecast transaction is no longer expected to occur, amounts previously recognised in the statement of comprehensiveincome are transferred to the income statement immediately.
page 52 | Stagecoach Group plc
78189_STC_Back FINAL_78189_StCchV13_BACK 05/07/2011 11:46 Page 52

Note 1 IFRS accounting policies (continued)
• Financial instruments (continued)Hedges of net investment in a foreign entity: For hedges of the net investment in a foreign entity, the effective portion of the gain or loss on the hedginginstrument is recorded in the statement of comprehensive income, while the ineffective portion is recognised in the income statement. Amountsrecorded in the statement of comprehensive income are transferred to the income statement when the foreign entity is sold.Non-derivative financial liabilities can be designated as hedges of a net investment in a foreign entity and are subject to the same requirements asderivative hedges of a net investment in a foreign entity.
Cash and cash equivalentsFor the purposes of the cash flow statement, cash and cash equivalents comprise cash on hand, deposits held at call with banks and other short-termhighly liquid investments.
Interest bearing loans and borrowingsBorrowings are recognised initially at the proceeds received, net of transaction costs incurred. Borrowings are subsequently stated at amortised costusing the effective yield method subject to any adjustments in respect of fair value hedges; any difference between proceeds (net of transaction costs)and the redemption value is recognised in the income statement over the period of the borrowings. Interest on borrowings to purchase property, plantand equipment is expensed in the income statement.Borrowings are classified as current liabilities unless the Group has an unconditional right to defer or rollover settlement for at least 12 months afterthe balance sheet date.
Trade and other payablesTrade and other payables are generally not interest bearing and are stated at amortised cost which approximates to nominal value due to creditors daysbeing relatively low.
Preferred sharesPreferred shares, which are redeemable on a specific date or at the option of the shareholder, or which carry non-discretionary dividend obligations, areclassified as liabilities. The dividend on these preferred shares is recognised in the income statement as an interest expense.
Share capital and dividendsOrdinary shares are classified as equity. Incremental external costs directly attributable to the issue of new ordinary shares are shown in equity as a deduction, net of tax, from the proceeds.Where the Company, its subsidiaries or employee share ownership trusts sponsored by the Company purchase ordinary shares in the Company, theconsideration paid, including any attributable incremental external costs net of income taxes, is deducted from equity. Where such shares aresubsequently sold or reissued, any consideration received is included in equity.Dividends on ordinary shares are recorded in the Group’s financial statements in the period in which they are approved by the Group’s shareholders, orin the case of interim dividends, in the period in which they are paid.The accounting policy in relation to preferred shares and dividends payable on such shares is included in the accounting policy for financial instrumentsabove.
Note 2 Segmental information
Management has determined the operating segments based on the reports reviewed by the Board of Directors that are used to make strategicdecisions. The Group is managed, and reports internally, on a basis consistent with its four continuing operating segments, being UK Bus (regionaloperations), UK Bus (London), North America and UK Rail. The Group’s IFRS accounting policies are applied consistently, where appropriate, to eachsegment.
The segmental information provided in this note is on the basis of four operating segments as follows:
Segment name Service operated Country of operationUK Bus (regional operations) Coach and bus operations United KingdomUK Bus (London) Bus operations United KingdomNorth America Coach and bus operations USA and CanadaUK Rail Rail operations United Kingdom
The basis of segmentation is consistent with the Group’s last annual financial statements for the year ended 30 April 2010, except that the new UK Bus(London) operating segment consists of the East London Bus business acquired by the Group in October 2010. Management has determined that theEast London Bus business should be treated as a separate operating segment as it is managed separately to our UK Bus regional operations and isreported separately to the Board of Directors, reflecting the different risk profile of the business.The Group has interests in three trading joint ventures: Virgin Rail Group that operates in UK Rail, Citylink that operates in UK Bus (regional operations)and Twin America LLC that operates in North America. The results of these joint ventures are shown separately in notes 2(c) and 2(g). The Group hasan interest in a non-trading joint venture, New York Splash Tours LLC, which operated in North America until trading ceased in the year ended 30 April2010.
(a) RevenueDue to the nature of the Group’s business, the origin and destination of revenue is the same in all cases. As the Group sells bus and rail services toindividuals, it has few customers that are individually “major”. Its major customers are typically public bodies that subsidise or procure transport services– such customers include local authorities, transport authorities and the UK Department for Transport.
Stagecoach Group plc | page 53
78189_STC_Back FINAL_78189_StCchV13_BACK 05/07/2011 11:46 Page 53

(b) Operating profit
Operating profit split by segment was as follows:
The reported operating loss for UK Bus (London) of £5.9m is after taking account of (i) a £3.2m release from the provision that was recorded as atacquisition in respect of acquired customer contracts and (ii) £9.9m of costs in relation to rebasing of staff terms and conditions.
Continuing operationsUK Bus (regional operations) 153.1 Nil 153.1 126.1 (2.6) 123.5UK Bus (London) (5.9) Nil (5.9) Nil Nil NilNorth America 19.3 Nil 19.3 9.1 Nil 9.1
Total bus continuing operations 166.5 Nil 166.5 135.2 (2.6) 132.6UK Rail 48.4 Nil 48.4 41.6 Nil 41.6
Total continuing operations 214.9 Nil 214.9 176.8 (2.6) 174.2Group overheads (11.3) Nil (11.3) (11.6) Nil (11.6)Intangible asset expenses Nil (10.1) (10.1) Nil (6.0) (6.0)Restructuring costs (2.9) Nil (2.9) (1.2) 0.8 (0.4)
Total operating profit of continuingGroup companies 200.7 (10.1) 190.6 164.0 (7.8) 156.2Share of joint ventures’ profitafter finance income and taxation 39.5 (5.1) 34.4 28.0 (5.1) 22.9
Total operating profit: Group operating profit and share of joint ventures’profit after taxation 240.2 (15.2) 225.0 192.0 (12.9) 179.1
Performance Performance pre intangibles Intangibles and pre intangibles Intangibles and
and exceptional Results for and exceptional Results forexceptional items items the year exceptional items items the year
£m £m £m £m £m £m
2011 2010
Notes to the consolidated financial statementsNote 2 Segmental information (continued)
(a) Revenue (continued)Revenue split by segment was as follows:
2011 2010
£m £m
Continuing operationsUK Bus (regional operations) 893.6 875.4UK Bus (London) 133.6 NilNorth America 295.1 266.1
Total bus continuing operations 1,322.3 1,141.5UK Rail 1,070.0 1,026.7
Total Group revenue 2,392.3 2,168.2Intra-Group revenue – UK Bus (regional operations) (2.5) (3.8)
Reported Group revenue 2,389.8 2,164.4
page 54 | Stagecoach Group plc
78189_STC_Back FINAL_78189_StCchV13_BACK 05/07/2011 11:46 Page 54

(d) Gross assets and liabilitiesAssets and liabilities split by segment were as follows:
UK Bus (regional operations) 733.9 (240.0) 493.9 693.3 (323.9) 369.4UK Bus (London) 146.0 (92.1) 53.9 Nil Nil NilNorth America 266.9 (76.3) 190.6 271.7 (83.7) 188.0UK Rail 232.5 (411.6) (179.1) 196.6 (416.6) (220.0)
1,379.3 (820.0) 559.3 1,161.6 (824.2) 337.4
Central functions 29.3 (38.4) (9.1) 25.2 (69.8) (44.6)Joint ventures 58.1 Nil 58.1 56.7 Nil 56.7Borrowings and cash 358.3 (654.6) (296.3) 375.7 (676.9) (301.2)Taxation 1.4 (67.2) (65.8) 2.7 (38.3) (35.6)
Total 1,826.4 (1,580.2) 246.2 1,621.9 (1,609.2) 12.7
Central assets and liabilities include the token provision, interest payable and receivable and other net assets of the holding company and other headoffice companies.Segment assets and liabilities are determined by identifying the assets and liabilities that relate to the business of each segment but excluding intra-Group balances, cash, borrowings, taxation, interest payable, interest receivable and the token provision.
Note 2 Segmental information (continued)
(c) Joint ventures
The share of profit from joint ventures was further split as follows:
Continuing Virgin Rail Group (UK Rail)Operating profit 39.5 Nil 39.5 25.5 Nil 25.5Finance income (net) 0.2 Nil 0.2 0.2 Nil 0.2Taxation (11.3) Nil (11.3) (6.5) Nil (6.5)
28.4 Nil 28.4 19.2 Nil 19.2Goodwill charged on investment in continuing joint ventures Nil (5.1) (5.1) Nil (5.1) (5.1)
28.4 (5.1) 23.3 19.2 (5.1) 14.1
Citylink (UK Bus, regional operations)
Operating profit 2.5 Nil 2.5 1.7 Nil 1.7Taxation (0.7) Nil (0.7) (0.5) Nil (0.5)
1.8 Nil 1.8 1.2 Nil 1.2
New York Splash Tours LLC (North America)
Operating loss Nil Nil Nil (0.9) Nil (0.9)
Nil Nil Nil (0.9) Nil (0.9)
Twin America LLC (North America)
Operating profit 9.7 Nil 9.7 8.9 Nil 8.9Taxation (0.4) Nil (0.4) (0.4) Nil (0.4)
9.3 Nil 9.3 8.5 Nil 8.5
Share of profit of joint ventures after financeincome and taxation 39.5 (5.1) 34.4 28.0 (5.1) 22.9
2011 2010
Performance Performance pre intangibles Intangibles and pre intangibles Intangibles and
and exceptional Results for and exceptional Results forexceptional items items the year exceptional items items the year
£m £m £m £m £m £m
2011 2010
Stagecoach Group plc | page 55
Gross Net assets/ Gross Net assets/assets Gross liabilities (liabilities) assets Gross liabilities (liabilities)£m £m £m £m £m £m
78189_STC_Back FINAL_78189_StCchV13_BACK 05/07/2011 11:46 Page 55

Notes to the consolidated financial statementsNote 2 Segmental information (continued) (e) Capital expenditure on property, plant and equipmentThe capital expenditure on property, plant and equipment is shown below and is on an accruals basis, not on a cash basis, and includes expenditure onproperty, plant and equipment through business combinations.
UK Bus (regional operations) 85.1 98.2UK Bus (London) 99.3 NilNorth America 31.4 14.5UK Rail 34.2 45.1
250.0 157.8
Capital expenditure, excluding business combinations is analysed in section 3.8.10 of the Operating and Financial Review.
(f) Capital expenditure on intangible assetsThe capital expenditure on intangible assets (including goodwill) is shown below and includes acquisitions through business combinations.
UK Bus (regional operations) 0.5 2.2UK Bus (London) 21.4 NilUK Rail Nil 0.9
21.9 3.1
(g) Earnings before interest, tax, depreciation and amortisation (“EBITDA”)The results of each segment are further analysed below:
Year ended 30 April 2011
EBITDA Operating profitEBITDA Joint venture including joint pre intangibles Intangible Allocation
pre-exceptional interest and venture interest Depreciation and exceptional asset Exceptional of restructuring Operatingitems tax and tax expense items expenses items costs profit£m £m £m £m £m £m £m £m £m
£m £m
2011 2010
UK Bus (regional operations) 180.9 Nil 180.9 (54.8) 126.1 (3.1) (2.6) (0.2) 120.2North America 29.2 Nil 29.2 (20.1) 9.1 (0.4) Nil (0.3) 8.4UK Rail – subsidiaries 58.3 Nil 58.3 (16.7) 41.6 (2.5) Nil 0.3 39.4UK Rail – joint venture (Virgin
Rail Group) 25.5 (6.3) 19.2 Nil 19.2 (5.1) Nil Nil 14.1UK Bus – joint venture (Citylink) 1.7 (0.5) 1.2 Nil 1.2 Nil Nil Nil 1.2North America – joint ventures
(Splash Tours andTwin America) 8.0 (0.4) 7.6 Nil 7.6 Nil Nil Nil 7.6
Group overheads (11.3) Nil (11.3) (0.3) (11.6) Nil Nil (0.2) (11.8)Restructuring costs (1.2) Nil (1.2) Nil (1.2) Nil 0.8 0.4 Nil
291.1 (7.2) 283.9 (91.9) 192.0 (11.1) (1.8) Nil 179.1
Year ended 30 April 2010
EBITDA Operating profitEBITDA Joint venture including joint Depreciation pre intangibles Intangible Allocation
pre-exceptional interest and venture interest & impairment and exceptional asset Exceptional of restructuring Operatingitems tax and tax expense items expenses items costs profit£m £m £m £m £m £m £m £m £m
£m £m
2011 2010
page 56 | Stagecoach Group plc
UK Bus (regional operations) 213.9 Nil 213.9 (60.8) 153.1 (1.2) Nil (0.3) 151.6UK Bus (London) (3.2) Nil (3.2) (2.7) (5.9) (6.3) Nil (0.3) (12.5)North America 40.4 Nil 40.4 (21.1) 19.3 (0.1) Nil (0.7) 18.5UK Rail – subsidiaries 54.0 Nil 54.0 (5.6) 48.4 (2.5) Nil (1.3) 44.6UK Rail – joint venture (Virgin
Rail Group) 39.5 (11.1) 28.4 Nil 28.4 (5.1) Nil Nil 23.3UK Bus – joint venture (Citylink) 2.5 (0.7) 1.8 Nil 1.8 Nil Nil Nil 1.8North America – joint ventures
(Splash Tours andTwin America) 9.7 (0.4) 9.3 Nil 9.3 Nil Nil Nil 9.3
Group overheads (11.2) Nil (11.2) (0.1) (11.3) Nil Nil (0.3) (11.6)Restructuring costs (2.9) Nil (2.9) Nil (2.9) Nil Nil 2.9 Nil
342.7 (12.2) 330.5 (90.3) 240.2 (15.2) Nil Nil 225.0
78189_STC_Back FINAL_78189_StCchV13_BACK 05/07/2011 11:46 Page 56

Materials and consumables 289.7 300.0Staff costs (note 7) 941.9 826.6Depreciation on property, plant and equipment – owned assets 59.0 46.0– assets held under hire purchase agreements and finance leases 31.3 31.2
Loss on disposal of plant and equipment 0.9 2.0Impairment of plant and equipment Nil 14.7Repairs and maintenance expenditure on property, plant and equipment 31.4 18.2Amortisation of intangible assets (note 12) 10.1 6.0Network Rail charges 225.3 222.7Operating lease rentals payable – plant and equipment 136.0 146.1– property 8.5 7.1
Other external charges– exceptional Nil 2.6– non-exceptional 339.8 331.4
Restructuring costs– exceptional Nil (0.8)– non-exceptional 2.9 1.2
Total operating costs 2,076.8 1,955.0
Amounts payable to PricewaterhouseCoopers LLP and their associates by the Company and its subsidiary undertakings in respect of audit and non-audit services are shown below:
£000 £000
Fees payable to the Company’s auditors for the audit of the Company’s financial statements andconsolidated financial statements 25.0 20.0Fees payable to the Company’s auditors for the audit of the Company’s subsidiaries pursuant to legislation 794.9 710.5
Total audit fees 819.9 730.5
Assurance services pursuant to legislation NiNil NilOther assurance services (see below) 28.4 323.0Tax advisory services Nil 55.6Provision of training and related materials 2.9 2.0
Non-audit fees 31.3 380.6
Total fees payable by the Group to its auditors 851.2 1,111.1
The fees payable to the auditors for other assurance services of £323,000 shown above for the year ended 30 April 2010 include £295,000 in relationto the issue of corporate bonds and the proposal to acquire certain businesses of, or merge with, National Express Group plc. This related to work thatwas best undertaken by the auditors in respect of a shareholder circular, a review of the adequacy of the Group’s working capital and advice on theaccounting and legal structuring of the proposal.
In addition to the fees detailed above, PricewaterhouseCoopers LLP received US$120,000 (2010: US$110,000) in relation to the audit of our jointventure, Twin America LLC.A description of the work of the Audit Committee is set out in the Audit Committee Report on page 29, and includes an explanation of how auditorindependence is safeguarded when non-audit services are provided by the auditors.
£m £m
2011 2010
Note 3 Operating costs Operating costs were as follows:
2011 2010
Stagecoach Group plc | page 57
78189_STC_Back FINAL_78189_StCchV13_BACK 05/07/2011 11:46 Page 57

Notes to the consolidated financial statementsNote 4 Exceptional items and intangible asset expenses
The Group highlights amounts before intangible asset expenses and exceptional items as well as clearly reporting the results in accordance with IFRS.Exceptional items are defined in note 36. Information on exceptional items is provided in section 3.8.2 of the Operating and Financial Review.The items shown in the column headed “Intangibles and exceptional items” on the face of the consolidated income statement for the year ended 30April 2011 can be further analysed as follows:
Operating costsIntangible asset expenses Nil (10.1) (10.1)
Share of profit of joint venturesGoodwill charged on investment in joint ventures Nil (5.1) (5.1)
Non-operating exceptional items – continuing operationsLoss on sale of properties (0.1) Nil (0.1)Revision to the estimated insurance provision relating to pre-acquisition liabilities 4.6 Nil 4.6Expenses incurred in relation to acquisition of East London bus business (0.6) Nil (0.6)Loss on disposal of operations (note 17) (3.2) Nil (3.2)
Non-operating exceptional items – continuing operations 0.7 Nil 0.7
Intangible asset expenses and exceptional items – continuing operations 0.7 (15.2) (14.5)Tax effect of intangible asset expenses and exceptional items (1.3) 3.1 1.8
Intangible asset expenses and exceptional items aftertaxation – continuing operations (0.6) (12.1) (12.7)
Resolution of certain liabilities re disposals – discontinued operations 18.5 Nil 18.5
The items shown in the column headed “Intangibles and exceptional items” on the face of the consolidated income statement for the prior yearcomparatives can be further analysed as follows:
Operating costsRestructuring costs – release of unutilised provision 0.8 Nil 0.8Costs of participation in the Competition Commission study of theUK local bus market (2.6) Nil (2.6)Intangible asset expenses Nil (6.0) (6.0)
(1.8) (6.0) (7.8)
Share of profit of joint venturesGoodwill charged on investment in joint ventures Nil (5.1) (5.1)
Non-operating exceptional items – continuing operationsGain on sale of properties 4.3 Nil 4.3Loss on disposal of operations (note 17) (3.2) Nil (3.2)Loss on exit from certain operations (0.8) Nil (0.8)Expenses incurred in relation to proposal to acquire certain businesses of, ormerge with, National Express Group plc (2.3) Nil (2.3)
Non-operating exceptional items – continuing operations (2.0) Nil (2.0)
Exceptional finance costsLoss on ineffective interest rate swaps following issuance of sterling bond (20.5) Nil (20.5)
Intangible asset expenses and exceptional items – continuing operations (24.3) (11.1) (35.4)Tax effect of intangible asset expenses and exceptional items 7.4 1.7 9.1
Intangible asset expenses and exceptional items aftertaxation – continuing operations (16.9) (9.4) (26.3)
Resolution of certain liabilities re disposals – discontinued operations 3.9 Nil 3.9
page 58 | Stagecoach Group plc
£m £m £m
Exceptional Intangible Intangibles anditems asset expenses exceptional items
2011
£m £m £m
Exceptional Intangible Intangibles anditems asset expenses exceptional items
2010
78189_STC_Back FINAL_78189_StCchV13_BACK 05/07/2011 11:46 Page 58

Miscellaneous revenue 94.3 87.7Rail franchise premia (284.8) (148.7)Rail revenue support 68.1 7.8
(122.4) (53.2)
Miscellaneous revenue comprises revenue incidental to the Group’s principal activities. It includes commissions receivable, advertising income,maintenance income, railway station access income, railway depot access income, fuel sales and property income.Rail franchise premia is the amount of financial premia payable to the Department for Transport (“DfT”) in respect of the operation of UK passenger railfranchises.Rail revenue support is the amount of additional financial support receivable from the DfT in certain circumstances where a train operating company’srevenue is below target.
Note 6 Finance costs and income Net finance costs included:
Finance costsInterest payable and other facility costs on bank loans, loan notes and overdrafts 5.7 4.5Hire purchase and finance lease interest payable 6.8 7.3Interest payable and other finance costs on bonds 23.5 16.1Fair value losses on financial instruments not qualifying as hedges:
Foreign exchange derivative contracts Nil 5.1Unwinding of discount on provisions 3.9 3.7Interest payable on interest rate swaps qualifying as cashflow hedges Nil 4.8
39.9 41.5
Finance incomeInterest receivable (2.2) (4.0)Interest receivable on interest rate swaps qualifying as fair value hedges (3.2) (1.3)Exchange gains on retranslation of US$ bonds Nil (5.5)
(5.4) (10.8)
Net finance costs before exceptional items 34.5 30.7
Exceptional itemIneffective interest rate swaps Nil 20.5
Net finance costs 34.5 51.2
No interest (2010: £Nil) was capitalised during the year.At 1 May 2009, the US$293.1m of US$ notes and a US$20.0m foreign currency derivative contract were designated as a hedge of overseas netinvestments. On 7 July 2009, this hedge relationship was de-designated. On the same day, the Group took out US$ derivative contracts, with notionalamounts totalling US$342.0m to give certainty of the sterling value of the redemption payment that would be made by the Group when the US$ notesmatured on 16 November 2009. Exchange gains on the US$ notes in the period from 7 July 2009 to 16 November 2009 of £5.5m are included withinfinance income above. The notional value of the derivative contracts exceeded the outstanding US$ notes in order to take account of the tax effect ofthe transactions.
Stagecoach Group plc | page 59
Note 4 Exceptional items and intangible asset expenses (continued)
The “goodwill charged on investment in joint ventures” is an annual charge for goodwill in relation to our investment in Virgin Rail Group. Onadoption of IFRS, the Group took the exemption offered under IFRS 1 not to restate prior period business combinations. Accordingly, the goodwillarising under UK GAAP on the acquisition of the 49% stake in Virgin Rail Group was carried over to IFRS. However, Virgin Rail Group’s only significantbusiness is the operation of the West Coast Trains rail franchise, which has a finite duration as the franchise ends on a particular date. We therefore haveto reduce the goodwill in relation to Virgin Rail Group with an annual charge to reflect the fact that we should have no goodwill left at the end of thecurrent West Coast Trains rail franchise. Whilst IFRS generally prohibits the amortisation of goodwill, the treatment adopted is a result of an anomaly onthe first-time adoption of IFRS that would not arise if IFRS were applied to new acquisitions of businesses.
£m £m
2011 2010
£m £m
2011 2010
Note 5 Other operating (expense)/incomeOther operating (expense)/income was as follows:
78189_STC_Back FINAL_78189_StCchV13_BACK 05/07/2011 11:46 Page 59

Notes to the consolidated financial statements
Staff costsWages and salaries 823.7 714.1Social security costs 68.8 58.8Pension costs (note 26) 42.2 44.8Share based payment costs (excluding social security costs)– Equity-settled 4.7 6.3– Cash-settled 2.5 2.6
941.9 826.6
Summary of directors’ remunerationAggregate emoluments (including bonuses awarded in deferred shares) 2.5 2.3Amount waived by a director (0.3) (0.3)
2.2 2.0Gains made by directors on exercise of share options Nil 0.1
2.2 2.1Payments made in the year under the Long Term Incentive Plan Nil 2.2
2.2 4.3
In the table above, awards made under the Executive Participation Plan are shown in the year in respect of which the award was made and the amountis included at its fair value on the grant date. Awards made under the Long Term Incentive Plan are shown in the year in which the payments are madeand the amount is included at the gross amount payable.
Key management personnel are considered to be the Directors and further information on their remuneration, share options, incentive schemes andpensions is contained within the Directors’ remuneration report on pages 32 to 38.
The average monthly number of persons employed by the Group during the year (including executive directors) was as follows:
UK operations 24,802 23,240UK administration and supervisory 3,140 2,912Overseas 3,857 3,774
31,799 29,926
The average monthly number of persons employed by the Group during the year, split by segment, was as follows:
UK Bus (regional operations) 18,294 18,842UK Bus (London) 2,429 NilNorth America 3,857 3,774UK Rail 7,090 7,177Central 129 133
31,799 29,926
Note 7 Staff costs
Total staff costs were as follows:
number number
2011 2010
number number
2011 2010
page 60 | Stagecoach Group plc
£m £m
2011 2010
£m £m
2011 2010
78189_STC_Back FINAL_78189_StCchV13_BACK 05/07/2011 11:46 Page 60

Note 8 Taxation
(a) Analysis of charge in the year
Current tax:UK corporation tax at 27.8% (2010: 28%) 26.3 (1.8) 24.5 12.7 (9.1) 3.6Prior year over provision for corporation tax (2.2) Nil (2.2) (0.9) Nil (0.9)Foreign tax (current year) 0.4 Nil 0.4 0.4 Nil 0.4Foreign tax (adjustments in respect of prior years) (0.2) Nil (0.2) 1.0 Nil 1.0
Total current tax 24.3 (1.8) 22.5 13.2 (9.1) 4.1
Deferred tax:Origination and reversal of temporary differences 7.4 Nil 7.4 14.9 Nil 14.9Adjustments in respect of prior years 3.4 Nil 3.4 (0.9) Nil (0.9)
Total deferred tax 10.8 Nil 10.8 14.0 Nil 14.0
Total tax on profit 35.1 (1.8) 33.3 27.2 (9.1) 18.1
(b) Factors affecting tax charge for the year
Profit before taxation – continuing operations 191.2 125.9
Profit multiplied by standard rate of corporation tax applying to the year in the UK of 27.8% (2010: 28%) 53.2 35.3Effects of:Intangible asset allowances/deductions 1.2 1.4Non-deductible expenditure/(non-taxable income) 1.6 (0.2)Utilisation of tax losses not previously recognised as deferred tax assets (11.6) (13.5)Foreign taxes differences 1.6 1.3Adjustments to tax charge in respect of prior years 1.0 (0.8)Tax effect of share of results of joint ventures (8.4) (5.4)Change in UK corporation rate to 26% from 1 April 2011 (5.3) Nil
Total taxation (note 8a) 33.3 18.1
Performance Performance pre intangibles Intangibles and pre intangibles Intangibles and
and exceptional Results for and exceptional Results forexceptional items items the year exceptional items items the year
Notes £m £m £m £m £m £m
2011 2010
(c) Factors that may affect future tax chargesThere are no temporary differences associated with investments in overseas subsidiaries for which deferred tax liabilities have not been recognised.Gross deductible temporary differences of £72.8m (2010: £105.8m) have not been recognised due to restrictions in the availability of their use.Temporary differences in respect of the revaluation of land and buildings and in respect of rolled over capital gains are fully offset by temporarydifferences in respect of capital losses.In the 2010 budget on 22 June 2010, the UK Government announced its intention to reduce the UK corporate income tax rate from 28% to 24% by 1%per annum over a four-year period.Furthermore on 23 March 2011, the UK Government announced its intention to further reduce the rate with effect from 1 April 2011 by another 1% to26% creating a 23% main rate by 2014.The deferred tax balances as at 30 April 2011 have been determined with reference to the enacted UK corporate income tax rate of 26%. The rate changereduction to 25% which is proposed to take effect from 1 April 2012 had not been substantively enacted at the balance sheet date. Had the reduction to25% been substantively enacted the estimated impact of this reduction on the deferred tax liability would have been a reduction of £1.8m.
(d) Tax on items taken directly or transferred from equityThe components of tax on items taken directly to or transferred from equity are shown in the consolidated statement of comprehensive income onpage 42.
2011 2010
£m £m
Stagecoach Group plc | page 61
78189_STC_Back FINAL_78189_StCchV13_BACK 05/07/2011 11:46 Page 61

no. of shares no. of sharesmillion million
Notes to the consolidated financial statementsNote 9 Dividends
Dividends payable in respect of ordinary shares are shown below. Dividends payable in respect of ‘B’ Shares are included as an expense in finance costs.
Amounts recognised as distributions in the yearDividends on ordinary sharesFinal dividend in respect of the previous year Nil 4.2 Nil 30.1Interim dividends in respect of the current year 2.2 6.5 15.8 46.6
Amounts recognised as distributions to equity holders in the year 2.2 10.7 15.8 76.7
Dividends proposed but neither paid nor included as liabilities in thefinancial statementsDividends on ordinary sharesFinal dividend in respect of the current year 4.9 Nil 35.2 Nil
The dividends proposed or declared and the actual dividends recognised as distributions can differ slightly due to the number of shares at the balancesheet date being different to the number outstanding at the record date.
Note 10 Earnings per share
Basic earnings per share (”EPS“) have been calculated by dividing the profit attributable to equity shareholders by the weighted average number ofordinary shares in issue during the year, excluding any ordinary shares held by employee share ownership trusts.
The diluted earnings per share was calculated by adjusting the weighted average number of ordinary shares outstanding to assume conversion of alldilutive potential ordinary shares in relation to share options and long-term incentive plans. In respect of share options, a calculation was performed todetermine the number of ordinary shares that could have been acquired at fair value (determined based on the average annual market share price ofthe Company’s ordinary shares) based on the monetary value of the subscription rights attached to outstanding share options. The number of ordinaryshares calculated as above was compared with the number of ordinary shares that would have been issued assuming the exercise of the share options.The difference was added to the denominator as an issue of ordinary shares for no consideration and no adjustment was made to earnings(numerator).
Basic weighted average number of ordinary shares 717.5 716.2Dilutive ordinary shares– Executive Share Option Scheme 0.3 0.6– Long Term Incentive Plan 3.2 3.1– Executive Participation Plan 4.1 3.7
Diluted weighted average number of ordinary shares 725.1 723.6
Profit after taxation (for basic EPS calculation) 176.4 111.7Intangible asset expenses (see note 4) 15.2 11.1Exceptional items before tax (see note 4) (0.7) 24.3Tax effect of intangible asset expenses and exceptional items (see note 4) (1.8) (9.1)Profit for the year from discontinued operations (see note 4) (18.5) (3.9)
Profit for adjusted EPS calculation 170.6 134.1
pence per share pence per share £m £m
2011 2010 2011 2010
page 62 | Stagecoach Group plc
2011 2010
2011 2010
£m £m
78189_STC_Back FINAL_78189_StCchV13_BACK 05/07/2011 11:46 Page 62

Note 10 Earnings per share (continued)Earnings per share before intangible asset expenses and exceptional items is calculated by adding back intangible asset expenses and exceptional itemsafter taking account of taxation, as shown on the consolidated income statement on page 41. This has been presented to allow shareholders to gain afurther understanding of the underlying performance. The basic and diluted earnings per share can be analysed as follows:
Basic– Continuing operations 157.9 717.5 22.0 107.8 716.2 15.1– Discontinued operations 18.5 717.5 2.6 3.9 716.2 0.5
176.4 717.5 24.6 111.7 716.2 15.6
Adjusted basic– Continuing operations 170.6 717.5 23.8 134.1 716.2 18.7– Discontinued operations Nil 717.5 Nil Nil 716.2 Nil
170.6 717.5 23.8 134.1 716.2 18.7
Diluted– Continuing operations 157.9 725.1 21.7 107.8 723.6 14.9– Discontinued operations 18.5 725.1 2.6 3.9 723.6 0.5
176.4 725.1 24.3 111.7 723.6 15.4
Adjusted diluted– Continuing operations 170.6 725.1 23.5 134.1 723.6 18.5– Discontinued operations Nil 725.1 Nil Nil 723.6 Nil
170.6 725.1 23.5 134.1 723.6 18.5
There have been no ordinary share transactions between the balance sheet date and the date of approval of this report that would have significantlychanged the number of ordinary shares outstanding at 30 April 2011.
Weighted Weightedaverage number Earnings average number Earnings
Earnings of shares per share Earnings of shares per share£m Million Pence £m Million Pence
2011 2010
Stagecoach Group plc | page 63
78189_STC_Back FINAL_78189_StCchV13_BACK 05/07/2011 11:46 Page 63

Notes to the consolidated financial statements
The cash generating units are as follows:
Carrying amount of goodwill 32.4 34.8 3.6 59.3 64.6
Carrying value of intangible assets with indefinite useful lives Nil Nil Nil Nil Nil
Basis on which recoverable amount has been determined Value in use Value in use Value in use Value in use Value in use
Period covered by approved management plansused in value in use calculation 5 years 5 years 5 years 5 years 5 years
Pre-tax discount rate applied to cash flow projections 10.3% 11.8% 10.3% 13.3% 14.8%
Growth rate used to extrapolate cash flows beyond period of management plan 2.0% 2.0% 2.0% 1.7% 2.0%
Difference between above growth rate and long-term average growth rate for market in which unit operates Nil Nil Nil Nil Nil
The calculation of value in use for each cash generating unit shown above is most sensitive to the assumptions on discount rates and growth rates andin the case of UK Bus (London), the number of new contracts won and the terms of such contracts.. The assumptions used are considered to berealistically achievable in light of economic and industry measures and forecasts.The principal risks and uncertainties are set out in section 3.10 of the Operating and Financial Review.The cost base of the UK Bus (regional operations) and North American Bus operations can be flexed in response to changes in revenue and there isscope to reduce capital expenditure in the medium-term if other cash flows deteriorate. Risks to the cash flow forecasts remain, however, and aredescribed in section 3.10. The cost base of UK Bus (London) is less flexible because the business is contractually committed to operate the majority ofits services.The discount rates have been determined with reference to the estimated post-tax Weighted Average Cost of Capital (“WACC”) of the Group. TheWACC has been estimated as at 30 April 2011 at 7.6% based on:• The market capitalisation and net debt of the Group as at 30 April 2011 as an indication of the split between debt and equity;• A risk-free rate of 3.3%;• A levered beta for the Group of 1.0;• A marginal pre-tax cost of debt of 5.6%.The pre-tax discount rate for each CGU has been determined by adjusting the Group’s WACC for the risk profile and effects of tax on each of therelevant CGUs.The Directors believe that in the case of each of the cash generating units shown above, any reasonably possible change in the key assumptions onwhich the recoverable amount of the unit is based would not cause its carrying amount to exceed its recoverable amount.
UK Bus UK Bus North America(regional operations) (London)
2011 2010 2011 2011 2010
£m £m £m £m £m
page 64 | Stagecoach Group plc
£m £m
2011 2010
Note 11 GoodwillThe movements in goodwill were as follows:
Cost and net book valueAt beginning of year 99.4 99.9Acquired through business combinations 3.7 1.7Disposals (2.5) NilForeign exchange movements (5.3) (2.2)
At end of year 95.3 99.4
For the purpose of impairment testing, all goodwill that has been acquired in business combinations has been allocated to three individual cashgenerating units (”CGUs”) on the basis of the Group’s operations. Each cash generating unit is an operational division. The UK Bus (regionaloperations) and UK Bus (London) cash generating units operate coach and bus operations in the United Kingdom. The North America Bus cashgenerating unit operates coach and bus operations in the US and Canada. No goodwill has been allocated to the Group’s rail operations.
78189_STC_Back FINAL_78189_StCchV13_BACK 05/07/2011 11:46 Page 64

CostAt beginning of year 18.6 12.7 19.7 1.7 52.7Additions Nil Nil Nil 0.4 0.4Acquired through business combinations 17.8 Nil Nil Nil 17.8Disposals (0.2) Nil Nil (0.1) (0.3)Foreign exchange movements Nil (0.4) Nil Nil (0.4)
At end of year 36.2 12.3 19.7 2.0 70.2
Accumulated amortisationAt beginning of year (17.1) (12.3) (6.6) (0.6) (36.6)Amortisation charged to income statement (7.1) (0.3) (2.1) (0.6) (10.1)Disposals 0.2 Nil Nil 0.1 0.3Foreign exchange movements Nil 0.4 Nil Nil 0.4
At end of year (24.0) (12.2) (8.7) (1.1) (46.0)
Net book value at beginning of year 1.5 0.4 13.1 1.1 16.1
Net book value at end of year 12.2 0.1 11.0 0.9 24.2
Intangible assets include customer contracts purchased as part of the Group’s business combinations, non-compete contracts, the right to operate UKRail franchises and software costs.
The amortisation of each of the above intangible assets is included within the operating costs line of the income statement.
Intangible assets arising during the year (including any acquired through business combinations) and the amortisation periods are as follows:
Subsidiaries – UK Bus (regional operations) additions 1-3 0.4Subsidiaries – UK Bus (London) additions 1-5 17.8
18.2
CostAt beginning of year 18.1 17.3 19.7 0.8 55.9Additions Nil Nil Nil 0.9 0.9Acquired through business combinations 0.5 Nil Nil Nil 0.5Disposals Nil (4.1) Nil Nil (4.1)Foreign exchange movements Nil (0.5) Nil Nil (0.5)
At end of year 18.6 12.7 19.7 1.7 52.7
Accumulated amortisationAt beginning of year (15.6) (11.1) (4.4) (0.3) (31.4)Amortisation charged to income statement (1.5) (2.0) (2.2) (0.3) (6.0)Disposals Nil 0.6 Nil Nil 0.6Foreign exchange movements Nil 0.2 Nil Nil 0.2
At end of year (17.1) (12.3) (6.6) (0.6) (36.6)
Net book value at beginning of year 2.5 6.2 15.3 0.5 24.5
Net book value at end of year 1.5 0.4 13.1 1.1 16.1
Note 12 Other intangible assetsThe movements in other intangible assets were as follows:Year ended 30 April 2011
£m £m £m £m £m
Customer Non-compete Rail Softwarecontracts contracts franchises costs Total
£m £m £m £m £m
Customer Non-compete Rail Softwarecontracts contracts franchises costs Total
Amortisation Intangibleperiod additionsyears £m
Year ended 30 April 2010
Stagecoach Group plc | page 65
78189_STC_Back FINAL_78189_StCchV13_BACK 05/07/2011 11:46 Page 65

Notes to the consolidated financial statementsNote 13 Property, plant and equipmentThe movements in property, plant and equipment were as follows:Year ended 30 April 2011
CostAt beginning of year 237.2 1,001.7 161.6 1,400.5Additions 10.7 117.4 39.7 167.8Acquired through business combinations 39.7 41.0 1.5 82.2Disposals of subsidiaries (0.6) (6.5) (0.6) (7.7)Disposals (0.6) (70.2) (11.8) (82.6)Foreign exchange movements (2.6) (21.4) (0.1) (24.1)Reclassifications Nil (3.0) 3.0 Nil
At end of year 283.8 1,059.0 193.3 1,536.1
DepreciationAt beginning of year (29.1) (453.6) (121.6) (604.3)Depreciation charged to income statement (5.7) (73.5) (11.1) (90.3)Disposals of subsidiaries 0.2 3.5 0.5 4.2Disposals 0.2 62.7 3.2 66.1Foreign exchange movements 1.0 11.6 (0.1) 12.5Reclassifications Nil 3.0 (3.0) Nil
At end of year (33.4) (446.3) (132.1) (611.8)
Net book value at beginning of year 208.1 548.1 40.0 796.2
Net book value at end of year 250.4 612.7 61.2 924.3
Included in the above net book value at end of year are:Assets on hire purchase Nil 224.1 Nil 224.1Leased passenger service vehicles Nil 64.2 Nil 64.2Short leasehold land and buildings 29.8 Nil Nil 29.8Long leasehold land and buildings 57.5 Nil Nil 57.5
£m £m £m £m
Land and Passenger Other plantbuildings service vehicles and equipment Total
page 66 | Stagecoach Group plc
Year ended 30 April 2010
CostAt beginning of year 226.5 968.4 154.2 1,349.1Additions 11.2 94.5 51.0 156.7Acquired through business combinations 0.4 0.7 Nil 1.1Disposals (5.2) (53.9) (52.4) (111.5)Foreign exchange movements (0.5) 0.3 0.5 0.3Transferred from assets held for sale 4.8 Nil Nil 4.8Reclassifications Nil (8.3) 8.3 Nil
At end of year 237.2 1,001.7 161.6 1,400.5
DepreciationAt beginning of year (21.3) (444.4) (97.7) (563.4)Depreciation charged to income statement (5.9) (64.4) (6.9) (77.2)Impairment charged to income statement Nil Nil (14.7) (14.7)Disposals 0.6 47.5 4.7 52.8Foreign exchange movements (0.1) 1.2 (0.5) 0.6Transferred from assets held for sale (2.4) Nil Nil (2.4)Reclassifications Nil 6.5 (6.5) Nil
At end of year (29.1) (453.6) (121.6) (604.3)
Net book value at beginning of year 205.2 524.0 56.5 785.7
Net book value at end of year 208.1 548.1 40.0 796.2
Included in the above net book value at end of year are:Assets on hire purchase Nil 238.5 Nil 238.5Leased passenger service vehicles Nil 78.5 Nil 78.5Short leasehold land and buildings 27.1 Nil Nil 27.1Long leasehold land and buildings 26.3 Nil Nil 26.3
During the year ended 30 April 2010, we reached agreement with the DfT on a commercial settlement in favour of South Western Trains in respect of certainelements of the smartcard project which had been subject to delay. In light of elements of the smartcard project not being delivered on time we reviewed thecarrying value of plant and equipment held in relation to the smartcard project and recorded a £14.7m impairment charge.Heritable and freehold land amounting to £94.3m (2010: £91.4m) has not been depreciated.Depreciation of £31.3m (2010: £31.2m) has been charged in the year in respect of assets held under hire purchase or finance lease agreements.Included in the net book value of property, plant and equipment is £27.2m (2010: £10.2m) in respect of assets under construction that the Group expects to besold to Network Rail following the completion of each asset’s construction.
£m £m £m £m
Land and Passenger Other plantbuildings service vehicles and equipment Total
78189_STC_Back FINAL_78189_StCchV13_BACK 05/07/2011 11:46 Page 66

Nominal valueNumber of of share capital
Country of shares in issue in issue at % interestincorporation at 30 April 2011 30 April 2011 held
CostAt beginning of year 55.8 3.4 45.7 104.9 111.8Share of recognised profit 28.4 1.8 9.3 39.5 28.9Share of actuarial (losses)/gains on defined benefitpension schemes, net of tax (0.5) Nil Nil (0.5) 0.1Share of net fair value (losses)/gains on cashflow hedges, net of tax (0.1) Nil Nil (0.1) 1.3Dividends received in cash (17.1) (1.3) (10.4) (28.8) (35.7)Foreign exchange movements Nil Nil (3.6) (3.6) (1.5)
At end of year 66.5 3.9 41.0 111.4 104.9
Amounts written offAt beginning of year (48.2) Nil Nil (48.2) (43.1)Goodwill charged to income statement (5.1) Nil Nil (5.1) (5.1)
At end of year (53.3) Nil Nil (53.3) (48.2)
Net book value at beginning of year 7.6 3.4 45.7 56.7 68.7
Net book value at end of year 13.2 3.9 41.0 58.1 56.7
In addition to the above interests in joint ventures, a loan receivable from New York Splash Tours LLC of £2.8m (2010: £3.1m) is reflected in note 20.New York Splash Tours LLC has net liabilities as at 30 April 2011 of £3.5m (2010: £3.8m). The Group has not recognised its share of the net liabilitiesbut has assessed the loan receivable for impairment and a provision for impairment of £2.8m (2010: £3.1m) has been held against the receivable.A loan payable to Scottish Citylink Coaches Limited of £1.7m (2010: £1.7m) is reflected in note 22.
£m £m £m £m £m
Note 14 Interests in joint venturesThe principal joint ventures are:
Virgin Rail Group Holdings Limited United Kingdom 34,780 £3,478 49%Scottish Citylink Coaches Limited United Kingdom 1,643,312 £1,643,312 35%New York Splash Tours LLC USA n/a n/a 50%Twin America LLC USA n/a n/a 60%
The Group has four joint ventures: Virgin Rail Group Holdings Limited, Scottish Citylink Coaches Limited (“Citylink”), New York Splash Tours LLC andTwin America LLC.
Virgin Rail Group Holdings Limited is the holding company of Virgin Rail Group Limited, which in turn is the holding company of West Coast TrainsLimited. The Virgin Rail Group Holdings shareholders’ agreement provides for joint decision making on key matters and equal representation on theBoard. As a consequence, the investment has been accounted for as a joint venture.
The Citylink shareholder agreement provides for joint and unanimous decision making on all key matters and therefore the investment has beenaccounted for as a joint venture.
In North America, Stagecoach has two joint ventures, New York Splash Tours LLC, with Port Imperial Duck Charters LLC and Twin America LLC, withCitySights NY. New York Splash Tours LLC currently has no share capital but is governed by a joint venture agreement.
Stagecoach began operating Twin America LLC, a joint venture with CitySights NY, on 31 March 2009. In return for transferring certain assets to thejoint venture, the Group holds 60% of the economic rights and 50% of the voting rights. Twin America LLC has no share capital and is governed by ajoint venture agreement, which provdes for joint decision making on key matters.
The Directors undertook an impairment review as at 30 April 2011 of the carrying value of the Group’s joint venture interests and concluded that therehad been no impairment loss. The movements in the carrying values were as follows:
Virgin Rail Twin Total TotalGroup Citylink America LLC 2011 2010
Stagecoach Group plc | page 67
78189_STC_Back FINAL_78189_StCchV13_BACK 05/07/2011 11:46 Page 67

Non-current assets 3.8 0.1 13.4 17.3 18.5Current assets 89.6 3.3 6.3 99.2 95.8Current liabilities (84.4) (2.1) (5.8) (92.3) (99.0)
Share of net assets 9.0 1.3 13.9 24.2 15.3Goodwill 4.2 2.6 27.1 33.9 41.4
13.2 3.9 41.0 58.1 56.7
The Group’s share of post-tax results from joint ventures is analysed below:
Revenue 392.7 11.4 43.3 447.4 405.5Expenses (353.2) (8.9) (33.6) (395.7) (370.3)
Operating profit 39.5 2.5 9.7 51.7 35.2Finance income (net) 0.2 Nil Nil 0.2 0.2Taxation (11.3) (0.7) (0.4) (12.4) (7.4)
Share of joint ventures’profit after taxation 28.4 1.8 9.3 39.5 28.0
A net actuarial loss after taxation of £0.5m (2010: gain of £0.1m) was recognised in addition to the above in relation to Virgin Rail Group’s defined benefitpension schemes. A net loss after taxation of £0.1m (2010: gain of £1.3m) was recognised in addition to the above in relation to fair value gains on fuelderivative contracts held by Virgin Rail Group.
Notes to the consolidated financial statements
Cost / valuationAt beginning of year 3.7 3.3Additions 0.4 0.6Disposals (1.8) NilNet fair value losses Nil (0.2)Foreign exchange movements (0.2) Nil
At end of year 2.1 3.7
Amounts written off At end of year (1.8) (1.8)Disposals 1.8 Nil
At end of year Nil (1.8)
Net book value at beginning of year 1.9 1.5
Net book value at end of year 2.1 1.9
Note 15 Available for sale and other investmentsThe movements in available for sale and other investments were as follows:
Note 14 Interests in joint ventures (continued)The Group’s share of the net assets of its joint ventures is analysed below:
£m £m
2011 2010
page 68 | Stagecoach Group plc
£m £m £m £m £m
Virgin Rail Twin Total TotalGroup Citylink America LLC 2011 2010
£m £m £m £m £m
Virgin Rail Twin Total TotalGroup Citylink America LLC 2011 2010
Note 16 Business combinations(i) East London BusOn 14 October 2010, Stagecoach Bus Holdings Limited ("SBHL"), a Group subsidiary, completed the acquisition of the bus business formerly owned byEast London Bus Group Limited (in administration). SBHL acquired 100% of the voting equity interests in four companies that together operate theacquired business. The acquired business is the third largest bus operator in the London market, and has an estimated 15% share of that market. 99%of its revenue is from Transport for London. The business operates bus services under contract to Transport for London whereby it receives a fixed fee(subject to adjustment for certain inflation indices) for operating the services and takes the cost and capital risk. The cash paid in respect of the acquisition was £59.5m, comprising £5.4m for the entire share capital of the acquired companies and £54.1m to settleinter-company liabilities payable by the acquired companies to their former parent company. The consideration payable was calculated on the basis thatthe acquired business had aggregate cash balances of approximately £6.7m at close of business on the day prior to completion, giving a transactionenterprise value of £52.8m. The consideration was fully paid in cash and there is no contingent consideration. The aggregate cash balances atacquisition were £3.5m, with the movement of £3.2m reflecting net payments on the day of acquisition. These payments were in line with the Group’sexpectations.
78189_STC_Back FINAL_78189_StCchV13_BACK 05/07/2011 11:46 Page 68

£m £m
2011 2010
Stagecoach Group plc | page 69
The assets and liabilities acquired were as follows:
£m £m £m
Initial Restatement Fair valuebook to fair to thevalue value Group
Intangible assets– Customer contracts Nil 17.8 17.8
Property, plant and equipments– Land and buildings 46.7 (7.0) 39.7– Passenger service vehicles 63.2 (22.2) 41.0– Other plant and equipment 2.2 (0.7) 1.5
Retirement benefit asset 7.8 Nil 7.8Deferred tax (liability) / asset (0.8) 14.8 14.0Inventory 0.8 Nil 0.8Cash 3.5 Nil 3.5Trade and other receivables 15.1 Nil 15.1Trade and other payables (27.7) (0.2) (27.9)Intercompany payables (54.1) Nil (54.1)Provisions– Insurance provisions (14.5) (3.1) (17.6)– Environmental provisions (0.3) Nil (0.3)– Acquired customer contracts Nil (39.5) (39.5)
Net assets / (liabilities) acquired, excluding goodwill 41.9 (40.1) 1.8Goodwill arising on acquisition Nil 3.6 3.6
Total consideration (settled in cash) 41.9 (36.5) 5.4
There are no material receivables that are considered to be uncollectable as at the date of acquisition.
(ii) Other business combinationsOne business acquisition has been made by our UK Bus (regional operations) division during the year ended 30 April 2011. £0.1m was paid to acquirethe assets and goodwill of a small bus business.
(iii) Effect on consolidated net debt and goodwillThe effect of the above acquisitions on consolidated net debt was:
Fair value to GroupIntangible fixed assets (excluding goodwill) 17.8 0.5Property, plant and equipment 82.2 1.1Other net liabilities (98.2) (1.8)
Net assets/(liabilities) acquired, excluding goodwill 1.8 (0.2)Goodwill arising on acquisition 3.7 1.7
Consideration 5.5 1.5Costs of acquisitions in year 0.6 0.1Add: deferred consideration paid in respect of businesses acquired in prior years 0.3 0.6Intercompany debt assumed and re-financed 54.1 NilNet cash and cash equivalents acquired (including overdrafts) (3.5) 0.3
Net cash outflow 57.0 2.5
Note 16 Business combinations (continued)
(i) East London Bus (continued)Goodwill of £3.6m arose on the acquisition of the East London bus business and represents:• the benefits that the Group expects to obtain from synergies with its other businesses;• the benefits that the Group expects to obtain from applying its own management expertise to improve the operational and financial performance
of the acquired business;• the value of the assembled workforce of the East London bus business and;• the value of the arrangements with Transport for London, over and above the existing contracts for particular bus services, but which cannot be
reliably valued as a separate asset.None of the goodwill arising from the acquisition is deductible for tax purposes.The revenue and loss of the acquired business recognised in the consolidated income statement for the period from the acquisition date of 14 October2010 to 30 April 2011 is shown in note 2.The consolidated revenue for the period of the Group for the year ended 30 April 2011 would have been £2,503.3m had the acquisition occurred on1 May 2010. The equivalent consolidated profit for the period would not have been materially different from the actual reported profit.
78189_STC_Back FINAL_78189_StCchV13_BACK 05/07/2011 11:46 Page 69

Notes to the consolidated financial statements
Stagecoach Transport Holdings plc Scotland Holding companySCOTO Limited England Holding companySCUSI Limited England Holding companyStagecoach Bus Holdings Limited Scotland Holding companyThe Integrated Transport Company Limited Scotland Holding companyStagecoach (South) Limited England Bus and coach operatorStagecoach (North West) Limited England Bus and coach operatorEast Midland Motor Services Limited England Bus and coach operatorStagecoach Scotland Limited Scotland Bus and coach operatorEast Kent Road Car Company Limited England Bus and coach operatorStagecoach West Limited England Bus and coach operatorBusways Travel Services Limited England Bus and coach operatorCleveland Transit Ltd England Bus and coach operatorCambus Limited England Bus and coach operatorGreater Manchester Buses South Limited England Bus and coach operatorHighland Country Buses Limited Scotland Bus and coach operatorOrkney Coaches Limited Scotland Bus and coach operatorEastbourne Buses Limited England Bus and coach operatorThe Yorkshire Traction Group Limited England Bus and coach operatorEast London Bus & Coach Company Limited England Bus operatorSouth East London & Kent Bus Company Limited England Bus operatorEast London Bus Group Property Investments Limited England Property companyStagecoach Services Limited England Provision of accounting and payroll servicesNational Transport Tokens Limited (99.9%) England Transport tokensPSV Claims Bureau Limited England Claims handlingStagecoach South Western Trains Limited England Train operating companyEast Midlands Trains Limited England Train operating companyTrentway-Wager Inc Canada Bus and coach operator
All companies operate in the countries shown above and, except for Stagecoach Transport Holdings plc, are indirectly held. The Group considers thatprincipal subsidiaries includes any subsidiary that has revenue greater than £25.0m per annum, profit before interest and taxation greater than £2.5mper annum, gross assets greater than £25.0m or gross liabilities greater than £25.0m. These thresholds exclude any intercompany amounts andinvestments in subsidiaries. A complete list of subsidiary undertakings is available on request to the company and will be filed with the next AnnualReturn.
Note 18 Principal subsidiaries
The principal subsidiary undertakings (ordinary shares 100% owned except where shown) as at 30 April 2011 were:
Country ofregistration or
Company incorporation Principal activity
page 70 | Stagecoach Group plc
£m £m
2009 2009 2011 2010
Note 17 Disposals
Exceptional gains of £18.5m (2010: £3.9m) for the year ended 30 April 2011 have been included in the consolidated income statement as the resultsof discontinued operations. These gains arose from the release of liabilities that were previously recorded for amounts potentially owing which are nowno longer payable in respect of disposed businesses.
In respect of the businesses disposed of, the consideration, net assets disposed and profit on disposal for the year ended 30 April 2011, were as follows:
Net assets disposed 5.3 3.5Loss on disposal 19.9 3.3 (3.2) il(3.2)
Net consideration receivable Nil (1.7) 2.1 0.3Deferred consideration in respect of businesses disposed of in current year 0.8 (0.9) NilDeferred consideration received in year in respect of businesses disposed of in prior years 0.8 Nil 1.3
Net cash inflow Nil 3.6 1.2 1.6
78189_STC_Back FINAL_78189_StCchV13_BACK 05/07/2011 11:46 Page 70

Parts and consumables 26.6 24.1
All inventories are carried at cost less a provision to take account of slow moving and obsolete items. Changes in the provision for slow moving andobsolete inventories were as follows:
At beginning of year 1.6 1.8Charged to income statement 0.4 0.2Amount released to income statement, not used Nil (0.1)Amount utilised (0.3) (0.3)
At end of year 1.7 1.6
There was no material write down of inventories during the current or prior years.
The Group is party to consignment stock arrangements and as at 30 April 2011, the Group physically held consignment stock of a value amounting to£0.7m (2010: £0.7m) in addition to the amounts disclosed above.
Stagecoach Group plc | page 71
2011 2010
£m £m
Non-current:Loan to joint venture 2.8 3.1Less: provision for impairment (2.8) (3.1)
Nil NilPrepayments 19.2 17.2Other receivables 0.2 0.4
19.4 17.6
Current:Trade receivables 115.0 128.8Less: provision for impairment (1.9) (4.5)
Trade receivables – net 113.1 124.3Other receivables 23.6 12.4Prepayments 29.3 25.5Accrued income 31.1 21.7VAT and other government receivables 24.4 16.4
221.5 200.3
A loan of US$4.7m (2010: US$4.7m) to New York Splash Tours LLC is outstanding at 30 April 2011. The loan is interest bearing at 7% per annum and isrepayable by instalments. The loan outstanding as at 30 April 2011, translated at year end rates was £2.8m (2010: £3.1m) and is included in non-current trade and other receivables.
The movement in the provision for impairment of trade receivables was as follows:
At beginning of year (4.5) (4.3)Impairment losses in year charged to income statement (0.8) (1.8)Reversal of impairment losses credited to income statement 0.3 0.5Amounts utilised 3.1 1.0Foreign exchange movements Nil 0.1
At end of year (1.9) (4.5)
Further information on credit risk is provided in note 27.
Note 20 Trade and other receivables
Trade and other receivables were as follows:
2011 2010
£m £m
2011 2010
£m £m
2011 2010
£m £m
Note 19 InventoriesInventories were as follows:
78189_STC_Back FINAL_78189_StCchV13_BACK 05/07/2011 11:46 Page 71

Notes to the consolidated financial statements
CurrentLoan notes 21.1 26.2Hire purchase and lease obligations 38.8 21.3Redeemable ‘B‘ preference shares 2.6 3.3
62.5 50.8
Non-currentSterling 5.75% Notes 410.2 406.9Hire purchase and lease obligations 181.9 219.2
592.1 626.1
Total borrowings 654.6 676.9
Note 23 Borrowings
The carrying value of borrowings was as follows:
£m £m
2011 2010
CurrentTrade payables 134.6 124.6Accruals 270.1 300.2Deferred income 94.1 74.2Cash-settled share based payment liability 0.5 0.4Deferred grant income 1.4 4.0Loans from joint ventures 1.7 1.7PAYE and NIC payable 23.0 18.1VAT and other government payables 4.2 1.4
529.6 524.6
Non-currentAccruals 13.9 11.1Deferred grant income 7.3 7.3Cash-settled share based payment liability 2.0 0.4PAYE and NIC payable 0.6 0.4VAT and other government payables Nil 0.4Other payables 0.5 0.8
24.3 20.4
Note 22 Trade and other payables
Trade and other payables were as follows:
page 72 | Stagecoach Group plc
Cash at bank and in hand 358.3 375.7
The cash amounts shown above include £25.0m on 12 month deposit maturing by March 2012, £52.0m on 3 month deposit maturing by May 2011,£65.0m on 3 month deposit maturing by June 2011, and £35.0m deposited on 30 day notice accounts (2010: £169.0m on 3 month deposit maturingby June 2010, £32.0m deposited on 30 day notice accounts and £10.4m deposited in a 7 day notice account). The remaining amounts are accessible tothe Group within one day (2010: one day).
The Group has a bank offset arrangement whereby the Company and several of its subsidiaries each have bank accounts with the same bank, which aresubject to rights of offset. The cash at bank and in hand of £358.3m (2010: £375.7m) above included the net balance on these offset accounts of£24.2m (2010: £13.7m), which comprised £844.5m (2010: £702.2m) of positive bank balances less £820.3m (2010: £688.5m) of bank overdrafts.
Note 21 Cash and cash equivalents2011 2010
£m £m
2011 2010
£m £m
78189_STC_Back FINAL_78189_StCchV13_BACK 05/07/2011 11:46 Page 72

Stagecoach Group plc | page 73
(b) Repayment profileBorrowings are repayable as follows:
(a) Sterling 5.75% NotesOn 16 December 2009, the Group issued £400m of 5.75% Notes due in 2016. Interest on the Notes is paid annually in arrears and all remaining Noteswill be redeemed at their principal amount on 16 December 2016.The Notes were issued at 99.599% of their principal amount. The consolidated carrying value of the Notes at 30 April 2011 was £410.2m (2010:£406.9m) after taking account of the discount on issue, issue costs and the fair value of interest rate swaps used to manage the interest rate profile ofthe Notes.
On demand or within 1 yearLoan notes 21.1 26.2Hire purchase and lease obligations 38.8 21.3Redeemable ‘B’ preference shares 2.6 3.3
62.5 50.8
Within 1-2 yearsHire purchase and lease obligations 33.7 38.4
Within 2-5 yearsHire purchase and lease obligations 98.8 102.8
Over 5 yearsHire purchase and lease obligations 49.4 78.0Sterling 5.75% Notes 410.2 406.9
459.6 484.9
Total borrowings 654.6 676.9Less current maturities (62.5) (50.8)
Non-current portion of borrowings 592.1 626.1
Interest terms on UK hire purchase and lease obligations are at annual rates between 0.40% and 2.00% over bank base rate or equivalent LIBOR rates,subject to certain minimum rates. Interest terms on overseas lease obligations are at fixed rates, which at 30 April 2011 average 4.3% per annum.Interest on loan notes are at three months LIBOR. Loan notes amounting to £21.1m (2010: £26.2m) are backed by guarantees provided under Groupbanking facilities.The loan notes have been classified by reference to the earliest date on which the loan note holders can request redemptions.UK bank loans and Sterling Notes are unsecured.
Note 23 Borrowings (continued)
The minimum lease payments under hire purchase and lease obligations fall due as follows:
Not later than one year 43.6 26.0Later than one year but not more than five years 142.7 152.3More than five years 49.9 78.6
236.2 256.9Future finance costs on hire purchase and finance leases (15.5) (16.4)
Carrying value of hire purchase and finance lease liabilities 220.7 240.5
For variable-rate hire purchase arrangements, the future finance costs included in the above table are based on the interest rates applying at thebalance sheet date. The Group in its ordinary course of business enters into hire purchase and finance lease agreements to fund or refinance the purchase of vehicles. All ofthe hire purchase and lease obligations shown above are in respect of vehicles. The lease agreements are typically for periods of 5 to 10 years and donot have contingent rent or escalation clauses.The agreements have industry standard terms and do not contain any restrictions on dividends, additional debt or further leasing.
£m £m
2011 2010
£m £m
2011 2010
78189_STC_Back FINAL_78189_StCchV13_BACK 05/07/2011 11:46 Page 73

Beginning of year (19.2) 1.3 (17.9)Charged to income statement (9.5) (1.3) (10.8)Acquired through business combinations 14.0 Nil 14.0Charged to equity (32.6) Nil (32.6)Foreign exchange movements 0.5 Nil 0.5
End of year (46.8) Nil (46.8)
The deferred tax liabilities after more than one year are £47.3m (2010: £19.2m). The deferred tax asset due after more than one year is £Nil (2010: £1.3m –which was recognised in respect of tax losses).
Deferred taxation is calculated as follows:
Accelerated capital allowances (99.1) (100.9)Pension temporary differences 25.2 56.6Short-term temporary differences 27.1 26.4
(46.8) (17.9)
The amount of deferred tax recognised in the income statement by type of temporary difference is as follows:
Accelerated capital allowances (4.9) 1.8Pension temporary differences (4.8) (5.1)Short-term temporary differences (1.1) (10.7)
(10.8) (14.0)
Note 25 ProvisionsThe movements in provisions were as follows:
Beginning of year 14.8 115.2 3.6 1.8 0.2 135.6Provided during year (after discounting) Nil 54.8 Nil 1.2 Nil 56.0Unwinding of discount Nil 3.8 Nil Nil 0.1 3.9Utilised in the year Nil (58.0) (0.7) (1.3) (3.4) (63.4)Acquired through business combinations Nil 17.6 0.3 Nil 39.5 57.4Arising on sale of tokens during year 1.4 Nil Nil Nil Nil 1.4Redemption of tokens (4.1) Nil Nil Nil Nil (4.1)Foreign exchange movements Nil (3.1) (0.2) Nil Nil (3.3)
End of year 12.1 130.3 3.0 1.7 36.4 183.5
30 April 2011:Current 4.1 41.9 0.5 1.7 8.7 56.9Non-current 8.0 88.4 2.5 Nil 27.7 126.6
12.1 130.3 3.0 1.7 36.4 183.5
30 April 2010:Current 4.5 39.0 1.2 1.8 0.1 46.6Non-current 10.3 76.2 2.4 Nil 0.1 89.0
14.8 115.2 3.6 1.8 0.2 135.6
The token redemption provision relates to tokens issued to third parties to be redeemed as payment for transportation services. Tokens are typically redeemed withinthree years of issue.The insurance provisions relate to insurance reserves on incurred accidents up to 30 April in each year where claims have not been settled. These are based on actuarialreviews and prior claims history. Claims are typically settled within five years of origination.The environmental provisions relate to legal or constructive obligations to undertake environmental work, such as an obligation to rectify land which has beencontaminated by fuel or to eliminate the presence of asbestos. The provision is based on the estimated cost of undertaking the work required, and is expected to befully utilised over the next three years.The redundancy provision relates to planned redundancies and is expected to be utilised within one year.Provisions for acquired customer contracts relate to contracts that have been acquired through business combinations that have been identified as being onunfavourable terms at the relevant requisition date and the provisions are expected to be fully utilised within five years.
Note 24 Deferred tax
The Group movement in deferred tax during the year was as follows:
Notes to the consolidated financial statements
£m £m £m
Deferred tax Deferred tax Netliabilities asset
£m £m
2011 2010
£m £m
2011 2010
Token redemption Insurance Environmental Redundancy Acquiredprovision provisions provisions provision customer contracts Total
£m £m £m £m £m £m
page 74 | Stagecoach Group plc
78189_STC_Back FINAL_78189_StCchV13_BACK 05/07/2011 11:46 Page 74

Stagecoach Group plc | page 75
Note 26 Retirement benefits
The Group contributes to a number of pension schemes. The principal defined benefit occupational schemes are as follows:
• Stagecoach Pension Schemes (“SPS”) comprising the Stagecoach Group Pension Schemeand the East London Bus Group Pension Scheme; 30 April 2008, 5 April 2010
• The South West Trains section of the Railways Pension Scheme (“RPS”); 30 December 2007• The Island Line section of the Railways Pension Scheme (“RPS”); 30 December 2007• The East Midlands Trains section of the Railways Pension Scheme (“RPS”); and 30 December 2007• A number of UK Local Government Pension Schemes (“LGPS”). 5 April 2010
The Directors believe that separate consideration should be given to RPS as the Group has no rights or obligations in respect of sections of thescheme following expiry of the related franchises. In addition, under the terms of RPS, any fund deficit or surplus is shared by the employer (60%) andthe employees (40%) in accordance with the shared cost nature of RPS. The employees’ share of the deficit (or surplus) is reflected as an adjustment tothe RPS liabilities (or assets). Therefore the liability (or asset) recognised for the relevant sections of RPS reflects that part of the net deficit (or surplus)of each section that the employer is obliged to fund (or expected to recover) over the life of the franchise to which the section relates. The “franchiseadjustment” is the portion of the deficit (or surplus) that is expected to exist at the end of the franchise and for which the Group will not be obliged tofund (or entitled to recover).In addition, the Group contributes to a number of defined contribution (“DC”) schemes, covering UK and non-UK employees.The consolidated balance sheet shows retirement benefit assets of £23.7m (2010: £Nil) and retirement benefit obligations of £120.8m (2010:£202.1m). The net liability of £97.1m (2010: £202.1m) is analysed below.The amounts recognised in the balance sheet were as follows:
As at 30 April 2011
Equities 653.6 474.4 179.7 0.3 Nil 1,308.0Bonds 235.8 99.3 39.3 0.6 Nil 375.0Cash 71.4 3.1 35.4 0.4 Nil 110.3Property 66.9 94.1 15.9 Nil Nil 176.9
Fair value of plan assets 1,027.7 670.9 270.3 1.3 Nil 1,970.2
Present value of obligations– gross liabilities (1,041.0) (913.6) (282.9) (4.5) (4.2) (2,246.2)– adjustment for members’ share of RPS deficit (40%) Nil 97.1 Nil Nil Nil 97.1– franchise adjustment Nil 99.2 Nil Nil Nil 99.2
Present value of obligations (1,041.0) (717.3) (282.9) (4.5) (4.2) (2,049.9)
Irrecoverable surplus (8.2) Nil (9.2) Nil Nil (17.4)
Liabilities recognised in the balance sheet (21.5) (46.4) (21.8) (3.2) (4.2) (97.1)
As at 30 April 2010
Equities 521.1 424.8 178.0 0.2 Nil 1,124.1Bonds 125.7 88.9 56.2 0.6 Nil 271.4Cash 46.0 2.8 16.3 0.4 Nil 65.5Property 25.9 84.2 19.4 Nil Nil 129.5
Fair value of plan assets 718.7 600.7 269.9 1.2 Nil 1,590.5
Present value of obligations– gross liabilities (814.8) (850.2) (329.5) (4.1) (4.6) (2,003.2)– adjustment for members’ share of RPS deficit (40%) Nil 99.8 Nil Nil Nil 99.8– franchise adjustment Nil 110.8 Nil Nil Nil 110.8
(814.8) (639.6) (329.5) (4.1) (4.6) (1,792.6)
Liabilities recognised in the balance sheet (96.1) (38.9) (59.6) (2.9) (4.6) (202.1)
The major categories of plan assets as a percentage of total plan assets are as follows:
Equities 66.4 70.7Bonds 19.0 17.1Cash 5.6 4.1Property 9.0 8.1
100.0 100.0
£m £m £m £m £m £m
SPS RPS LGPS Other Unfunded Totalplans
Funded plans
£m £m £m £m £m £m
SPS RPS LGPS Other Unfunded Totalplans
Funded plans
% %
2011 2010
Date as at which last scheme valuation was prepared
78189_STC_Back FINAL_78189_StCchV13_BACK 05/07/2011 11:46 Page 75

Note 26 Retirement benefits (continued)
The amounts recognised in the income statement were as follows:
Year ended 30 April 2011
Defined benefit schemes:Current service cost 24.9 28.1 1.9 1.0 Nil 55.9Interest cost 51.3 29.3 16.5 0.2 Nil 97.3Expected return on plan assets (62.0) (28.2) (19.2) (0.1) Nil (109.5)Unwinding of franchise adjustment Nil (6.3) Nil Nil Nil (6.3)
Total defined benefit costs 14.2 22.9 (0.8) 1.1 Nil 37.4Defined contribution costs Nil Nil Nil Nil 4.8 4.8
Total included in staff costs 14.2 22.9 (0.8) 1.1 4.8 42.2
The actual return on plan assets for the year ended 30 April 2011 was £145.6m.
Year ended 30 April 2010
Defined benefit schemes:Current service cost 19.3 20.6 1.7 0.6 Nil 42.2Curtailments Nil (0.7) Nil Nil Nil (0.7)Interest cost 40.3 23.5 16.8 0.2 Nil 80.8Expected return on plan assets (42.0) (21.9) (16.0) (0.1) Nil (80.0)Unwinding of franchise adjustment Nil (2.7) Nil Nil Nil (2.7)
Total defined benefit costs 17.6 18.8 2.5 0.7 Nil 39.6Defined contribution costs Nil Nil Nil Nil 5.2 5.2
Total included in staff costs 17.6 18.8 2.5 0.7 5.2 44.8
The actual return on plan assets for the year ended 30 April 2010 was £326.9m.
Notes to the consolidated financial statements
SPS RPS LGPS OtherUnfunded
Totaland DC plans
£m £m £m £m £m £m £m £m
Funded plans
page 76 | Stagecoach Group plc
SPS RPS LGPS OtherUnfunded
Totaland DC plans
£m £m £m £m £m £m £m £m
Funded plans
78189_STC_Back FINAL_78189_StCchV13_BACK 05/07/2011 11:46 Page 76

Stagecoach Group plc | page 77
Note 26 Retirement benefits (continued)
The movements in the net liability recognised in the balance sheet in respect of defined benefit plans for the year ended 30 April 2011 were as follows:
Year ended 30 April 2011
At beginning of year – liability 96.1 38.9 59.6 2.9 4.6 202.1Total expense (4.8) 9.8 14.2 22.9 (0.8) 1.1 Nil 37.4Actuarial (gains)/losses (13.0) (7.5) (53.8) 10.7 (32.7) (0.6) (0.1) (76.5)Employers’ contributions and settlements (30.0) (3.3) (27.2) (26.1) (4.2) Nil (0.3) (57.8)Acquisitions (30.0) (3.3) (7.8) Nil Nil Nil Nil (7.8)Disposals (30.0) (3.3) Nil Nil (0.1) Nil Nil (0.1)Foreign exchange movements (18.3) (17.9) Nil Nil Nil (0.2) Nil (0.2)
At end of year – liability (27.3) (19.5) 21.5 46.4 21.8 3.2 4.2 97.1
The movements in the net liability recognised in the balance sheet in respect of defined benefit plans for the year ended 30 April 2010 were as follows:
Year ended 30 April 2010
At beginning of year – liability 11.6 28.2 33.9 2.5 4.4 80.6Total expense (4.8) 9.8 17.6 18.8 2.5 0.7 Nil 39.6Actuarial losses/(gains) (13.0) (7.5) 94.5 16.7 27.3 (0.3) 0.5 138.7Employers’ contributions and settlements (18.3) (17.9) (27.6) (24.8) (4.1) Nil (0.3) (56.8)
At end of year – liability (27.3) (19.5) 96.1 38.9 59.6 2.9 4.6 202.1
The movements in the present value of obligations recognised in the balance sheet in respect of defined benefit plans for the year ended 30 April 2011were as follows:
At beginning of year 1,792.6 1,339.0Current service cost 55.9 42.2Interest cost 97.3 80.8Unwinding of franchise adjustment (6.3) (2.7)Members’ contributions paid 10.9 8.7Actuarial (gains)/losses (57.8) 385.6Benefits paid (65.5) (60.0)Curtailments Nil (0.7)Acquisitions 236.2 NilDisposals (13.3) NilForeign exchange movements (0.1) (0.3)
At end of year 2,049.9 1,792.6
Movements in the total fair value of plan assets were as follows:
At beginning of year 1,590.5 1,258.4Expected return on scheme assets 109.5 80.0Actuarial gains 36.1 246.9Other employers’ contributions and settlements 57.8 56.8Members’ contributions paid 10.9 8.7Benefits paid (65.5) (60.0)Acquisitions 244.0 NilDisposals (13.2) NilForeign exchange movements 0.1 (0.3)
At end of year 1,970.2 1,590.5
£m £m £m £m £m £m
SPS RPS LGPS Other Unfunded Totalplans
Funded plans
£m £m
2011 2010
£m £m
2011 2010
£m £m £m £m £m £m
SPS RPS LGPS Other Unfunded Totalplans
Funded plans
78189_STC_Back FINAL_78189_StCchV13_BACK 05/07/2011 11:46 Page 77

Note 26 Retirement benefits (continued)
The amounts recognised in the statement of comprehensive income were as follows:
Actual return less expected return on plan assets 36.1 246.9Experience adjustment, arising on scheme liabilities (23.1) 42.3Adjustment for unrecognised surplus (17.4) NilChanges in assumptions underlying the present value of the liabilities 98.8 (497.3)Franchise adjustment (17.9) 69.4
Total actuarial gain/(loss) recognised 76.5 (138.7)
The history of experience adjustments is as follows:
Experience adjustments on scheme liabilities:Experience adjustments on scheme liabilities:Experience adjustments (£m) (23.1) 42.3 59.7 (28.6) (18.1)Scheme liabilities (£m) (2,049.9) (1,792.6) (1,339.0) (1,432.1) (1,325.0)Percentage of scheme liabilities (%) 1.1% (2.4)% (4.5)% 2.0% 1.4%Experience adjustments on plan assets:Experience adjustments (£m) 36.1 246.9 (334.2) (141.7) 55.2Plan assets (£m) 1,970.2 1,590.5 1,258.4 1,474.6 1,290.2Percentage of scheme assets (%) 1.8% 15.5% (26.6)% (9.6)% 4.3%
The cumulative amount of actuarial gains and losses on Group defined benefit schemes recognised in the statement of comprehensive income since1 May 2004 is a £159.7m loss (2010: £236.2m loss).
The estimated amounts of contributions expected to be paid by the Group to the schemes during the financial year ending 30 April 2012 is £68.1m(estimated at 30 April 2010 for year ended 30 April 2011: £62.1m).
The principal actuarial assumptions used were as follows:
Rate of increase in pensionable salaries – SPS 3.4% 3.4%Rate of increase in pensionable salaries – other defined benefit schemes 4.3% 4.4%Rate of increase of pensions in payment– SPS 3.3% 3.4%– other defined benefit schemes 2.5% 2.4%-3.3%
Discount rate 5.6% 5.7%RPI Inflation 3.3% 3.4%CPI Inflation 2.3% n/aExpected long-term rates of return as at 30 April were:Equities* 8.3% 8.3%Bonds 5.0% 5.0%Cash 4.4% 4.7%Property 7.5% 7.5%
* includes private equityThe expected return on plan assets is based on expectations at the beginning of the period for returns over the entire life of the benefit obligation. Theexpected returns are set in conjunction with external advisors and take account of market factors, fund managers’ views and targets for future returnsand where appropriate, historical returns.The life expectancy assumptions used for each scheme are periodically reviewed. The weighted average life expectancies assumed as at 30 April 2011were:
Current pensioners aged 65 – male 19.6 19.5Current pensioners aged 65 – female 23.9 23.8Future pensioners at age 65 (aged 45 now) – male 21.9 21.8Future pensioners at age 65 (aged 45 now) – female 26.0 25.9
Note 27 Financial instruments(a) OverviewThis note provides details of the Group’s financial instruments. Except where otherwise stated, the disclosures provided in this note exclude:– Interests in subsidiaries and joint ventures accounted for in accordance with International Accounting Standard 27 (“IAS 27”), Consolidated and
Separate Financial Statements and International Accounting Standard 31 (“IAS 31”), Interests in Joint Ventures.– Retirement benefit assets and obligations.– Financial instruments, contracts and obligations under share based payment transactions.Liabilities or assets that are not contractual (such as income taxes that are created as a result of statutory requirements imposed by governments,prepayments, provisions and deferred income) are not financial liabilities or financial assets. Accordingly, prepayments, provisions, deferred incomeand amounts payable or receivable in respect of corporation tax, sales tax (including UK Value Added Tax), payroll tax and other taxes are excluded fromthe disclosures provided in this note.
£m £m
2011 2010
years years
2011 2010
2011 2010
2011 2010 2009 2008 2007
Notes to the consolidated financial statements
page 78 | Stagecoach Group plc
78189_STC_Back FINAL_78189_StCchV13_BACK 05/07/2011 11:47 Page 78

Stagecoach Group plc | page 79
Note 27 Financial instruments (continued)
(b) Carrying values of financial assets and financial liabilitiesThe carrying amounts of financial assets and financial liabilities on the consolidated balance sheet and their respective fair values were:
Financial assets
Financial assets at fair value through profit or loss Nil Nil Nil Nil
Held-to-maturity investments Nil Nil Nil Nil
Loans and receivables– Non-current assets– Other receivables 20 0.2 0.4 0.2 0.4
– Current assets– Accrued income 20 31.1 21.7 31.1 21.7– Trade receivables, net of impairment 20 113.1 124.3 113.1 124.3– Other receivables 20 23.6 12.4 23.6 12.4– Cash and cash equivalents 21 358.3 375.7 358.3 375.7
Available for sale financial assets– Non-current assets– Available for sale and other investments 15 2.1 1.9 2.1 1.9
Total financial assets 528.4 536.4 528.4 536.4
Financial liabilities
Financial liabilities at fair value through profit or loss Nil Nil Nil Nil
Financial liabilities measured at amortised cost– Non-current liabilities– Accruals 22 (13.9) (11.1) (13.9) (11.1)– Other payables 22 (0.5) (0.8) (0.5) (0.8)– Borrowings 23 (592.1) (626.1) (605.1) (640.7)
– Current liabilities– Trade payables 22 (134.6) (124.6) (134.6) (124.6)– Accruals 22 (270.1) (300.2) (270.1) (300.2)– Loans from joint ventures 22 (1.7) (1.7) (1.7) (1.7)– Borrowings 23 (62.5) (50.8) (62.5) (50.8)
Total financial liabilities (1,075.4) (1,115.3) (1,088.4) (1,129.9)
Net financial liabilities (547.0) (578.9) (560.0) (593.5)
Derivatives that are designated as effective hedging instruments are not shown in the above table. Information on the carrying value of suchderivatives is provided in note 27(j).The fair values of financial assets and financial liabilities shown above are determined as follows:
• The carrying value of loans to joint ventures, accrued income, trade receivables and other receivables is considered to be a reasonable approximationof fair value. Given the short average time to maturity, no specific assumptions on discount rates have been made. The effect of credit losses notalready reflected in the carrying value as impairment losses is assumed to be immaterial.
• £2.1m (2010: £1.9m) of available for sale financial assets for which market prices are not available are measured at cost because their fair valuecannot be measured reliably – the fair value of these assets is shown in the above table as being equal to their carrying value.
• The carrying value of trade payables, other payables, accruals and loans from joint ventures is considered to be a reasonable approximation of fairvalue. Given the relatively short average time to maturity, no specific assumptions on discount rates have been made.
• The fair value of fixed-rate notes (included in borrowings) that are quoted on a recognised stock exchange is determined with reference to the “bid”price as at the balance sheet date.
• The carrying value of fixed rate hire purchase and finance lease liabilities (included in borrowings) is considered to be a reasonable approximation offair value taking account of the amounts involved in the context of total financial liabilities and the fixed interest rates relative to market interest ratesat the balance sheet date.
• The fair value of other borrowings on which interest is payable at floating rates is not considered to be materially different from the carrying value.
We do not consider that the fair value of financial instruments would change materially from that shown above as a result of any reasonable change tothe assumptions made in determining the fair values shown above. The fair value of financial instruments, and in particular the fixed rate notes, wouldbe affected by changes in market interest rates. We estimate that a 100 basis points reduction in market interest rates would increase the fair value ofthe fixed-rate notes liability by around £20.1m (2010: £23.3m). At 30 April 2011, this increase would be partly offset by a movement of £5.0m (2010:£8.5m in the fair value of the Group’s interest rate derivatives (see note 27(j)), which are fair value hedges of a portion of the fixed-rate notes.
£m £m £m £m
Carrying value Carrying value Fair value Fair value
2011 2010 2011 2010Other
balancesheetnotes
78189_STC_Back FINAL_78189_StCchV13_BACK 05/07/2011 11:47 Page 79

Note 27 Financial instruments (continued)
(b) Carrying values of financial assets and financial liabilities (continued)Fair value estimationFinancial instruments that are measured in the balance sheet at fair value are disclosed by level of the following fair value measurement hierarchy:Level 1 – Quoted prices (unadjusted) in active markets for identical assets or liabilities.Level 2 – Inputs other than quoted prices included within Level 1 that are observable for the asset or liability either directly (that is, as prices) or indirectly(that is, derived from prices).Level 3 – Inputs for the assets or liability that are not based on observable market data (that is, unobservable inputs).The following table presents the Group’s financial assets and liabilities that are measured at fair value within the hierarchy at 30 April 2011.
Note Level 1 Level 2 Level 3 Total£m £m £m £m
AssetsDerivatives used for hedging 27(j) Nil 71.5 Nil 71.5Available for sale financial assets– Equity securities Nil Nil 2.1 2.1
Total assets Nil 71.5 2.1 73.6
LiabilitiesDerivatives used for hedging 27(j) Nil (0.2) Nil (0.2)
Total liabilities Nil (0.2) Nil (0.2)
The following table presents the Group’s financial assets and liabilities that are measured at fair value within the hierarchy at 30 April 2010.Note Level 1 Level 2 Level 3 Total
£m £m £m £mAssetsDerivatives used for hedging 27(j) Nil 31.2 Nil 31.2Available for sale financial assets– Equity securities Nil Nil 1.9 1.9
Total assets Nil 31.2 1.9 33.1
LiabilitiesDerivatives used for hedging 27(j) Nil (11.3) Nil (11.3)
Total liabilities Nil (11.3) Nil (11.3)
The following table presents the changes in Level 3 financial assets for the year:
At beginning of year 1.9 1.3Foreign exchange movements (0.2) NilPurchases 0.4 0.6
At end of year 2.1 1.9
The “Level 3” financial assets of £2.1m (2010: £1.9m) shown above represent investments in securities that do not trade on a recognised market, suchas investments in unlisted companies. These assets have been valued by management taking account of the cost of the assets and the valuation ofsimilar assets. The value of the assets is not material to the Group and therefore changes in unobservable inputs to the valuations would not have amaterial effect on the financial statements.
(c) Nature and extent of risks arising from financial instrumentsThe Group’s use of financial instruments exposes it to a variety of financial risks, principally:• Market risk – including currency risk, interest rate risk and price risk;• Credit risk; and• Liquidity risk.This note (c) presents qualitative information about the Group’s exposure to each of the above risks, including the Group’s objectives, policies andprocesses for measuring and managing risk: there have been no significant changes to these matters during the year ended 30 April 2011. This note(c) also provides summary quantitative data about the Group’s exposure to each risk. In addition, information on the Group’s management of capital isprovided in section 3.8.15 of the Operating and Financial Review.The Group’s overall financial risk management programme focuses on the unpredictability of financial markets and seeks to reduce the likelihoodand/or magnitude of adverse effects on the financial performance and financial position of the Group. The Group uses derivative financial instrumentsto reduce exposure to foreign exchange risk, commodity price risk and interest rate movements. The Group does not generally hold or issue derivativefinancial instruments for speculative purposes.A Group Treasury Committee and central treasury department (“Group Treasury”) oversee financial risk management in the context of policiesapproved by the Board. Group Treasury identifies, evaluates and hedges financial risks in close co-operation with the Group’s operating units. GroupTreasury is responsible for the execution of derivative financial instruments to manage financial risks. Certain financial risk management activities (forexample, the management of credit risk arising from trade and other receivables) are devolved to the management of individual business units. TheBoard provides written principles for overall risk management, as well as written policies covering specific areas such as foreign exchange risk, interestrate risk, credit risk, use of derivative financial instruments and investing excess liquidity.
Notes to the consolidated financial statements
page 80 | Stagecoach Group plc
£m £m
2011 2010
78189_STC_Back FINAL_78189_StCchV13_BACK 05/07/2011 11:47 Page 80

Stagecoach Group plc | page 81
Note 27 Financial instruments (continued)
(c) Nature and extent of risks arising from financial instruments (continued)(i) Market risk Market risk is the risk that changes in market prices, such as foreign exchange rates, interest rates, equity prices and commodity prices will affect theGroup’s financial performance and/or financial position. The objective of the Group’s management of market risk is to manage and control market riskexposures within acceptable parameters.The Group enters into derivative financial instruments in the ordinary course of business, and also incurs financial liabilities, in order to manage marketrisks. All such transactions are carried out within the guidelines set by the Board. Generally the Group seeks to apply hedge accounting in order toreduce volatility in the consolidated income statement.Foreign currency translation risk Foreign currency translation risk is the risk that the fair value or future cash flows of a financial instrument (including overseas net investments) willfluctuate because of changes in foreign exchange rates. The Group is exposed to foreign currency translation risk principally as a result of netinvestments in foreign operations and borrowings denominated in foreign currencies.The Group has overseas investments in Canada and the USA. To reduce balance sheet translation exposure, the Group partially hedges the sterlingcarrying value of overseas operations through borrowings denominated in their functional currency or, where appropriate, through the use of derivativefinancial instruments. Gains and losses arising from hedging instruments that provide a hedge against foreign net investments are recognised in thestatement of comprehensive income. On 18 December 2009, the Group entered into foreign currency derivative contracts with a notional value ofUS$160.0m, which were accounted for as a hedge of the Group’s overseas net investments and this hedging relationship remains in place. The tablebelow includes the sterling notional value (calculated using the year-end exchange rate) of the foreign currency derivatives outstanding at the balancesheet date.The Group’s objective in managing and measuring foreign currency translation risk associated with net investments in foreign operations andborrowings denominated in foreign currencies is to maintain an appropriate cost of borrowing and retain some potential for benefiting from currencymovements whilst partially hedging against adverse currency movements. It is the Group’s policy to examine each overseas investment individuallyand to adopt a strategy based on current and forecast political and economic climates. The Group measures foreign currency translation risk byidentifying the carrying value of assets and liabilities denominated in the relevant foreign currency and quantifying the impact on equity of changes inthe relevant foreign currency rate.The Group’s consolidated income statement is exposed to movements in foreign exchange rates in the following ways:• The translation of the revenues and costs of the Group’s North American operations; and• The translation of interest payable on US dollar and Canadian dollar denominated debt.The Group’s consolidated balance sheet exposures to foreign currency translation risk were as follows:
US dollars– Net investments in foreign operations (excluding intra-group balances, cash and borrowings) 165.4 179.7– Cash 11.0 21.6– Borrowings (40.4) (51.2)– Notional value of foreign currency derivatives 95.9 104.5
Canadian dollars– Net investments in foreign operations (excluding intra-group balances, cash and borrowings) 47.5 49.7– Cash 0.8 1.6– Borrowings (3.4) (3.9)
Net exposure 276.8 302.0
The amounts shown above are the notional values of all foreign currency derivatives that are net investment hedges and the carrying values of allitems in the consolidated balance sheet that would have differed at the balance sheet date had a different foreign currency exchange rate been applied,except that commodity derivatives that are cash flow hedges are excluded.
The sensitivity of the Group’s consolidated balance sheet to translation exposures is illustrated below:
US dollarUS dollar balance sheet foreign exchange rate 1.6680 1.5307Impact of 10% depreciation of UK sterling against US dollar– US dollar foreign exchange rate 1.5012 1.3776– Increase in consolidated equity (£m) 25.8 28.3
Impact of 10% appreciation of UK sterling against US dollar– US dollar foreign exchange rate 1.8348 1.6838– Decrease in consolidated equity (£m) (21.1) (23.1)
Canadian dollarCanadian dollar balance sheet foreign exchange rate 1.5827 1.5504Impact of 10% depreciation of UK sterling against Canadian dollar– Canadian dollar foreign exchange rate 1.4244 1.3954– Increase in consolidated equity (£m) 5.0 5.3
Impact of 10% appreciation of UK sterling against Canadian dollar– Canadian dollar foreign exchange rate 1.7410 1.7054– Decrease in consolidated equity (£m) (4.1) (4.3)
The above sensitivity analysis is based on the following assumptions:– Only those foreign currency assets and liabilities that are directly affected by changes in foreign exchange rates are included in the calculation.– The above calculations assume that the exchange rates between any pair of currencies other than the pair stated do not change as a result of thechange in the exchange rate between the pair stated.
2011 2010
£m £m
2011 2010
78189_STC_Back FINAL_78189_StCchV13_BACK 05/07/2011 11:47 Page 81

Note 27 Financial instruments (continued)
(c) Nature and extent of risks arising from financial instruments (continued)
(i) Market risk (continued)The Group’s consolidated income statement exposures to foreign currency translation risk were as follows:
US dollars– US$ element of North American operating profit 17.8 9.7– Intangible asset expenses (0.1) (0.3)– Redundancy / restructuring costs (0.7) (0.3)– Share of profit of joint ventures 9.3 8.0– Exceptional items Nil (4.1)– Net finance costs (0.4) (5.2)– Net tax charge (10.0) (2.8)Canadian dollars– C$ element of North American operating profit 2.2 Nil– Net finance costs Nil (0.3)– Net tax (charge)/credit (0.8) 0.1
Net exposure 17.3 4.8
The operating profit figures shown in the above table reconcile to the operating profit for North America shown in the segmental information in note2(b) as follows:
US$ element of North American operating profit shown above 17.8 9.7C$ element of North American operating profit shown above 2.2 NilShare based payment charges denominated in sterling (0.7) (0.6)
Operating profit shown in segmental information 19.3 9.1
The sensitivity of the Group’s consolidated income statement to translational exposures is illustrated below:
US dollarUS dollar average foreign exchange rate 1.5646 1.6020Impact of 10% depreciation of UK sterling against US dollar– US dollar foreign exchange rate 1.4081 1.4418– Increase in consolidated profit after taxation (£m) 1.8 0.5
Impact of 10% appreciation of UK sterling against US dollar– US dollar foreign exchange rate 1.7211 1.7622– Decrease in consolidated profit after taxation (£m) (1.4) (0.5)
Canadian dollarCanadian dollar average foreign exchange rate 1.5823 1.7189Impact of 10% depreciation of UK sterling against Canadian dollar– Canadian dollar foreign exchange rate 1.4241 1.5470– Increase in consolidated profit after taxation (£m) 0.2 Nil
Impact of 10% appreciation of UK sterling against Canadian dollar– Canadian dollar foreign exchange rate 1.7405 1.8908– Decrease in consolidated profit after taxation (£m) (0.1) Nil
The above sensitivity analysis is based on the following assumptions:– Only those income statement items directly affected by changes in foreign exchange rates are included in the calculation. For example, changesin commodity prices that indirectly occur due to changes in foreign exchange rates are not included in the sensitivity calculation.
– The above calculations assume that the exchange rates between any pair of currencies other than the pair stated do not change as a result of thechange in the exchange rate between the pair stated.
Notes to the consolidated financial statements
£m £m
2011 2010
page 82 | Stagecoach Group plc
2011 2010
£m £m
2011 2010
78189_STC_Back FINAL_78189_StCchV13_BACK 05/07/2011 11:47 Page 82

Stagecoach Group plc | page 83
Note 27 Financial instruments (continued)
(c) Nature and extent of risks arising from financial instruments (continued)
(i) Market risk (continued)Foreign currency transactional riskForeign currency transactional risk is the risk that future cash flows (such as from sales and purchases of goods and services) will fluctuate because ofchanges in foreign exchange rates.The Group is exposed to limited foreign currency transactional risk due to the low value of transactions entered into by subsidiaries in currencies otherthan their functional currency. Group Treasury carries out forward buying of currencies where appropriate.The Group reviews and considers hedging of actual and forecast foreign exchange transactional exposures up to one year forward. At 30 April 2011there were no material net transactional foreign currency exposures (2010: £Nil).The Group’s exposure to commodity price risk includes a foreign currency element due to the impact of foreign exchange rate movements on thesterling cost of fuel for the Group’s UK operations. The effect of foreign exchange rate movements on sterling-denominated fuel prices is managedthrough the use of fuel derivative financial instruments denominated in the functional currency in which the fuel is purchased. Further information onfuel hedging is given under the heading “Price risk” on pages 84 to 86.
Interest rate riskInterest rate risk is the risk that the fair value or future cash flows of a financial instrument will fluctuate because of changes in market interest rates.The Group is exposed to interest rate risk principally through its borrowings and interest rate derivatives. It has a mixture of fixed-rate borrowings(where the fair value is exposed to changes in market interest rates), cash and floating-rate borrowings (where the future cash flows are exposed tochanges in market interest rates).The Group’s objective with regards to interest rate risk is to reduce the risk of changes in interest rates significantly affecting future cash flows and/orprofit. To provide some certainty as to the level of interest cost, it is the Group’s policy to manage interest rate exposure through the use of fixed andfloating rate debt. Derivative financial instruments are also used where appropriate to generate the desired interest rate profile. The Group measures interest rate risk by quantifying the relative proportions of each of gross debt and net debt that are effectively subject to fixedinterest rates and considers the duration for which the relevant interest rates are fixed.Following the issue of the Group’s £400m 5.75% bonds in December 2009, the Group adjusted its interest rate management arrangements to ensurean appropriate interest rate profile going forward. Certain of the Group’s interest rate cash flow hedges became ineffective and were cancelled. As aresult, the Group entered into interest rate fair value hedges with a notional value of £150m which synthetically convert a proportion of the fixed ratedebt to floating rate debt.
At 30 April 2011, the interest rate profile of the Group’s interest bearing financial liabilities was as follows:
Currency Floating rate Fixed rate Total Weighted Weightedaverage fixed average periodinterest rate for which rate
is fixed
£m £m £m % Years
Sterling 342.2 268.6 610.8 5.8% 5.7US Dollar Nil 40.4 40.4 4.2% 3.7Canadian Dollar Nil 3.4 3.4 5.1% 0.9
Gross borrowings 342.2 312.4 654.6 5.5% 5.4
At 30 April 2010, the interest rate profile of the Group’s interest bearing financial liabilities was as follows:
Currency Floating rate Fixed rate Total Weighted Weightedaverage fixed average periodinterest rate for which rate
is fixed
£m £m £m % Years
Sterling 355.5 266.3 621.8 5.8% 6.7US Dollar Nil 51.2 51.2 4.2% 4.7Canadian Dollar Nil 3.9 3.9 5.1% 1.9
Gross borrowings 355.5 321.4 676.9 5.5% 6.3
All of the above figures take into account the effect of interest rate derivatives.The floating rate financial liabilities bear interest at rates fixed in advance for periods ranging from one to six months based on market rates.The maturity profile of the Group’s borrowings is shown in note 23(b).
The Group’s financial assets on which floating interest is receivable comprise cash deposits and cash in hand of £358.3m (2010: £375.7m). Financialassets on which fixed interest is receivable total £2.8m (2010: £3.1m) before impairment and comprise a loan to a joint venture in 2011 and 2010. Thenet financial assets on which fixed interest is receivable have a weighted average interest rate of 7.0% (2010: 7.0%) and have no fixed repayment date.The Group does not account for any fixed rate financial assets and liabilities at fair value through profit or loss. The interest rate derivatives outstandingat 30 April 2011 are designated by the Group as hedging instruments under a fair value accounting model. No other hedging instruments areaccounted for by the Group under a fair value accounting model.
78189_STC_Back FINAL_78189_StCchV13_BACK 05/07/2011 11:47 Page 83

page 84 | Stagecoach Group plc
Notes to the consolidated financial statementsNote 27 Financial instruments (continued)
(c) Nature and extent of risks arising from financial instruments (continued)(i) Market risk (continued)The impact of a change of 100 basis points on all relevant floating interest rates on annualised interest payable on cash and borrowings balancesoutstanding at the balance sheet date was:
Interest rates 100 basis points higher- Decrease in net finance costs 0.2 0.2- Increase in net tax charge (0.1) (0.1)
- Increase in profit after taxation 0.1 0.1
Interest rates 100 basis points lower- Increase in net finance costs (0.2) (0.2)- Decrease in net tax charge 0.1 0.1
- Decrease in profit after taxation (0.1) (0.1)
The above sensitivity analysis is based on the following methods and assumptions:- All relevant floating interest rates (including Bank of England base rate and LIBOR) change by 100 basis points.- The change is calculated by working out an annualised interest charge on the amounts outstanding at the balance sheet date and comparing this tothe same charge re-calculated for a change of 100 basis points in the interest rate. While this provides some indication of the impact on future profitand cash flows from changes in interest rates, it does not necessarily indicate the extent to which the profit for the years ended 30 April 2011 and30 April 2010 would have differed had the interest rates applying during those years been different.
- The impact of changes in interest rates on items that are not financial instruments (for example, provisions and pension assets/obligations) isexcluded.
Price riskThe Group is exposed to commodity price risk. The Group’s operations as at 30 April 2011 consume approximately 370m litres of diesel fuel perannum. As a result, the Group’s profit is exposed to movements in the underlying price of fuel. The Group’s objective in managing commodity price risk is to reduce the risk that movements in fuel prices result in adverse movements in its profitand cash flow. The Group has a policy of managing the volatility in its fuel costs by maintaining an ongoing fuel-hedging programme wherebyderivatives are used to fix or cap the variable unit cost of a percentage of anticipated fuel consumption. The Group’s exposure to commodity price riskis measured by quantifying the element of projected future fuel costs, after taking account of derivatives in place, which varies due to movements infuel prices. Group Treasury is responsible for the processes for measuring and managing commodity price risk.The Group’s overall fuel costs include the impact of delivery margins, fuel taxes and fuel tax rebates. These elements of fuel costs are not managed aspart of Group Treasury’s commodity price risk management and are managed directly by business unit management.The Group uses a number of fuel derivatives to hedge against movements in the price of the different types of fuel used in each of its divisions. Thefuel derivatives hedge the underlying commodity price risk (denominated in US$) and in the case of the UK Bus (regional operations) division, the UKBus (London) and the UK Rail division, they also hedge the currency risk due to the commodity being priced in US$ and the functional currency of thetwo divisions being pounds sterling.
£m £m
2011 2010
78189_STC_Back FINAL_78189_StCchV13_BACK 05/07/2011 11:47 Page 84

Stagecoach Group plc | page 85
Note 27 Financial instruments (continued)
(c) Nature and extent of risks arising from financial instruments (continued)(i) Market risk (continued)At 30 April 2011 and 30 April 2010, the projected fuel costs (excluding premia payable on fuel derivatives, delivery margins, fuel taxes and fuel taxrebates) for the next twelve months were:
Costs subject to fuel swaps:– UK Bus (regional operations) (76.3) (68.0)– UK Bus (London) (9.4) Nil– UK Rail (19.0) (14.9)– North America (21.0) (18.9)
(125.7) (101.8)
Costs not subject to fuel swaps:– UK Bus (regional operations) (4.1) (1.8)– UK Bus (London) (11.4) Nil– UK Rail (8.4) (5.8)– North America (9.0) (4.6)
(32.9) (12.2)
Total (158.6) (114.0)
The figures in the above table are after taking account of derivatives and applying the fuel prices and foreign exchange rates as at the balance sheetdate.
If all of the relevant fuel prices were 10% higher at the balance sheet date, the amounts in the above table would change by the following:
Costs not subject to fuel swaps:– UK Bus (regional operations) (0.4) (0.2)– UK Bus (London) (1.1) Nil– UK Rail (0.8) (0.6)– North America (0.9) (0.5)
Decrease in projected profit before taxation (3.2) (1.3)
£m £m
2011 2010
£m £m
2011 2010
78189_STC_Back FINAL_78189_StCchV13_BACK 05/07/2011 11:47 Page 85

Notes to the consolidated financial statements
page 86 | Stagecoach Group plc
Note 27 Financial instruments (continued)
(c) Nature and extent of risks arising from financial instruments (continued)(i) Market risk (continued)If all of the relevant fuel prices were 10% lower at the balance sheet date, the amounts would change by the following:
Costs not subject to fuel swaps:– UK Bus (regional operations) 0.4 0.2– UK Bus (London) 1.1 Nil– UK Rail 0.8 0.6– North America 0.9 0.5
Increase in projected profit before taxation 3.2 1.3
(ii) Credit riskCredit risk is the risk of financial loss to the Group if a customer or counterparty to a financial instrument fails to meet its contractual obligations. Credit risk is managed by a combination of Group Treasury and business unit management, and arises from cash and cash equivalents, derivativefinancial instruments and deposits with banks and financial institutions, as well as credit exposures to amounts due from outstanding receivables andcommitted transactions.The Group’s objective is to minimise credit risk to an acceptable level whilst not overly restricting the Group’s ability to generate revenue and profit. Itis the Group’s policy to invest cash assets safely and profitably. To control credit risk, counterparty credit limits are set by reference to published creditratings and the counterparty’s geographical location. The Group considers the risk of material loss in the event of non-performance by a financialcounterparty to be low.In determining whether a financial asset is impaired, the Group takes account of:• The fair value of the asset at the balance sheet date and where applicable, the historic fair value of the asset;• In the case of receivables, the counterparty’s typical payment patterns;• In the case of receivables, the latest available information on the counterparty’s creditworthiness such as available financial statements, creditratings etc.
In the case of equity investments classified as available for sale assets, a significant or prolonged reduction in the fair value of the assets is considered asan indicator that the securities might be impaired.The movement in the provision for impairment of trade and other receivables is shown in note 20.The table below shows the maximum exposure to credit risk for the Group at the balance sheet date:
Gross Impairment Net exposure Gross Impairment Net exposure
2011 2011 2011 2010 2010 2010
£m £m £m £m £m £m
Financial assets at fair value through profit or loss Nil Nil Nil Nil Nil NilTrade receivables 115.0 (1.9) 113.1 128.8 (4.5) 124.3Loans and other receivables 57.7 (2.8) 54.9 37.6 (3.1) 34.5Cash and cash equivalents – pledged as collateral 20.3 Nil 20.3 65.8 Nil 65.8Cash and cash equivalents - other 338.0 Nil 338.0 309.9 Nil 309.9
Excluding derivative financial instruments 531.0 (4.7) 526.3 542.1 (7.6) 534.5Derivatives used for hedging 71.5 Nil 71.5 31.2 Nil 31.2
Total exposure to credit risk 602.5 (4.7) 597.8 573.3 (7.6) 565.7
The Group’s exposure to credit risk is influenced mainly by the individual characteristics of each customer or counterparty. The Group’s largest creditexposures are to the UK Department for Transport, Transport for London, and other government bodies and financial institutions with short-termcredit ratings of A1 (or equivalent) or better, all of which the Group considers unlikely to default on their respective liabilities to the Group.
£m £m
2011 2010
78189_STC_Back FINAL_78189_StCchV13_BACK 05/07/2011 11:47 Page 86

Stagecoach Group plc | page 87
Note 27 Financial instruments (continued)
(c) Nature and extent of risks arising from financial instruments (continued)(ii) Credit risk (continued)The Group’s total net exposure to credit risk by geographic region is analysed below:
United Kingdom 552.0 515.6North America 45.8 50.1
597.8 565.7
£m £m
2011 2010
The Group’s financial assets by currency are analysed below:
Sterling 552.0 515.4US dollars 41.0 44.7Canadian dollars 4.8 5.6
597.8 565.7
All of the above financial assets’ carrying amounts are representative of their maximum credit exposure.The following financial assets were past due, but not impaired at the balance sheet date:
Amounts 1 to 90 days overdue 13.7 12.5Amounts 91 to 180 days overdue 1.3 2.3Amounts 181 to 365 days overdue 0.5 0.1Amounts more than 365 days overdue Nil 0.1
15.5 15.0
The Group does not hold any collateral in respect of its credit risk exposures set out above (2010: £Nil) and has not taken possession of any collateral itholds or called for other credit enhancements during the year ended 30 April 2011 (2010: £Nil).
(iii) Liquidity riskLiquidity risk is the risk that the Group will encounter difficulty in meeting its financial obligations as they fall due. The Group’s objective in managingliquidity is to ensure, as far as possible, that it will always have sufficient liquidity to meet its liabilities when due, under both normal and stressedconditions, without incurring unacceptable losses or risking damage to the Group’s reputation.The funding policy is to finance the Group through a mixture of bank, lease and hire purchase debt, capital markets issues and cash generated by thebusiness.As at 30 April 2011, the Group’s credit facilities were £1,112.1m (2010: £959.2m), £447.2m (2010: £466.0m) of which were utilised, includingutilisation for the issuance of bank guarantees, bonds and letters of credit.The Group had the following undrawn committed banking and uncommitted asset finance facilities:
Expiring within one year 204.7 170.5Expiring in more than one year but not more than two years 6.6 322.7Expiring beyond two years 453.6 Nil
664.9 493.2
Although there is an element of seasonality in the Group’s bus and rail operations, the overall impact of seasonality on working capital and liquidity isnot considered significant.The Board expects the Group to be able to meet current and future funding requirements through free cash flow and available committed facilities. Inaddition, the Group has an investment grade rating which should allow it access at short notice to additional bank and capital markets debt funding. The Group’s principal lines of credit have been arranged on a bi-lateral basis with a group of relationship banks which provide bank facilities for generalcorporate purposes. These arranged lines of credit allow cash drawdowns to finance the Group and also include facilities which are dedicated to issuingperformance/season ticket bonds, guarantees and letters of credit.The Group’s committed bank facilities as at 30 April 2011 are analysed below:
£m £m
2011 2010
£m £m
2011 2010
£m £m
2011 2010
Performance bonds, Available for Available forguarantees non-cash cash
Facility etc drawn utilisation only drawingsExpiring in £m £m £m £m
MAIN GROUP FACILITIES– 2016 510.0 (66.9) (33.0) 410.1– 2014 42.0 (34.8) (7.2) Nil– 2013 80.7 (70.8) (9.9) Nil– 2012 69.6 (51.8) (17.8) Nil
702.3 (224.3) (67.9) 410.1LOCAL & SHORT-TERM FACILITIES– Various 15.7 (2.2) Nil 13.5
718.0 (226.5) (67.9) 423.6
78189_STC_Back FINAL_78189_StCchV13_BACK 05/07/2011 11:47 Page 87

Notes to the consolidated financial statements
page 88 | Stagecoach Group plc
Note 27 Financial instruments (continued)
(c) Nature and extent of risks arising from financial instruments (continued)
(iii) Liquidity risk (continued)
The Group manages its liquidity risk based on contracted cash flows. The following are the contractual maturities of financial liabilities, includinginterest payments. The amounts disclosed in the table are the contractual undiscounted cash flows.
As at 30 April 2011 Carrying Contractual Less 1-2 2-5 Moreamount cash flows than 1 year years years than 5 years
£m £m £m £m £m £m
Non derivative financial liabilities:Unsecured bond issues (410.2) (538.0) (23.0) (23.0) (69.0) (423.0)Redeemable preference shares (2.6) (2.6) (2.6) Nil Nil NilFinance lease liabilities (43.8) (48.2) (11.7) (8.4) (26.9) (1.2)Hire purchase liabilities (176.9) (188.0) (31.9) (29.2) (78.2) (48.7)Loan notes payable (21.1) (21.1) (21.1) Nil Nil NilTrade and other payables (420.8) (420.8) (406.4) (14.4) Nil Nil
(1,075.4) (1,218.7) (496.7) (75.0) (174.1) (472.9)
Derivative financial liabilities:Derivatives used for hedging (0.2) (0.2) (0.1) (0.1) Nil Nil
(1,075.6) (1,218.9) (496.8) (75.1) (174.1) (472.9)
As at 30 April 2010 Carrying Contractual Less 1-2 2-5 Moreamount cash flows than 1 year years years than 5 years
£m £m £m £m £m £m
Non derivative financial liabilities:Unsecured bond issues (406.9) (561.0) (23.0) (23.0) (69.0) (446.0)Redeemable preference shares (3.3) (3.3) (3.3) Nil Nil NilFinance lease liabilities (55.1) (62.2) (9.9) (12.5) (33.0) (6.8)Hire purchase liabilities (185.4) (194.7) (16.1) (29.8) (77.0) (71.8)Loan notes payable (26.2) (26.2) (26.2) Nil Nil NilTrade and other payables (438.4) (438.4) (426.5) (11.9) Nil Nil
(1,115.3) (1,285.8) (505.0) (77.2) (179.0) (524.6)
Derivative financial liabilities:Derivatives used for hedging (11.3) (11.8) (4.4) (5.4) (2.0) Nil
(1,126.6) (1,297.6) (509.4) (82.6) (181.0) (524.6)
The “contractual cash flows” shown in the above tables are the contractual undiscounted cash flows under the relevant financial instruments. Wherethe contractual cash flows are variable based on a price, foreign exchange rate, interest rate or index in the future, the contractual cash flows in theabove table have been determined with reference to the relevant price, foreign exchange rate, interest rate or index as at the balance sheet date. Indetermining the interest element of contractual cash flows in cases where the Group has a choice as to the length of interest calculation periods andthe interest rate that applies varies with the period selected, the contractual cash flows have been calculated assuming the Group selects the shortestavailable interest calculation periods. Where the holder of an instrument has a choice of when to redeem, the amounts in the above tables are on theassumption the holder redeems at the earliest opportunity. In the case of bank loans, which are drawn under revolving facilities, the contracted cashflows in respect of interest up to and including the next rollover date are shown.
78189_STC_Back FINAL_78189_StCchV13_BACK 05/07/2011 11:47 Page 88

Stagecoach Group plc | page 89
Note 27 Financial instruments (continued)
(d) Accounting policies
The Group’s significant accounting policies and measurement bases in respect of financial instruments are disclosed in note 1.
(e) Reclassification of financial assetsThere have been no reclassifications of financial assets between (1) those measured at cost or amortised cost and (2) those measured at fair valueduring the year ended 30 April 2011 (2010: None).
(f) CollateralIncluded within the cash and cash equivalents balance of £358.3m as at 30 April 2011 (2010: £375.7m) are £20.3m (2010: £65.8m) of cash balancesthat have been pledged as collateral for liabilities as follows:– £Nil (2010: 40.2m) has been pledged by the Group as collateral for letters of credit issued by the Bank of Scotland as collateral for the Group’s North
American insurance provisions.– £18.9m (2010: £23.8m) has been pledged by the Group as collateral for £18.9m (2010: £23.8m) of loan notes that are classified within current
liabilities: borrowings. The cash is held on deposit at Bank of Scotland. Bank of Scotland has guaranteed the Group’s obligations to the holders ofthe loan notes and to the extent that the Group fails to satisfy its obligations under the loan notes, Bank of Scotland shall use the cash collateral tosatisfy such obligations.
– £1.0m (2010: £1.4m) has been pledged by the Group as collateral for liabilities to the vendors of certain businesses that the Group acquired inNorth America.
– £0.4m (2010: £0.4m) is held in an escrow account in North America in relation to insurance claims.The fair value of the financial assets pledged as collateral is the same as their carrying value as at 30 April 2011 and 30 April 2010.
(g) Compound financial instrumentsThe Group did not hold any compound financial instruments as at 30 April 2011 (2010: £Nil).
(h)Defaults and breachesThe Group has not defaulted on any loans payable during the years ended 30 April 2011 and 30 April 2010 and no loans payable are in default as at30 April 2011 and 30 April 2010. The Group was in compliance with all bank loan covenants as at 30 April 2011 and as at 30 April 2010.
(i) Income, expense, gains and lossesThe following items of income, expense, gains and losses in respect of financial instruments (excluding commodity hedges, trade and other payablesand trade and other receivables) have been recognised in the financial statements.
Financial assets at fair value through profit or loss Nil Nil
Interest income and expenseInterest income for financial assets and financial liabilities that are not at fair value through profit or loss 5.4 10.8Interest expense for financial assets and financial liabilities that are not at fair value through profit or loss (36.0) (58.3)
Available for sale financial assetsLosses recognised directly in equity Nil (0.2)
(30.6) (47.7)
The net finance costs reported in the consolidated income statement includes amounts that arise on non-financial liabilities and excludes amountsrecognised directly in equity and impairment losses on investments. The net loss presented above can be reconciled to the net finance costs reportedin the consolidated income statement as follows:
Reconciliation to net finance costs:Net loss presented above (30.6) (47.7)Unwinding of discount on provisions (3.9) (3.7)Exclude losses recognised directly in equity Nil 0.2
Net finance costs reported in consolidated income statement 6 (34.5) (51.2)
£m £m
2011 2010
Note £m £m
2011 2010
78189_STC_Back FINAL_78189_StCchV13_BACK 05/07/2011 11:47 Page 89

Notes to the consolidated financial statements
page 90 | Stagecoach Group plc
Note 27 Financial instruments (continued)(j) Hedge accountingA summary of the Group’s hedging arrangements is provided in the table below.
Type of hedge Risks hedged by Group Hedging instruments used
Fair value hedges – Interest rate risks – Derivatives (interest rate swaps)Cash flow hedges – Commodity price risk – Derivatives (commodity swaps)
– Interest rate risks – Derivatives (interest rate swaps)Hedges of net investment in foreign operations – Foreign investment risk – Foreign currency borrowings
– Derivatives (foreign currencyforward contracts)
Carrying value and fair value of derivative financial instrumentsDerivative financial instruments are classified on the balance sheet as follows:
Non-current assetsInterest rate derivatives 2.9 1.9Fuel derivative 17.8 3.6
20.7 5.5
Current assetsInterest rate derivatives 2.7 2.8Fuel derivatives 45.2 22.9Foreign currency derivatives 2.9 Nil
50.8 25.7
Current liabilitiesFuel derivatives (0.1) (4.0)
(0.1) (4.0)
Non-current liabilitiesInterest rate derivatives Nil (1.9)Fuel derivatives (0.1) NilForeign currency derivatives Nil (5.4)
(0.1) (7.3)
Total net carrying valueInterest rate derivatives 5.6 2.8Fuel derivatives 62.8 22.5Foreign currency derivatives 2.9 (5.4)
71.3 19.9
The fair value of derivative financial instruments is equal to their carrying value, as shown in the above table.
Embedded derivativesIn accordance with IAS 39, Financial Instruments: Recognition and measurement, all significant contracts to which the Group is a party have beenreviewed for embedded derivatives. There were no embedded derivatives as at 30 April 2011 (2010: None) which were separately accounted for.
£m £m
2011 2010
78189_STC_Back FINAL_78189_StCchV13_BACK 05/07/2011 11:47 Page 90

Stagecoach Group plc | page 91
Note 27 Financial instruments (continued)
(j) Hedge accounting (continued)
Cash flow hedges - fuelAs noted previously, the Group uses a number of fuel derivatives to hedge the different types of fuel used in each of its divisions. The movements in the fair value of fuel derivatives in the year were as follows:
Fuel derivativesFair value at start of year 22.5 (61.1)Changes in fair value during year taken to cash flow hedging reserve 52.6 42.6Cash (received)/paid during the year (12.3) 41.0
Fair value at end of year 62.8 22.5
The fair value of the fuel derivatives split by maturity was as follows:
As at 30 April 2011
Within one year 45.2 (0.1)1 to 2 years 17.0 (0.1)2 to 3 years 0.8 Nil
63.0 (0.2)
As at 30 April 2010
Within one year 22.9 (4.0)1 to 2 years 3.6 Nil
26.5 (4.0)
The fair value of fuel derivatives is further analysed by currency and segment as follows:
As at 30 April 2011Sterling denominated – UK Bus (regional operations) 37.0 277.8Sterling denominated – UK Bus (London) 4.4 7.8Sterling denominated – UK Rail 9.6 88.1US dollar denominated – North America 11.8 79.1
62.8 452.8
As at 30 April 2010Sterling denominated – UK Bus (regional operations) 16.0 240.0Sterling denominated – UK Rail 1.1 47.5US dollar denominated – North America 5.4 79.0
22.5 366.5
Fair value and cash flow hedges - interestAs noted previously, the Group uses a number of interest rate derivatives to hedge its exposure to floating interest rates. In connection with the issueof the Group’s £400m 5.75% Bonds in December 2009, the Group adjusted its interest rate management arrangements. The Group’s cash flow interestrate hedges became ineffective and were cancelled, resulting in a one-off exceptional expense and cash outflow of £20.5m during the year ended 30April 2010. The Group subsequently entered into a number of interest rate fair value hedges which cover periods up to 16 December 2014. The movements in the fair value of interest rate derivatives used as hedging instruments in the year were as follows:
Interest rate derivativesFair value at start of year Nil (21.0) 2.8 NilChanges in fair value during year taken to cash flow hedging reserve Nil (4.3) Nil NilChanges in fair value reflected in carrying value of hedged item Nil Nil 6.1 2.6Cash paid/(received) during the year Nil 25.3 (3.3) 0.2
Fair value at end of year Nil Nil 5.6 2.8
£m £m
2011 2010
£m £m
Assets Liabilities
£m Millions of litres
Fair value Notional quantityof fuel coveredby derivatives
£m £m £m £m
Cash flow hedges Fair value hedges2011 2010 2011 2010
78189_STC_Back FINAL_78189_StCchV13_BACK 05/07/2011 11:47 Page 91

Cash flow hedges Fair value hedgesAssets Liabilities Assets Liabilities
Notes to the consolidated financial statements
page 92 | Stagecoach Group plc
Note 27 Financial instruments (continued)
(j) Hedge accounting (continued)Fair value and cash flow hedges - interest (continued)The fair value of the interest rate derivatives split by maturity was as follows:
As at 30 April 2011Within one year Nil Nil 2.7 Nil1 to 2 years Nil Nil 1.5 Nil2 to 3 years Nil Nil 0.3 Nil3 to 4 years Nil Nil 1.1 Nil4 to 5 years Nil Ni Nil Nil
Nil Nil 5.6 Nil
As at 30 April 2010Within one year Nil Nil 2.8 Nil1 to 2 years Nil Nil 1.3 Nil2 to 3 years Nil Nil Nil (0.4)3 to 4 years Nil Nil Nil (1.5)4 to 5 years Nil Nil 0.6 Nil
Nil Nil 4.7 (1.9)
All of the interest rate derivatives are sterling denominated and are managed and held centrally.
Cash flow hedging reserveThe movements in the cash flow hedging reserve were as follows:
Cash flow hedging reserve at 1 May 2009 (14.8) (37.4) (52.2)Changes in fair value during the year taken to cash flow hedging reserve (4.3) 42.6 38.3Cash flow hedges reclassified and reported in profit for year 24.8 37.0 61.8Tax effect of cash flow hedges (5.7) (22.3) (28.0)
Cash flow hedging reserve at 30 April 2010 Nil 19.9 19.9Changes in fair value during the year taken to cash flow hedging reserve Nil 52.6 52.6Cash flow hedges reclassified and reported in profit for year Nil (21.8) (21.8)Tax effect of cash flow hedges Nil (7.4) (7.4)
Cash flow hedging reserve at 30 April 2011 Nil 43.3 43.3
Cash flow hedging reserve before tax Nil 58.4 58.4Tax to be charged to income statement in future periods Nil (15.1) (15.1)
Cash flow hedging reserve after tax Nil 43.3 43.3
During the year ended 30 April 2010, forecast interest payments for which hedge accounting had previously been applied were no longer expected tooccur because floating-rate bank loans were repaid following the issue of a fixed-rate corporate bond. As a result, certain interest rate derivativesceased to be effective hedging instruments and £20.5m of pre-tax losses previously deferred in the cash flow hedging reserve were immediatelyreclassified and reported in profit as an exceptional item (see note 4).There have been no other instances during the year ending 30 April 2011 (2010: None) from a Group perspective where a forecast transaction forwhich hedge accounting had previously been used was no longer expected to occur.
Hedge of overseas net investments Changes in the Group’s hedging of overseas net investments during the year ended 30 April 2011 are explained on page 81.
The movements in the fair value of the foreign currency derivative contracts used as a hedging instrument in the year were as follows:
£m £m £m
£m £m
2011 2010
Interest rate Fuelderivatives derivatives Total
Foreign currency derivativesFair value at start of year (5.4) 3.1Changes in fair value during the year 8.3 (5.4)Cash received during the year Nil (3.1)
Fair value at end of year 2.9 (5.4)
£m £m £m £m
78189_STC_Back FINAL_78189_StCchV13_BACK 05/07/2011 11:47 Page 92

Stagecoach Group plc | page 93
Note 27 Financial instruments (continued)
(j) Hedge accounting (continued)
Hedge of overseas net investments (continued)
The fair value of the foreign currency derivatives split by maturity was as follows:
As at 30 April 2011Within one year 2.9 Nil
As at 30 April 20101 to 2 years Nil (5.4)
£m £m
Assets Liabilities
Note 28 Share capitalUnder the Companies Act 2006, companies are no longer required to have an authorised share capital and a resolution was passed at the 2010 AnnualGeneral Meeting to take advantage of this deregulating measure. Therefore, the Company no longer has an authorised share capital. The allotted,called-up and fully paid ordinary share capital was:
Allotted, called-up and fully-paid ordinary shares of 56/57 pence eachAt beginning of year 720,066,186 7.1 719,478,434 7.1Allotted to employees and former employeesunder share option schemes 58,764 – 587,752 –
At end of year 720,124,950 7.1 720,066,186 7.1
The balance on the share capital account shown above represents the aggregate nominal value of all ordinary shares in issue.The Group operates two Employee Share Ownership Trusts: the Stagecoach Group Qualifying Employee Share Ownership Trust (“QUEST”) and theStagecoach Group Employee Benefit Trust (“EBT”). Shares held by these trusts are treated as a deduction from equity in the Group’s financialstatements. Other assets and liabilities of the trusts are consolidated in the Group’s financial statements as if they were assets and liabilities of theGroup. As at 30 April 2011, the QUEST held 333,372 (2010: 333,372) ordinary shares in the Company and the EBT held 1,854,213 (2010: 2,003,075)ordinary shares in the Company. The trusts have waived dividends on the shares they hold.The Group had 4,087,302 (2010: 5,187,055) redeemable ‘B’ shares of 63 pence each at 30 April 2011. The Group had the right to redeem all of theremaining ‘B’ shares at any time and redeemed the remaining shares on 31 May 2011.
The ‘B’ shares that remained in issue are classified as liabilities and the dividends payable on such shares are classified in the consolidated incomestatement within finance costs.
2011 2010
No. of shares £m No. of shares £m
78189_STC_Back FINAL_78189_StCchV13_BACK 05/07/2011 11:47 Page 93

Notes to the consolidated financial statements
page 94 | Stagecoach Group plc
Note 29 Share based payments
The Group operates an Executive Share Option Scheme, a Save as You Earn Scheme (“SAYE”), a Long Term Incentive Plan (“LTIP”) and an ExecutiveParticipation Plan (“EPP”). The Directors’ remuneration report on pages 32 to 38 gives further details of each of these arrangements.
As disclosed in note 7, share based payment charges of £7.2m (2010: £8.9m) have been recognised in the income statement during the year in relationto the above schemes.
Grant date
Share price at grant/award date (£) 1.1150 0.8575 0.8075 3.2750 1.8075 2.8000 1.6070 2.1160 2.0785
Exercise price (£) 1.1150 0.8575 0.8075 2.5178 n/a n/a n/a n/a n/a
Number of employees holdingoptions/units at 30 April 2011 7 Nil Nil 4,237 Nil 13 14 14 14
Shares under option/notional units at 30 April 2011 72,824 Nil Nil 6,042,752 Nil 1,030,295 2,779,259 1,185,910 1,085,777
Vesting period (years) 3 3 3 3 3 3 3 3 3
Expected volatility 30% 30% 30% 30% 30% 30% 30% 30% 30%
Option/award life (years) 7 7 7 3.5 3 3 3 3 3
Expected life (years) 4.4 4.4 4.4 3 3 3 3 3 3
Risk free rate 4.75% 4.64% 4.64% 4.43% n/a n/a n/a n/a n/a
Expected dividends expressed as an average annual dividend yield 3.14% 3.38% 3.34% 1.37% 3.15% 2.12% 4.04% 3.89% 3.37%
Expectations of meeting performance criteria 100% 100% 100% 100% ** ** ** ** **
Fair value per option/notional unit at grant date (£) 0.26 0.20 0.19 1.14 0.70 1.08 0.46 0.52 0.60
Bespoke Bespoke Bespoke Bespoke BespokeOption pricing model Black-Scholes Black-Scholes Black-Scholes Black-Scholes simulation simulation simulation simulation simulation
† These options became fully vested during the year to 30 April 2007.ø These options became fully vested during the year to 30 April 2008.*LTIP awards are based on notional units. One notional unit has a value equal to one of the Company’s ordinary shares but subject to performanceconditions. LTIP awards are not share options and are valued using a separate simulation model therefore some of the above disclosures are not applicable.**Reflected in fair value.Expected volatility was determined at the date of grant from historic volatility, adjusted for events that were not considered to be reflective of thevolatility of the share price going forward.
Executive Share Option SchemeThe movements in executive share options during the year were as follows:
12 December 2003 58,764 (58,764) Nil 0.8075 12 December 2006 12 December 201025 June 2004 501,415 (501,415) Nil 0.8575 25 June 2007 25 June 201110 December 2004 178,377 (105,553) 72,824 1.1150 10 December 2007 10 December 2011
738,556 (665,732) 72,824
All options were granted for nil consideration. The mid-market price for the ordinary shares at 30 April 2011 was £2.47 (2010: £1.97). The Company’sordinary shares traded in the range of £1.60 to £2.47 (2010: £1.16 to £1.99) during the year to that date.
As share options are exercised continuously throughout the year, the average share price during the year of £1.97 (2010: £1.57) is consideredrepresentative of the weighted average share price at the date of exercise.
Executive Share Option Scheme SAYE LTIP* LTIP* LTIP* LTIP* LTIP*
December June December October June June December June December2004ø 2004ø 2003† 2008 2007 2008 2009 2010 2010
Award date At 1 May Exercised At 30 April Exercise Date from which Expiry date2010 2011 price £ exercisable
78189_STC_Back FINAL_78189_StCchV13_BACK 05/07/2011 11:47 Page 94

Stagecoach Group plc | page 95
Note 29 Share based payments (continued)
Save as You Earn SchemeOne issue from the SAYE scheme was in operation during the year as follows:
E 1 September 2008 1 October 2008 10251.775p 1 October 2011 31 March 2012
The changes in the number of participating employees and options over ordinary shares were as follows:
Beginning of year 349 909,097 4,841 6,828,996Expired (53) (92,619) (35) (61,960)Cancelled (53) (92,619) (495) (626,799)Forfeited (53) (92,619) (74) (97,485)
End of year Nil Nil 4,237 6,042,752
Long Term Incentive PlanUnder the LTIP, executives are awarded notional units with a value equal to one of the Company’s ordinary shares but subject to the same performanceconditions disclosed in the Directors’ remuneration report on pages 36 and 37. The movements in the LTIP during the year to 30 April 2011 were as follows:
28 June 2007 105,424 Nil Nil (105,424) Nil 0.6991 Nil Nil 31 Mar 2010 &28 June 2010*
30 June 2008 1,019,802 Nil 10,493 Nil 1,030,295 1.0830 1.2345 158 30 June 201110 Dec 2009 2,750,946 Nil 28,313 Nil 2,779,259 0.4619 1.2689 63 10 Dec 201228 June 2010 Nil 1,173,833 12,077 Nil 1,185,910 0.5186 0.7097 133 28 Jun 20139 Dec 2010 Nil 1,074,718 11,059 Nil 1,085,777 0.5988 0.9412 99 9 Dec 2013
3,876,172 2,248,551 61,942 (105,424) 6,081,241
* The LTIP awards granted on 28 June 2007 would in the normal course of events have vested on 28 June 2010. As noted in the Directors’remuneration report included in the 2010 Annual Report, the Remuneration Committee considered it appropriate to bring forward the vesting date ofthe award to 31 March 2010 for Executive directors and certain others so as to permit vesting within the 2009/10 tax year. The awards were re-testedon the original due vesting date to consider whether vesting on 28 June 2010 would have delivered a lower or different amount and it was found thatthe earlier vesting had resulted in an understatement of the award level and unit price. Adjusting payments were made to reflect vesting of 100% ofthe available units at a unit price of £1.903 to reflect actual performance over the original performance period.† TSR ranking is based on the Group’s TSR ranking in the FTSE 250 whereby 1 is top and 250 is bottom of the comparator group. The TSR ranking iscalculated by independent advisors.
Executive Participation PlanUnder the EPP, executives and senior managers sacrifice part of their actual annual cash bonus and are awarded deferred shares with an initial marketvalue approximately equal to the amount of bonus foregone. The movements in EPP notional units during the year were as follows:
28 June 2007 476,110 Nil (476,110) Nil Nil Nil 8 Mar 2010 1,775,639 1.8075& 28 June 2010*
26 June 2008 909,278 Nil (16,343) (14,997) 9,218 887,156 26 June 2011 2,411,107 2.682529 June 2009 1,524,721 Nil Nil (83,330) 15,059 1,456,450 29 June 2012 1,819,440 1.270010 Dec 2009 1,009,627 Nil Nil Nil 10,633 1,020,260 10 Dec 2012 1,538,943 1.606028 June 2010 Nil 917,657 (8,310) (13,199) 9,408 905,556 28 June 2013 1,780,805 1.9020
3,919,736 917,657 (500,763) (111,526) 44,318 4,269,422
* The awards granted on 28 June 2007 would in the normal course of events have vested on 28 June 2010. In light of the approach adopted for the2008/09 bonus award to Executive Directors and senior managers, which was awarded wholly in deferred shares under the EPP, the RemunerationCommittee considered it appropriate to bring forward the vesting date of the 2007 EPP Award to permit vesting within the 2009/10 tax year for thoseaffected individuals, subject to the requirement to retain a number of released EPP shares to the original due vesting date (28 June 2010). The closingshare price on the vesting date of 8 March 2010 was £1.7820.
Issue Option grant date Savings contract start date Exercise price Date from which exercisable Expiry date
Issue D Issue E
Number of Ordinary Number of Ordinaryemployees shares under option employees shares under option
Outstanding Awards granted Dividends Vested Outstanding Fair value per LTIP Fair value per LTIP TSR ranking at start of year in year in year in year at end of year unit at grant date unit at 30 April 2011 at Vesting date
Award date (notional units) (notional units) (notional units) (notional units) (notional units) £ £ 30 April 2011†
Outstanding Awards granted Exercised Lapsed Dividends Outstanding Expected total Closingat start of year in year in year in year in year at end of year value of award at share price on
Award date (notional units) (notional units) (notional units) (notional units) (notional units) (notional units) Vesting date time of grant date of grant£ £
78189_STC_Back FINAL_78189_StCchV13_BACK 05/07/2011 11:47 Page 95

Notes to the consolidated financial statements
page 96 | Stagecoach Group plc
Note 30 Reserves
A reconciliation of the movements in each reserve is shown in the Consolidated statement of changes in equity on page 44.
The balance of the share premium account represents the amounts received in excess of the nominal value of the ordinary shares offset by issue costs,bonus issues of shares and any transfer between reserves.The balance held in the retained earnings reserve is the accumulated retained profits of the Group. Cumulative goodwill of £113.8m (2010: £113.8m)has been written off against reserves in periods prior to 1 May 1998 in accordance with the UK accounting standards then in force and such goodwill willremain eliminated against reserves.The capital redemption reserve represents the cumulative par value of all shares bought back and cancelled.Details of own shares held are given in note 28. The own shares reserve represents the cumulative cost of shares in Stagecoach Group plc purchased inthe market and held by the Group’s two Employee Share Ownership Trusts offset by cumulative sales proceeds.The translation reserve is used to record exchange differences arising from the translations of the financial statements of foreign operations. It is alsoused to record the effect of hedging net investments in foreign operations.The cash flow hedging reserve records the portion of the gain or loss on a hedging instrument in a cash flow hedge that is determined to be an effectivehedge. The cumulative gain or loss is recycled to the income statement to match the recognition of the hedged item through the income statement.
Note 31 Consolidated cash flows
(a) Reconciliation of operating profit to cash generated by operations
The operating profit of Group companies reconciles to cash generated by operations as follows:
Operating profit of Group companies 190.6 156.2Depreciation 90.3 77.2Loss on disposal of plant and equipment 0.9 2.0Intangible asset expenses 10.1 6.0Impairment of plant and equipment Nil 14.7Equity-settled share based payment expense 4.7 6.3
Operating cashflows before working capital movements 296.6 262.4Increase in inventories (2.1) (1.9)(Increase)/decrease in receivables (13.4) 0.5Decrease in payables (4.4) (7.4)Decrease in provisions (2.8) (1.9)Differences between employer pension contributions and amounts recognised in the incomestatement (20.4) (17.2)
Cash generated by operations 253.5 234.5
(b) Proceeds from sale of property, plant and equipment
In the cash flow statement, proceeds from sale of property, plant and equipment comprise:
Net book values 16.5 58.7Loss on disposal of plant and equipment (0.9) (2.0)(Loss)/gain on disposal of properties (0.1) 4.3Value of property, plant and equipment traded in (0.8) (3.0)Movement in receivables and deposits for proceeds from sale of property, plant and equipment Nil (5.0)
Proceeds from sale of property, plant and equipment 14.7 53.0
£m £m
2011 2010
£m £m
2011 2010
78189_STC_Back FINAL_78189_StCchV13_BACK 05/07/2011 11:47 Page 96

Stagecoach Group plc | page 97
Note 31 Consolidated cash flows (continued)
(c) Reconciliation of net cash flow to movement in net debtThe (decrease)/increase in cash reconciles to the movement in net debt as follows:
(Decrease)/increase in cash (16.1) 99.3Cash inflow from movement in borrowings 29.9 3.9
13.8 103.2New hire purchase and finance leases (8.1) (65.7)Debt of acquired subsidiaries Nil (0.4)Foreign exchange movements 10.8 7.1Other movements (0.7) (0.8)
Decrease in net debt 15.8 43.4Opening net debt (as defined in note 36) (296.7) (340.1)
Closing net debt (as defined in note 36) (280.9) (296.7)
(d) Analysis of net debtFor the purpose of this note, net debt is as defined in note 36. The analysis below further shows the other items classified as net borrowings in theconsolidated balance sheet.
Cash 309.9 29.4 Nil (1.3) Nil 338.0Cash collateral 65.8 (45.5) Nil Nil Nil 20.3Hire purchase and finance leaseobligations (240.5) 24.1 (8.1) 3.8 Nil (220.7)Bank loans and loan stock (26.2) 5.1 Nil Nil Nil (21.1) Bonds (402.4) Nil Nil 8.3 (0.7) (394.8)Preference shares (3.3) 0.7 Nil Nil Nil (2.6)
Net debt (296.7) 13.8 (8.1) 10.8 (0.7) (280.9) Accrued interest on bonds and preference shares (8.6) 23.0 Nil Nil (23.0) (8.6)Effect of fair value hedges on carrying value of borrowings (1.3) Nil Nil Nil (2.6) (3.9)Foreign exchange derivatives not included inborrowings in balance sheet 5.4 Nil Nil (8.3) Nil (2.9)
Net borrowings (IFRS) (301.2) 36.8 (8.1) 2.5 (26.3) (296.3)
The cash amounts shown above include term deposits as explained in note 21.
(e) Restricted cashThe cash collateral balance as at 30 April 2011 of £20.3m (2010: £65.8m) comprises balances held in respect of insurance letters of credit of £Nil(2010: £40.2m), balances held in trust in respect of loan notes of £18.9m (2010: £23.8m) and North America restricted cash balances of £1.4m (2010:£1.8m). In addition, cash includes train operating company cash of £163.1m (2010: £182.8m). Under the terms of the franchise agreements, trainoperating companies can only lend or distribute cash out of retained earnings, and only to the extent they do not breach franchise liquidity ratios.
(f) Non cash transactionsThe principal non cash transactions were the acquisition of property, plant and equipment using new hire purchase and finance leases.During the year, the Group entered into hire purchase and finance lease arrangements in respect of new assets with a total capital value at inception ofthe contracts of £8.9m (2010: £72.4m). After taking account of deposits paid up front and other financing transactions of £Nil (2010: £3.6m) new hirepurchase and finance lease liabilities of £8.1m (2010: £69.3m) were recognised.
New hire Foreignpurchase/ exchange Other
Opening Cashflows finance leases movements movements Closing
£m £m £m £m £m £m
£m £m
2011 2010
78189_STC_Back FINAL_78189_StCchV13_BACK 05/07/2011 11:47 Page 97

Notes to the consolidated financial statements
page 98 | Stagecoach Group plc
Note 32 Contingencies
Contingent liabilities(i) At 30 April 2011, the following bonds and guarantees were in place relating to the Group’s rail operations:
Performance bonds backed by bank facilities– Stagecoach South Western Trains 53.3 59.9– East Midlands Trains 17.5 20.8
Season ticket bonds backed by bank facilities and/or insurance arrangements– Stagecoach South Western Trains 46.8 45.2– East Midlands Trains 5.0 5.0
Intercompany loan facilities and guarantees– Stagecoach South Western Trains 25.0 25.0– East Midlands Trains 55.0 35.0
These contingent liabilities are not expected to crystallise, except that the intercompany loan facilities will be used from time to time but eliminate onconsolidation.
(ii) The Group and its joint venture, Virgin Rail Group Holdings Limited, have, in the normal course of business, entered into a number of long-termsupply contracts. The most significant of these relate to track, station and depot access facilities, together with new train lease and maintenancearrangements.
(iii) Under UK Rail franchise agreements, the Group and its joint venture, Virgin Rail Group Holdings Limited, have agreed with the DfT annual amountsreceivable or payable in respect of the operation of rail franchises for future periods. Under these agreements, there is a requirement to comply with anumber of obligations. Failure to comply with these obligations would be a breach of the relevant franchise.
The Group assessed whether a provision for onerous contracts is required in respect of its rail franchises. The Group has discounted the expectedfuture cash flows related to its rail franchises to determine whether it is probable that the benefits to be derived by the Group from the franchises willbe lower than the unavoidable costs of meeting its obligations under the franchises. Estimates of cash flows are consistent with management’s plansand forecasts. The Group has determined that no provision is necessary. The estimation of future cash flows and the discount rate involves asignificant degree of judgment. Actual results can differ from those assumed and there can be no absolute assurance that the assumptions used willhold true.
Under certain circumstances following a breach by the Group of one or more of its rail franchise agreements, the DfT has the right to terminate all ofthe franchises operated by the Group. Where the Group has defaulted on one franchise, the DfT has cross-default rights that might enable it (but notrequire it) to terminate all of the franchises. The financial effect on the Group of a termination of one or more franchises would depend on which, ifany, of the Group’s contingent liabilities that the DfT sought to call. As at 30 April 2011, the capital at risk of the Group in this respect was:
Actual liabilitiesNet intra-group amounts payable to train operators 49.3 Nil 49.3
Contingent liabilitiesSeason ticket bonds 46.8 5.0 51.8Performance bonds 53.3 17.5 70.8Parent company guarantees to suppliers Nil 9.5 9.5Undrawn committed loan facilities 25.0 20.0 45.0
Capital at risk as at 30 April 2011 174.4 52.0 226.4
CashCash in train operating companies 116.9 46.2 163.1
Pro forma impact on net debt 291.3 98.2 389.5
We consider the likelihood of the contingent liabilities crystallising as being low. However, if all of the contingent liabilities had crystallised at 30 April2011, the Group would have needed to have financed £226.4m (2010: £247.2m) and its gross debt would have increased by this amount. Inaddition, the cash in the train operating companies would be transferred with the franchises and therefore the net debt of the Group would haveincreased by £389.5m (2010: £430.0m).
There is no recourse to the Group in respect of any liabilities or contingent liabilities of Virgin Rail Group.
(iv) The Group and the Company are from time to time party to legal actions arising in the ordinary course of business. Liabilities have been recognisedin the financial statements for the best estimate of the expenditure required to settle obligations arising under such legal actions. As at 30 April 2011,the accruals in the consolidated financial statements for such claims total £2.0m (2010: £5.4m). In addition, certain of the claims intended to becovered by the insurance provisions (see note 25) are subject to or might become subject to litigation against the Group and/or the Company.
£m £m
2011 2010
£m £m £m
South Western East MidlandsTrains Trains Total
78189_STC_Back FINAL_78189_StCchV13_BACK 05/07/2011 11:47 Page 98

Stagecoach Group plc | page 99
Note 33 Guarantees and other financial commitments
(a) Capital commitmentsCapital commitments were as follows:
Contracted for but not providedFor delivery in one year 119.8 11.1
(b) Operating lease commitmentsThe following were the future minimum contractual lease payments due under unexpired operating leases as at 30 April 2011:
Lease payments due in respect of:Year ending 30 April 2012 11.6 7.8 134.0 3.5 156.9Year ending 30 April 2013 10.3 7.4 124.6 2.0 144.3Year ending 30 April 2014 8.3 6.2 85.2 0.3 100.0Year ending 30 April 2015 4.3 1.9 Nil 0.1 6.3Year ending 30 April 2016 3.8 0.2 Nil Nil 4.01 May 2016 and thereafter 27.2 Nil Nil 0.6 27.8
65.5 23.5 343.8 6.5 439.3
All operating lease commitments associated with UK Rail franchises are assumed to terminate in line with the expected franchise end. The franchise-end for the purpose of determining the commitments is the earlier date of which each franchise could end if the Group failed to meet specifiedperformance targets.
The amounts shown above do not include Network Rail charges, which are shown separately in note 33(c).
The following were the future minimum contractual lease payments due under unexpired operating leases as at 30 April 2010:
Lease payments due in respect of:Year ending 30 April 2011 9.5 6.2 128.5 5.1 149.3Year ending 30 April 2012 8.1 5.5 131.1 4.1 148.8Year ending 30 April 2013 7.4 3.9 133.6 2.4 147.3Year ending 30 April 2014 5.7 3.7 96.8 0.2 106.4Year ending 30 April 2015 2.7 3.0 Nil Nil 5.71 May 2015 and thereafter 20.1 0.8 Nil Nil 20.9
53.5 23.1 490.0 11.8 578.4
(c) Network Rail chargesThe Group’s UK Rail franchises have contracts with Network Rail for access to the railway infrastructure (track, stations and depots) until the expectedend of the franchises. Commitments for payments under these contracts as at 30 April 2011 are as shown below.
Lease payments due in respect of:Year ending 30 April 2012 140.7Year ending 30 April 2013 125.2Year ending 30 April 2014 100.9
366.8
£m £m
2011 2010
As at 30 April 2011 Buses & otherLand & road transportation Trains & Plant &buildings equipment rolling stock machinery Total
£m £m £m £m £m
£m
2011
As at 30 April 2010 Buses & otherLand & road transportation Trains & Plant &buildings equipment rolling stock machinery Total
£m £m £m £m £m
78189_STC_Back FINAL_78189_StCchV13_BACK 05/07/2011 11:47 Page 99

Notes to the consolidated financial statements
page 100 | Stagecoach Group plc
Note 33 Guarantees and other financial commitments (continued)
(c) Network Rail charges (continued)Commitments for payments under these contracts as at 30 April 2010 were as follows:
Lease payments due in respect of:Year ending 30 April 2011 149.1Year ending 30 April 2012 144.2Year ending 30 April 2013 148.7Year ending 30 April 2014 136.7
578.7
(d) Joint venturesOur share of commitments and contingent liabilities in joint ventures shown below are based on the latest statutory financial statements of therelevant companies:
Annual commitments under non-cancellable operating leases 48.1 47.6Franchise performance bonds 10.3 10.3Season ticket bonds 2.1 1.9
The arrangements pursuant to which a performance bond is issued in respect of Virgin Rail Group Holdings Limited, a joint venture, requires that theconsolidated net assets (under UK GAAP and applying its own accounting policies) of Virgin Rail Group Holdings Limited are no less than £22.5m(2010: £22.5m). This could restrict Virgin Rail Group Holding‘s ability to make distributions to the Group.
Note 34 Related party transactions
Details of major related party transactions during the year ended 30 April 2011 are provided below, except for those relating to the remuneration of theDirectors and management.
(i) Virgin Rail Group Holdings Limited - Non-Executive DirectorsTwo of the Group’s managers are non-executive directors of Virgin Rail Group Holdings Limited. During the year ended 30 April 2011, the Group earnedfees of £60,000 (2010: £60,000) from Virgin Rail Group Holdings Limited in this regard.
(ii) West Coast Trains LimitedWest Coast Trains Limited is a subsidiary of Virgin Rail Group. For the year ended 30 April 2011, East Midlands Trains had purchases totalling £0.3m(2010: £0.8m) and sales totalling £Nil (2010: £0.5m) from/to West Coast Trains Limited. East Midlands Trains has a payable of £Nil (2010: £27,000)owed to West Coast Trains Limited as at 30 April 2011.
(iii) Noble Grossart LimitedEwan Brown (Non-Executive Director) is a former executive director and current non-executive director of Noble Grossart Limited that providedadvisory services to the Group. Total fees payable to Noble Grossart Limited in respect of the year ended 30 April 2011 amounted to £Nil (2010:£13,333). At 30 April 2011, Noble Grossart Investments Limited, a subsidiary of Noble Grossart Limited, held 4,084,999 (2010: 4,084,999) ordinaryshares in the Company, representing 0.6% (2010: 0.6%) of the Company’s issued ordinary share capital.
(iv) Alexander Dennis LimitedSir Brian Souter (Chief Executive) and Ann Gloag (Non-Executive Director) collectively hold 37.9% (2010: 37.9%) of the shares and voting rights inAlexander Dennis Limited. Noble Grossart Investments Limited (see (iii) above) controls a further 28.4% (2010: 28.4%) of the shares and voting rightsof Alexander Dennis Limited. None of Sir Brian Souter, Ann Gloag or Ewan Brown is a director of Alexander Dennis Limited nor do they have anyinvolvement in the management of Alexander Dennis Limited. Furthermore, they do not participate in deciding on and negotiating the terms andconditions of transactions between the Group and Alexander Dennis Limited.
For the year ended 30 April 2011, the Group purchased £87.1m (2010: £48.9m) of vehicles from Alexander Dennis Limited and £5.7m (2010: £3.4m)of spare parts and other services. As at 30 April 2011, the Group had £1.3m (2010: £0.4m) payable to Alexander Dennis Limited.
(v) Pension SchemesDetails of contributions made to pension schemes are contained in note 26 to the consolidated financial statements.
£m £m
2011 2010
£m
2010
78189_STC_Back FINAL_78189_StCchV13_BACK 05/07/2011 11:47 Page 100

Stagecoach Group plc | page 101
Note 34 Related party transactions (continued)
(vi) Robert Walters plcMartin Griffiths (Finance Director) is a non-executive director and Senior Independent Director of Robert Walters plc and received remuneration of£58,927 (2010: £56,120) in respect of his services for the year ended 30 April 2011. Martin Griffiths holds 20,000 (2010: 20,000) shares in Robert Waltersplc which represents 0.03% (2010: 0.03%) of the issued share capital. During the year ended 30 April 2011, the Group paid Robert Walters plc £5,286(2010: £Nil) for recruitment services.
(vii) Troy Income & Growth Trust plcMartin Griffiths (Finance Director) became a non-executive director of Troy Income & Growth Trust plc (formerly Glasgow Income Trust plc) on8 November 2007 and resigned from the role on 31 August 2010. He received £5,833 (2010: £14,000) in respect of his services for the year ended 30April 2011.
(viii) AG Barr plcMartin Griffiths became a non-executive director of AG Barr plc on 1 September 2010 and received remuneration of £25,125 (2010: £Nil) in respect ofhis services for the period ended 30 April 2011. Martin Griffiths holds 1,800 shares in AG Barr plc which represents less than 0.1% of the issued sharecapital.
(ix) Loan to New York Splash Tours LLCA net interest bearing long-term loan of £2.8m (2010: £3.1m) was outstanding from a joint venture, New York Splash Tours LLC, as at 30 April 2011.
(x) Scottish Citylink Coaches LimitedA non interest bearing loan of £1.7m (2010: £1.7m) was due to Scottish Citylink Coaches Limited as at 30 April 2011. The Group received £16.0m (2010:£14.9m) in the year ended 30 April 2011 in respect of the operation of services subcontracted by Scottish Citylink Coaches Limited. As at 30 April 2011,the Group had a net £1.6m (2010: £3.6m) receivable from Scottish Citylink Coaches Limited, excluding the loan referred to above.
(xi) Argent Energy Group LimitedSir Brian Souter (Chief Executive) and Ann Gloag (Non-Executive Director) collectively hold 39.3% (2010: 39.3%) of the shares and voting rights in ArgentEnergy Group Limited. Neither Sir Brian Souter nor Ann Gloag is a director of Argent Energy Group Limited nor do they have any involvement in themanagement of Argent Energy Group. Furthermore, they do not participate in deciding on and negotiating the terms and conditions of transactionsbetween the Group and Argent Energy Group. For the year ended 30 April 2011, the Group purchased £2.0m (2010: £0.4m) of biofuel from Argent Energy Group. As at 30 April 2011, the Group had£0.2m (2010: £Nil) payable to Argent Energy Group.
Note 35 Post balance sheet events
All of the remaining 4,087,302 redeemable ‘B’ preference shares were redeemed on 31 May 2011.
Note 36 Definitions
• Adjusted earnings per share is calculated by dividing profit after taxation excluding intangible asset expenses and exceptional items by the basicweighted average number of shares in issue in the period.
• Like-for-like amounts are derived, on a constant currency basis, by comparing the relevant year-to-date amount with the equivalent prior yearperiod for those businesses and individual operating units that have been part of the Group throughout both periods.
• Operating profit or loss for a particular business unit or division within the Group refers to profit or loss before net finance income/charges,taxation, intangible asset expenses, exceptional items and restructuring costs.
• Operating margin for a particular business unit or division within the Group means operating profit or loss as a percentage of revenue.
• Exceptional itemsmeans items which individually or, if of a similar type, in aggregate need to be disclosed by virtue of their nature, size orincidence in order to allow a proper understanding of the underlying financial performance of the Group.
• Gross debt is borrowings as reported on the consolidated balance sheet, adjusted to exclude accrued interest and the effect of fair value hedgeson the carrying value of borrowings, and to include the effect of foreign exchange derivatives that synthetically convert an element of borrowingsfrom one currency to another.
• Net debt (or net funds) is the net of cash and gross debt.
78189_STC_Back FINAL_78189_StCchV13_BACK 05/07/2011 11:47 Page 101

page 102 | Stagecoach Group plc
We have audited the parent company financial statements of StagecoachGroup plc for the year ended 30 April 2011 which comprise the Companybalance sheet and the related notes. The financial reporting framework thathas been applied in their preparation is applicable law and United KingdomAccounting Standards (United Kingdom Generally Accepted AccountingPractice).
Respective responsibilities of directors andauditorsAs explained more fully in the Statement of Directors’ responsibilities inrespect of the Annual Report, the Directors’ remuneration report and thefinancial statements set out on page 21, the Directors are responsible for thepreparation of the parent company financial statements and for beingsatisfied that they give a true and fair view. Our responsibility is to audit andexpress an opinion on the parent company financial statements inaccordance with applicable law and International Standards on Auditing (UKand Ireland). Those standards require us to comply with the AuditingPractices Board’s Ethical Standards for Auditors.
This report, including the opinions, has been prepared for and only for theCompany’s members as a body in accordance with Chapter 3 of Part 16 of theCompanies Act 2006 and for no other purpose. We do not, in giving theseopinions, accept or assume responsibility for any other purpose or to anyother person to whom this report is shown or into whose hands it may comesave where expressly agreed by our prior consent in writing.
Scope of the audit of the financial statementsAn audit involves obtaining evidence about the amounts and disclosures inthe financial statements sufficient to give reasonable assurance that thefinancial statements are free from material misstatement, whether caused byfraud or error. This includes an assessment of: whether the accountingpolicies are appropriate to the parent company’s circumstances and havebeen consistently applied and adequately disclosed; the reasonableness ofsignificant accounting estimates made by the Directors; and the overallpresentation of the financial statements. In addition, we read all the financialand non-financial information in the Annual Report to identify materialinconsistencies with the audited financial statements. If we become aware ofany apparent material misstatements or inconsistencies we consider theimplications for our report.
Opinion on financial statements In our opinion the parent company financial statements:
• give a true and fair view of the state of the Company’s affairs as at 30 April2011;
• have been properly prepared in accordance with United Kingdom GenerallyAccepted Accounting Practice; and
• have been prepared in accordance with the requirements of theCompanies Act 2006.
Opinion on other matters prescribed by theCompanies Act 2006 In our opinion:
• the part of the Directors’ remuneration report to be audited has beenproperly prepared in accordance with the Companies Act 2006; and
• the information given in the Directors’ report for the financial year forwhich the parent company financial statements are prepared is consistentwith the parent company financial statements.
Matters on which we are required to report byexception We have nothing to report in respect of the following matters where theCompanies Act 2006 requires us to report to you if, in our opinion:
• adequate accounting records have not been kept by the parent company,or returns adequate for our audit have not been received from branchesnot visited by us; or
• the parent company financial statements and the part of the Directors’remuneration report to be audited are not in agreement with theaccounting records and returns; or
• certain disclosures of directors’ remuneration specified by law are notmade; or
• we have not received all the information and explanations we require forour audit.
Other matter We have reported separately on page 40 on the consolidated financialstatements of Stagecoach Group plc for the year ended 30 April 2011.
Michael Timar (Senior Statutory Auditor)for and on behalf of PricewaterhouseCoopers LLPChartered Accountants and Statutory AuditorsGlasgow
29 June 2011
Independent auditors’ report to the members of Stagecoach Group plc (Company No. SC100764)
78189_STC_Back FINAL_78189_StCchV13_BACK 05/07/2011 11:47 Page 102

Stagecoach Group plc | page 103
Company balance sheetAs at 30 April 2011Prepared using UK Generally Accepted Accounting Practice (UK GAAP)
Fixed assetsTangible assets 2 0.1 0.1Derivative financial instruments at fair value – due after more than one year 7 2.9 1.9Investments 3 1,022.8 978.5
1,025.8 980.5
Current assetsDebtors – due within one year 4 662.8 699.9Deferred tax asset 5 0.2 0.4Derivative financial instruments at fair value – due within one year 7 2.7 2.8Cash 181.9 101.8
847.6 804.9
Creditors: Amounts falling due within one yearTrade and other creditors 6 (572.8) (562.5)Redeemable ‘B’ preference shares (2.6) (3.3)
(575.4) (565.8)
Net current assets 272.2 239.1
Total assets less current liabilities 1,298.0 1,219.6Creditors: Amounts falling due after more than one yearOther creditors 6 (409.4) (406.1)Derivative financial instruments at fair value 7 Nil (1.9)
Net assets excluding pension liability 888.6 811.6Pension liability, net of deferred tax 8 (2.0) (2.3)
Net assets including pension liability 886.6 809.3
Capital and reservesCalled-up share capital 9 7.1 7.1Share premium account 10 9.8 9.8Profit and loss account 10 468.0 390.1Capital redemption reserve 10 416.3 415.6Own shares 10 (14.6) (13.3)
Shareholders’ funds 886.6 809.3
These financial statements were approved for issue by the Board of Directors on 29 June 2011. The accompanying notes form an integral part of thisbalance sheet.
Sir Brian Souter Martin A GriffithsChief Executive Finance Director
Notes £m £m
2011 2010
78189_STC_Back FINAL_78189_StCchV13_BACK 05/07/2011 11:47 Page 103

page 104 | Stagecoach Group plc
Note 1 UK GAAP accounting policies
The separate financial statements of the Company are presented as required by the Companies Act 2006. As permitted by that Act, the separatefinancial statements have been prepared in accordance with UK GAAP.
• Basis of accountingThe financial statements have been prepared under the historical cost convention, except for the revaluation of certain financial instruments, and inaccordance with applicable accounting standards in the United Kingdom.No profit and loss account is presented by the Company as permitted by Section 408 of the Companies Act 2006.The Company is not required to prepare a cash flow statement under Financial Reporting Standard 1 (“FRS 1”) (revised).
• Tangible fixed assetsTangible fixed assets are shown at their original historic cost net of depreciation and any provision for impairment as set out in note 2. Cost includesthe original purchase price of the assets and costs attributable to bringing the asset to its working condition for its intended use.Depreciation is provided at rates calculated to write off the cost less estimated residual value of each asset on a straight-line basis over their estimateduseful lives, as follows:IT and other equipment, furniture and fittings 3 to 10 yearsMotor cars and other vehicles 3 to 5 years The need for any fixed asset impairment write-down is assessed by comparing the carrying value of the asset against the higher of net realisable valueand value in use.
• InvestmentsInvestments in subsidiary undertakings are stated at cost, less provision for impairment.
• TaxationCorporation tax is provided on taxable profit at the current rate applicable. Tax charges and credits are accounted for through the same primarystatement (either the profit and loss account or the statement of total recognised gains and losses) as the related pre-tax item.In accordance with FRS 19, “Deferred Taxation”, full provision is made for deferred tax on a non-discounted basis in respect of all timing differencesexcept those arising from the revaluation of fixed assets where there is no binding sale agreement and undistributed profits of overseas subsidiaries. Deferred tax is calculated at rates at which it is estimated the tax will arise. Deferred tax assets are recognised to the extent they are more likely than notto be recovered.Tax, current and deferred, is calculated using tax rates and laws enacted or substantively enacted at the balance sheet date.
• Foreign currenciesForeign currency transactions arising during the year are translated into sterling at the rate of exchange ruling on the date of the transaction. Foreigncurrency monetary assets and liabilities are retranslated into sterling at the rates of exchange ruling at the year end. Any exchange differences so arisingare dealt with through the profit and loss account.
For the principal rates of exchange used see the Group IFRS accounting policies on page 49.
• Share based paymentThe Company issues equity-settled and cash-settled share based payments to certain employees. Share based payment awards made by the Company to employees of its subsidiary companies are recognised in the Company’s financial statements asan increase in its investments in subsidiary undertakings rather than as an expense in the profit and loss account to the extent that the amount of theexpense recorded by each subsidiary company is less than the amount recharged to it by the Company.
Equity-settled transactionsThe cost of equity-settled transactions with employees is measured by reference to the fair value at the date at which they are granted and isrecognised as an expense (or as an increase in investments in subsidiary undertakings) over the vesting period. In valuing equity-settled transactions,no account is taken of any non-market based vesting conditions and no expense or investment is recognised for awards that do not ultimately vest asa result of a failure to satisfy a non-market based vesting condition. None of the Group’s equity-settled transactions have any market basedperformance conditions.Fair value for equity-settled share based payments is estimated by use of the Black-Scholes pricing model. At each balance sheet date, before vesting, the cumulative expense or investment is calculated based on management’s best estimate of the number ofequity instruments that will ultimately vest taking into consideration the likelihood of achieving non-market based vesting conditions.
Cash-settled transactionsThe cost of cash-settled transactions is measured at fair value. Fair value is estimated initially at the grant date and at each balance sheet datethereafter until the awards are settled. Market based performance conditions are taken into account when determining fair value. Fair value for cash-settled share based payments (being only those that relate to the Long Term Incentive Plan) is estimated by use of a simulation model.During the vesting period, a liability is recognised representing the estimated fair value of the award and the portion of the vesting period expired as atthe balance sheet date.
Choice of settlementThe Company can choose to settle awards under the Long Term Incentive Plan in either cash or equity, although it currently expects to settle all suchawards in cash. Awards under the Long Term Incentive Plan are accounted for as cash–settled transactions (see above).
Notes to the Company financial statements
78189_STC_Back FINAL_78189_StCchV13_BACK 05/07/2011 11:47 Page 104

Stagecoach Group plc | page 105
Note 1 UK GAAP accounting policies (continued)
• DividendsDividends on ordinary shares are recorded in the financial statements in the period in which they are approved by the Company’s shareholders, or in thecase of interim dividends, in the period in which they are paid.
• Financial instrumentsThe accounting policy of the Company under FRS 25 “Financial instruments: Presentation” and FRS 26 “Financial instruments: Recognition andmeasurement” for financial instruments is the same as the accounting policy for the Group under IAS 32 “Financial Instruments: Presentation” and IAS39 “Financial instruments: Recognition and measurement”. Therefore for details of the Company’s accounting policy for financial instruments refer topages 51 to 53.
• Investment in own sharesIn accordance with UITF Abstract 38, “Accounting for ESOP Trusts”, own shares held by the Group’s Employee Benefit Trust and Qualifying EmployeeShare Ownership Trust have been classified as deductions from shareholders’ funds.
• Interest bearing loans and borrowingsBorrowings are recognised initially at the proceeds received, net of transaction costs incurred. Borrowings are subsequently stated at amortised costusing the effective interest rate method; any difference between proceeds (net of transaction costs) and the redemption value is recognised in theprofit and loss account over the period of the borrowings.
Borrowings are classified as current liabilities unless the Company has an unconditional right to defer settlement for at least 12 months after thebalance sheet date.
• PensionsThe Company accounts for pensions and similar benefits under FRS 17 “Retirement Benefits” and measures its obligations due at discounted presentvalue.
Note 2 Tangible fixed assetsThe movements in tangible fixed assets were as follows:
CostAt beginning and end of year 0.7
DepreciationAt beginning and end of year (0.6)
Net book value at beginning and end of year 0.1
Note 3 InvestmentsThe movements in investments were as follows:
CostAt beginning of year 978.5Additions 44.3
At end of year 1,022.8
Amounts written offAt beginning and end of year Nil
Net book value at beginning of year 978.5
Net book value at end of year 1,022.8
£m
Subsidiaryundertakings
£m
78189_STC_Back FINAL_78189_StCchV13_BACK 05/07/2011 11:47 Page 105

page 106 | Stagecoach Group plc
Notes to the Company financial statementsNote 4 Debtors
Amounts falling due within one year were:
Amounts owed by Group undertakings 644.3 687.1Prepayments and accrued income 2.6 0.6Other debtors 15.9 12.2
662.8 699.9
Note 5 Deferred tax asset
The movement in the deferred tax asset during the year was as follows:
At beginning of year 0.4 0.3(Charge)/credit to profit and loss account (0.2) 0.1
At end of year 0.2 0.4
The deferred tax asset recognised can be analysed as follows:
Short-term timing differences 0.2 0.4
Note 6 Creditors
(a) Creditors: Amounts falling due within one year
Bank overdrafts 375.7 360.9Bank loans and loan notes 21.1 26.2Amounts due to Group undertakings 172.5 171.8Accruals and deferred income 3.5 3.6
572.8 562.5
Trade creditors are non-interest bearing and are normally settled on 30 to 45 day terms.
(b) Creditors: Amounts falling due after more than one year
Accruals and deferred income 0.5 0.5Sterling 5.75% Notes 408.9 405.6
409.4 406.1
(c) Borrowings were repayable as follows:
On demand or within 1 yearBank overdraft 375.7 360.9Bank loans and loan notes 21.1 26.2
Repayable after 5 yearsSterling 5.75% Notes 408.9 405.6
Total borrowings 805.7 792.7
£m £m
2011 2010
£m £m
2011 2010
£m £m
2011 2010
£m £m
2011 2010
£m £m
2011 2010
£m £m
2011 2010
78189_STC_Back FINAL_78189_StCchV13_BACK 05/07/2011 11:47 Page 106

Stagecoach Group plc | page 107
Note 7 Financial instrumentsThe fair values of derivative financial instruments, all of which are with counterparties that are subsidiaries of the Company, are set out below:
Current assetsInterest rate swaps – due within one year 2.7 Nil 2.8 NilInterest rate swaps – due after more than one year 2.9 Nil 1.9 Nil
Creditors: amounts falling due after more than one yearInterest rate swaps Nil Nil Nil (1.9)
In accordance with FRS 26, “Financial Instruments: Recognition and measurement” the Company has reviewed all significant contracts for embeddedderivatives that are required to be separately accounted for. None were identified.
The Stagecoach Group plc consolidated financial statements for the year ended 30 April 2011 contain financial instrument disclosures which complywith FRS 25, “Financial Instruments: Disclosure and Presentation”. Consequently, the Company has taken advantage of the exemption in FRS 25 not topresent separate financial instrument disclosures for the Company.
There were no derivatives outstanding at the balance sheet date designated as hedges.
Note 8 Pension liability, net of deferred tax
Unfunded pension liability 2.7 3.0Deferred tax asset (0.7) (0.7)
2.0 2.3
The Company no longer has any employees but has unfunded liabilities in respect of former employees which are shown above. See note 26 to theconsolidated financial statements for more details on retirement benefits.
Note 9 Called up share capital
Information on share capital is provided in note 28 to the consolidated financial statements.
£m £m
2011 2010
2011 2010
Fair value Fair value Fair value Fair valueassets liabilities assets liabilities£m £m £m £m
78189_STC_Back FINAL_78189_StCchV13_BACK 05/07/2011 11:47 Page 107
Notes to the Company financial statements
page 108 | Stagecoach Group plc
Note 10 Share capital and reserves
At 1 May 2010 7.1 9.8 390.1 415.6 (13.3) 809.3Profit for the year Nil Nil 90.0 Nil Nil 90.0Credit in relation to share based payment Nil Nil 4.4 Nil Nil 4.4Dividends Nil Nil (15.8) Nil Nil (15.8)Own shares sold Nil Nil Nil Nil 0.5 0.5Own shares purchased Nil Nil Nil Nil (1.8) (1.8)Preference shares redeemed Nil Nil (0.7) 0.7 Nil Nil
At 30 April 2011 7.1 9.8 468.0 416.3 (14.6) 886.6
As permitted by section 408 of the Companies Act 2006, the Company has not presented its own profit and loss account. The profit as disclosed aboveof £90.0m (2010: profit of £126.0m) is consolidated in the results of the Group.The profit and loss account reserve is distributable but the other components of shareholders’ funds shown above are not distributable.
The remuneration of the Directors is borne by other Group companies and is equal to the amounts shown in note 7 to the consolidated financialstatements.
Note 11 Share based payments
For details of share based payment awards and fair values see note 29 to the consolidated financial statements. The Company accounts for the equity-settled share based payment charge for the year of £4.4m (2010: £6.3m) by recording an increase to its investment in subsidiaries for this amount andrecording a corresponding entry to the profit and loss account reserve to reflect the fact that the Company has no employees (2010: Nil) and all sharebased payment awards are to employees of subsidiary companies. The remuneration of the Directors is borne by other Group companies. TheCompany accounts for the cash-settled share based payment charge for the year of £2.5m (2010: £2.6m) by recording a liability for this amount andrecording a corresponding entry as a charge through the profit and loss account. The cash-settled share based payment charge is recharged in full tosubsidiary companies and the recharge income and related expense are both included in the profit and loss account.
Note 12 Guarantees, other financial commitments and contingent liabilities
(a) The Company has provided guarantees to third parties of £85.7m (2010: £98.6m) in respect of subsidiary companies’ liabilities. The liabilities thatare guaranteed are included in the consolidated balance sheet but are not included in the Company balance sheet.
In addition, the Company has provided guarantees to third parties of £91.7m (2010: £71.8m) in respect of contingent liabilities that are neitherincluded in the consolidated balance sheet nor the Company balance sheet.
The Company is also party to cross-guarantees whereby the bank overdrafts, bank loans and Value Added Tax liabilities of it and certain of itssubsidiaries are cross-guaranteed by it and all of the relevant subsidiaries.
None of the above contingent liabilities of the Company are expected to crystallise.
The Company may be found to be liable for some of the legal liabilities referred to in note 32 (iv) to the consolidated financial statements.
(b) Capital commitmentsCapital commitments (where the Company has contracted to acquire assets on behalf of its subsidiaries) are as follows:
Contracted for but not provided:For delivery in one year 72.4 Nil
(c) Operating lease commitmentsAnnual charges for operating leases are made with expiry dates as follows:
Within one year Nil 0.1 Nil 0.1Between one year and five years Nil 0.6 Nil 0.6Five years and over 0.3 Nil 0.3 Nil
Note 13 Related party transactions
The Company has taken advantage of the exemption under FRS 8, “Related party disclosures” from having to provide related party disclosures in itsown financial statements when those statements are presented with consolidated financial statements of its group. Related party disclosures providedby the Group can be found in note 34 to the consolidated financial statements.
Equity Share Profit and Capital Totalshare premium loss redemption Owncapital account account reserve shares
£m £m £m £m £m £m
£m £m
2011 2010
2011 2010
Land and buildings Other Land and buildings Other£m £m £m £m
78189_STC_Back FINAL_78189_StCchV13_BACK 05/07/2011 11:47 Page 108

Stagecoach Group plc | page 109
1 – 25,000 40,249 98.7 42,861,872 6.025,001 – 250,000 325 0.8 27,459,025 3.8250,001 – 500,000 56 0.1 20,366,374 2.8500,001 – 3,750,000 117 0.3 158,623,083 22.0Over 3,750,000 38 0.1 470,814,596 65.4
40,785 100.00 720,124,950 100.0
Individuals 39,239 96.2 159,875,685 22.2Other corporate bodies 74 0.2 22,085,965 3.1Banks and Nominees 1,356 3.3 512,064,798 71.1Limited companies 103 0.3 21,984,239 3.0Investment trusts 11 0.0 4,110,309 0.6Pension funds 2 0.0 3,954 0.0
40,785 100.0 720,124,950 100.0
RegistrarsAll administrative enquiries relating to shareholdings should, in the first instance, be directed to the Company’s registrars and clearly state theshareholder’s name and address. Please write to: Capita Registrars, Northern House, Woodsome Park, Fenay Bridge, Huddersfield HD8 0GA.Telephone 0871 664 0443 (calls cost 10p per minute plus network extras) if calling from the UK or 0844 842 9587 if calling from outside the UK.Registrar forms can be obtained on-line at http://www.stagecoachgroup.com/scg/ir/shareholder/registrar/
Stagecoach individual savings accountsThe Company has appointed Halifax Share Dealing Limited as an ISA provider and shareholders who would like further information should contacttheir help desk on 08457 22 55 25.
The Company has also made arrangements with Stocktrade for ISAs. Full details and an application form are available from Stocktrade (a division ofBrewin Dolphin), 81 George Street, Edinburgh EH2 3ES. Telephone 0131 240 0448.
Share dealing facilitiesThe Company has set up a range of execution only share dealing services to enable Stagecoach shareholders to buy and sell shares by phone, online orby post. The phone and online dealing services are provided by Capita Share Dealing Services and offer a quick and easy way to buy and sell shares atlatest market prices. To use these services go to www.capitadeal.com or call 0871 664 0384 (calls cost 10p a minute plus network extras, lines are open8.30am-5.30pm Mon-Fri). Please have your share certificate to hand when you log-in or call. Charges start from £20 online and £25 by phone.
A postal dealing service is available from Stocktrade, a division of Brewin Dolphin. Charges start from £15. Shareholders who would like furtherinformation should write to Stocktrade, 81 George Street, Edinburgh EH2 3ES. Telephone 0845 601 0995, quoting dealing reference Low Co020.Postal dealing packs are available on request.
Payment of dividends by BACSMany shareholders have already arranged for dividends to be paid by mandate directly to their bank or building society account. The mandates enablethe Company to pay dividends through the BACS (Bankers’ Automated Clearing Services) system. The benefit to shareholders of the BACS system isthat the registrar posts the tax vouchers directly to them, whilst the dividend is credited on the payment date to the shareholder bank or buildingsociety account. Shareholders who wish to benefit from this service should request the Company’s registrars (address above) to send them adividend/interest mandate form or alternatively complete the mandate form attached to the next dividend tax voucher they receive.
Dividend Re-Investment PlanThe Company operates a Dividend Re-Investment Plan which allows a shareholder’s cash dividend to be used to buy Stagecoach shares at favourablecommission rates. Shareholders who would like further information should telephone the Company’s registrars, Capita Registrars, on 0871 664 0443(calls cost 10p per minute plus network extras) if calling from the UK or 0844 842 9587 if calling from outside the UK.
Shareholder informationAnalysis of shareholders as at 30 April 2011
Range of holdings Number of Ordinary holders % shares held %
Classification of shareholders Number of Ordinary holders % shares held %
78189_STC_Back FINAL_78189_StCchV13_BACK 05/07/2011 11:47 Page 109

page 110 | Stagecoach Group plc
Five year financial summary – consolidated
2011 2010 2009 2008 2007**
£m £m £m £m £m
ResultsRevenue 2,389.8 2,164.4 2,103.3 1,763.6 1,504.6Operating profit 225.0 179.1 202.4 192.3 180.9Net finance (costs)/income (34.5) (51.2) (31.4) (23.6) 0.7Profit before taxation 191.2 125.9 170.8 167.3 184.1Tax (charge)/credit (33.3) (18.1) (37.3) 61.9 (43.6)Profit attributable to equity shareholders of the parent 176.4 111.7 133.5 249.1 277.3
Net assets/(liabilities)Non-current assets 1,167.8 994.7 992.9 880.7 779.4Current assets 658.6 627.2 517.2 502.0 669.1Current liabilities (excluding provisions) (612.6) (598.5) (893.7) (558.1) (445.1)Non-current liabilities (excluding provisions) (784.1) (875.1) (486.1) (625.0) (382.7)Provisions (183.5) (135.6) (139.9) (119.2) (108.4)
Total equity 246.2 12.7 (9.6) 80.4 512.3
Cash and debtCash at bank and in hand 358.3 375.7 277.3 262.2 513.3Gross debt*** (639.2) (672.4) (617.4) (581.9) (326.9)
Net (debt)/funds*** (280.9) (296.7) (340.1) (319.7) 186.4
Cash flowNet cash flow from operating activities after tax 231.8 216.4 277.8 325.0 162.3
RatiosAdjusted earnings per ordinary share* 23.8p 18.7p 22.9p 20.3p 11.7pDividends per ordinary share 7.1p 6.5p 6.0p 5.4p 4.1p
Net cash from operating activities after tax per ordinary share 32.3p 30.2p 38.9p 45.1p 14.9p
Ordinary shares in issue at year end 720.1m 720.1m 719.5m 718.1m 1,101.0m
*before intangible asset expenses and exceptional items
**discontinued operations as defined under IFRS accounting are excluded from operating profit for 2007.
*** as defined in note 36 to the consolidated financial statements.
78189_STC_Back FINAL_78189_StCchV13_BACK 05/07/2011 11:47 Page 110

Registered office, advisers and financial calendar
Company SecretaryRoss Paterson
Registered Office10 Dunkeld Road
Perth PH1 5TW
Telephone +44 (0) 1738 442 111
Facsimile +44 (0) 1738 643 648
Email [email protected]
Company NumberSC 100764
Registrars
Capita Registrars
Northern House
Woodsome Park
Fenay Bridge
Huddersfield HD8 0GA
Telephone +44 (0) 871 664 0443*
Merchant BankersNoble Grossart Limited
48 Queen Street
Edinburgh EH2 3NR
Independent AuditorsPricewaterhouseCoopers LLP
141 Bothwell Street
Glasgow G2 7EQ
StockbrokersNomura International plc
1 Angel Lane
London
EC4R 3AB
Principal Bankers
Lloyds Bank Corporate Markets
25 Gresham Street
London EC2V 7HN
SolicitorsShepherd & Wedderburn LLP
1 Exchange Crescent
Conference Square
Edinburgh EH3 8UL
Herbert Smith LLP
Exchange House
Primrose Street
London EC2A 2HS
Financial CalendarAnnual General Meeting
26 August 2011
Interim Results
December 2011
Final Dividend
5 October 2011
Interim Dividend
March 2012
*calls cost 10 pence per minute plus network extras.
b
2
t

N
a
www.stagecoachgroup.com
Registered Office:10 Dunkeld RoadPerth PH1 5TW Scotland
Tel: 01738 442111 Fax: 01738 643648 Email: [email protected]
Registered in Scotland Number: 100764