Embed Size (px)
Citation preview

Ann. Geophys., 25, 2125–2137, 2007www.ann-geophys.net/25/2125/2007/© European Geosciences Union 2007
AnnalesGeophysicae
Wind profiler observations of a monsoon low-level jet over a tropicalIndian station
M. C. R. Kalapureddy1, D. N. Rao2, A. R. Jain3, and Y. Ohno4
1Indian Institute of Tropical Meteorology, Pune, India2National Atmospheric Research Laboratory, Gadanki, India3National Physical Laboratory, New Delhi, India4National Institute of Information and Communications Technology (NICT), Tokyo, Japan
Received: 20 November 2006 – Revised: 26 May 2007 – Accepted: 3 Ocober 2007 – Published: 6 November 2007
Abstract. Three-year high-resolution wind observations ofthe wind profiler have been utilized to characterize the di-urnal and seasonal features of the monsoon Low-Level Jet(LLJ) over a tropical station, Gadanki (13.5◦ N, 79.2◦ E),with a focus on the diurnal variability of low-level winds.The Boreal summer monsoon winds show a conspicuouslystrong westerly LLJ with average wind speed exceeding20 m s−1. The L-band wind profiler measurements haveshown an advantage of better height and time resolutionsover the conventional radiosonde method for diurnal windmeasurements. An interesting diurnal oscillation of LLJcore has been observed. It is varying in the height range of1.8±0.6 km with the maximum and minimum intensity no-ticed during the early morning and afternoon hours, respec-tively. The jet core (wind maxima) height is observed to co-incide with the inversion height. Strong wind shears are nor-mally located beneath the LLJ core. The sole wind profilerobservations are capable of identifying the monsoon phases,such as onset, break and active spells, etc. The mutual influ-ence between the LLJ and the boundary layer has been dis-cussed. One notices that the observed LLJ diurnal structuresdepend on the local convective activity, wind shears and tur-bulence activity associated with boundary layer winds. Theday-to-day change in the LLJ structure depends on the latitu-dinal position of the LLJ core.
Keywords. Meteorology and atmospheric dynamics(Synoptic-scale meteorology; Tropical meteorology; Turbu-lence)
1 Introduction
Wind plays a vital role in atmospheric energetics. It trans-ports heat, mass, moisture and pollutants from one place to
Correspondence to:M. C. R. Kalapureddy([email protected])
another. These transport processes, in turn, affect the localweather, as well as climate. Hence, the characterization ofwind and its variability is extremely important. So, detailedobservations of winds are necessary with high spatial andtemporal resolutions.
An important atmospheric phenomenon that occurs overthe Indian sub-continent is the monsoon. It accounts for themajority of the annual total rainfall. The monsoon is stronglycoupled with the warm oceans surrounding the subcontinent.There are monsoon-related phenomena whose associationsare very much prominent in deciding the vigor of the mon-soon. Two such phenomena are the Low-Level Jet (LLJ) andTropical Easterly Jet (TEJ). These two synoptic-scale jetsare associated with the boreal summer (southwest) monsoonand located at 850 hPa and 150 hPa, respectively, over south-ern India (Joseph and Raman, 1966; Findlater, 1966, 1967;Mokashi, 1974; Desai et al., 1976). The wind speeds asso-ciated with the LLJ are less than 30 m s−1, but occasionallythey exceed this value. The WMO definition of the jet (windspeeds exceeds 30 m s−1), basically meant for the TEJ, maynot be often valid for the LLJ. In spite of this fact, a low-level (850 hPa) wind system having a strong wind and windshear has been named as an LLJ. This jet stream is often ob-served during June–August and is strongest in July, in thesouthern part of India (Joseph and Raman, 1966). In general,LLJ has a wind speed maximum that occurs in the lowest fewkilometers of the atmosphere, and wind speeds should showa decrease on either side of the wind maximum. Usually,a Low-Level Atmospheric Jet is supposed to be a nocturnalphenomenon (Stull, 1990) and is one of the interesting fea-tures of the stable boundary layer that is well documented atdiverse locations (for a review, see Wipperman, 1973; Sten-srud, 1996). The LLJ observed over the Indian peninsula isan Afro-Asian cross-equatorial phenomenon. Joseph and Ra-man (1966) first examined the LLJ features over the peninsu-lar India followed by Desai et al. (1976), which confirms theexistence of a westerly LLJ stream with strong vertical and
Published by Copernicus Publications on behalf of the European Geosciences Union.

2126 M. C. R. Kalapureddy et al.: Wind profiler observations of a monsoon low-level jet over a tropical Indian station
horizontal wind shears. The LLJ over tropical India couldhave a strong link with the Indian monsoon rainfall (Find-later, 1969). Later, wind analysis by Findlater (1971) hasshown that there is a cross-equatorial strong wind flow fromSouth Africa to Indian Ocean and southern India via Soma-lia. Many researchers studied various aspects of this synop-tic cross-equatorial jet (e.g. Krishnamurti et al., 1976, 1983;Hart et al., 1978; Newton, 1981). But almost all the earlierobservations were normally based on radiosonde/rawinsondeobservations taken twice a day. However, those observations,poor in resolution, were not sufficient to explore some of theimportant features of the LLJ, such as diurnal variation andits influence on the local boundary layer through turbulenceand vertical velocities. The high-resolution observations arerequired to explore these important features.
Advancement of the remote sensing Doppler radar windprofiling technology allows us to make a continuous high-resolution (both height and time) vertical profile of windmeasurements in the first few kilometers of the lower tro-posphere through clear sky much easier and automatically ina cost-effective way. In addition to their ability to measureatmospheric winds, the profilers have a unique capability ofmeasuring vertical wind directly. However, wind profilerscould miss some of the LLJs, which occur at heights below500 m (Stensrud et al., 1990). In spite of the difficulties in-volved in the remote wind sensing, a continuous, long-termrecord of lower level wind profiles is the best means to ex-plore the fine features, such as the diurnal variation of theLLJ.
The objective of this paper is to explore the monsoon in-duced LLJ characteristics and their influence on the bound-ary layer features. By taking advantage of the high-resolutionobservations of LAWP, special attention is given to explorethe diurnal variation of the LLJ. Further, three-year windmeasurements are examined for seasonal and day-to-dayvariation of the low-level wind over Gadanki.
2 Site, system and data description
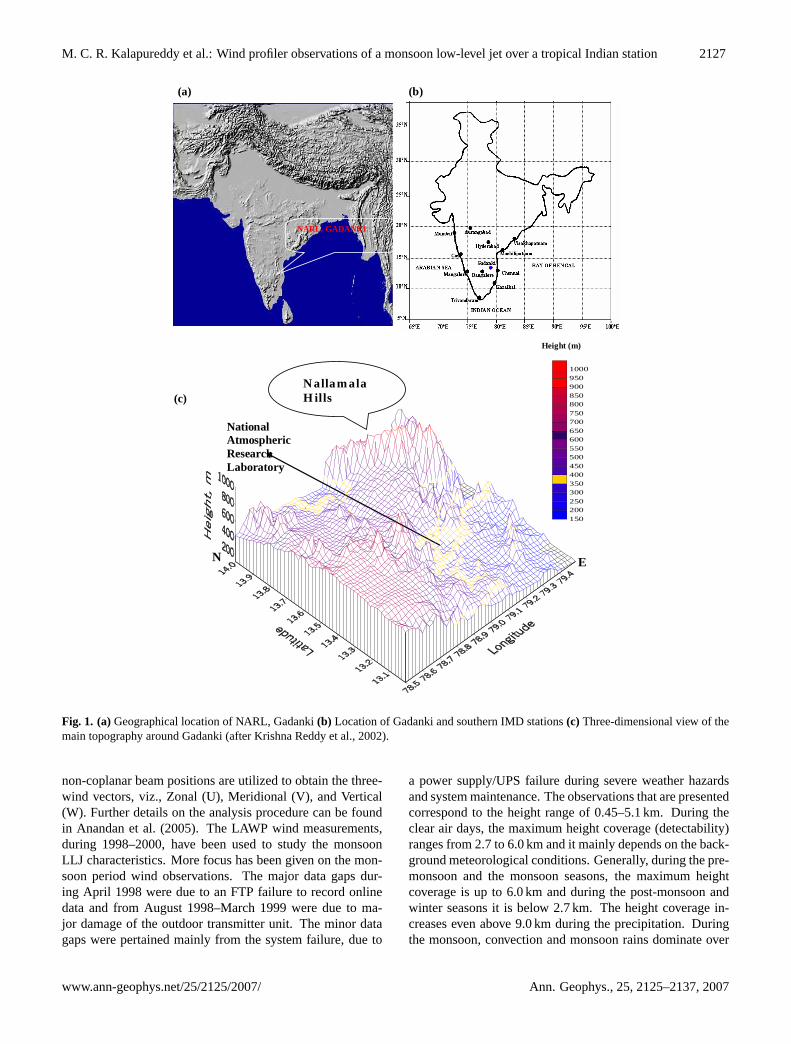
The experimental site, National Atmospheric Research Lab-oratory (NARL), is located at Gadanki (13.5◦ N, 79.2◦ E), sit-uated in the southern part of the tropical India,∼370 m abovethe mean sea level, and is shown in Fig. 1. This site is sit-uated in a rural environment surrounded by hillock, whoseheights are around 200–700 m, within a 10-km radius and isa mixture of agricultural and population centers and is about120 km to the northwest of Chennai, which is on the eastcoast of the Indian peninsula. A three-dimensional view ofthe main topography around Gadanki is shown in Fig. 1c.However, the topography of the site is not exclusively con-sidered for the present study.
India Meteorological Department (IMD) has defined themeteorological conditions over the Indian sub-continent. Theseasons over India are divided into winter (January and
February), pre-monsoon/summer (March, April, and May),monsoon/South-West (SW) monsoon (June, July, August,and September), and post-monsoon/North-East (NE) mon-soon (October, November, and December). SW and NEmonsoons are also known as the summer-monsoon andwinter-monsoon, respectively. These two monsoons accountfor the majority of the annual total rainfall. The two mon-soons are different in the sense that in summer, warm equa-torial maritime air predominates over a major portion of thecountry. In winter, the air masses recede south and are re-placed by the cool tropical continental air. The normal onsetof the SW monsoon is around the first week of June and with-drawal occurs during the middle of September. After onsetof the SW monsoon, it takes around a week to observe it atthe observational site. The normal day mean surface tem-peratures during the cardinal months of January, April, July,and October are around 23, 30, 30, and 28 degree Celsius,respectively, at almost all of the IMD sites in the southernpart of India. The mean wind is southwesterly during themonsoon season and for the rest of the seasons, northeast-erly. Sky conditions defined in this study are clear-air, whichmeans that the atmosphere is predominantly free from pre-cipitating clouds and vertical velocities are of the order of afew centimeters per second.
In India, the first L-band Doppler radar, known as LowerAtmospheric Wind Profiler (LAWP), is operational at NARL.The LAWP at Gadanki is the first boundary layer wind pro-filer dedicated to the detailed investigation of the Atmo-spheric Boundary Layer (ABL) characterization via winds,turbulence and precipitating systems in the tropical latitudes(Krishna Reddy et al., 2002; Krishna Reddy, 2003a, b, c, d;Krishnan and Kunhikrishnan, 2004; Krishnan et al., 2005;Kalapureddy et al., 2007). Gadanki is an ideal site to serveas ground validation of the Tropical Rainfall Measuring Mis-sion (TRMM) satellite because of its location and availabilityof multiple sensors at NARL. The LAWP operates in the L-band region at 1357.5 MHz with a peak power aperture prod-uct of 1.2×10⁴ W m2. It provides the valuable wind infor-mation in three different directions, corresponding to Zenithand off-zenith (15◦) towards North and East. The LAWPis operated continuously with height and time resolutions of150 m and∼10 min, respectively, and the data is recorded ina power spectral form. Detailed LAWP system and experi-mental specifications, as well as data and relative availabil-ity of wind measurements can be found in Krishna Reddy etal. (2001, 2002). The parameterization of the Doppler sig-nal spectrum data of LAWP, in the present study, followsclosely the procedure adopted at the Poker Flat radar (Rid-dle, 1983). The three lower order spectral moments, the sig-nal strength, the weighted mean Doppler shift, and the spec-tral width are computed then through numerical integrationusing the expressions given by Woodman (1985). The meanDoppler shift provides a direct measure of the radial velocityof scattering refractive irregularities which act as tracers ofthe background wind. The measurements taken with three
Ann. Geophys., 25, 2125–2137, 2007 www.ann-geophys.net/25/2125/2007/
M. C. R. Kalapureddy et al.: Wind profiler observations of a monsoon low-level jet over a tropical Indian station 2127
High resolution Monsoon Low Level Jet characteristics over Tropical India
8
Figure 1
NARL, GADANKI
(a) (b)
Height (m)
E N
National Atmospheric Research Laboratory
1502002503003504004505005506006507007508008509009501000
N allam ala H ills (c)
Fig. 1. (a)Geographical location of NARL, Gadanki(b) Location of Gadanki and southern IMD stations(c) Three-dimensional view of themain topography around Gadanki (after Krishna Reddy et al., 2002).
non-coplanar beam positions are utilized to obtain the three-wind vectors, viz., Zonal (U), Meridional (V), and Vertical(W). Further details on the analysis procedure can be foundin Anandan et al. (2005). The LAWP wind measurements,during 1998–2000, have been used to study the monsoonLLJ characteristics. More focus has been given on the mon-soon period wind observations. The major data gaps dur-ing April 1998 were due to an FTP failure to record onlinedata and from August 1998–March 1999 were due to ma-jor damage of the outdoor transmitter unit. The minor datagaps were pertained mainly from the system failure, due to
a power supply/UPS failure during severe weather hazardsand system maintenance. The observations that are presentedcorrespond to the height range of 0.45–5.1 km. During theclear air days, the maximum height coverage (detectability)ranges from 2.7 to 6.0 km and it mainly depends on the back-ground meteorological conditions. Generally, during the pre-monsoon and the monsoon seasons, the maximum heightcoverage is up to 6.0 km and during the post-monsoon andwinter seasons it is below 2.7 km. The height coverage in-creases even above 9.0 km during the precipitation. Duringthe monsoon, convection and monsoon rains dominate over
www.ann-geophys.net/25/2125/2007/ Ann. Geophys., 25, 2125–2137, 2007

2128 M. C. R. Kalapureddy et al.: Wind profiler observations of a monsoon low-level jet over a tropical Indian stationHigh resolution Monsoon Low Level Jet characteristics over Tropical India
1
Figure 2
Fig. 2. Five-day mean horizontal winds observed for (top) 1998, (middle) 1999, and (bottom) 2000.
southern India. Hence, it is necessary to separate out the datathat corresponds to the clear-air and the precipitation con-ditions. This is important since LAWP, which operates at1.3 GHz, is highly sensitive to hydrometeors. So, it is ob-vious that the precipitation echoes mask the clear-air echoesand thus it is very difficult to estimate the background wind.Hence, in this study only the clear-air data of LAWP are con-sidered. The observed wind vectors using the LAWP havebeen compared with the co-located Indian MST radar andfound to be in good agreement with correlation coefficientsof 0.94, 0.80, and 0.78, respectively, for zonal, meridionaland vertical wind vectors (Madhu C Reddy et al., 2000; Kr-ishna Reddy et al., 2002).
LAWP observed echo power and spectral width are uti-lized, respectively, for estimating the atmospheric turbulencerefractivity structure parameter (C2
n) and the eddy dissipa-tion rate (ε), to characterize the local boundary layer.C2
n isthe structure parameter that characterizes the strength of therefractive index fluctuations andε deals with the turbulenceintensities in the velocity field.ε is one of the fundamentalparameters used to determine the turbulence characteristics.The sharp increase inC2
n is confined to the top of the bound-ary layer where a sudden change in atmospheric refractivityis due to changes in atmospheric temperature and humidity.The sharp decrease inε above the boundary layer indicatesthe diminishing of turbulent eddies of sizes comparable tohalf of radar wavelength above the boundary layer. So, thesharp gradient feature of these parameters observed aroundthe boundary layer top can be used to estimate the bound-ary layer depth (Angevine et al., 1994; White, 1993; San-
dra Jacoby-Koaly et al., 2002). Hence, this gradient feature,from here on, is utilized to find the boundary-layer depth/topfrom sole radar measurements. The detailed estimation ofC2
n andε used in this study can be found in Kalapureddy etal. (2007).
3 Results and discussion
3.1 General LLJ characteristic features over Gadanki
Figure 2 shows the seasonal features of the low-level winds,averaged for 5 days, for all the months during 1998, 1999and 2000. In this figure, the arrow head indicates the winddirection and the length of the arrow represents the magni-tude of the wind speed. It is evident from the figure that thewind structure has a consistent common characteristic fea-ture corresponding to each of the seasons over Gadanki. Thestrong westerly (blue arrows) winds prevail during the mon-soon season over the peninsular India. Easterlies are pre-dominant (red arrows) during the rest of the seasons. Settingof the well-organized westerlies can be seen from the firstweek of June onwards, which is the monsoon onset periodover India (Krishnamurti, 1985; Joseph et al., 1994). DuringJuly and August, strong westerly winds are commonly ob-served. The intervening brief easterlies during the monsoonseason are observed to be associated with the break phase ofthe monsoon. A gradual seasonal change in the wind direc-tion from easterly to westerly is noticed around the monsoononset period, during the middle of May, and the westerly to
Ann. Geophys., 25, 2125–2137, 2007 www.ann-geophys.net/25/2125/2007/

M. C. R. Kalapureddy et al.: Wind profiler observations of a monsoon low-level jet over a tropical Indian station 2129
Table 1. Summary of LAWP observed low-level jet features over Gadanki during 1998–2000.
Sl.No.
Season LLJ’s nature & averagefrequency per month
Wind direction Wind speed(m s−1)
LLJ vertical ex-tension (km)
Remarks
1 Pre-monsoon (summer)March–May
∗Nocturnal & 15 daysper month
Easterly/Westerly
12–18 1.2–3.6 Meridional wind is domi-nant. Weak south-easterlyand strong northeasterly aremerging at∼1.8–2.1 km.
2 MonsoonJune–September
∗∗Day long & 20 daysper month
Westerly 14–24 0.6–4.5 Zonal wind is dominant.Strong westerlies observedfor many days are indicat-ing an active phase of mon-soon. Meager winds withwind reversal are observedto be associated with breakmonsoon periods.
3 Post-monsoon#October–December
Nocturnal Easterly 7–9 0.6–1.8 Winds are mostly weak andnortherly/easterly.
4 WinterJanuary–February
Nocturnal & 10 days permonth
Easterly 12–14 0.6–2.1 Meridional wind is domi-nant below 1.5 km. Weakeasterly and strong westerlyare observing below andabove 2 km, respectively.
Data used: 18 February 1998–24 August 1998 (116 days); 17 March 1999–30 December 1999 (282 days); 3 January 2000–29 September2000 (263 days)Data gap dates: March 1998 (7, 8, 15, 16, 18); May 1998 (16, 30, 31); June 1998 (5, 7–9, 27–28); July 1998 (5, 25, 26); August 1998 (2,12–15); March 1999 (29); October 1999 (10–13, 31); January 2000 (30, 31); February 2000 (26); April (17); June 2000 (6, 17, 18); August2000 (14, 22) along with bulk data gap during 28 March 1998–15 May 1998∗ Confined around 22:00–09:00 LT;∗∗ Confined to whole time of the day;# information based only on 1999 data.
easterly change is observed around the middle of September,which is the monsoon withdrawal period.
The general LLJ features associated with each season andthe remarkable characteristics are summarized for the windobservations during 1998–2000 and presented along with thedatabase in Table 1. Generally, the LLJ characteristic fea-tures during the winter and pre-monsoon are observed to beeasterly in direction, and wind magnitudes are of the orderof 14 to 16 m s−1 with a varying height in the jet core of1.6±0.3 km. The LLJ features noticed with our limited dataset, corresponding to the post-monsoon period, reveals thatthe LLJ is weak and seldom. The LLJ features observedduring the monsoon, which is the focus of this paper, arerelatively stronger and frequent, whereas during other sea-sons LLJ is nocturnal in nature with low intensity and onlyon occasional occurrence. The LLJ during the monsoon pe-riod is westerly in direction and the wind magnitude is 15to 25 m s−1 with jet core heights varying 1.8±0.6 km. Thelargest vertical thickness (spread) of the LLJ during the mon-soon is observed to be∼3.9 km. It has been observed thatLLJ features appear to be conspicuously stronger in theirmagnitudes and daylong existence for a few continuous daysduring the active phase of the monsoon. The wind profilerwhich made high-resolution vertical wind profiles allowed usto obtain the LLJ evolution and depth information which is
believed to be better than the previous radiosonde-based ob-servations. However, the other important features of the LLJ,such as length and width information, demands a network ofobservations covering a larger area. For such observations,the radiosonde network still shows the promise.
3.1.1 LLJ characteristics during the active monsoon period(July–August)
The horizontal and the vertical structures of the LLJ dur-ing the monsoon period have been explored using thecontemporaneous National Center for Environmental Pre-diction (NCEP)/National Center for Atmospheric Research(NCAR) reanalysis wind data and the southern IMD ra-diosonde/rawinsonde data along with the LAWP observedwinds. The period of 15 July–15 August 1999 (32 days) ischosen for exploring the day-to-day LLJ characteristics per-taining to the active and the break monsoon phases. Thisperiod has been selected due to the availability of both theradiosonde measured vertical profiles of meteorological pa-rameters and the fairly continuous LAWP winds at the ob-servational site. The LAWP observed zonal winds are usedto look at the height-time structure of the LLJ over the ob-servational site and is shown in Fig. 3 (top). Data gapsare left as white patches. This figure clearly demonstratesthe fine day-to-day changes along with remarkable diurnal
www.ann-geophys.net/25/2125/2007/ Ann. Geophys., 25, 2125–2137, 2007

2130 M. C. R. Kalapureddy et al.: Wind profiler observations of a monsoon low-level jet over a tropical Indian stationHigh resolution Monsoon Low Level Jet characteristics over Tropical India
9
05
10152025
[d]
karaikal visakapatna chennai machilipatn
05
10152025
[c]
hyderbad bangalore
05
10152025
[b]
trivendrum mumbai mangalore
05
10152025
[a]
MEAN LAWP
Win
d sp
eed
(ms-1
)
18 22 26 30 03 07 11 15
0510152025
0530 15Jul99
1730 15Aug99
1730 11Aug99
1730 07Aug99
1730 03Aug99
1730 30Jul99
1730 26Jul99
1730 22Jul99
Time (LT)
1730 18Jul99
NCEP Zonel wind at 850 hPa in Box 10N - 15N and 75E - 85E in 1999
Fig. 3. (Top) Height-Time Intensity (HTI) map of zonal wind observed during 15 July–15 August 1999.(a) 850 hPa level mean windobserved with the southern India IMD stations (solid line) the vertical bars are standard deviations, corresponding to the LAWP zonal windat 1.5 km (dotted line) and NCEP 850 hPa mean zonal wind in grid 10◦–15◦ N and 75◦–80◦ E (dashed line). The wind speed observations ofIMD stations over(b) west coast,(c) land stations in between the two coasts over India, and(d) east coast.
variation of the LLJ. The strong westerly winds with vary-ing intensities and a clear oscillation of a level of maxi-mum wind (LLJ core) have been noticed over the courseof the days during 25–28 July 1999. These features per-tain to the active monsoon phase. During the active phase,the jet stream extends from the height region of 0.9–4.2 km,where the jet core is oscillating in the range 1.8–2.4 km withwind speeds exceeding 20 m s−1 at the jet core. The weakzonal wind magnitude along with a change in sign (westerlyto easterly), almost persisting for the few continuous daysduring 11–15 August 1999, is an indication of break mon-soon phase. Hence, LAWP is capable of identifying the ac-
tive and the break phase of monsoon by its solo wind in-formation. The wind speed at 850 hPa, during 05:30 and17:30 LT (LT=UTC+05:30), and the radiosonde observationsfrom 15 July–15 August 1999 are averaged, respectively,for the southern IMD stations (see Fig. 1 for location ofthe stations); the mean and standard deviation are shownin Fig. 3a. The LAWP observed zonal winds (dotted line)at 1.5 km around the radiosonde observation period show agood comparison with the NCEP reanalysis and the southernIndia IMD stations’ mean wind at 850 hPa. The pronouncedvariation in the LAWP observed LLJ can be attributed to thestrength of its high-resolution observations, in addition to the
Ann. Geophys., 25, 2125–2137, 2007 www.ann-geophys.net/25/2125/2007/

M. C. R. Kalapureddy et al.: Wind profiler observations of a monsoon low-level jet over a tropical Indian station 2131High resolution Monsoon Low Level Jet characteristics over Tropical India
2
[b] [c]
[a]
[b]
[c]
Fig. 4. (a)NCEP/NCAR reanalysis 850-hPa level wind averaged for the period 15 July–15 August 1999. The 850 hPa level wind during 1June–31 August 1999 is averaged for longitudinal band(b) 70–77.5◦ E and(c) 77.5–90◦ E.
local variability of wind. The observations in the IMD sta-tions are classified into the west coast, land stations in be-tween the two coasts over India, and east coast, to accessthe gradients in the horizontal winds, and are shown, respec-tively, in Figs. 3b, c and d. These panels clearly show thegradients in the horizontal winds over southern India. Thesegradients in winds may partly pertain to the complexity ofthe monsoon winds and partly be due to the monsoon flowmodification by the local boundary layer and topography.
The global mean wind picture during 15 July–15 August1999 can be understood from NCEP/NCAR reanalysis data(Kalnay et al., 1996) at 850 hPa level with 2.5◦
×2.5◦ gridresolutions confined to 00:00 UTC on each day. The meanwind speed with its direction contour over 30◦ N–30◦ S and30◦ E–120◦ E are shown in Fig. 4a. This figure confirms theexistence of a strong synoptic monsoon-induced wind flowover the southern part of India. This figure also shows thatthe LLJ extended over the Indian latitude region 2◦ N–22◦ Nand the LLJ core is confined over the latitude region 8◦ N–15◦ N, right over Gadanki. The width and wind speeds asso-ciated with the LLJ core are noticed to be relatively more atthe west coast than at the east coast of India. Further, in or-der to find the exact latitudinal position of the oscillating LLJcore, the evolution of the LLJ core at the west coast (70.0◦ E–77.5◦ E) and the east coast (77.5◦ E–90.0◦ E) of India hasbeen shown in Figs. 4b and c, using the NCEP mean wind at850 hPa during 1 June–31 August 1999. There is a significant
latitudinal difference in the LLJ core evolution and structurebetween the west coast and east coast of India. This could bemainly due to the ocean-to-land frictional contrast. It can benoticed from Fig. 4c that during the LAWP observed activemonsoon phase, 25–28 July 1999, the LLJ core is locatedaround the observation site. Hence, from Fig. 3 (top) andFig. 4c, it can be understood that the height-time structuresof the LLJ revealed by LAWP shows a good correlation withthe latitudinal position of the LLJ core. Hence, the observedLLJ structures are due to the latitudinal oscillation of the LLJcore. It is worth pointing out that the probable location of theLLJ core is sensitive to the location of the convective heat-ing area, which plays a key role in deciding the phase of themonsoon around India (Joseph and Sijikumar, 2004). Theyalso mentioned that during the active phase of the monsoonthe east-west band of strong convective heating, confined inthe latitude region 10◦ N–20◦ N, causes the LLJ axis to passthrough the peninsular India. So, it can be understood fromFigs. 3 and 4 that the LAWP observed height-time structuresof the LLJ are the clear signature of the large-scale, complex,monsoon flow passing over Gadanki.
3.1.2 Diurnal evolution of the monsoon LLJ and its effectson the boundary layer
The simultaneous LAWP and radiosonde observations car-ried out at Gadanki have been utilized to understand the di-urnal variability of LLJ. The height profiles of various ABL
www.ann-geophys.net/25/2125/2007/ Ann. Geophys., 25, 2125–2137, 2007

2132 M. C. R. Kalapureddy et al.: Wind profiler observations of a monsoon low-level jet over a tropical Indian station
3
Figure 5a
Fig. 5a. (Top to bottom) HTI panels show radio refractive index structure parameter (C2n), eddy dissipation rate (ε), wind shear (S), vertical
wind (W), horizontal wind speed (Vh) with four hourly averaged wind direction, and observed during 28–29 July 1999. The white circlescorrespond to the boundary layer top estimated from radiosonde observations.
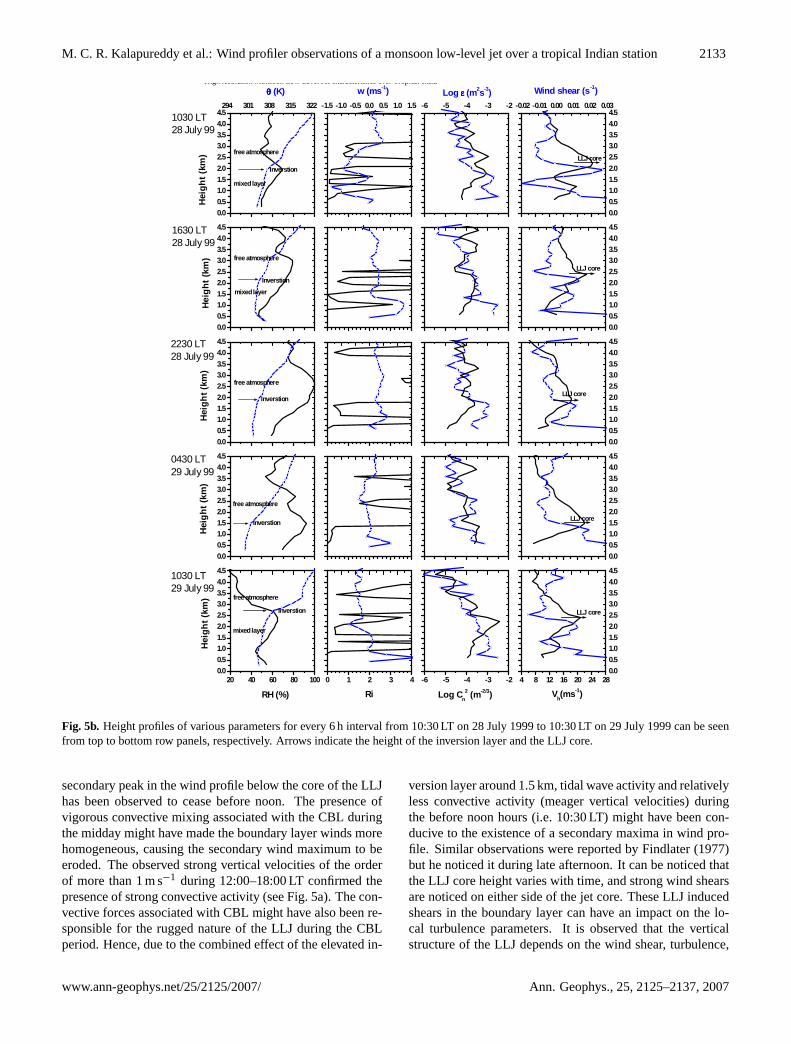
dynamical and meteorological parameters, derived from si-multaneous LAWP and radiosonde observations, on 28–29July 1999, are shown in Figs. 5a and b. These two days, i.e.28–29 July 1999, represent the typical active monsoon LLJdays. Figure 5a shows HTI maps of the turbulence relatedparameters (C2
n andε), and dynamical parameters (horizon-tal wind speed (Vh) with hourly wind direction, vertical shearof the horizontal wind (S), and W), during 28–29 July 1999.In Fig. 5b, each horizontal panel corresponds to a particulartime of the radiosonde launch during 10:30 LT on 28 July1999 to 10:30 LT on 29 July 1999, with an observationalinterval of every six hours. The height profiles of W,C2
n,ε, Vh, and S are computed using the LAWP measurementsaveraged over 20 min around the radiosonde launch time.The radiosonde measured parameters are used to computethe potential temperature (θ) and the Richardson Number
(Ri=gθ
dθdz
/S2). It can be seen from Fig. 5a that the horizon-
tal wind speed shows strong westerly oriented LLJ featureswith diurnal variability in intensity and height of the LLJcore. The LLJ structure during 09:00–22:00 LT, with its coreheight elevated as high as 3.0 km, is not very coherent. TheLLJ structure is very much organized and relatively strongerduring 22:00–09:00 LT with an LLJ core at its lower height at1.8 km. It can be noticed that the sharp gradient in height pro-file of θ (gray line in 1st column panel of Fig. 5b), indicating
the top of the boundary-layer (Angevine et al., 1994), showsa good correlation with the LLJ core height. The significantchange in wind speed with a clear oscillation in the level ofmaximum wind during the course of the day can be seen inthe right-most column panels of Fig. 5b. A near similar fea-ture has been reported by Ardanuy (1979). It is also observedthat the LLJ core height is confined to the level of boundarylayer inversion. Similar features are reported by Yihua Wuand Sethu Raman (1998). It can be noticed from Fig. 5athat the positive shears are more dominant during nocturnalhours, at the lower flange of the LLJ. It is interesting to notethat there exists a consistent secondary wind maximum justbelow the LLJ at∼1 km before noon, i.e.∼10:30 LT (seeFig. 5b). The exact reasons for the existence of such a phe-nomenon have yet to be understood. But it is likely that theinteraction of the existing early morning strong LLJ with thelocal tidal wave activity exhibited by the pressure patternmight have caused the wind gradients, which may be oneof the reasons for the double maxima in the wind profile ataround 10:30 LT. The other probable reason might be the in-teraction between the existing strong low-level winds with agradual rise in the convectively forced boundary layer inver-sion, after 09:00 LT (see Fig. 5a). The convective force asso-ciated with the CBL pushes the inversion layer, consequentlylifting the LLJ core. The strong winds below the inversionstill persist but with less vigor compared to prime LLJ. This
Ann. Geophys., 25, 2125–2137, 2007 www.ann-geophys.net/25/2125/2007/
M. C. R. Kalapureddy et al.: Wind profiler observations of a monsoon low-level jet over a tropical Indian station 2133
High resolution Monsoon Low Level Jet characteristics over Tropical India
6
Figure 5b
0.00.51.01.52.0
2.53.03.54.04.5
0.00.51.01.52.02.53.03.54.04.5
0.00.51.01.52.02.53.03.5
4.04.5
0.00.51.01.52.02.53.03.54.04.5
20 40 60 80 1000.00.51.01.52.02.53.03.54.04.5
0 1 2 3 4 -6 -5 -4 -3 -2 4 8 12 16 20 24 28
294 301 308 315 322 -1.5 -1.0 -0.5 0.0 0.5 1.0 1.5 -6 -5 -4 -3 -2 -0.02 -0.01 0.00 0.01 0.02 0.03
0.00.51.01.52.0
2.53.03.54.04.5
0.00.51.01.52.02.53.03.54.04.5
0.00.51.01.52.02.53.03.5
4.04.5
0.00.51.01.52.02.53.03.54.04.5
0.00.51.01.52.02.53.03.54.04.5
Inverstion
free atmosphere
mixed layer
Hei
gh
t (k
m)
Hei
gh
t (k
m)
Hei
gh
t (k
m)
Hei
gh
t (k
m)
Hei
gh
t (k
m)
LLJ core
LLJ core
LLJ core
LLJ core
Inverstion
mixed layer
free atmosphere
Log Cn
2 (m-2/3)
Log εεεε (m2s-3) Wind shear (s-1)w (ms-1)
Ri
θθθθ (K)
Vh(ms-1)RH (%)
1030 LT 28 July 99
1030 LT 29 July 99
0430 LT 29 July 99
2230 LT 28 July 99
1630 LT 28 July 99
Inverstion
free atmosphere
Inverstion
free atmosphere
LLJ core
Inverstion
mixed layer
free atmosphere
Fig. 5b. Height profiles of various parameters for every 6 h interval from 10:30 LT on 28 July 1999 to 10:30 LT on 29 July 1999 can be seenfrom top to bottom row panels, respectively. Arrows indicate the height of the inversion layer and the LLJ core.
secondary peak in the wind profile below the core of the LLJhas been observed to cease before noon. The presence ofvigorous convective mixing associated with the CBL duringthe midday might have made the boundary layer winds morehomogeneous, causing the secondary wind maximum to beeroded. The observed strong vertical velocities of the orderof more than 1 m s−1 during 12:00–18:00 LT confirmed thepresence of strong convective activity (see Fig. 5a). The con-vective forces associated with CBL might have also been re-sponsible for the rugged nature of the LLJ during the CBLperiod. Hence, due to the combined effect of the elevated in-
version layer around 1.5 km, tidal wave activity and relativelyless convective activity (meager vertical velocities) duringthe before noon hours (i.e. 10:30 LT) might have been con-ducive to the existence of a secondary maxima in wind pro-file. Similar observations were reported by Findlater (1977)but he noticed it during late afternoon. It can be noticed thatthe LLJ core height varies with time, and strong wind shearsare noticed on either side of the jet core. These LLJ inducedshears in the boundary layer can have an impact on the lo-cal turbulence parameters. It is observed that the verticalstructure of the LLJ depends on the wind shear, turbulence,
www.ann-geophys.net/25/2125/2007/ Ann. Geophys., 25, 2125–2137, 2007

2134 M. C. R. Kalapureddy et al.: Wind profiler observations of a monsoon low-level jet over a tropical Indian stationHigh resolution Monsoon Low Level Jet characteristics over Tropical India
5
Figure 6a
August'00
July'00
June'00
V (m/s)
HEIG
HT (k
m)
TIME (LT)
0.6
1.2
1.8
2.4
3.0
3.6
4.2
4.8
0.6
1.2
1.8
2.4
3.0
3.6
4.2
4.8
0 1 2 3 4 5 6 7 8 9 10 11 12 13 14 15 16 17 18 19 20 21 22 23
0.6
1.2
1.8
2.4
3.0
3.6
4.2
4.8
0
5
10
15
20
h0.6
1.2
1.8
2.4
3.0
3.6
4.2
4.8
0 1 2 3 4 5 6 7 8 9 10 11 12 13 14 15 16 17 18 19 20 21 22 23
0.6
1.2
1.8
2.4
3.0
3.6
4.2
4.8
0.6
1.2
1.8
2.4
3.0
3.6
4.2
4.8August'99
July'99
June'99
HEIG
HT (k
m)
TIME (LT)
Monthly mean diurnal features of Horizontal winds 1999 2000
Fig. 6a. (Left and right) Mean monthly diurnal features of horizontal wind contours for June (bottom), July (middle) and August (top) for1999 and 2000.
and vertical wind information. Such altitudes, where the Rivalue is less than one, represent the regions where turbulentlayers are likely to be present (Atlas et al., 1968). Aroundthe inversion height (boundary layer top) the Ri is below thecritical value. The frequency of the turbulent layers associ-ated with the CBL period is higher than the nocturnal pe-riod. The turbulence parametersC2
n andε (gray and blackline in 3rd column panel of Fig. 5b) show significant gradi-ent around the top of the boundary layer. It is already men-tioned that this sharp gradient feature is utilized to estimatethe boundary layer depth. The white circles in all the pan-els of Fig. 5a correspond to the boundary layer top deter-mined using the radiosonde data. TheC2
n andε values arerelatively large during the CBL period and are sparse andsporadic after sunset. The CBL depth, indicated by the en-hancedC2
n (∼10−13.5 m−2/3), reached as high as∼3.5 km inbetween afternoon and sunset while strongε values (10−3 to10−2 m2 s−3) are confined to within the CBL.
Figure 6a (left and right panels) illustrates the meanmonthly diurnal variability of the monsoon LLJ during June-August over Gadanki, for the years 1999 and 2000, respec-tively. The hourly wind profiles of each day of the wholemonth have been averaged for their respective hours and arepresented as a contour map for June (bottom), July (middle)and August (top). The stronger and significant LLJ featuresare noticed during July 1999, July–August 2000. This typeof feature is not observed clearly during June–August 1998(not shown in figure), which may be due to frequent datagaps and the long break monsoon periods during 1998. The
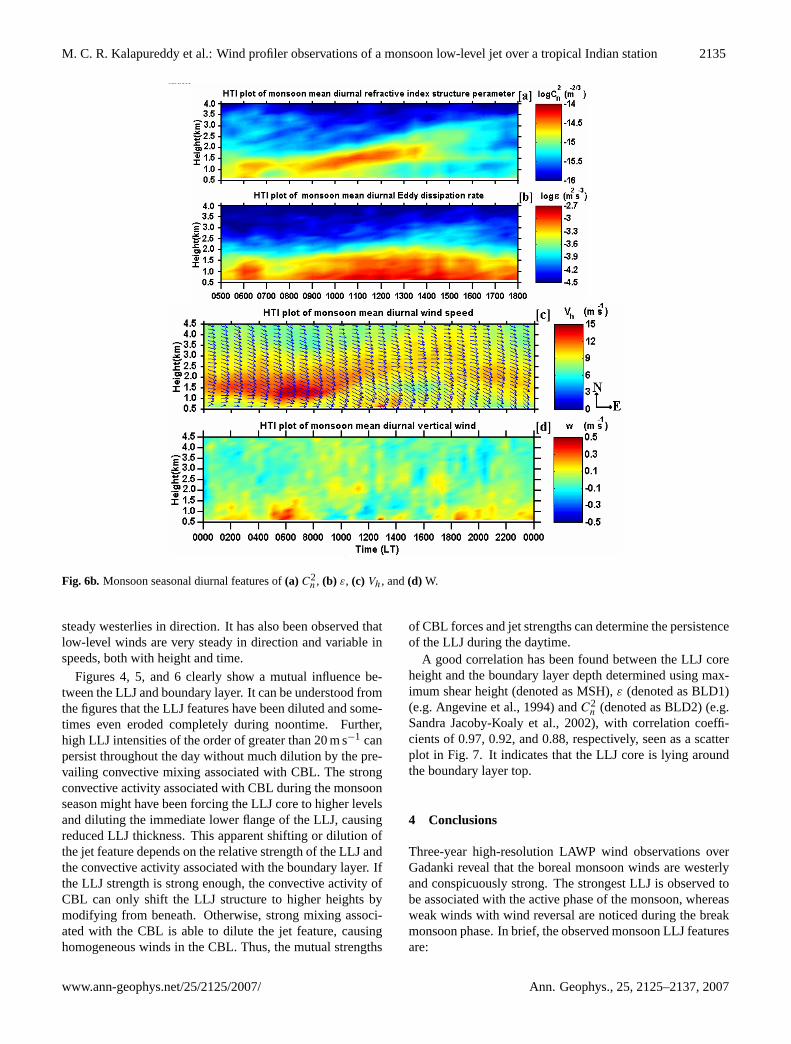
monthly mean diurnal representation shows that the LLJ fea-tures are well organized in structure in the late night to justa few hours after sunrise (20:00–08:00 LT), whereas duringthe daytime (08:00–18:00 LT), either weakened or erodedLLJ features can be seen. Figure 6b has four panels (a–d)which bring out the mean diurnal features of the boundarylayer, wind (Vh with wind direction and w) and turbulence(C2
n and ε), parameters. The turbulence parameters are il-lustrated around the CBL times, i.e. 05:00–18:00 LT only, asthe method used is well suitable for CBL periods. Duringthe monsoon season, an elevated inversion layer capping theCBL can be seen very clearly from the HTI plot ofC2
n inFig. 6b (a). The growth of the CBL is very rapid, reachinga height of∼3 km during 14:00–16:00 LT. The large valuesof ε are confined to a height of∼2 km and are seen almostall the time. Figure 6b (c) shows the diurnal evolution ofthe horizontal wind speed during the monsoon season andit shows strong westerly winds with a mean wind speed of∼15 m s−1, associated with monsoon driven LLJ. The LLJ isstrong before 10:00 LT. The bottom panel shows the diurnalevolution of vertical velocity. This plot readily reveals theupdrafts throughout the day in the boundary layer, whereasthe rest of the seasons show downdrafts during this period(Kalapureddy et al., 2007). During the monsoon season,these low-level updrafts aid in pumping more moisture intothe free atmosphere and help in the formation of convectiveclouds. In general, the monsoon season observations showthe mean LLJ core height varying around 1.8±0.6 km withaverage core speeds around 15 m s−1. The jet streams are
Ann. Geophys., 25, 2125–2137, 2007 www.ann-geophys.net/25/2125/2007/
M. C. R. Kalapureddy et al.: Wind profiler observations of a monsoon low-level jet over a tropical Indian station 2135
High resolution Monsoon Low Level Jet characteristics over Tropical India
4
Figure 6b
Fig. 6b. Monsoon seasonal diurnal features of(a) C2n, (b) ε, (c) Vh, and(d) W.
steady westerlies in direction. It has also been observed thatlow-level winds are very steady in direction and variable inspeeds, both with height and time.
Figures 4, 5, and 6 clearly show a mutual influence be-tween the LLJ and boundary layer. It can be understood fromthe figures that the LLJ features have been diluted and some-times even eroded completely during noontime. Further,high LLJ intensities of the order of greater than 20 m s−1 canpersist throughout the day without much dilution by the pre-vailing convective mixing associated with CBL. The strongconvective activity associated with CBL during the monsoonseason might have been forcing the LLJ core to higher levelsand diluting the immediate lower flange of the LLJ, causingreduced LLJ thickness. This apparent shifting or dilution ofthe jet feature depends on the relative strength of the LLJ andthe convective activity associated with the boundary layer. Ifthe LLJ strength is strong enough, the convective activity ofCBL can only shift the LLJ structure to higher heights bymodifying from beneath. Otherwise, strong mixing associ-ated with the CBL is able to dilute the jet feature, causinghomogeneous winds in the CBL. Thus, the mutual strengths
of CBL forces and jet strengths can determine the persistenceof the LLJ during the daytime.
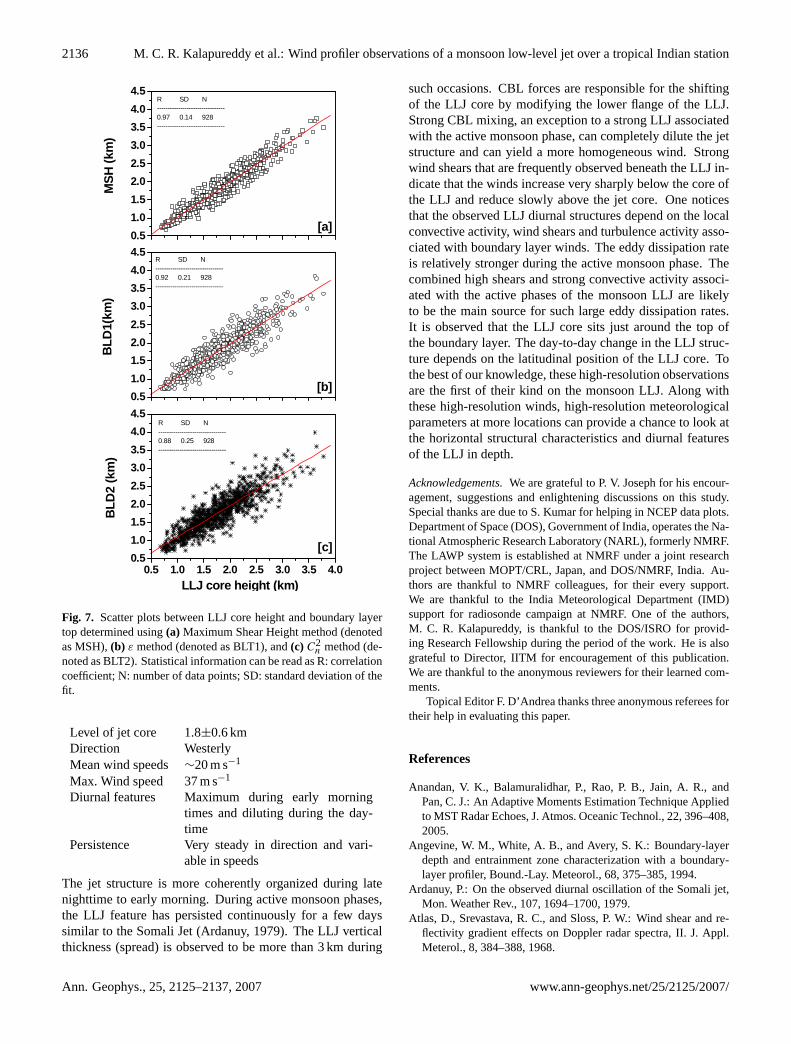
A good correlation has been found between the LLJ coreheight and the boundary layer depth determined using max-imum shear height (denoted as MSH),ε (denoted as BLD1)(e.g. Angevine et al., 1994) andC2
n (denoted as BLD2) (e.g.Sandra Jacoby-Koaly et al., 2002), with correlation coeffi-cients of 0.97, 0.92, and 0.88, respectively, seen as a scatterplot in Fig. 7. It indicates that the LLJ core is lying aroundthe boundary layer top.
4 Conclusions
Three-year high-resolution LAWP wind observations overGadanki reveal that the boreal monsoon winds are westerlyand conspicuously strong. The strongest LLJ is observed tobe associated with the active phase of the monsoon, whereasweak winds with wind reversal are noticed during the breakmonsoon phase. In brief, the observed monsoon LLJ featuresare:
www.ann-geophys.net/25/2125/2007/ Ann. Geophys., 25, 2125–2137, 2007
2136 M. C. R. Kalapureddy et al.: Wind profiler observations of a monsoon low-level jet over a tropical Indian station
High resolution Monsoon Low Level Jet characteristics over Tropical India
7
Figure 7
0.5
1.0
1.5
2.0
2.5
3.0
3.5
4.0
4.5
[a]
R SD N--------------------------------0.97 0.14 928--------------------------------
LLJ core height (km)
MS
H (
km)
0.5 1.0 1.5 2.0 2.5 3.0 3.5 4.00.5
1.0
1.5
2.0
2.5
3.0
3.5
4.0
4.5
[c]
R SD N--------------------------------0.88 0.25 928--------------------------------
BL
D2
(km
)
0.5
1.0
1.5
2.0
2.5
3.0
3.5
4.0
4.5R SD N--------------------------------0.92 0.21 928--------------------------------
[b]
BL
D1(
km)
Fig. 7. Scatter plots between LLJ core height and boundary layertop determined using(a) Maximum Shear Height method (denotedas MSH),(b) ε method (denoted as BLT1), and(c) C2
n method (de-noted as BLT2). Statistical information can be read as R: correlationcoefficient; N: number of data points; SD: standard deviation of thefit.
Level of jet core 1.8±0.6 kmDirection WesterlyMean wind speeds ∼20 m s−1
Max. Wind speed 37 m s−1
Diurnal features Maximum during early morningtimes and diluting during the day-time
Persistence Very steady in direction and vari-able in speeds
The jet structure is more coherently organized during latenighttime to early morning. During active monsoon phases,the LLJ feature has persisted continuously for a few dayssimilar to the Somali Jet (Ardanuy, 1979). The LLJ verticalthickness (spread) is observed to be more than 3 km during
such occasions. CBL forces are responsible for the shiftingof the LLJ core by modifying the lower flange of the LLJ.Strong CBL mixing, an exception to a strong LLJ associatedwith the active monsoon phase, can completely dilute the jetstructure and can yield a more homogeneous wind. Strongwind shears that are frequently observed beneath the LLJ in-dicate that the winds increase very sharply below the core ofthe LLJ and reduce slowly above the jet core. One noticesthat the observed LLJ diurnal structures depend on the localconvective activity, wind shears and turbulence activity asso-ciated with boundary layer winds. The eddy dissipation rateis relatively stronger during the active monsoon phase. Thecombined high shears and strong convective activity associ-ated with the active phases of the monsoon LLJ are likelyto be the main source for such large eddy dissipation rates.It is observed that the LLJ core sits just around the top ofthe boundary layer. The day-to-day change in the LLJ struc-ture depends on the latitudinal position of the LLJ core. Tothe best of our knowledge, these high-resolution observationsare the first of their kind on the monsoon LLJ. Along withthese high-resolution winds, high-resolution meteorologicalparameters at more locations can provide a chance to look atthe horizontal structural characteristics and diurnal featuresof the LLJ in depth.
Acknowledgements.We are grateful to P. V. Joseph for his encour-agement, suggestions and enlightening discussions on this study.Special thanks are due to S. Kumar for helping in NCEP data plots.Department of Space (DOS), Government of India, operates the Na-tional Atmospheric Research Laboratory (NARL), formerly NMRF.The LAWP system is established at NMRF under a joint researchproject between MOPT/CRL, Japan, and DOS/NMRF, India. Au-thors are thankful to NMRF colleagues, for their every support.We are thankful to the India Meteorological Department (IMD)support for radiosonde campaign at NMRF. One of the authors,M. C. R. Kalapureddy, is thankful to the DOS/ISRO for provid-ing Research Fellowship during the period of the work. He is alsograteful to Director, IITM for encouragement of this publication.We are thankful to the anonymous reviewers for their learned com-ments.
Topical Editor F. D’Andrea thanks three anonymous referees fortheir help in evaluating this paper.
References
Anandan, V. K., Balamuralidhar, P., Rao, P. B., Jain, A. R., andPan, C. J.: An Adaptive Moments Estimation Technique Appliedto MST Radar Echoes, J. Atmos. Oceanic Technol., 22, 396–408,2005.
Angevine, W. M., White, A. B., and Avery, S. K.: Boundary-layerdepth and entrainment zone characterization with a boundary-layer profiler, Bound.-Lay. Meteorol., 68, 375–385, 1994.
Ardanuy, P.: On the observed diurnal oscillation of the Somali jet,Mon. Weather Rev., 107, 1694–1700, 1979.
Atlas, D., Srevastava, R. C., and Sloss, P. W.: Wind shear and re-flectivity gradient effects on Doppler radar spectra, II. J. Appl.Meterol., 8, 384–388, 1968.
Ann. Geophys., 25, 2125–2137, 2007 www.ann-geophys.net/25/2125/2007/

M. C. R. Kalapureddy et al.: Wind profiler observations of a monsoon low-level jet over a tropical Indian station 2137
Desai, B. N., Rangachari, N., and Subramanian, S. K.: Structure oflow-level jet stream over the Arabian Sea and the Peninsula asrevealed by observations in June and July during the monsoonexperiment (MONEX) 1973 and its probable origin, Indian J.Meteorol. Hydrol. Geophys., 27, 263–274, 1976.
Findlater, J.: Cross-equatorial jet streams at low level over Kenya,Meteorological Magazine, 95, 353–364, 1966.
Findlater, J.: Some further evidence of cross-equatorial jet streamsat low level over Kenya, Meteorological Magazine, 96, 216–219,1967.
Findlater, J.: A major low level current near the Indian Ocean duringnorthern summer, Q. J. Roy. Meteor. Soc., 95, 362–380, 1969.
Findlater, J.: Mean monthly air flow at low levels over the westernIndian Ocean, Geophysical Memoirs, HMSO, London, 1971.
Findlater, J.: Observational aspects of the Low-level Cross-equatorial Jet Stream of the Western Indian Ocean, reprintedfrom Pageoph., 115, 1251–1262, 1977.
Hart, J. E., Rao, G. V., Van de Boogaard, H., Young, J. A., andFindlater, J.: Aerial observations of the East African low level jetstream, Mon. Weather Rev., 106, 1714–1724, 1978.
Joseph, P. V. and Raman, P. L.: Existence of low-level westerly jet-stream over peninsular India during July, Ind. J. Met. Geophys.,17, 437–471, 1966.
Joseph, P. V., Eischeid, J. K., and Pyle, R. J.: Interannual variabilityof the onset of the Indian summer monsoon and its associationwith atmospheric features, El Nino, and sea surface temperatureanomalies, J. Climate, 7, 81–105, 1994.
Joseph, P. V. and Sijikumar, S.: Intraseasonal Variability of theLow-Level Jet Stream of the Asian Summer Monsoon, J. Cli-mate, 17, 1449–1458, 2004.
Kalapureddy, M. C. R., Kishore Kumar, K., Siva Kumar, V., Ghosh,A. K., Jain, A. R., and Krishna Reddy, K.: Diurnal and seasonalvariability of TKE dissipation rate in the ABL over a tropicalstation using UHF wind profiler, J. Atmos. Sol. Terr. Phys., 69,419–430, 2007.
Kalnay, E., Kanamitsu, M., Kistler, R., et al.: The NCEP/NCAR40-year reanalysis project, B. Am. Meteorol. Soc., 77, 437–471,1996.
Krishnan, P. and Kunhikrishnan, P. K.: Temporal variations of ven-tilation coefficient at a tropical Indian station suing UHF windprofiler, Curr. Sci., 86, 447–451, 2004.
Krishnan, P., Kunhikrishnan, P. K., and Nair, S. M.: Time-height evolution of intraseasonal oscillations in the tropi-cal lower atmosphere, Geophys. Res. Lett., 32, L07805,doi:10.1029/2004GL022019, 2005.
Krishnamurti, T. N., Molinari, J., and Pan, H. L.: Numerical simu-lation of the Somali Jet, J. Atmos. Sci., 33, 2350–2362, 1976.
Krishnamurti, T. N., Wong, V., Pan, H. L., Pasch, R., Molinari, J.,and Ardanuy, P.: A three dimensional planetary boundary layermodel for Somalijet, J. Atmos. Sci., 40, 894–908, 1983.
Krishnamurti, T. N.: Summer monsoon experiment-A review, Mon.Weather Rev., 113, 1590–1626, 1985.
Krishna Reddy, K., Kozu, T., Ohno, Y., Nakamura, K., Sriniva-sula, P., Anandan, V. K., Jain, A. R., Rao, P. B., Ranga Rao,R., Viswanthan, G., and Rao, D. N.: lower atmospheric windprofiler at Gadanki, Tropical India: initial result, MeterologischeZeitschrift, 10, 457–466, 2001.
Krishna Reddy, K., Kozu, T., Ohno, Y., Nakamura, K., Higuchi, A.,Madhu Chandra Reddy, K., Anandan, V. K., Srinivasulu, P., Jain,
A. R., Rao, P. B., Ranga Rao, R., Viswanathan, G., and NarayanaRao, D.: Planetary boundary layer and precipitation studies usinglower atmospheric wind profiler over tropical India, Radio Sci.,37(4), 1061, doi:10.1029/2000RS002538, 2002.
Krishna Reddy, K.: Convective boundary layer information re-vealed by the lower atmospheric wind profiler over Gadanki, In-dia, Indian J. Radio Space Phys., 32, 312–319, 2003a.
Krishna Reddy, K.: Measurements of raindrop size distribution overGadanki during southwest and northeast monsoon, Indian J. Ra-dio Space Phys., 32, 286–295, 2003b.
Krishna Reddy, K.: Diagnostic study on vertical structure of trop-ical precipitating cloud systems using lower atmospheric windprofiler, Indian J. Radio Space Phys., 32, 198–208, 2003c.
Krishna Reddy, K. and Ohno, Y.: Monitoring of boundary layerwinds using a lower atmospheric wind profiler, Indian J. RadioSpace Phys., 32, 360–372, 2003d.
Madhu C. Reddy, K., Ghosh, A. K., Siva Kumar, V., Jain, A. R.,Kozu, T., and Krishna Reddy, K.: Integrated measurements ofatmospheric winds using Indian MST radar and Lower Atmo-spheric Wind Profiler (LAWP), in: Proceedings of 9th Interna-tional Workshop on Technical and Scientific Aspects of MSTRadar-MST combined with COST-76 final profiler workshopduring 13–17 March 2000, Toulouse, France, 222–225, 2000.
Mokashi, R. Y.: The axis of the tropical easterly jet stream overIndia and Cyclone, Indian J. Meteorol. Geophys., 25(1), 55–68,1974.
Newton, C. W.: Lagrangian partial-inertial oscillations, and sub-tropical and low level monsoon jet streatks, Mon. WeatherRev.,109, 2474–2486, 1981.
Riddle, A. C.: Parameterization of spectrum, in: MAP handbook,SCOSTEP Secr., edited by: Bowhil, S. A. and Edwards, B., Ur-bana,III., 9, 546–547, 1983.
Sandra Jacoby-Koaly, S., Campistron, B., Bernard, S., Blnech, B.,Ardiiuin-Girard, F., Dessens, J., Dupont, E., and Carissimo, B.:Turbulent dissipation rate in the boundary-layer via uhf wind pro-filer doppler spectral width measurements, Boundar-Lay. Mete-orol., 103, 361–389, 2002.
Stensrud, D. J., Jain, M. H., Howard, K. W., and Maddox, R. A.:Operational systems for observing the lower atmosphere: Im-portance of data sampling and archival procedures, J. Atmos.Oceanic Technol., 7, 930–937, 1990.
Stensrud, D. J.: Importance of low level jets to climate: A review,J. Climate, 9, 1698–1711, 1996.
Stull, R. B.: An introduction to Boundary Layer Meteorology,Kluwer Academic publication, Boston, 500–522, 1990.
White, A. B.: Mixing depth detection using 915-MHz radar reflec-tivity data, Proceedings of the 8th symposium on meteorologi-cal observations and instrumentation, Anaheim, CA, AmericanMeteorological Society, 45 Beacon St., Boston, MA, 248–250,1993.
Wipperman, F.: Numerical study on the effects controlling the lowlevel jet, Beitr. Phys. Atmos., 46, 137–154, 1973.
Woodman, R. F.: Spectral moment estimation in MST radars, RadioSci., 20(6), 1185–1195, 1985.
Yihua Wu and Sethu Raman: The summertime Great Plains lowlevel jet and the effects of its origin on moisture transport,Boundary-Lay. Meteorol., 88, 445–466, 1998.
www.ann-geophys.net/25/2125/2007/ Ann. Geophys., 25, 2125–2137, 2007