Embed Size (px)
Citation preview

FEBRUARY 1998 257F L A G G E T A L .
q 1998 American Meteorological Society
Operating an Acoustic Doppler Current Profiler aboard a Container Vessel
C. N. FLAGG
Brookhaven National Laboratory, Upton, New York
G. SCHWARTZE, E. GOTTLIEB, AND T. ROSSBY
Graduate School of Oceanography, University of Rhode Island, Narragansett, Rhode Island
(Manuscript received 16 August 1996, in final form 10 April 1997)
ABSTRACT
Since October 1992 an acoustic Doppler current profiler (ADCP) has been in near-continuous operation onboard a 118-m-long container vessel, the container motor vessel Oleander, which operates on a weekly schedulebetween Port Elizabeth, New Jersey, and Hamilton, Bermuda. The ADCP collects information on currents fromthe surface to depths as great as 404 m depending on zooplankton concentrations, ship’s speed, sea stateconditions, and the ship’s load factor. The southbound transits provide more and better data because the ship isloaded and rides deeper resulting in less bubble formation and entrainment underneath the vessel.
Installation and operation of an ADCP on a cargo ship has involved a number of factors not typical of researchvessels. Providing a data acquisition system that could operate on its own without assistance from the ship’sofficers and that could recover from problems was the first issue. Isolating and removing electrical transientsfrom the ship’s electrical system was extremely challenging. The presence of bubbles underneath the vessel dueto variable draft and in heavy weather conditions significantly limits the performance of the ADCP. Thesedifficulties not withstanding, the system is working well and is delivering good data on the southbound legs inmost weather conditions and on the northbound legs under more favorable weather conditions. Starting in 1995,differential and attitudinal global positioning system enhancements have made significant improvements tonavigational accuracy and ship’s heading data.
1. Introduction
The merchant marine fleet in the North Atlantic isvastly larger than the number of U.S. Navy vessels op-erating on the high seas and these, in turn, exceed thenumber of oceanographic research vessels by anotherorder of magnitude. So, in terms of access to the openocean, commercial shipping offers far more opportu-nities than research vessels possibly can. Further, mer-chant marine vessels tend to be in continuous use. Somevessels have equipment for conducting and transmittingroutine weather observations, and a subset of these alsomakes regular measurements of the upper ocean thermalstructure using expendable bathythermographs (XBTs).One such vessel is the CMV Oleander, a container ves-sel that makes weekly trips to Bermuda from Port Eliz-abeth, New Jersey.
Since 1981 the ship and its predecessor have takenXBT and surface water samples across the continentalshelf and slope waters to the Gulf Stream for the Na-
Corresponding author address: Dr. Tom Rossby, Graduate Schoolof Oceanography, University of Rhode Island, Narragansett Bay Cam-pus, Narragansett, RI 02881.E-mail: [email protected]
tional Marine Fisheries Service on a monthly basis(Benway et al. 1993). At the same time, it also tows aHardy continuous plankton recorder (CPR) to make un-derway measurements of zooplankton population den-sities (Tambs-Lyche 1984). We began to consider thepossibility of installing an acoustic Doppler current pro-filer (ADCP) system to make continuous underway mea-surements of upper ocean currents along the entire tran-sit, and particularly across the Gulf Stream. When itwas learned that a new ship was under construction, weapproached the ship operators, Bermuda ContainerLines, about the possibility of installing a sea chest inthe hull for an ADCP system. The suggestion was re-ceived favorably and before the ship was launched, acofferdam (a sealed-off section) between the hull andhold was constructed, along with the necessary plumb-ing and conduits for venting and electrical connections.At the ship’s first dry-dock period after launch theADCP’s sea chest was installed within the cofferdam.
The energetic variability of the Gulf Stream over avery wide range of timescales is the motivating interestfor such a program. It has proved to be very difficultto obtain solid information on the low-frequency (sea-sonal to interannual) variability of mass and heat trans-ported by the Gulf Stream. The difficulty is that themeandering of the current is so large that single sections

258 VOLUME 15J O U R N A L O F A T M O S P H E R I C A N D O C E A N I C T E C H N O L O G Y
FIG. 1. Artist’s view of the CMV Oleander at sea. Specifications are 118.62-m length, 19.8-m breadth, 6.26-m summer draught,6253 metric ton deadweight, and 8.2 m s21 cruise speed. (Painting by S. J. Card, owned by Bermuda Container Lines Ltd.)
say virtually nothing about underlying long-term meanflows and trends (Iselin 1940; Worthington 1976; Satoand Rossby 1995). One way to overcome the aliasingby the energetic meandering of the current would be tosample the current much more frequently so that thehigh-frequency fluctuations can be averaged out. Thehigh cost of research vessels precludes their use, so theidea of working with the CMV Oleander stood out asa very attractive alternative. The regular traffic to Ber-muda would provide unprecedented and regular sam-pling of the upper ocean currents along the transit. Ifsuch a program could be maintained for several years,it might be possible to separate out oceanic variabilityspanning a wide range of timescales, that is, from weeksto years. Further, the ship transits several oceanic re-gimes: the continental shelf, the shelf break, the slopewaters, the Gulf Stream, and the northwestern SargassoSea, each with its own distinctive characteristics. Fi-nally, the ADCP acoustic backscatter intensity can pro-vide useful information on zooplankton population den-sities and their spatial and temporal variability (Flaggand Smith 1989).
This paper reports on the installation and operationof the ADCP system onboard the CMV Oleander shownin Fig. 1. The system is working very well, but a largenumber of technical and software issues had to be re-solved along the way, many of which were due to op-erational differences between research vessels and com-mercial freighters. We believe it is useful to discussthese difficulties so that they can be anticipated moreeffectively in future efforts.
The CMV Oleander is a diesel-powered vessel builtin 1990 at the Van Der Glessen/De Noord shipyard inthe Netherlands and replaces an earlier ship of the same
name. The vessel, which has a bulbous bow, is 118 mlong and 20 m wide with a deadweight of 6250 metrictons. It draws 5.2 m aft and 0.6 m less at the bow whenfully loaded. These numbers reflect typical conditionsduring the outbound transits to Bermuda. On the in-bound return trips when the ship is lightly loaded, typ-ical draft is 4.8 m aft and 0.8 m less at the bow. Figure2 shows the outline of the vessel. The ship typicallysteams at about 16 kt. Thrust is supplied by a singlevariable-pitch propeller driven by an in-line eight cyl-inder 7340 hp diesel engine. Electrical power is pro-vided by diesel generators while in port and from a driveshaft generator at sea. Approximately 2 h after leavingor before entering port, the electrical service is switchedfrom one system to the other. This switch-over and othersurges can cause significant electrical transients thatpropagate throughout the electrical distribution system.
2. System description
The ship’s large size, the limitations on ADCP cablelengths, and the need to provide suitable access andenvironmental protection for the components made itnecessary to distribute parts of the ADCP systemthroughout the ship. The basic components consist ofthree subsystems, as shown in Fig. 3: 1) computers andsupport electronics on the bridge, 2) the ADCP deckunit in the engine room, and 3) the narrowband ADCPtransducer mounted in a sea chest forward betweenholds two and three. Multiconductor cable is used tointerconnect the subsystems and this has proven to besusceptible to electrical interference, which has beendifficult to diagnose and eliminate.
The usual arrangement for shipboard ADCP systems

FEBRUARY 1998 259F L A G G E T A L .
FIG. 2. Schematic view of the CMV Oleander. The ship is flat-bottomed, a characteristic ofmost container vessels. Shown are the locations of the ADCP transducer and sea chest betweenholds 2 and 3, the ADCP deck unit in the engine room, and the computers and navigationequipment in the radio room on the bridge.
FIG. 3. Block diagram of the electrical interfacing among the ADCP transducer, deck unit(DU), DAS, and NAV computers, gyrocompass, and GPS receivers.
is to connect both the data acquisition PC and the ship’sgyrocompass directly to the deck unit. Usually, the PCto deck unit connection is by a parallel cable, but be-cause of their physical separation we used a serial con-nection operating at 19.2 kbaud. Also, because of severeelectrical noise (to be discussed) it was not possible toconnect the ship’s gyrocompass to the deck unit. Thismeant that another method was needed to get the ship’sheading into the ADCP data stream. This was accom-
plished through a software modification to the data ac-quisition system using a second navigation PC that read,reformatted, and forwarded the heading data by serialline to the main data acquisition PC. A modified versionof RD Instruments’ DAS 2.48 data acquisition softwarefor narrowband ADCPs, the AutoADCP system, con-trolled the ADCP operations and data acquisition.
A custom-made desk and cabinet were installed onthe bridge in the ship’s radio room to accommodate four
260 VOLUME 15J O U R N A L O F A T M O S P H E R I C A N D O C E A N I C T E C H N O L O G Y
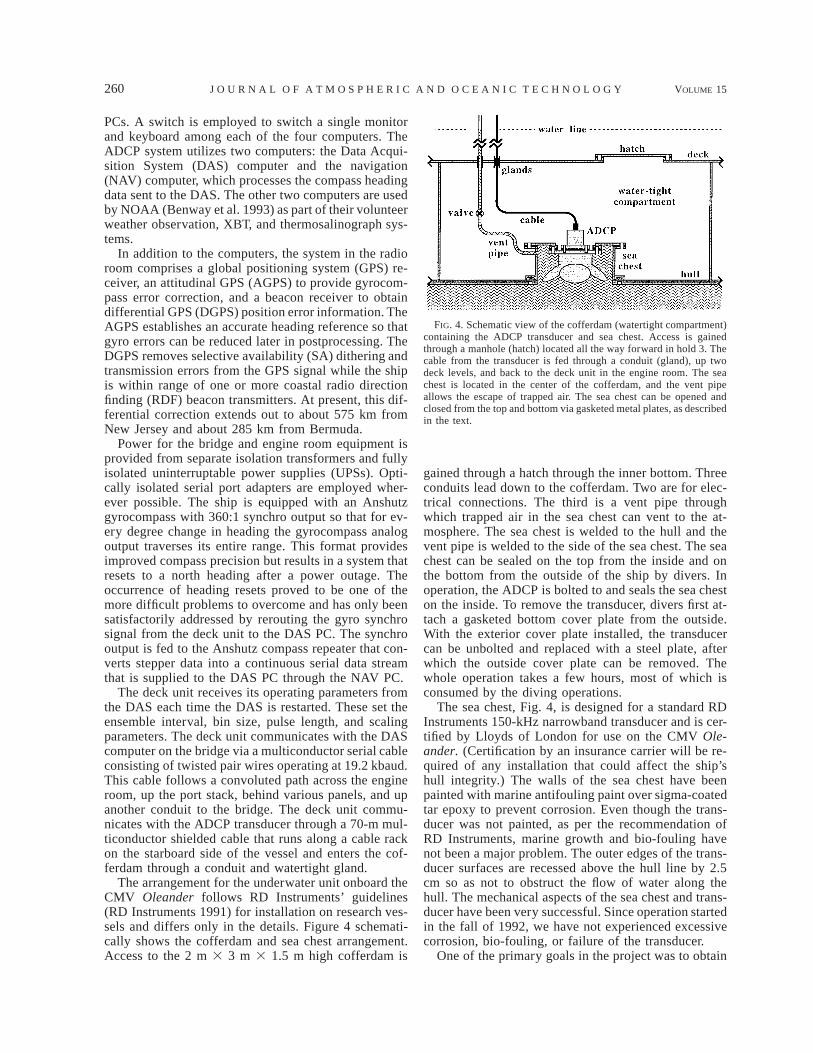
FIG. 4. Schematic view of the cofferdam (watertight compartment)containing the ADCP transducer and sea chest. Access is gainedthrough a manhole (hatch) located all the way forward in hold 3. Thecable from the transducer is fed through a conduit (gland), up twodeck levels, and back to the deck unit in the engine room. The seachest is located in the center of the cofferdam, and the vent pipeallows the escape of trapped air. The sea chest can be opened andclosed from the top and bottom via gasketed metal plates, as describedin the text.
PCs. A switch is employed to switch a single monitorand keyboard among each of the four computers. TheADCP system utilizes two computers: the Data Acqui-sition System (DAS) computer and the navigation(NAV) computer, which processes the compass headingdata sent to the DAS. The other two computers are usedby NOAA (Benway et al. 1993) as part of their volunteerweather observation, XBT, and thermosalinograph sys-tems.
In addition to the computers, the system in the radioroom comprises a global positioning system (GPS) re-ceiver, an attitudinal GPS (AGPS) to provide gyrocom-pass error correction, and a beacon receiver to obtaindifferential GPS (DGPS) position error information. TheAGPS establishes an accurate heading reference so thatgyro errors can be reduced later in postprocessing. TheDGPS removes selective availability (SA) dithering andtransmission errors from the GPS signal while the shipis within range of one or more coastal radio directionfinding (RDF) beacon transmitters. At present, this dif-ferential correction extends out to about 575 km fromNew Jersey and about 285 km from Bermuda.
Power for the bridge and engine room equipment isprovided from separate isolation transformers and fullyisolated uninterruptable power supplies (UPSs). Opti-cally isolated serial port adapters are employed wher-ever possible. The ship is equipped with an Anshutzgyrocompass with 360:1 synchro output so that for ev-ery degree change in heading the gyrocompass analogoutput traverses its entire range. This format providesimproved compass precision but results in a system thatresets to a north heading after a power outage. Theoccurrence of heading resets proved to be one of themore difficult problems to overcome and has only beensatisfactorily addressed by rerouting the gyro synchrosignal from the deck unit to the DAS PC. The synchrooutput is fed to the Anshutz compass repeater that con-verts stepper data into a continuous serial data streamthat is supplied to the DAS PC through the NAV PC.
The deck unit receives its operating parameters fromthe DAS each time the DAS is restarted. These set theensemble interval, bin size, pulse length, and scalingparameters. The deck unit communicates with the DAScomputer on the bridge via a multiconductor serial cableconsisting of twisted pair wires operating at 19.2 kbaud.This cable follows a convoluted path across the engineroom, up the port stack, behind various panels, and upanother conduit to the bridge. The deck unit commu-nicates with the ADCP transducer through a 70-m mul-ticonductor shielded cable that runs along a cable rackon the starboard side of the vessel and enters the cof-ferdam through a conduit and watertight gland.
The arrangement for the underwater unit onboard theCMV Oleander follows RD Instruments’ guidelines(RD Instruments 1991) for installation on research ves-sels and differs only in the details. Figure 4 schemati-cally shows the cofferdam and sea chest arrangement.Access to the 2 m 3 3 m 3 1.5 m high cofferdam is
gained through a hatch through the inner bottom. Threeconduits lead down to the cofferdam. Two are for elec-trical connections. The third is a vent pipe throughwhich trapped air in the sea chest can vent to the at-mosphere. The sea chest is welded to the hull and thevent pipe is welded to the side of the sea chest. The seachest can be sealed on the top from the inside and onthe bottom from the outside of the ship by divers. Inoperation, the ADCP is bolted to and seals the sea cheston the inside. To remove the transducer, divers first at-tach a gasketed bottom cover plate from the outside.With the exterior cover plate installed, the transducercan be unbolted and replaced with a steel plate, afterwhich the outside cover plate can be removed. Thewhole operation takes a few hours, most of which isconsumed by the diving operations.
The sea chest, Fig. 4, is designed for a standard RDInstruments 150-kHz narrowband transducer and is cer-tified by Lloyds of London for use on the CMV Ole-ander. (Certification by an insurance carrier will be re-quired of any installation that could affect the ship’shull integrity.) The walls of the sea chest have beenpainted with marine antifouling paint over sigma-coatedtar epoxy to prevent corrosion. Even though the trans-ducer was not painted, as per the recommendation ofRD Instruments, marine growth and bio-fouling havenot been a major problem. The outer edges of the trans-ducer surfaces are recessed above the hull line by 2.5cm so as not to obstruct the flow of water along thehull. The mechanical aspects of the sea chest and trans-ducer have been very successful. Since operation startedin the fall of 1992, we have not experienced excessivecorrosion, bio-fouling, or failure of the transducer.
One of the primary goals in the project was to obtain

FEBRUARY 1998 261F L A G G E T A L .
FIG. 5. AutoADCP configuration regions for the CMV Oleanderalong its route from New Jersey to Bermuda. The dashed line rep-resents the 100-m isobath.
ADCP transects every time the ship made a run betweenNew Jersey and Bermuda, not just at those intervalswhen a NOAA observer went along to make XBT ob-servations. However, during discussions with the ship’sowners and captains, we were clearly warned that whilethey welcomed the project, they could not provide thepersonnel to monitor the equipment. Thus, an importantfeature of the system was that it had to be able to runautonomously for at least the weeklong round-trip to Ber-muda and hopefully for several weeks to minimize travelto and from the ship. There were two primary require-ments that such an autonomous system had to meet. First,it had to be able to recover from inadvertent interruptionscaused by power failures, software faults, or unintentionalkeyboard entries. Second, it had to be able to change theconfiguration of the ADCP’s data acquisition since theship was going to transit from shallow to deep water andback again. We also wanted the system to be able to backup completed data files to a separate disk and to keeplog files of any changes or errors in the system. A lastconsideration was that we wanted to use the same meth-odology for collecting the data as in RD Instruments DAS2.48 software because it had been well tested by thecommunity and was ‘‘thoroughly’’ understood.
Our options in this regard were either to write a spe-cialized version of RD Instruments’ data acquisition sys-tem with various autonomous features or to modify theexisting program. J. Lewkowitz, then at RD Instruments,proposed that he could meet our needs through the useof ‘‘user exit’’ programs within the current DAS frame-work. This he did through a set of routines that makeup what is collectively called the AutoADCP softwarepackage. In sequence, this is how the system works.After boot-up, the DAS PC’s AUTOEXEC.BAT filecalls a batch file named FLAGEXEC.BAT, which de-fines the backup directory, turns on the ability to readheading data from the NAV PC, starts a software watch-dog timer, and finally starts the DAS 2.48 acquisitionprogram. Within the DAS there is a user exit program,HEAD.EXE, which reads the heading data provided bythe NAV PC from the serial port after each ping andputs it in the data stream. Another user exit program,FLAG.EXE, compares the ship’s position at the end ofeach ensemble against the set of predefined polygonalregions, shown in Fig. 5, to see if the ship has passedfrom one region to another. If not, the data acquisitioncontinues. However, if there has been a region change,FLAG.EXE then copies a predefined configuration filethat applies to the new region into the DAS’s defaultconfiguration file and reboots the PC. Upon rebooting,the ADCP automatically starts pinging, using the con-figuration appropriate for the new region. Thus, suchthings as pulse length, bin size, and the use of bottomtracking, etc., can easily be altered as required. TheAutoADCP continues to operate in port although it isusually configured not to record any data and to dominimal pinging. Once the ship leaves the port region,a new configuration that turns on the usual ADCP func-
tions is set into operation. FLAG.EXE also resets thewatchdog timer at the end of each ensemble, annotatesconfiguration changes in a log file, and copies a com-pleted ping data file to a backup disk.
Another modification to the DAS 2.48 that we haveincorporated into the system is the UE4.EXE routinegenerated by Dr. E. Firing at the University of Hawaii.This is another user exit program that, in this case, re-places RD Instruments’ NAVSOFT.EXE and providesthe user the choice of any of four communications portson the DAS PC for navigation data. UE4’s primary func-tion is to improve navigation by recording the ship’sGPS position precisely at the end of the ensembles thusallowing for more precise computation of the ship’s ve-locity. A secondary function that has become relativelymore important is the processing and recording of head-ing data from the attitudinal GPS unit. These data areused during post cruise processing to reduce gyro head-ing errors.
To collect acoustic backscatter intensity data for pos-sible use in generating a climatology of zooplanktonabundance along the section using the CMV Oleander’sADCP, we included the AGCAVE.EXE user exit pro-gram in the configuration. This routine calculates andstores the ensemble averaged backscatter intensity pro-files from each of the ADCP’s four transducers.
262 VOLUME 15J O U R N A L O F A T M O S P H E R I C A N D O C E A N I C T E C H N O L O G Y
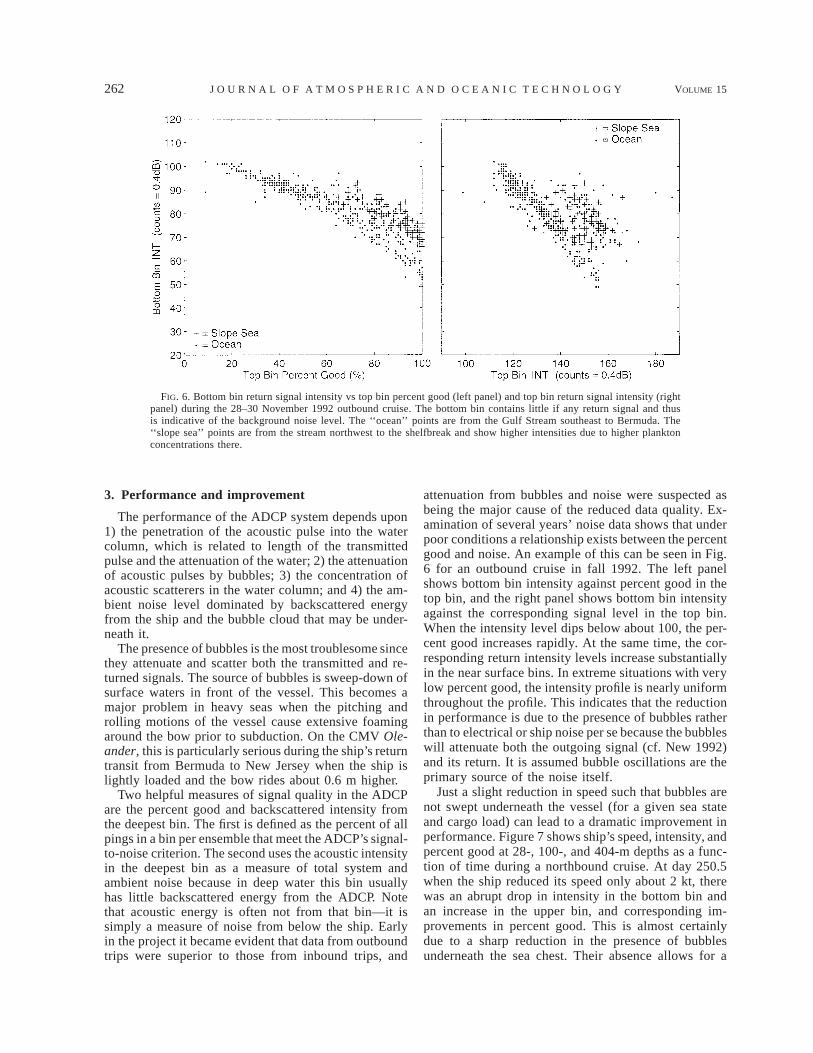
FIG. 6. Bottom bin return signal intensity vs top bin percent good (left panel) and top bin return signal intensity (rightpanel) during the 28–30 November 1992 outbound cruise. The bottom bin contains little if any return signal and thusis indicative of the background noise level. The ‘‘ocean’’ points are from the Gulf Stream southeast to Bermuda. The‘‘slope sea’’ points are from the stream northwest to the shelfbreak and show higher intensities due to higher planktonconcentrations there.
3. Performance and improvement
The performance of the ADCP system depends upon1) the penetration of the acoustic pulse into the watercolumn, which is related to length of the transmittedpulse and the attenuation of the water; 2) the attenuationof acoustic pulses by bubbles; 3) the concentration ofacoustic scatterers in the water column; and 4) the am-bient noise level dominated by backscattered energyfrom the ship and the bubble cloud that may be under-neath it.
The presence of bubbles is the most troublesome sincethey attenuate and scatter both the transmitted and re-turned signals. The source of bubbles is sweep-down ofsurface waters in front of the vessel. This becomes amajor problem in heavy seas when the pitching androlling motions of the vessel cause extensive foamingaround the bow prior to subduction. On the CMV Ole-ander, this is particularly serious during the ship’s returntransit from Bermuda to New Jersey when the ship islightly loaded and the bow rides about 0.6 m higher.
Two helpful measures of signal quality in the ADCPare the percent good and backscattered intensity fromthe deepest bin. The first is defined as the percent of allpings in a bin per ensemble that meet the ADCP’s signal-to-noise criterion. The second uses the acoustic intensityin the deepest bin as a measure of total system andambient noise because in deep water this bin usuallyhas little backscattered energy from the ADCP. Notethat acoustic energy is often not from that bin—it issimply a measure of noise from below the ship. Earlyin the project it became evident that data from outboundtrips were superior to those from inbound trips, and
attenuation from bubbles and noise were suspected asbeing the major cause of the reduced data quality. Ex-amination of several years’ noise data shows that underpoor conditions a relationship exists between the percentgood and noise. An example of this can be seen in Fig.6 for an outbound cruise in fall 1992. The left panelshows bottom bin intensity against percent good in thetop bin, and the right panel shows bottom bin intensityagainst the corresponding signal level in the top bin.When the intensity level dips below about 100, the per-cent good increases rapidly. At the same time, the cor-responding return intensity levels increase substantiallyin the near surface bins. In extreme situations with verylow percent good, the intensity profile is nearly uniformthroughout the profile. This indicates that the reductionin performance is due to the presence of bubbles ratherthan to electrical or ship noise per se because the bubbleswill attenuate both the outgoing signal (cf. New 1992)and its return. It is assumed bubble oscillations are theprimary source of the noise itself.
Just a slight reduction in speed such that bubbles arenot swept underneath the vessel (for a given sea stateand cargo load) can lead to a dramatic improvement inperformance. Figure 7 shows ship’s speed, intensity, andpercent good at 28-, 100-, and 404-m depths as a func-tion of time during a northbound cruise. At day 250.5when the ship reduced its speed only about 2 kt, therewas an abrupt drop in intensity in the bottom bin andan increase in the upper bin, and corresponding im-provements in percent good. This is almost certainlydue to a sharp reduction in the presence of bubblesunderneath the sea chest. Their absence allows for a

FEBRUARY 1998 263F L A G G E T A L .
FIG. 7. Percent good (top panel), return signal intensity (middle), and ship speed (bottom) vstime for the 7–9 October 1993 inbound cruise. The percent good and intensity are shown asoffset curves for the bins centered at 404, 100, and 28 m. The vertical axis applies to thebottommost curve, and the other curves are successively offset upward by the indicated amount.
stronger signal out and back, hence the increase in in-tensity in the upper bin, a slight increase in the middlebin, and a sharp drop near the bottom of the profile.But the bottom bin is too far away for any return signalto be detected—confirmed by the lack of increase inpercent good—so it actually represents a drop in am-bient noise under the vessel. Note the sharp increase inbottom bin intensity at day 251.0 when the ship’s speedwas increased approximately 1 kt. Since the bottom ofthe hull is perfectly flat and rather unlike research ships,bubbles probably blanket the whole underside of thevessel once bubble sweep-down starts.
Strong evidence for the presence of bubbles underneaththe ship in heavy seas also was found by measuring therate of pressure increase in the sea chest vent pipe whileit was sealed at the top. This was done several times invarying weather conditions. In good weather the vent pipeshowed no increased pressure when capped, whereas inpoor weather the pressure buildup was very rapid (min-utes).
The amount of successfully returned ADCP data has
steadily increased since the beginning of the measurementsin August 1992 as multiple problems were overcome. Inparticular, the system reliability and number of cruisesavailable increased greatly after October 1995 due to theinstallation of UE4.EXE (mentioned previously) and theupgrading and reconfiguration of the electrical system (tobe discussed). During the period from October 1992through January 1997, omitting missing cruises due tosystem upgrades, instrument failures, drydocking, holi-days, totally bad weather, and those cruises that will berecovered later, there remain 141 outbound and 126 in-bound cruises. Considering just the velocity data at 50 m,the number of cruises with gaps of less than 60 km any-where along the track is 83 outbound and 32 inbound,while the number of cruises with gaps of less than 20 kmin the Gulf Stream is 99 outbound and 53 inbound. Themean percentage of profiles containing any good data is89% outbound and 70% inbound. Of those profiles, themean percentage containing good velocity data at 50-,100-, 150-, 250-, and 350-m depths are 96%, 91%, 75%,

264 VOLUME 15J O U R N A L O F A T M O S P H E R I C A N D O C E A N I C T E C H N O L O G Y
TABLE 1. Summary of bottom-track results. Angle is the misalignment angle (degrees), diff is the difference between outbound and inboundangle values, scale is the speed scale factor, N is the number of samples comprising each mean, and each sample is a 30–40-min average.1993 and 1994 are bottom track only, and thus the misalignment angle is between the gyrocompass and the ADCP transducer. For 1995angle represents the angular offset between the AGPS and transducer.
Year N
Outbound
Angle
Mean Std
Scale
Mean Std
Inbound
Angle
Mean Std
Scale
Mean Std Diff
199319941995
141212
21.4320.31
1.89
0.140.410.06
1.0111.0141.012
0.0030.0070.003
0.561.751.89
0.160.290.07
1.0201.0151.015
0.0180.0100.003
1.992.060
44%, and 9%, respectively, for outbound, and 92%, 70%,38%, 13%, and 4%, respectively, for inbound.
4. Navigation
a. Gyrocompass
Determination of geographic-referenced velocities re-quires knowing the ADCP transducer’s orientation rel-ative to the ship’s compass and the ship’s motion whileacquiring the ship-referenced velocity profiles. The ac-curacy of geographic-referenced velocity depends cru-cially upon the calibration and stability of the gyrocom-pass and GPS navigation systems used to track the ship.
The importance of the gyrocompass accuracy and re-peatability to the ultimate accuracy of the ADCP ve-locity profiles is very easy to appreciate. At a typicalvessel speed of 8 m s21, a heading error of 18 (51/57radians) will lead to an apparent cross-track velocity of8/57 5 0.14 m s21! This would be unacceptably large;fortunately, this happens only very rarely and can usu-ally be detected, as will be pointed out below. The head-ing given by the gyrocompass depends in complex andsubtle ways not merely upon the heading of the shipbut also on its latitude, speed, and heading as well asrecent changes in speed and heading (Griffiths 1994).These reflect the fact that the gyrocompass is sensitiveto accelerations and will execute a damped oscillationwith a period of 84 min, the so-called Schuler oscillation(Pollard and Reed 1989). Because the Oleander’s courseis a straight line between New Jersey and Bermuda, themost significant errors in gyrocompass data occur duringperiods of heavy rolling (see below).
b. Bottom tracking
Gyrocompass heading error can be reduced wheneveran outside reference heading is available. The traditionalmethod of obtaining a reference heading for the ADCPis to use the bottom track mode (see Pollard and Read1989). In this mode the ship’s velocity over the bottomis obtained from the Doppler shift of the bottom-re-flected echoes. Comparing this with ship velocity esti-mated from first differencing successive GPS positionfixes yields a speed error or scale factor and a headingoffset or misalignment angle between the gyrocompass
and ADCP transducer. These are estimated routinely foreach transit across the shelf. The results are summarizedin Table 1 for 1993 and 1994.
The 1.18 difference in mean angle between 1993 and1994 is because the ADCP was removed for serviceduring dry-docking. The angle and scale values in Table1 are shown separately for the out- and inbound transitsfor 1993 and 1994 to highlight the 28 difference in gy-rocompass heading error (last column). This headingdependence of the gyrocompass error agrees quite wellwith that of King and Cooper (1994).
The bottom-tracking analysis was made difficult bya problem we referred to as ‘‘shelf contamination,’’which was resolved in January 1997. This problem oc-curred only over the shelf when the bottom was withinrange of the ADCP and caused speed biases in the di-rection of travel of up to 1 m s21. Instances of thiscontamination also appeared to be related to sea state.Analysis to date suggests that the problem was due tothe inclusion of depth bins contaminated by the bottomreturn in the DAS reference layer calculation. Reflectedenergy within the ADCP’s nearly vertical acoustic side-lobes would bias the Doppler shift low, thereby intro-ducing a bias in the recorded water velocities in thedirection of travel. The difficulty with this theory is thatthe problem sometimes occurred when the reference lay-er was well above the bottom. The problem was un-expected since to our knowledge it had not been a factoron research vessels operating in shallow waters, so itmay be related to the CMV Oleander’s hull form, whichis much longer, wider, and flatter. The approach we havetaken simply was to turn off the reference layer cal-culation in the shallow water regions and this has elim-inated or at least vastly reduced the problem. The effectof the problem on bottom track calibrations was avoidedby disgarding runs where the scale factor deviated bymore than a few percent from 1.0.
c. Attitudinal GPS
The second approach to providing a stable referenceheading is through use of an AGPS, which we havebeen operating since June 1995. The AGPS (an Ashtech3DF) uses differential carrier phase measurements fromfour antennas to determine ship’s heading, roll, and pitch

FEBRUARY 1998 265F L A G G E T A L .
FIG. 8. Heading difference (dh) vs time for the 1–3 December 1995 outbound cruise (toppanel) and the 5–7 March 1996 inbound cruise (bottom); dh is the difference between the headingsmeasured by the gyrocompass and the AGPS, and thus is an indicator of gyrocompass error.
FIG. 9. Probability of GPS dithering (civilian degradation) resultingin an apparent speed greater than a certain value as a function oftime interval in minutes. The short curve to the lower left is forbeacon-corrected (differential) GPS.
as a function of time. With an antenna separation of afew meters the heading resolution is less than 0.18, andthe roll and pitch are twice that (Ashtech 1994). Theangular offsets of the ADCP relative to the Ashtechantennas are also summarized in Table 1 for 1995. Thelarger standard deviations in 1993 and 1994 than in 1995are due to the errors in the gyrocompass heading com-pared to that of the AGPS. While the AGPS significantlyreduces the geographic-referenced velocity errors, it
cannot replace the gyrocompass because of data lapsesprimarily due to shadowing of the satellites by the ship’smast. The heading data are used to correct the gyro errorwhen processing the velocity data; the roll and pitchdata have been useful in determining the ship’s responseto sea state and thus the likelihood of bubbles under thehull. Figure 8 shows a typical plot of the heading dif-ference between the AGPS and gyrocompass. TheAGPS heading is available more than 70% of the time.Fortunately, much of the gyro error varies slowly intime such that it can be estimated by interpolation orcurve fitting. In 1995 the misalignment angle in Table1 is calculated between the AGPS antenna array and theADCP transducer, and the difference between outboundand inbound is zero.
d. Differential GPS
Since determination of geographic-referenced veloc-ities requires knowing the actual speed over the bottom,any errors in GPS position will reduce the accuracy ofthe calculated velocities. As is well known, the accuracyof the SA GPS code is degraded by introduction of aslight ‘‘dithering’’ by the military (Magnavox 1991).The stated accuracy under these conditions is that thecomputed position is within 100 m of the correct po-sition 95% of the time. This has a significant short-termeffect on ADCP velocity estimates, which can be seenby computing the apparent speed of the ship due simplyto the dithering of position. Figure 9 shows the prob-ability (based on a 5-min sampling rate for 24 h in

266 VOLUME 15J O U R N A L O F A T M O S P H E R I C A N D O C E A N I C T E C H N O L O G Y
FIG. 10. Velocity components (geographic U and V) averaged be-tween 40- and 128-m depth vs time (decimal days) for the 28–30May 1996 inbound cruise, showing the difference between velocitiescomputed from GPS data with (smooth portions) and without (spikyportions) the differential correction. Typically, the DGPS beacon sig-nal is receivable out to 575 km from New Jersey (just past the GulfStream) and 285 km from Bermuda.
Hamilton, Bermuda) of apparent speed exceeding a giv-en value for three different time intervals. The proba-bility of apparent speed exceeding 0.1 m s21 is less than0.4 and 0.08, for GPS positions 5 and 10 min apart,respectively. The general conclusion is that ditheringintroduces significant velocity errors for individual en-sembles, but its effect is lessened for averages spanning20 min or more. For 20-min intervals the probability ofan error greater than 0.05 m s21 is approximately 0.08.The main impact of the dithered signal is to decreasethe spatial resolution of the ADCP data.
However, the dithering can be eliminated by usingDGPS corrections from shore-based reference stationstransmitting from RDF beacons. This network of beacontransmitters, with a range of 350–650 km, is maintainedby the U.S. Coast Guard and the government of Ber-muda. We upgraded our GPS (a Leica MX-4200) toaccept differential corrections beginning in June 1995.Since the CMV Oleander operates within range of sev-eral RDF beacons, we chose a beacon receiver (North-star 8401) able to monitor and automatically select thestrongest of several beacon signals. Figure 10 illustratesthe contrast in velocity noise when receiving and notreceiving the corrections. Out to approximately 575 kmfrom New Jersey (just past the Gulf Stream) and withinapproximately 285 km of Bermuda the velocity is verysmooth. In between, where no DGPS is available, the5-min ensemble velocity data show a variability on theorder of 60.15 m s21 due to the dithering. It is alsoevident from the figure that the fluctuations have limitedimpact once the data have been smoothed.
5. Electrical noise
The biggest problem with the ADCP installation onthe CMV Oleander has been diagnosing and containingelectrical interference from the ship’s power grid. De-spite a careful initial effort to lay out the system’s elec-trical components in a traditional star pattern to mini-mize ground loops, it became clear almost immediatelythat the ADCP system’s performance was very sensitiveto electrical noise and power disturbances. These prop-agate easily into and cause a range of difficulties in theADCP system such as unintentional and unexplainedrebooting of the DAS PC to more serious problems suchas a catastrophic failure of the deck unit, DAS computer,or GPS. As is typical of commercial ships, the ship’selectrical power is derived from an 800-kW shaft gen-erator at sea or one of three auxiliary 410-kW CaterpillarV-12 diesel electrical generators when in port. The shaftgenerator runs directly off the propeller shaft. The linevoltage is specified to be 110 VAC but observationsshow it closer to 104 VAC under normal conditions.The origin of some transients have been traced to start-ing and stopping the bow thruster and to the hydraulicpump motor that operates the ship’s stern ramp.
In the early days of the program, the ADCP PCs andthe deck unit would often reset due to the large powertransients when the ship switched from the auxiliary tothe shaft generator and back again. Line transients be-come more common in heavy weather when the pro-peller breaches the surface, causing shaft rpm fluctua-tions. Resets occurring during heavy weather have beenestablished from the ship’s weather log and more re-cently from the AGPS roll and pitch data. Power fluc-tuations occur frequently at these times and can be soacute that in the most severe weather the crew some-times switch over to the auxiliary generator. However,even when operating from the auxiliary generator, tran-sients have been a problem.
To reduce and if possible eliminate susceptibility tothe power line transients, separate uninterruptable powersupplies were installed for the computers and deck unit.Initially, we installed American Power Conversionstandby UPSs. These UPSs are inexpensive and workvery effectively in the office but caused ground faultsto occur within the ship’s power distribution system.Merchant ships use a power distribution scheme inwhich both line and neutral are isolated from ground.If either side of the line develops continuity to the hullof the ship, a ground fault condition will be indicatedon the ship’s electrical equipment. Thus, these UPSswere replaced by on-line UPSs (Clary Corporation) andTopaz isolation transformers. Also, an optical isolatorwas added on the serial line between the DAS PC andthe deck unit to further reduce possible noise. Thesehelped but did not entirely remove the problem.
A more serious difficulty came from electrical tran-sients that reset the deck unit, initiating a new headerin the ping data file, zeroing the heading, and thereby

FEBRUARY 1998 267F L A G G E T A L .
FIG. 11. Flow diagram of the ADCP data processing.
losing the absolute heading. Rerouting the gyro synchrosignal from the deck unit to the DAS PC through theNAV PC eliminated the occurrence of these resets (April1993). The absolute heading after one of these resetswas almost completely recoverable by just taking thedifference in headings before and after the reset androtating the data by this offset during postprocessing.This correction was possible because the ship steamson a nearly constant heading for most of its journey.Although some loss of accuracy could not be avoided,we believe that the corrections are good to 60.38.
Even after very carefully reviewing and testing forground loops and eliminating one possibility after an-other, system resets (but not heading resets) continuedto occur. In the calmer seas of summer they occurredrather infrequently, but in winter they continued to bea nuisance. Suddenly, after 2½ years of operation, thedeck unit failed catastrophically, and the cause of thefailure shed some light on the remaining reset problems.A failure occurred in circuit boards within the deck unitthat are connected directly to the shielded 70-m-long
transducer cable running from the engine room to theADCP transducer. This cable lies in a tray and right nextto the ship’s power distribution cables for refrigeratedcontainers and windlasses. Suspecting that it was pos-sible to induce enough voltage into the ADCP cable todisrupt the electronics connected to that cable, wemoved the transducer cable away from the others in thetray, drastically reducing the number of resets.
6. Processing and results
Visits to the ship for routine inspection and data re-trieval typically occur once or twice per month. Theroutine inspection includes preliminary examination ofthe data files on the ship to make sure all systems arefunctioning normally. The ping data files are collectedon removable SyQuest disks and transferred to a Sunworkstation at URI where they are inspected to verifythe data quality. The raw ping data files are processedusing the CODAS software system developed by theADCP group at the University of Hawaii (Firing et al.

268 VOLUME 15J O U R N A L O F A T M O S P H E R I C A N D O C E A N I C T E C H N O L O G Y
FIG. 12. Stick plot of 15-min (6 km) averaged ADCP velocities at the 52-m depth levelfrom the 24–26 September 1993 outbound cruise superimposed on NOAA/AVHRR seasurface temperature (SST) composited images from 25–26 September. Velocities less thanthe instrument threshold (about 1 cm s21) are indicated with a dot. SST (8C) is indicated inthe grayscale, and the 200-m isobath is indicated by the solid line.
1995). A flow diagram of the data processing procedureis shown in Fig. 11. For a normal cruise (2 days of data)it takes a trained processor about 4 hours to completethe entire processing procedure. The nonediting stepsare fairly routine, while the editing steps require pro-cessor intervention. Difficulties and delays have arisenwhen special steps were required to compensate forproblems with the data. The calibration of the ADCP’sheading offset and velocity scaling using bottom-track-ing procedure is very time consuming, but fortunatelyonly needed to be performed when the transducer wasreinstalled during dry-docking and when the AGPS wasinstalled.
The scientific results from this project will appearelsewhere so only a typical section is shown here toillustrate the utility of ADCPs on VOS ships. Figure 12shows the velocity vectors from the bin centered at 52-mdepth for the 24–26 September 1993 outbound transit.The most prominent feature is the Gulf Stream flowingeast-northeast at about 215 cm s21. The effect of theGulf Stream on the ship track can be seen as an eastwarddeflection of about 30 km in the track. During this time
period, a warm-core ring had just passed by the shiptrack and is clearly visible as an anticyclone north ofthe stream. Also notable is a broad region of south-westward flow between the Gulf Stream and Bermuda,which is believed to be part of the Gulf Stream recir-culation gyre.
To give an idea of the vertical structure of the currentsand ADCP depth penetration, Fig. 13 shows verticalsections of along-stream (1 toward 458T) and cross-stream (1 toward 1358T) speeds from the 24–26 Sep-tember cruise. The Gulf Stream axis is centered about70.38W, and the sharp horizontal velocity gradient as-sociated with the stream’s north wall is located just tothe northwest of the axis. The ring is centered about71.78W, with core velocities of around 80 cm s21 in itssoutheastern flank and 60 cm s21 in its northwesternflank. Finally, it is interesting to note the 20–30 cm s21
counterflow centered about 69.68W and extending toalmost 100-m depth. This counterflow separates thestream’s core to the northwest from its weaker ‘‘shoul-der’’ region to the southeast and is probably related tothe upward-shoaling isopycnals often found to the

FEBRUARY 1998 269F L A G G E T A L .
FIG. 13. Vertical sections of along- (458T) and cross- (1358T) stream speeds for the transitshown in Fig. 12.
southeast of the stream’s core (Halkin and Rossby1985).
7. Summary and conclusions
This project has demonstrated that it is possible touse the ship-of-opportunity concept to acquire upper-ocean velocity data over large regions at a relativelymodest cost. The development of the autonomousADCP data collection system has made it possible toinstall and maintain relatively sophisticated instrumen-tation on volunteer observing ships without the onboardlevel of technical support associated with research ves-sels. More recently, it has been useful on regular re-search cruises in reducing the technicians’ workloadwhile maintaining high quality, continuous, and con-sistent datasets. The key elements in the implementation
of the system on commercial vessels, however, are fre-quent and convenient access to the vessel, and the will-ingness and patience of the crew and owners to put upwith the necessary modifications and troubleshootingthat inevitably accompany the effort. The crew and own-ers of the CMV Oleander have shown much appreciatedforbearance throughout this effort and have given a sub-stantial amount of help and advice.
The following list summarizes the major items thathave an impact on the installation of the ADCP (or anyother electrical system) on a commercial vessel. Thefact that some are obvious does not lessen their signif-icance.
R Highly distributed system necessitated by the size andconfiguration of commercial ships.
R Inability to alter ship’s systems to suit the installation

270 VOLUME 15J O U R N A L O F A T M O S P H E R I C A N D O C E A N I C T E C H N O L O G Y
or to alter operating methods because of absolute pri-ority of the commercial purpose and cost of any down-time.
R Shape of commercial ship hulls and their speed seemto increase susceptibility to bubble sweep-down as dovariations in load factor, causing variable data quality.
R Electrical complications are nontrivial, difficult toforesee, and difficult to diagnose, including the fol-lowing: electromotive power transients, electromag-netic coupling between long parallel cables, electro-magnetic coupling to signal cables, variations in elec-tric voltage and frequency from shaft generators, in-creased ground loop susceptibility, and differentgrounding standards used on commercial vessels.
R Electrical isolation of distributed system parts can beimplemented with optical isolators on data lines, noiseisolation transformers, and online UPSs on powerlines, and physical isolation of signal cables from oth-er cables.
Distributed electronic systems located in an electri-cally noisy environment can be operated and maintainedsuccessfully if attention is given to electrical isolationof all its distributed parts. The CMV Oleander ADCPsystem was observed to have susceptibility to electro-magnetic transients via four modes of noise coupling:1) to the transducer cable, 2) to the serial wire that runsfrom the DAS PC on the bridge to the deck unit in theengine room, 3) from the ship’s gyro repeater systemto the ADCP gyro repeater and through to the NAV PC,and 4) from the ship’s power through each UPS to thedeck unit and PCs. The priority was to try to eliminatethe cause of electrical noise interference. Failing that,attempts were made to reduce its effects in cases whereit was not practical to eliminate the noise interference.
Electrical isolation can best be achieved by employ-ing fiber optics to totally isolate the system components.This approach eliminates electrical noise such as com-mon—and differential—mode noise since optical fiberis immune to electrical disturbances. It would not havebeen practical to replace the transducer cable with afiber optic cable since this would have required a majorredesign of the ADCP system. Therefore, in this casenoise reduction techniques were the only alternative andgave excellent results since the cable tray allowed plentyof room to separate it from the others. Similarly, opti-cally isolated serial data converters were employed onthe line that traversed the engine room to connect thedeck unit and the DAS PC.
An illustrative example is that noise coupled from theship’s gyro repeater to the ADCP compass repeatercould not be eliminated at its source since the ship’sgyrocompass system was outside our purview. There-fore, whatever noise was passed had to be accepted andits effects reduced. Operating the ADCP gyrocompassrepeater on its own power supply, buffering its serialoutput with a serial optical isolator, and installing anAC line filter on its power supply seems to have con-
tained the problem. Noise continues to be passed to theADCP compass repeater but no longer affects other sys-tem components.
Entrained bubbles below the ship can cause severedegradation of ADCP signals and are the cause of sig-nificant data quality reduction in the CMV OleanderADCP system. One possible approach to reducing theirpresence is to build a fairing around the sea chest open-ing to deflect the flow around it as was done after thefact on the RV Iselin (Leaman et al. 1989) and designedinto the RV T. G. Thompson. While quite feasible, com-mercial ship owners are understandably reluctant to con-sider this option as it would add hydrodynamic drag andcomplicate dry-docking procedures.
Acknowledgments. It is a great pleasure to acknowl-edge the cooperation and support from everyone at theBermuda Container Lines. In particular, we wish tothank Mr. Cor Teeuwen for his insightful support ingetting the project started (even before the ship wascompleted in the yard) and his continuing support asthe project evolved through its teething stages to a stableoperation. Captains Vrolyk and van de Westeringh havebeen most helpful at all times. We particularly appreciatetheir alerting us whenever the ADCP system neededattention. The NOAA staff, and Mr. R. Benway, Mr. G.Strout, and Mr. W. Krug, in particular, are gratefullyacknowledged for their help and assistance in main-taining the system and operating the XBT sampling pro-gram. We particularly wish to mention Dr. Eric Firing,and his staff Ms. J. Ranada and Mr. P. Caldwell, whohave been most generous with their expertise wheneverwe needed help. We are most grateful to Ms. SandyFontana-Anderson, who has assisted us with her ADCPexpertise in many ways. RD Instruments was very re-sponsive in modifying the user exit code for this project.This program is supported by the NOAA Office of Glob-al Programs under Contracts NA56GP0220 to the Uni-versity of Rhode Island and NA92AANRG0064 to theBrookhaven National Laboratory.
REFERENCES
Ashtech Inc., 1994: 3DF three-dimensional direction finding systemoperating manual, Ashtech, 245 pp. [Available from Ashtech,Inc., 1170 Kifer Road, Sunnyvale, CA 94086.]
Benway, R. L., J. W. Jossi, K. P. Thomas, and J. R. Goulet, 1993:Variability of temperature and salinity in the Middle AtlanticBight and Gulf of Maine. NOAA. Tech. Rep. NMFS 112, 110pp. [Available from NOAA/NMFS, 28 Tarzwell Drive, Narra-gansett, RI 02882.]
Firing, E., J. Ramada, and P. Caldwell, 1995: Processing ADCP datawith the CODAS software system version 3.1. Joint Institute forMarine and Atmospheric Research University of Hawaii, 212pp. [Available from JIMAR/UH, 1000 Pope Road, Honolulu, HI96822.]
Flagg, C. N., and S. L. Smith, 1989: On the use of the acousticDoppler current profiler to measure zooplankton abundance.Deep-Sea Res., 36(3), 455–474.
Griffiths, G., 1994: Using 3DF GPS heading for improving underwayADCP data. J. Atmos. Oceanic Technol., 11, 1135–1143.

FEBRUARY 1998 271F L A G G E T A L .
Halkin, D., and T. Rossby, 1985: The structure and transport of theGulf Stream at 738W. J. Phys. Oceanogr., 15, 1439–1452.
Iselin, C. O’D., 1940: Preliminary report on long-period variationsin the transport of the Gulf Stream system. Pap. Phys. Oceanogr.Meteor., 8(1), 1–40.
King, B. A., and E. B. Cooper, 1994: GPS & DGPS: Navigation toolsfor shipboard ADCPs. Sea Technol., 35(3), 10–15.
Leaman, K. D., R. J. Findley, and R. L. Hutchinson, 1989: ADCPhull-mount comparisons alleviate acoustic problems. Sea Tech-nol., 30(9), 31–37.
Magnavox, 1991: MX 4200 PC controller user’s guide. MagnavoxElectronic Systems Company, 68 pp. [Available from Leica GPS,23868 Hawthorne Boulevard, Torrance, CA 90505.]
New, A., 1992: Factors affecting the quality of shipboard acousticDoppler current profiler data. Deep-Sea Res., 39, 1985–1996.
Pollard, R., and J. Reed, 1989: A method for calibrating ship-mountedacoustic Doppler profilers, and the limitations of gyrocompasses.J. Atmos. Oceanic Technol., 6, 859–865.
RD Instruments, 1991: Vessel mounted acoustic Doppler current pro-filer technical manual. RD Instruments, 299 pp. [Available fromRDI, 9855 Business Park Avenue, San Diego, CA 92131.]
Sato, O., and T. Rossby, 1995: Seasonal and low frequency variationsin dynamic height anomaly and transport of the Gulf Stream.Deep-Sea Res., 42, 149–164.
Tambs-Lyche, H., 1984: The continuous plankton recorder survey:The sampling program of the U. S. National Marine FisheriesService. Ann. Biol. Information for the Year 1981, 38, 66–69.
Worthington, L. V., 1976: On the North Atlantic Circulation. TheJohns Hopkins University Press, 110 pp.