Embed Size (px)
Citation preview

In-Situ Chemical Oxidation (Basics, Theory, Design, & Application)
Wilson S. Clayton, Ph.D., P.E., P.G. Aquifer Solutions, Inc.
California DTSCRemediation Technology Symposium
May 14-16, 2008

Outline of This Presentation
ISCO Basics – OverviewISCO Chemistry and Oxidant Alternatives ISCO Design Considerations
ISCO Application Configuration Alternatives ISCO Dose Design ApproachesOxidant Reactive Transport – Delivery Issues
Lessons Learned from Industry Case StudiesISCO Safety

ISCO Technology Primer
In Situ Chemical Oxidation (ISCO)Injection of oxidant chemicals to degrade Organic COCs
Chlorinated Organics, Hydrocarbons, PAHs, Pesticides, Explosives, others
Involves Destroying molecular bonds of COCsOxidation = removal of electrons
Requires The Following:Favorable Contaminant Chemical TreatabilityAppropriately Aggressive Design and Application
Adequate Oxidant DoseEffective Contact with ContaminantsOften Involves Multiple Injection Events

The Technical Goals of ISCO Can Be Varied
Source Zone TreatmentNAPL TreatmentSoil TreatmentMass Reduction Flux Reduction Numerical Concentration GoalVadose Zone vs. Saturated Zone
Groundwater Plume TreatmentGroundwater Attenuation After Source Zone OxidationDirect Plume TreatmentBarrier Configurations

Advantages and Disadvantages of ISCO
AdvantagesFast Treatment (weeks to months)Temporary FacilitiesTreatment to Low Levels (ND in some cases)Effective on Some Hard-to-Treat Compounds
DisadvantagesRequires Spending “Today’s” Money to Get Fast CleanupLimitations of Fast-Reacting ChemistryCan Be Geochemical Side-Effects (not unique to ISCO)

Primary Challenges for Effective ISCO Design & Application
Proper Oxidant DosageNot Stoichiometric With ContaminantsSoil Oxidant Demand Based for Some OxidantsKinetic-Based Oxidant Consumption for Others
Subsurface Oxidant Transport and DeliveryHydro & Geologic LimitationsOxidant Reaction Kinetic Limitations
Oxidant PersistenceOxidant Reaction Rates vs. Contaminant Reaction RatesNeed for Multiple Injection Events

Some Common Questions About ISCO?
Is the Oxidation Reaction Complete, Are By-Products Present and What Is Their Fate?How Much Oxidant Do I Need?
Not Dealt With Herein:
Will I Oxidize/Mobilize Metals?Will Oxidation Kill-Off Subsurface Microbes and Halt Natural Attenuation Processes?Cost

ISCO Theory
Oxidant AlternativesReaction Chemistry
Oxidant ReactionsContaminant Destruction Reactions
Reaction Rates and KineticsSubsurface Delivery

Oxidant AlternativesOxidant
FormulationTwo-Part Formula?
Advanced Oxidation (radical formation)
Direct Oxidation
General Considerations
Interesting Developments
PermanganateKMnO4 or NaMnO4
No No Yes Favorable LongevitySolids Formation
Extensively researched via SERDP, others
Catalyzed Hydrogen Peroxide
Yes Yes No Complex ChemistryOff gas generation
Peroxide Stabilizers
Activated Persulfate
Yes Yes No Complex Chemistrypersistent un-activated
New Activators
Ozone No Yes Yes Gaseous DeliveryShort Half-Life
Vadose Zone Sources
Solid PeroxygensMgO2 or CaO2
No No No Decomposes to release hydrogen peroxide and oxygen
Application as persulfate activator

Permanganate Summary
Potassium Permanganate (KMnO4) Sodium Permanganate (NaMnO4)MnO4
- ion is the active oxidant
CharacteristicsLongevityNot Advanced Oxidation, so doesn’t all recalcitrant organicsManganese oxide solids
recirc solids handlingPure phase DNAPL coating

Permanganate Chemistry “Direct Oxidation”
Balanced Reaction (simplified):2KMnO4 + C2 HCl3 → 2CO2 + 2MnO2 + 2K+ + 3Cl- + H+
2MnO4- + 6e- → 2MnO2
CH2 Cl3 H → 6e- + 2CO2 + 3Cl- + H+
Permanganate Reduction (adding electrons)
TCE Oxidation (removing electrons)
electron transfer

Permanganate – TCE Reaction Pathways
TCEC2 HCl3
Cyclic EsterMnO4 C2 HCl3
Permanganate IonMnO4
-
Carboxylic AcidsHa Cb Oc OHd
HMnO3HCl
CO2 H2 O
H2 O
Cl-
MnO2
Source: Yan and Schwartz (1998)
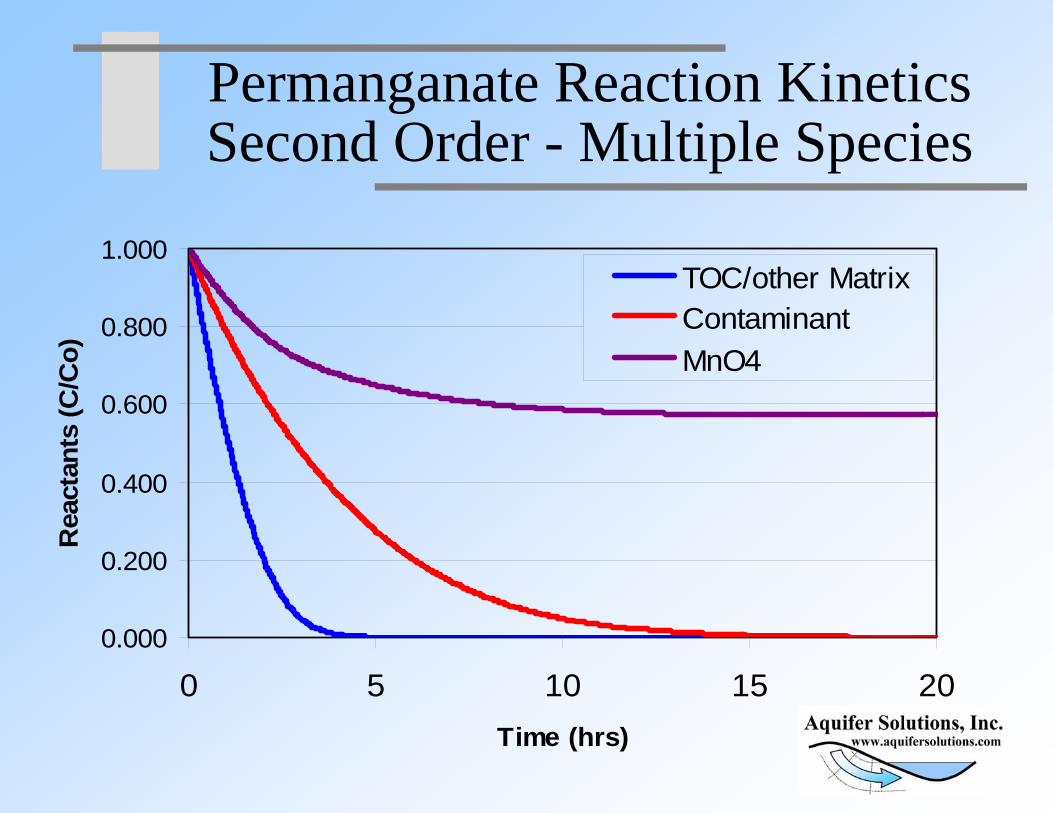
Permanganate Reaction Kinetics Second Order - Multiple Species
0.000
0.200
0.400
0.600
0.800
1.000
0 5 10 15 20Time (hrs)
Rea
ctan
ts (C
/Co)
TOC/other MatrixContaminantMnO4

Permanganate Kinetics at High Contaminant Concentrations
0.000
0.200
0.400
0.600
0.800
1.000
0 5 10 15 20Time (hrs)
Rea
ctan
ts (C
/Co)
TOC/other MatrixContaminantMnO4
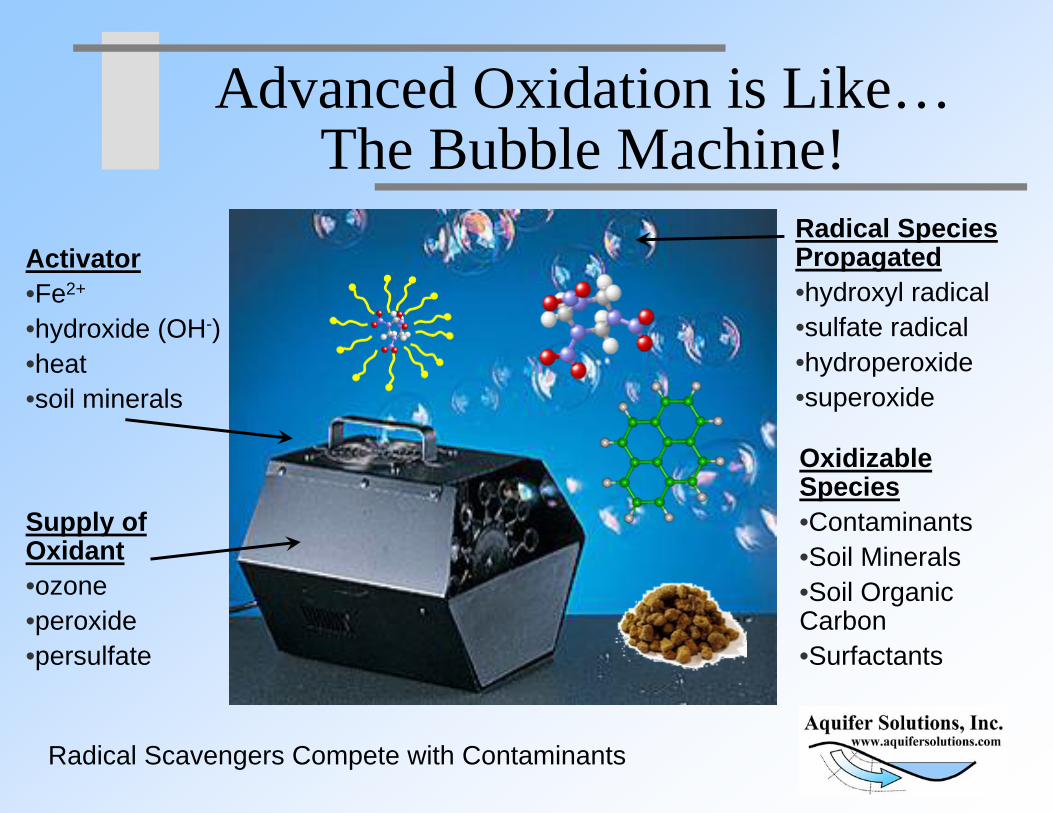
Advanced Oxidation is Like… The Bubble Machine!
Supply of Oxidant•ozone•peroxide•persulfate
Activator•Fe2+
•hydroxide (OH-)•heat •soil minerals
Radical Species Propagated•hydroxyl radical•sulfate radical•hydroperoxide•superoxide
Oxidizable Species•Contaminants•Soil Minerals•Soil Organic Carbon•Surfactants
Radical Scavengers Compete with Contaminants

Catalyzed Hydrogen Peroxide Summary
Advanced Oxidation ProcessHydrogen Peroxide Reactions Produce Highly Reactive radical speciesRadicals are the active oxidants
CharacteristicsFairly Fast Reaction ChemistryPeroxide Stabilizers Can Slow Down ProcessWide Range of Radicals ProducedRadical Production Subject to Optimal Process Chemistry

Catalyzed Hydrogen Peroxide Reactions
Classic Fenton’s Reaction (pH 2.5/3.5; 300 ppm peroxide)H2O2 + Fe2+ (acid) → OH• + OH- + Fe3+
Examples of Radical Propagation ReactionsOH • + H2O2 → HO2
• + H2OH2O2 + Fe3+ → Fe2+ + HO2
• + H+
HO2• → O2
• – + H+
OH • = hydroxyl radical (oxidant)HO2
• = hydroperoxide radical (reductant)O2
• – = superoxide radical (oxidant and reductant)
Source: ITRC ISCO-2, 2005

Persulfate SummaryAdvanced Oxidation Process
Persulfate Reactions Produce Highly Reactive radical speciesRadicals are the active oxidantsUnactivated Persulfate is Stable and Persistent
Many Different possible Activation Methodsironbaseheatozonehydrogen peroxidesolid peroxygens (yield hydrogen peroxide)

Persulfate Chemistry
The Simplified Paradigm for Persulfate Activation:
Catalyzed Persulfate:Men+ + S2 O8
2 – → SO4 – • + Me(n +1)+ + SO4
2 –

Emerging Understanding of Persulfate Radical Propagation
SO4.-
SO42-S2O8
2-
H2O2
OH.
HO2.
O2.-
HO2-
HSO4-
Persulfate anion
SO52-
“activation” “hydrolysis”
ReductantSpecies
OxidantSpecies
Hydroxyl radical Hydroperoxide
Superoxide(oxidant and reductant)
Sulfate radical Peroxy-
monosulfate

Ozone Summary
Ozone (O3) is a gasCan be Direct Oxidation or Advanced oxidation
often activated by naturally occurring minerals
Ozone Sparging or Vadose ZoneContinuous Process, not Batch
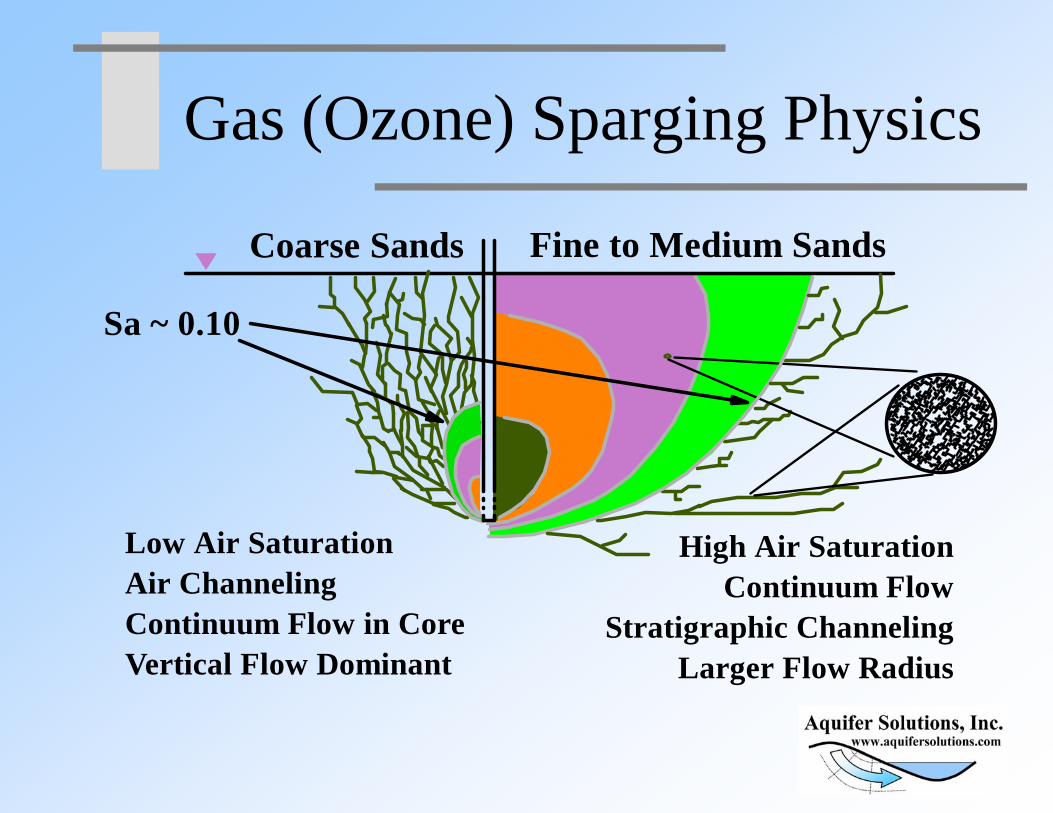
Gas (Ozone) Sparging Physics
Coarse Sands Fine to Medium Sands
Low Air SaturationAir ChannelingContinuum Flow in CoreVertical Flow Dominant
High Air SaturationContinuum Flow
Stratigraphic ChannelingLarger Flow Radius
Sa ~ 0.10

Ozone Chemistry
Chain Initiation Reactions:O3 + OH–→ O2
• – + HO2.
Chain Propagation Reactions:HO2
•↔ O2• – +H+
HO2. + Fe2+ → Fe3+ + HO2
–
O3 + HO2– → OH• + O2
• – + O2
OH • = hydroxyl radical (oxidant)HO2
• = hydroperoxide radical (reductant)O2
• – = superoxide radical (oxidant and reductant)
Source: ITRC ISCO-2, 2005

Bench Test Results Ozone-RDX Soil Columns
Bench Testing Data Courtesy of:Dr. Steve Comfort
School of Natural ResourcesUniversity of Nebraska
• Radio-labeled RDX used to assess mineralization to CO2 .• 100% RDX Destruction in 3 days.• ~90% RDX Mineralization in 3 days.• Ozonation improved aerobic biodegradation of RDX
Adam, et al., J. Env. Eng. Vol. 132, No. 12, December 2006, pp. 1580-1588.

DESIGN
Design Issues Involve:Oxidant Chemical Selection Oxidant Dose DeterminationInjection Volume and ConcentrationNumber of Application Events RequiredSubsurface Oxidant Delivery and Transport
EngineeringApplication/Execution

Ultimately, the goal of the amendment delivery designer is to…
Integrate a range of chemical, physical, and geological variables to develop a strategy which will deliver an adequate amendment concentration in contact with the contaminants for an adequate duration to achieve the treatment goals.

Factors for Success / Failure
Success FactorsOxidation ReactionsOxidant DoseOxidant DeliveryProject Execution
Failure FactorsOxidation ReactionsOxidant DoseOxidant DeliveryProject Execution

Iterative Design Process
Conceptual Design
Refine Conceptual Design
Compare Alternatives: Effectiveness
and Cost
Final Design and Implementation
Data Collection
Site CharacterizationExperienceLiterature
Case Studies
Conceptual Design
Refine Conceptual Design
Compare Alternatives: Effectiveness
and Cost
Final Design and Implementation
Data Collection
Site CharacterizationExperienceLiterature
Case Studies

Design Variables vs. Process Variables
Design Variables
Injection Geometry:Inject OnlyRecirculationPull/PushScreen IntervalsWell SpacingDrill/Inject Tooling
Amendment:ConcentrationVolumeInjection RateInjection Duration
Process Variables
HeterogeneityAdvection-DispersionMass TransferDiffusion LimitationsReaction LimitationsReaction Order
Dependence On:ConcentrationTemperatureTimeGeologic Media

Oxidant Dose Design Approaches
Approach When is it Appropriate Limitations/Challenges
Contaminant Stoichiometry Never, Except as Minimum Estimate
Ignores Side-ReactionsAssumes One-Step Reaction
Soil Oxidant Demand Permanganate and Low Contaminant Concentrations
Ultimate Demand Approach is Simplified
Soil and Contaminant Demand
Permanganate and High Contaminant Concentrations
Ultimate Demand Approach is Simplified
Reaction Rate and Kinetics When You Have the Data. Estimating the Reaction Rates
Empirical Measurements (Bench or Field)
When You Have the Data. Requires Representative and Valid Testing

0.01
0.1
1
10
100
1000
0.001 0.1 10 1000 100000
mg/kg Total VOC / Hydrocarbon Concentration
Stoi
ch. O
xida
nt D
ose
(g p
er k
g so
il)
Simplified Oxidant Stoichiometry and Dose
Accounts for Soil and Contaminant DemandAssumes Uniform Oxidant DistributionDoes Not Account for Oxidant Concentration-Dependant Reactions of Transport Effects
Low SOD Soils
Matrix SOD Dominant at Low Contaminant Concentrations
TCE-KMnO4 Stoichiometry
TCE-H2 O2 Stoichiometry
Moderate SOD Soils
High SOD Soils

When Reaction Kinetics Drive Dose Determination
Advanced OxidationThe Bubble Maker only Works Until it Runs out of Soap
Reactive Transport-Limited Delivery Scenarios
Oxidant Concentrations Vary in Space and Time“Average” Dose is Not LimitingConcentration/Persistence at a Point in Space is Limiting
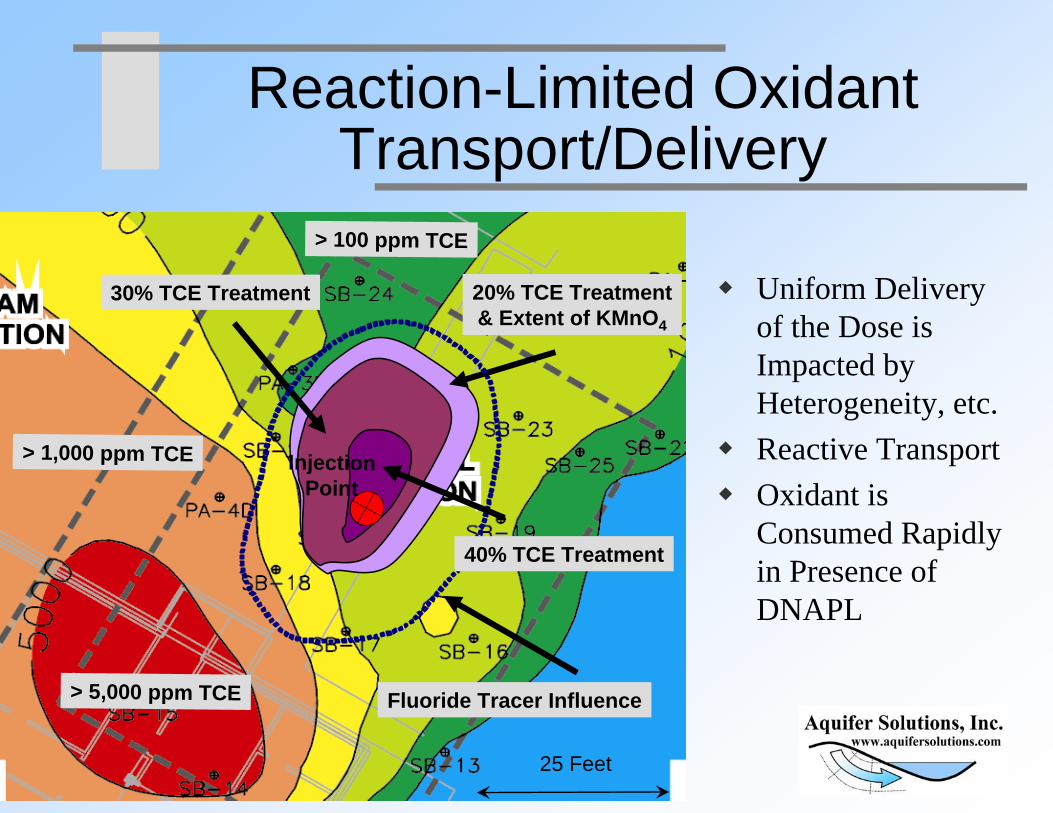
Reaction-Limited Oxidant Transport/Delivery
Uniform Delivery of the Dose is Impacted by Heterogeneity, etc.Reactive TransportOxidant is Consumed Rapidly in Presence of DNAPL
20% TCE Treatment& Extent of KMnO4
30% TCE Treatment
Fluoride Tracer Influence
40% TCE Treatment
25 Feet
> 5,000 ppm TCE
> 1,000 ppm TCE
> 100 ppm TCE
InjectionPoint

Subsurface Processes Controlling Amendment Delivery
Advection and DispersionInterphase Mass Transfer
COPCs, native species, and AmendmentReaction-Limited Transport
COPCs, native species, and Amendment
Density-Driven Transport

Important Factors in Amendment Transport
Chemical/Physical Properties of the Amendment Solution,Concentration-Dependent Amendment Reactions
Second-OrderPseudo First-OrderDecomposition
Amendment-Induced Changes in Sorption and other Geochemical Behaviors, Geologic Heterogeneity and Low Permeability Media
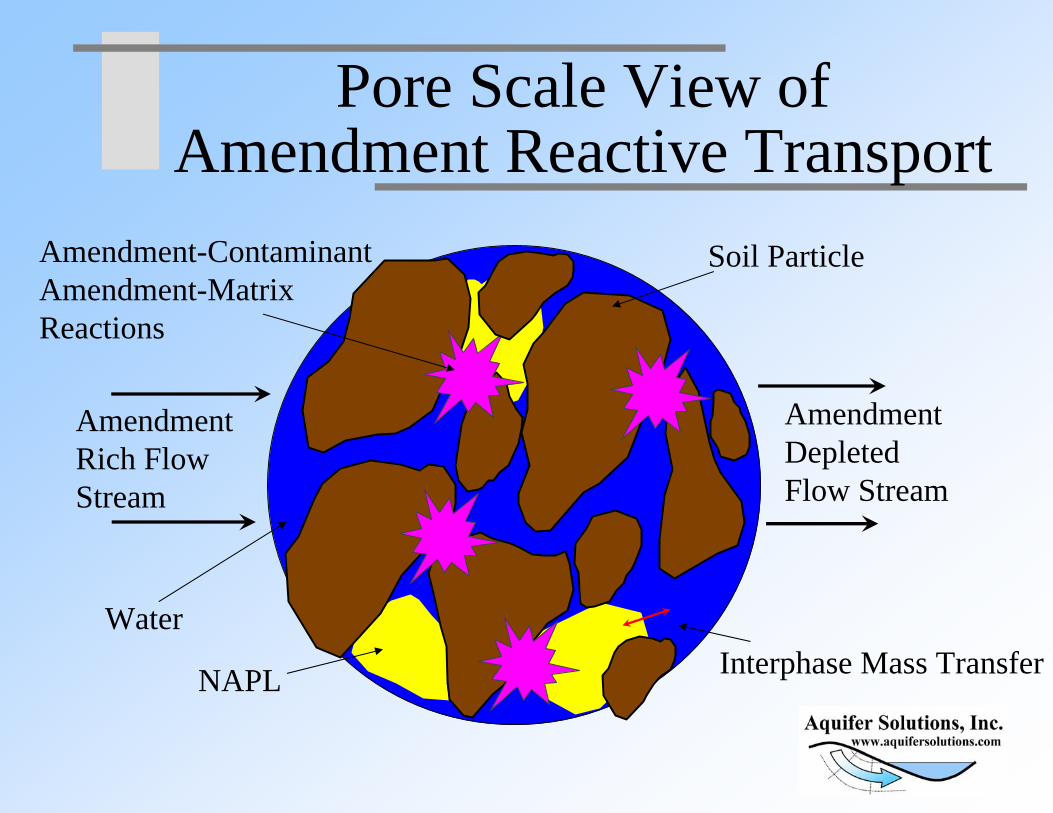
Amendment Rich Flow Stream
Amendment DepletedFlow Stream
Soil Particle
Water
Amendment-ContaminantAmendment-MatrixReactions
Pore Scale View of Amendment Reactive Transport
NAPL Interphase Mass Transfer

Ozone RichGas Stream Ozone Depleted
Gas Stream
Soil Particle
Water
Ozone-ContaminantReactions
Ozone Gas Mass Transfer and Transport

Ozone Mass Transfer Parameters vs. Fluid Saturation
020406080
100120140160180200
0.0 0.2 0.4 0.6 0.8 1.0Water Saturation (Sw)
Inte
rfac
ial A
rea
(1/c
m)
0
0.05
0.1
0.15
0.2
0.25
Diff
usio
n Pa
th L
engt
h (c
m)
Diff. Path Length Int. Area
Water Saturation ~ 0.8
Soil Gas
Water
Water Saturation ~ 0.2
Soil Gas
Water

Amendment Reactive Transport
kCxCD
xCv
tC
xx −∂∂
+∂∂
−=∂∂
2
2
1-D Advective-Dispersion-Reaction Equation:
Transport = f(Advection + Dispersion – Reaction)(for simplicity - ignores Interphase Mass Transfer)Amendment Reaction Rate Controls Transport:
Fast Reaction = transport limitedSlow Reaction = not transport limited

Illustration of Importance of Amendment Reaction Rate
Scenario: 5 gpm flow, 5 foot layer
Con
cent
ratio
n (C
/Co)
1 Hr1 Day
1 Week
Analytical Solutionfor Radial Flow Geometryand First-Order Reaction(Clayton, W. S. 1998 "Ozone and Contaminant Transport During In-Situ Ozonation“, Battelle Monterey Proceedings)
Steady State SolutionConcentration = f(distance)
Curves Depict Amendment Half-Lives

The Question of Density-Driven Flow

Density-Driven Flow Dimensional Analysis
vgk
numberPecletnumberRayleighCo
⋅Δ⋅⋅
==μ
ρ (From: Holzbecher and Yusa, Numerical Experiments on Free and Forced Convection in Porous Media, Int. J. Heat Mass Transfer, 1995)
Ratio of gravitational to viscous forces:
In Our Case:
AdvectionGravity
x
z

Density-Driven Flow Dimensional Analysis
ivK
vgkCo
amam ⋅Δ
=⋅Δ⋅
=⋅Δ⋅⋅
=ρρ
ρρ
μρ
ham
z
KiKCo⋅⋅⋅Δ
=ρρ
gKk
am ⋅⋅
=ρ
μ
Simplify in Context of Field Hydrogeologic Parameters:
Add Consideration of Anisotropy:
Where, and, ivK =
k = intrinsic permeabilityK = hydraulic conductivityρam = amendment solution densityΔρ = amendment density minus groundwater densityμ = fluid viscosityg = acceleration of gravityv = darcy velocityi = dH/dx
(assumes hydraulic gradient is only in x-dir)
iCo
am
hK
zK
⋅
⋅Δ=
ρ
ρ

Results of Dimensional Analysis (for the case of remediation amendments)
Horizontal Hydraulic Gradient @ Kz/Kh = 1.0
mg/L wt %Density (mg/L) 0.001 0.005 0.01 0.05 0.1 0.5
500 0.05 1.0005 0.5 0.1 0.0 0.0 0.0 0.01,000 0.1 1.001 1.0 0.2 0.1 0.0 0.0 0.02,000 0.2 1.003 3.0 0.6 0.3 0.1 0.0 0.05,000 0.5 1.005 5.0 1.0 0.5 0.1 0.0 0.0
10,000 1 1.01 9.9 2.0 1.0 0.2 0.1 0.050,000 5 1.03 29.1 5.8 2.9 0.6 0.3 0.1
100,000 10 1.05 47.6 9.5 4.8 1.0 0.5 0.1400,000 40 1.27 212.6 42.5 21.3 4.3 2.1 0.4
green = density-driven flow minor relative to advectionyellow = density driven flow may be significantred = may result in density-driven miscible fingering
Approx. Amend. Concentration
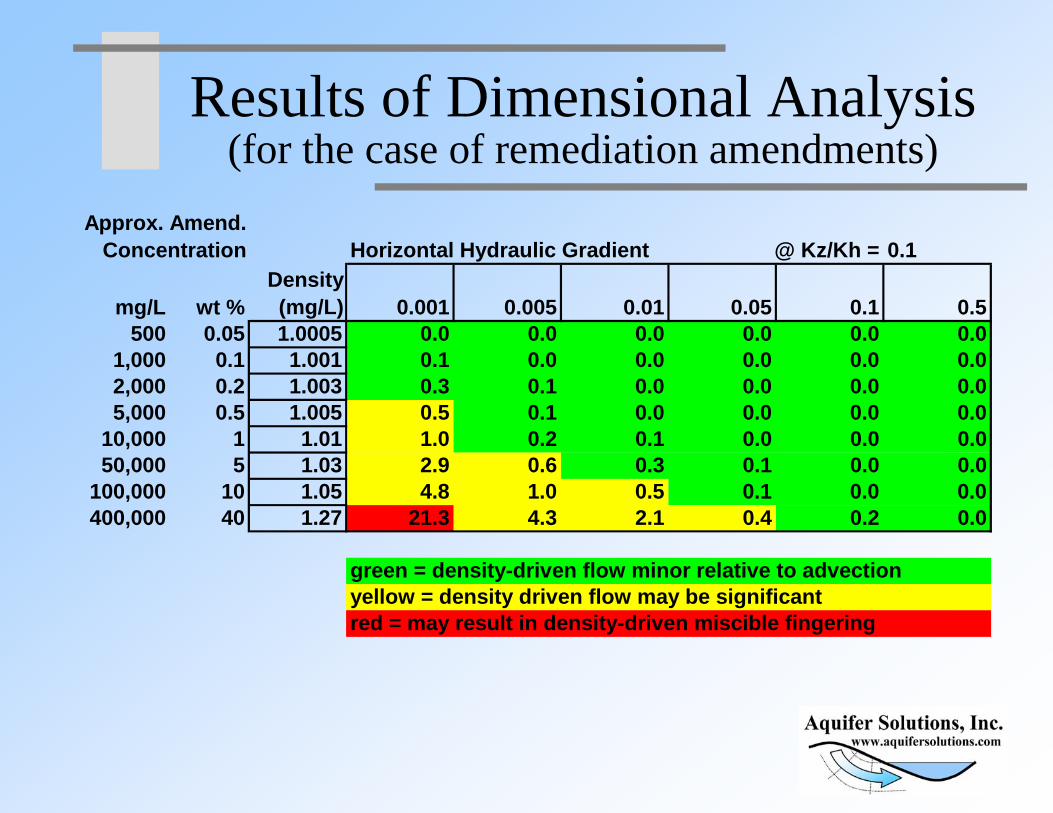
Results of Dimensional Analysis (for the case of remediation amendments)
Horizontal Hydraulic Gradient @ Kz/Kh = 0.1
mg/L wt %Density (mg/L) 0.001 0.005 0.01 0.05 0.1 0.5
500 0.05 1.0005 0.0 0.0 0.0 0.0 0.0 0.01,000 0.1 1.001 0.1 0.0 0.0 0.0 0.0 0.02,000 0.2 1.003 0.3 0.1 0.0 0.0 0.0 0.05,000 0.5 1.005 0.5 0.1 0.0 0.0 0.0 0.0
10,000 1 1.01 1.0 0.2 0.1 0.0 0.0 0.050,000 5 1.03 2.9 0.6 0.3 0.1 0.0 0.0
100,000 10 1.05 4.8 1.0 0.5 0.1 0.0 0.0400,000 40 1.27 21.3 4.3 2.1 0.4 0.2 0.0
green = density-driven flow minor relative to advectionyellow = density driven flow may be significantred = may result in density-driven miscible fingering
Approx. Amend. Concentration

Results of Dimensional Analysis (for the case of remediation amendments)
Horizontal Hydraulic Gradient @ Kz/Kh = 0.01
mg/L wt %Density (mg/L) 0.001 0.005 0.01 0.05 0.1 0.5
500 0.05 1.0005 0.0 0.0 0.0 0.0 0.0 0.01,000 0.1 1.001 0.0 0.0 0.0 0.0 0.0 0.02,000 0.2 1.003 0.0 0.0 0.0 0.0 0.0 0.05,000 0.5 1.005 0.0 0.0 0.0 0.0 0.0 0.0
10,000 1 1.01 0.1 0.0 0.0 0.0 0.0 0.050,000 5 1.03 0.3 0.1 0.0 0.0 0.0 0.0
100,000 10 1.05 0.5 0.1 0.0 0.0 0.0 0.0400,000 40 1.27 2.1 0.4 0.2 0.0 0.0 0.0
green = density-driven flow minor relative to advectionyellow = density driven flow may be significantred = may result in density-driven miscible fingering
Approx. Amend. Concentration

Conclusions – Density-Driven Flow
Increasing Significance For:High Amendment ConcentrationsSmall Hydraulic GradientsIsotropic and/or Homogeneous Media
Likely Minimal Effects below 10,000 mg/l Amendment Concentration and/or at Moderate Hydraulic GradientAn Emerging Area in Need of Additional Research and Design-Tools
Preliminary Analysis Shows…

Design Basis – Bench and Field Testing
Bench TestingProof of Concept for New ApplicationsMeasurement of Oxidant Consumption in SoilMeasurement of Treatment Under “Ideal” ConditionsAnalytical Testing to Determine Field Monitoring Requirements (i.e. metals)
Field Pilot TestingOften Pilot Test Achieves Treatment of a Target ZoneDesigned to Provide Full-Scale Design Parameters Not Readily Measured in Lab (i.e. transport, well spacing, etc)Need Close Transient Monitoring

Bench Testing
Groundwater-Only SystemsDon’t Account for Soil InteractionsCan provide very preliminary information
Soil – Groundwater Slurry SystemsAllows Measurement of Soil InteractionsProvides Soil Matrix DemandAllows Measurement of Metals Solubility and Attenuation
Flow Through Column TestsUseful for Kinetic-Transport Studies & ResearchLess Commonly Conducted than Slurry Tests

Field Pilot Testing
Site the Pilot Test in a Representative AreaConduct Sufficient Background and Pre-Test Monitoring to Assess changes in Site ConditionsAllow Sufficient Duration for All Oxidation Reactions to Go to CompletionSome Common Observations:
Increase of Dissolved Contaminants at Early Time.Rapid Decrease in Dissolved Levels at Later Time.Post-Treatment Rebound in dissolved levels.
Groundwater-Only Sampling Will Not Assess Mass ReductionSoil Sampling is Imperfect, but ValuableMass Flux Measurements Emerging as Important Tool

Sodium Permanganate Recirculation Emplacement
PermanganateBreakthrough Curve

Batch Permanganate Mixing

Constant Head Injection KMnO4

Direct-Push Permanganate Injection
GeoprobeTM Rig
Cone Penetrometer Rig

Variety of Ozone Equipment Systems
C-SPARGER®
Ozone MassProduction Ranges:
50 grams per day
26 lbs per day

Persulfate Field Mixing/Recirculation

Lessons Learned From Published ISCO Case Studies:
A Quantitative Literature Review

Objective
Perform a basic assessment of the currentindustry practice related to oxidant dose anddelivery volume for in situ oxidation.
i.e.,How Much Oxidant Are We Injecting?How Much Volume Are We Injecting?
and How Does This Compare to “Good Practice”?
Methods
Quantitative Analysis of a Very Large Population (n>120) of Published ISCO Case StudiesCalculations were limited to “bulk” calculations of the amount of oxidant injected in terms of Oxidant Doseand Pore Volumes Injected, as defined below:
Oxidant Dose = Total Oxidant Dose Delivered to Site (g per kg soil (g/kg))
Pore Volumes (PV) Injected = Solution Volume Injected / Pore Volume of Target Zone
. Bonus Material:Focused Dose Evaluation of A Few Case Studies with Successful DNAPL Source Zone Treatment

Case Study Sources
• EPA CLU-IN Technology Descriptions, Chemical Oxidation Site Profiles. http: //www.clu- in.org/products/chemox/
• Miscellaneous Vendor Web Sites
• EPA Tech-Trends Newsletters
• State Coalition of Dry Cleaners Web Site http://www.drycleancoalition.org/state.cfm
• Interstate Technology and Regulatory Council (ITRC) Technical Regulatory Guidance Document for In Situ Chemical Oxidation. http://www.itrcweb.org/ISCO-1.pdf
• (and a few more)

Sacrificial Losses To the “Broad Brush”
Influence of Geologic SettingDifferences Between OxidantsInjection Characteristics (i.e. flow rate, pressure, etc.) No Fractured Bedrock Cases Considered (too complex w.r.t. PV and oxidant dose)

General Observations of the 120 Case Studies
Most ISCO Case Studies are Lean on Details. Of 120 case studies reviewed:
27 allowed calculation of PV and Dose, and5 stated the overall Dose applied.
We Analyze Only the 27 Case Studies HereinThe 93 less documented case studies likely involved smaller PV and Dose. No statistical correlation of PV or Dose to contaminant treatment effectiveness was attempted.

Injection Volume
Of the 27 Case Studies:
• The Most Frequent Injection Volume (Mode) Was About 0.1 PV.
• 40% of ISCO Case Studies had an Injection Volume of 0.01 PV or less (most but not all were NaMnO4 )
Frequency Distribution27 of 120 Industry Case Studies
Pore Volumes of Oxidant Solution Injected
0%
5%
10%
15%
20%
25%
30%
35%
0.0001 0.001 0.01 0.1 1 10 100
Pore Volumes of Oxidant Solution Injected
Freq
uenc
y O
f Site
s
Recirculation (KMnO4 )or Continuous (ozone)

Injection Volume
Frequency Distribution27 of 120 Industry Case Studies
Pore Volumes of Oxidant Solution Injected
0%
5%
10%
15%
20%
25%
30%
35%
0.0001 0.001 0.01 0.1 1 10 100
Pore Volumes of Oxidant Solution Injected
Freq
uenc
y O
f Site
s0.05 Pore Volumes
0.001 Pore Volumes
0.1 Pore Volumes
1 Pore Volume
Recirculation and Continuous Injection

Alternate Injection Geometries Fixed at 0.1 Pore Volumes
0.1 Pore Volumes

Alternate Injection Geometries Fixed at 0.1 Pore Volumes
0.1 Pore Volumes

Alternate Injection Geometries Fixed at 0.1 Pore Volumes
0.1 Pore Volumes
Oxidant Dose
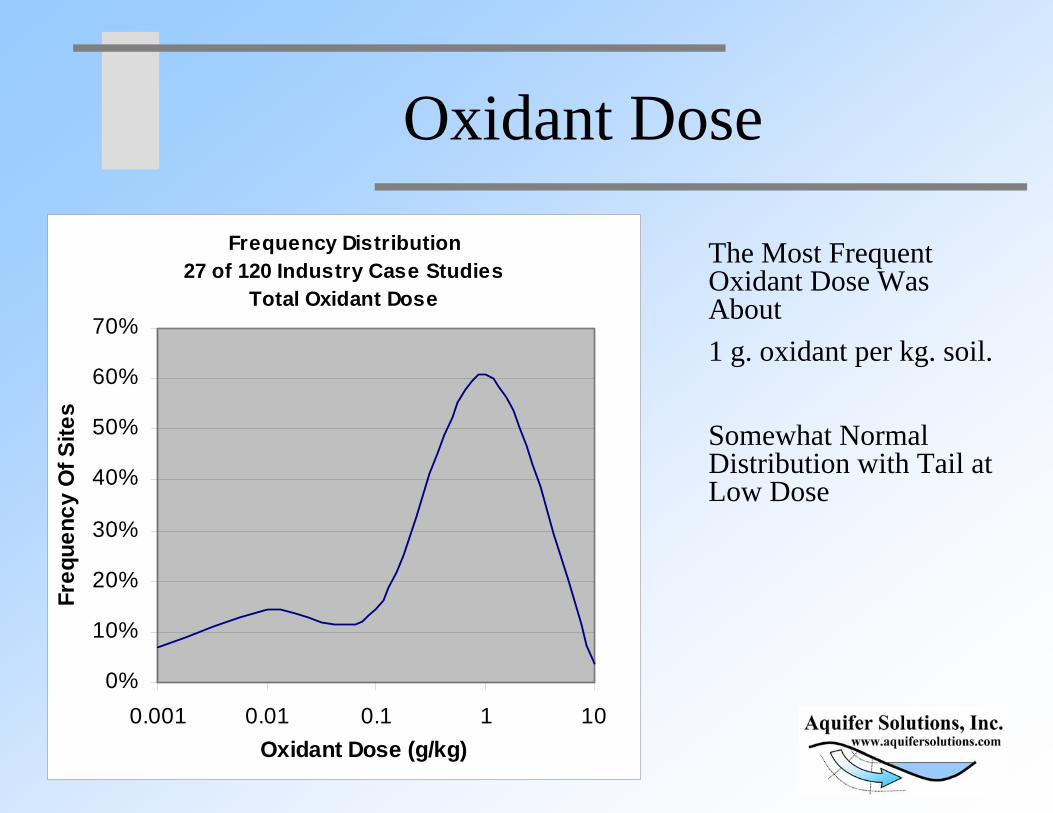
Frequency Distribution27 of 120 Industry Case Studies
Total Oxidant Dose
0%
10%
20%
30%
40%
50%
60%
70%
0.001 0.01 0.1 1 10Oxidant Dose (g/kg)
Freq
uenc
y O
f Site
s
The Most Frequent Oxidant Dose Was About 1 g. oxidant per kg. soil.
Somewhat Normal Distribution with Tail at Low Dose

Example of ISCO Case Study Regulator Comments
“Residual DNAPL in the soil appears to inhibit the success of the injected solutions.”“The source has not been removed and continues as a source for groundwater contamination.”“Insufficient quantities of [ISCO product trade name] may limit the success of the treatment.”
Actual KMnO4 Injection Conditions:
Injected Volume = 0.00012 PVDose = 0.002 g/kg

Focus on ISCO Treatment of DNAPL Source Zones
5 case studies:Well documented treatment of
residual DNAPL source zones.
Observations:1) Must Meet Stoichiometric
Dose for DNAPL Source Treatment
2) Ozone may be an exception (aerobic biodegradation of oxidation products in parallel to oxidation?)
Theoretical Stoichiometry and Actual Dose Applied for
Documented Residual DNAPL Treatment
0.1
1
10
100
1000
10000
1 10 100 1000 10000 100000 1000000
mg/kg DNAPL Constituent
Stoi
ch. O
xida
nt D
ose
(g p
er k
g so
il)
KMnO4
Ozone
KMnO4
Fenton’s
Ozone
TCE-KMnO4 Stoichiometry
TCE-H2 O2 Stoichiometry

What Have We Learned From Published ISCO Case Studies?
Most ISCO Case Studies are Lean on Details. Successful Residual DNAPL Treatment Observed at Doses > 1 g/kgMany ISCO Case Studies reflect under-designed Dose and VolumeMaybe The Industry is doing better on Dose than Volume

Potential ISCO Health and Safety Issues
Process residualsChemical storagePreferential pathways During InjectionExposure to process chemicalsThermodynamics - waste neutralizationGas evolutionFugitive emissionsOxygen-enrichment

Thermodynamics
Oxidants have stored chemical energyConcentration and volume
Control amount of heat releasedRate is controlled by oxidant – reductant chemistry
In-situ vs. Ex-situRate of reaction is important
Slower is better w.r.t safety
Understanding Thermodynamics Can Prevent Accidents!

Case Study – Process Residuals Waste Neutralization
Summer, 2000 – DOE Portsmouth PlantConcentrated sodium permanganate and sodium thiosulfateCombined in an open 5-gallon bucketViolent exothermic reaction - steam
Rapid release of stored energyExtended hospitalizationOver 30 causal factors
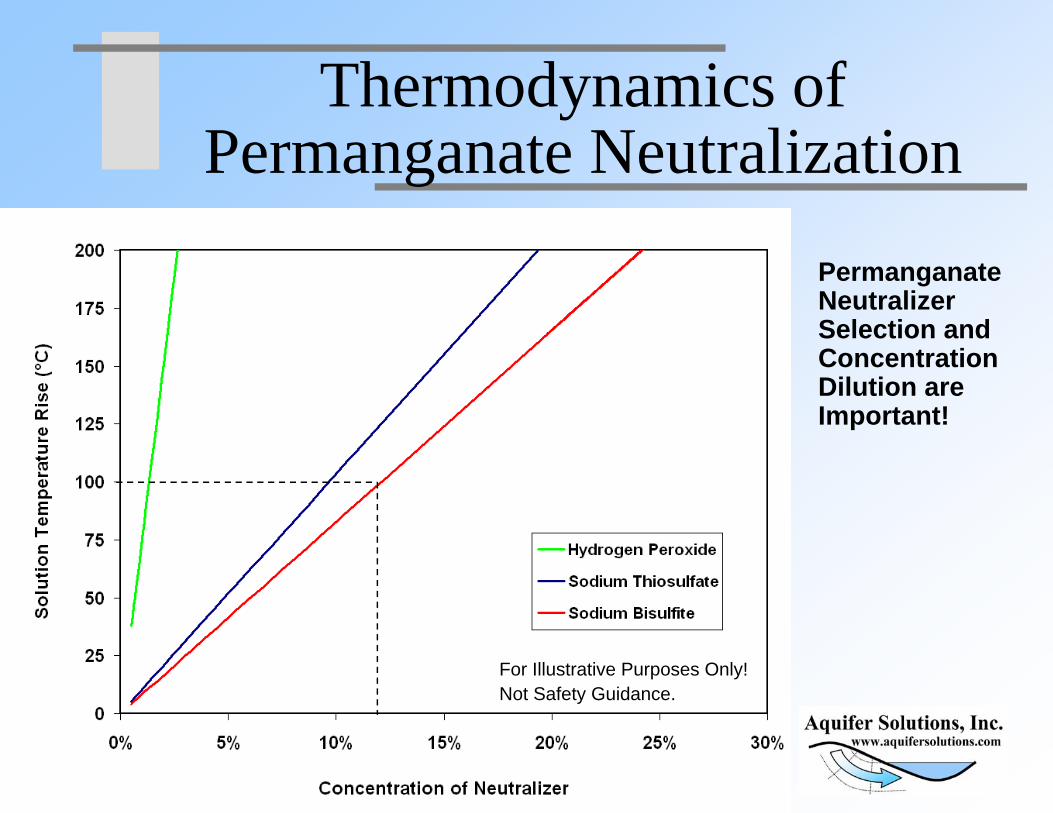
Thermodynamics of Permanganate Neutralization
Permanganate Neutralizer Selection and Concentration Dilution are Important!
For Illustrative Purposes Only!Not Safety Guidance.
Case Study – Fugitive Emissions
Summer, 1999 – Southern California50% H2O2 and phosphoric Acid
385 pounds into three wellsEffervescing “a large vapor cloud”.Street closing and finesLessons learned
Injection concentration was highReaction increased with timeReal-time temperature measurement

Gas Evolution During Peroxide Decomposition
For Illustrative Purposes Only!Not Safety Guidance.
Peroxide Off-Gas and Heat Production More Severe at Higher concentrations!

Safety Conclusions and Recommendations
Start your Health and Safety Plan earlyIntegrate experienced personnel to projectThe process only begins with the MSDSManage the Concentrations of Materials On-SiteManage Storage of Incompatible MaterialsThe development of standard practices is needed to learn from past lessons

Quote From Published Case Study (Site in North Texas):
“In most (applications) heat never exceeds the boiling point of water because of the large amounts of water present... This is generally assured in applications such as the one done at this site...”