Embed Size (px)
Citation preview

Willamette River and Greenway Survey
Introduction
The Willamette River flows through Oregon’s major population centers and is one of the
state’s most heavily used waterways. The Willamette Greenway was established in 1967 to
protect and preserve the natural, scenic, and recreational qualities of lands along the Willamette
River. The Oregon Parks and Recreation Department (OPRD) administers over 8,000 acres of
Greenway property. Greenway lands range from large destination parks and campgrounds like
Champoeg, Willamette Mission, and Elijah Bristow, to smaller undeveloped parcels that provide
natural habitat and remnant samples of the gallery forests and other flora and fauna once
prevalent along the Willamette prior to European settlement. Additional demands are being
placed on the Willamette River and Greenway resources as Oregon’s population grows; for this
reason it is imperative to monitor conditions to ensure that Willamette Greenway goals are being
met and to identify opportunities for improving the Greenway.
The Willamette River and Greenway survey was designed to survey users and resources
in order to identify current use trends and conditions. Survey methods included on-site
observations, on-site questionnaires, and a detailed mail survey. The survey was conducted by
researchers at Oregon State University (OSU) with assistance and guidance of the OPRD.
1

Willamette River and Greenway Survey
Methods
OPRD and Oregon State University (OSU) staff selected 13 publicly owned parks along
the Willamette River to concentrate study efforts (Table 1).
Table 1. Willamette River survey study sites Name Relative location Alton Baker Eugene Champoeg State Park Champoeg, formerly Clackamette Park Oregon City Corvallis Waterfront Corvallis Crystal Lake Corvallis Hyak Park Albany Marshall Island Eugene Molalla River State Park Wilsonville Montieth Park Albany Salem Riverfront Salem Sellwood Riverfront Portland Wallace Marine Salem Willamette Portland
A systematic sampling scheme was created to guide observation and data collection at the
sites from June 19- Sep. 19, 2004. During this period two student workers from OSU observed
and recorded user numbers at one of the sites every weekend (except the July 4th holiday
weekend). Each site was observed during four weekend days. Quantifying weekday use was
identified as being less of a priority than weekend use. Accordingly, one student worker was
scheduled to visit each study site twice during a weekday throughout the study period. Study
sites were observed between 9:30 AM and 6 PM. During these times, student workers asked
users who had been observed using the park for at least a half hour to complete a brief on-site
questionnaire in which respondents provided basic use and contact information. The
questionnaire was constructed by OSU and OPRD staff (Appendix A). Specific attributes
included:
2

Willamette River and Greenway Survey
General activities Activity during the day that they were surveyed Reasons for coming to the park How far they traveled How much time spent in park How they got to park Alone or with group Perceptions of crowding Whether they were on the river in a motorized or non-motorized craft If a conflict occurred and who with
Only users that appeared to be 18 years and older were asked to complete a questionnaire, a total
of 663 on-site questionnaires were collected. The on-site questionnaires yielded 365 addresses.
A detailed mail survey questionnaire was created by OSU and OPRD staff (Appendix B).
Sections within the survey addressed the Willamette River specifically, the Willamette
Greenway, demographic characteristics of users, and also provided an open section for
respondents to provide general comments. Specific attributes within the mail questionnaire
included:
Willamette River Overall impression Getting better or worse Focus of managing land along Willamette Impediments to Willamette use Satisfaction with services Importance of features Importance of additions or improvements Frequency of specific activities at the Willamette Crowding scale for Willamette Park components Importance of funding for items
Willamette Greenway Management goals Land purchase goals Funding sources
Demographic Gender Education Age Income and household composition
3

Willamette River and Greenway Survey
Three full mailings were conducted in which respondent addresses drawn from the on-
site questionnaire were sent a packet with first-class postage, signed letter from the project
principal investigator, questionnaire, and pre-stamped return envelope. The first and second
mailings included a reminder-postcard that was mailed 7-10 days after the packet. The
reminder-postcard encouraged respondents to complete and mail their questionnaire. Nineteen
of the addresses were discovered to be invalid. A total of 227 questionnaires were returned for
an initial response rate of 66%. Five respondents refused to complete the questionnaire resulting
in 222 completed questionnaires and a 64% final response rate for the mail questionnaire.
4
Willamette River and Greenway Survey
Site Descriptions
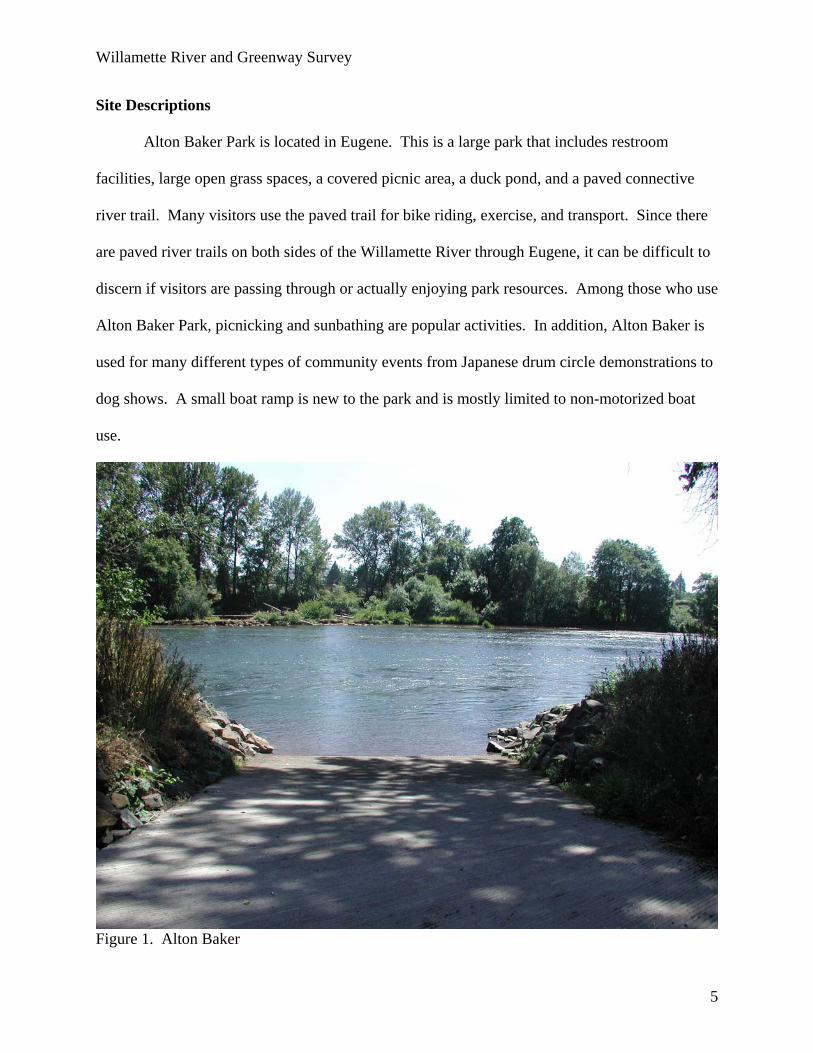
Alton Baker Park is located in Eugene. This is a large park that includes restroom
facilities, large open grass spaces, a covered picnic area, a duck pond, and a paved connective
river trail. Many visitors use the paved trail for bike riding, exercise, and transport. Since there
are paved river trails on both sides of the Willamette River through Eugene, it can be difficult to
discern if visitors are passing through or actually enjoying park resources. Among those who use
Alton Baker Park, picnicking and sunbathing are popular activities. In addition, Alton Baker is
used for many different types of community events from Japanese drum circle demonstrations to
dog shows. A small boat ramp is new to the park and is mostly limited to non-motorized boat
use.
Figure 1. Alton Baker
5

Willamette River and Greenway Survey
Champeog State Park is located a few miles west of Aurora along the Willamette River in
a rural setting. This is a large park and also a historical site that marks the place where Oregon's
first provisional government was formed by vote in 1843. There are multiple covered picnic area
facilities, a campground, group campsite areas, a dock, many picnic areas that can be reserved
with sinks and counters, restroom facilities, a visitor center, an original townsite area, a Frisbee
golf course, an off-leash area for dogs, and paved and unpaved trails. Champoeg State Park is a
popular site for group picnicking because of the many picnic facilities. Since the park is located
fairly close to metro areas, it draws visitors from several different populated areas and is a
camping destination.
6

Willamette River and Greenway Survey
Figure 2. Champoeg State Park
Clackamette Park is located in Oregon City where the Clackamas River connects to the
Willamette River and is near Interstate 205. There is a picnic area, a rock beach, a boat ramp and
dock, horse shoe pits, covered picnic area, a restroom facility, an RV park, and a skate park. The
boat ramp and dock are located on the Clackamas River side and are used by swimmers and
boaters, while the rock beach is located along the Willamette River side and is a popular fishing
area. Families and small groups use the facilities to hold picnics. There is a blue heron reserve
across the Willamette River from the park that locals come to observe.
7

Willamette River and Greenway Survey
Figure 3. Clackamette Park
The Corvallis Waterfront is located along downtown Corvallis. The park consists
primarily of a narrow strip bordering the Willamette River split by a paved path that provides
connectivity to south Corvallis. The pathway is popular for exercise, recreation, and
transportation. A skate park and basketball court are located nearby under the bridge. This park
was recently remodeled with a design that inspired much controversy among local residents.
Corvallis Waterfront Park includes a water fountain that is very popular with visitors and young
children, and includes many picnic tables, benches and river viewpoints.
8

Willamette River and Greenway Survey
Figure 4. Corvallis Waterfront
Crystal Lake Boat Launch is a segment of Willamette Park in south Corvallis. This park
area has a boat launch and dock, nearby sport fields, a portable restroom facility, significant off-
leash areas for dogs, a shaded river path with river access points, and several picnic tables.
Crystal Lake is used by many dog owners who appreciate the off-leash area, and is one of two
boat launches in Corvallis. On hot days during the summer, it is not uncommon to see visitors
swimming at the boat launch.
9

Willamette River and Greenway Survey
Figure 5. Crystal Lake
Hyak Park is located along the Willamette River near north Albany. Hyak is a
small park in a semi-secluded area and features a boat ramp, restroom facility, picnic tables, a
footbridge that crosses over the boat ramp, and a small open area. Hyak is used heavily as a rest
stop and non-motorized boaters frequent the boat launch for starting or ending a float trip.
10

Willamette River and Greenway Survey
Figure 6. Hyak Park
Marshall Island Park is located in a rural, secluded area between north Eugene and
Junction City and is a well developed but limited size park. Marshall Island includes a boat
ramp, one picnic table, a restroom facility, rocky and sandy beaches, and a popular rope swing in
which users can fly 20-30 feet into the area. Marhsall Island is used by boaters, swimmers,
adolescents using the rope swing, and for fishing. The boat lauch is also popular as a put in or
take out for both motorized and non-motorized boaters for the Eugene and Junction City area. A
small parking lot is usually overcapacity on hot weekend days, with nearby field areas
sometimes used as additional parking as circumstances dictate.
11

Willamette River and Greenway Survey
Figure 7. Marshall Island
Molalla River State Park is located near Wilsonville and Canby in a rural area. This is a
semi-secluded park and part of the property once was farmland. Facilities include a small boat
ramp, open space areas, picnic tables, restroom facilities, and several walking trails. A popular
walking trail runs along the Willamette River to the far corner of the park where the Willamette
and Molalla rivers meet. The section of the Willamette River along the park is slow moving and
fairly calm, with some boaters choosing the calmer waters for wakeboarding.
12

Willamette River and Greenway Survey
Figure 8. Molalla River State Park
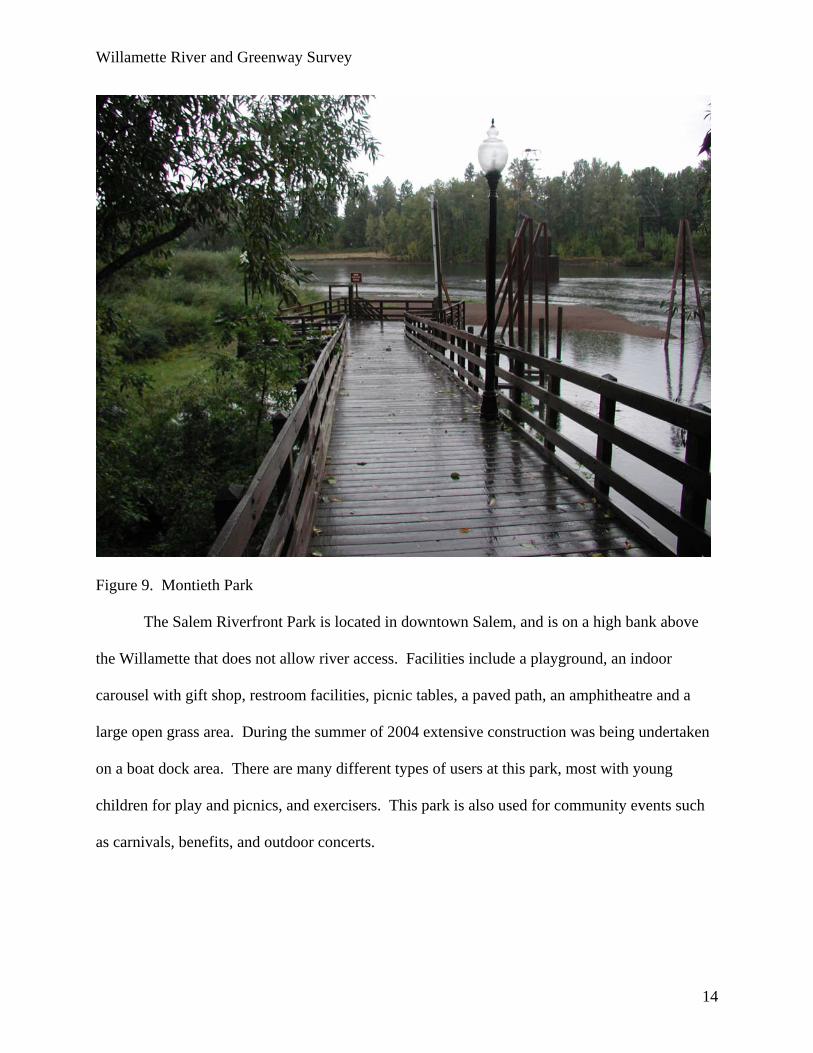
Montieth Riverfront Park is located near downtown Albany. Montieth Riverfront Park
includes an open space area, covered picnic area, picnic tables, restroom facilities, a wood plank
walkway that ends with a viewing area, a large covered stage, a small beach, and a nearby creek
that confluences with the Willamette River and has a rope swing. This is a very well-maintained
park that holds weekly concerts during the summer with high attendance from the community.
This park is mostly used by visitors on lunch break to eat, and local teens as a hang out.
13
Willamette River and Greenway Survey
Figure 9. Montieth Park
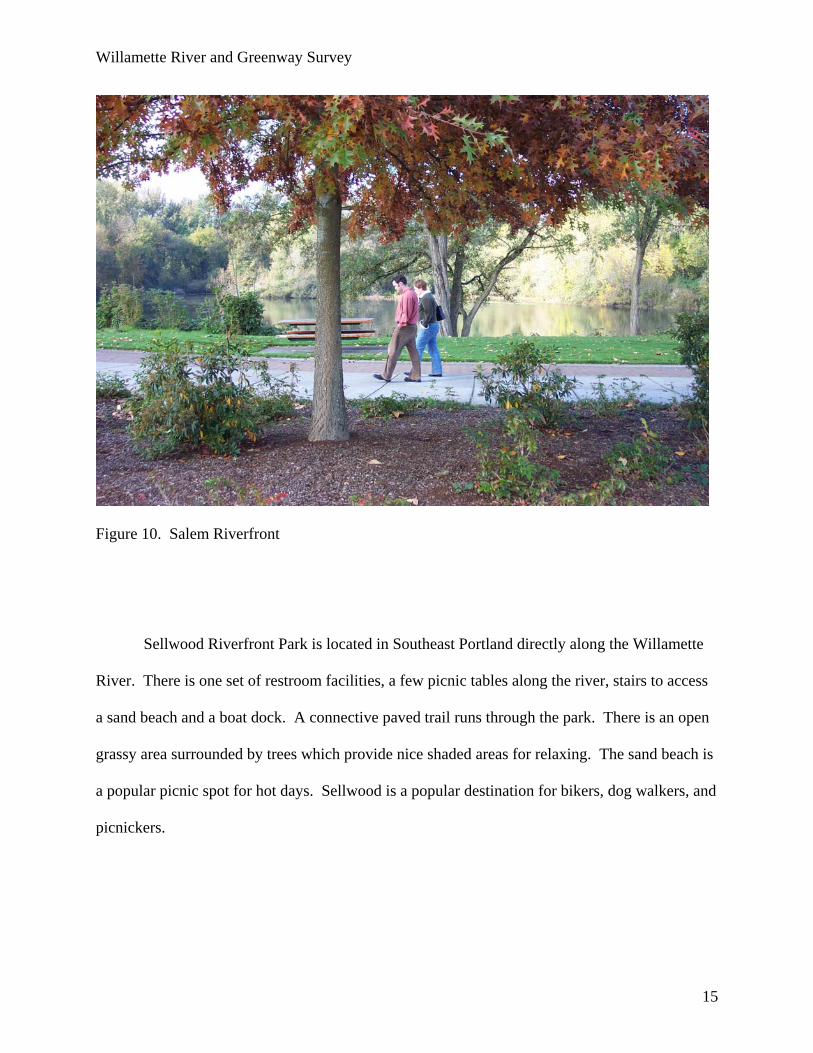
The Salem Riverfront Park is located in downtown Salem, and is on a high bank above
the Willamette that does not allow river access. Facilities include a playground, an indoor
carousel with gift shop, restroom facilities, picnic tables, a paved path, an amphitheatre and a
large open grass area. During the summer of 2004 extensive construction was being undertaken
on a boat dock area. There are many different types of users at this park, most with young
children for play and picnics, and exercisers. This park is also used for community events such
as carnivals, benefits, and outdoor concerts.
14
Willamette River and Greenway Survey
Figure 10. Salem Riverfront
Sellwood Riverfront Park is located in Southeast Portland directly along the Willamette
River. There is one set of restroom facilities, a few picnic tables along the river, stairs to access
a sand beach and a boat dock. A connective paved trail runs through the park. There is an open
grassy area surrounded by trees which provide nice shaded areas for relaxing. The sand beach is
a popular picnic spot for hot days. Sellwood is a popular destination for bikers, dog walkers, and
picnickers.
15

Willamette River and Greenway Survey
Figure 11. Sellwood Riverfront
Wallace Marine Park is located in west Salem. The park includes are sport fields, picnic
areas, sand volleyball pits, a large rock beach with good river access, a boat ramp and dock, and
restroom facilities. During the summer of 2004, it was the home of sternwheeler cruises while
the Salem Riverfront Park’s dock was under construction. The boat ramp and dock, along with
the sternwheeler are in a separate section of the park than the picnic areas, rock beach and sports
fields. This is one of the only boat ramps in the area. This park is used by picnickers and for
river access by boaters.
16

Willamette River and Greenway Survey
Figure 12. Wallace Marine
Willamette Park is located in Portland just downstream and across the river from
Sellwood Riverfront. This park is fairly close to the downtown area and a fee is required for
entrance. There is a large covered group picnic area, playground, picnic tables, a connective
paved trail, tennis courts, restroom facilities, and several open space areas. In addition, a large
dual boat ramp system offers several docks. Besides being a heavily used site for motorized boat
and personal watercraft access, many visitors come here to walk or for large group events.
17

Willamette River and Greenway Survey
Figure 13. Willamette (Portland)
18

Willamette River and Greenway Survey
Results
Results for the Willamette River and Greenway survey are reported below and are
separated into three primary sections: on-site observations, on-site questionnaire, and mail
questionnaire.
On-site Observation Results
Observed user numbers were generated for each site, and for weekend and weekday use
(Table 2). A total of 7,975 users were observed during the survey season (June 19-Sep. 19,
2004). Estimates for total use during the survey season were created by calculating a daily use
average and multiplying the average by the number of days that occurred during the survey.
This calculation resulted in a total use estimate of 44,116 people (95% confidence interval =
6,034) during weekends and 68,120 people (95% confidence interval = 12,469) during weekdays
for a total use estimate of 112,236 throughout the survey season. Individually, Willamette Park
in Portland had the highest weekend day average (286 people), followed by Corvallis Waterfront
(178), and Champoeg State Park (173). Sellwood Riverfront had the highest average weekday
use (171), followed by Corvallis Waterfront (136), and Montieth Riverfront (98). In terms of
total estimated use during the survey season, Corvallis Waterfront had the most (13,824),
followed by Sellwood Riverfront (13,656), and Willamette Park in Portland (13,454). A
limitation of the weekday use estimate is that data were not available for one day at three of the
thirteen sites (Alton Baker Park, Marshall Island Park, and Sellwood Riverfront Park). In these
cases the daily use average was drawn from one observation rather than two.
19

Willamette River and Greenway Survey
Table 2. Use (number of people) at Willamette River study sites
Observed weekend day use
Average weekend day use
Estimated weekend day season use
Observed weekday use
Average weekday use
Estimated weekday season
Estimated total season use
Alton Baker Park 484 161 4,517 63 63 4,095 8,612 Champoeg SP 690 173 4,830 109 55 3,543 8,373 Clackamette Park 448 112 3,136 182 91 5,915 9,051 Corvallis Waterfront 712 178 4,984 272 136 8,840 13,824 Crystal Lake Launch 286 72 2,002 117 59 3,803 5,805 Hyak Park 365 91 2,555 123 62 3,998 6,553 Marshall Island Park 330 83 2,310 28 28 1,820 4,130 Molalla River SP 375 94 2,625 112 56 3,640 6,265 Monteith Riverfront 261 65 1,827 196 98 6,370 8,197 Salem Riverfront 365 91 2,555 141 71 4,582 7,137 Sellwood Riverfront 363 91 2,541 171 171 11,115 13,656 Wallace Marine 320 80 2,240 152 76 4,940 7,180 Willamette Park (Portland) 1,142 286 7,994 168 84 5,460 13,454 Total 6,141 44,116 1,834 68,120 112,236
20

Willamette River and Greenway Survey
On-site Questionnaire Results
Users that were at the parks longer than 30 minutes were asked to complete an on-site
questionnaire consisting of two pages (Appendix A). In the case of large groups, researchers
were instructed to not survey all group members but to limit surveys to the number of clipboards
available (10) in order to avoid introducing bias into survey results. A total of 663 users
completed on-site questionnaires. The following section describes on-site questionnaire results
for all study sites. The margin of error for single variable responses should be less than 4% at a
95% confidence level when the entire sample (663) is considered. Results for individual study
sites are provided in tabular format in Appendix C. Care must be taken in interpreting the on-site
questionnaire results for individual sites with low sample numbers. The margin of error for
single variable responses should be within 16-18% for sites with fewer than 40 observations, and
no greater than 16% for all other sites, at a 95% confidence level.
All Activities
The first question asked respondents to report all activities they had engaged in while at
the park or on the river (Table 3). Scenic enjoyment had the highest participation (68.3%),
followed by walking for pleasure and hiking (60.5%), and nature/wildlife observation (45.7%).
21

Willamette River and Greenway Survey
Table 3. Percent of respondents participating in activity Scenic enjoyment 68.3% Walking for pleasure and hiking 60.5% Nature/wildlife observation 45.7% Picnicking 36.7% Jogging, running, or walking for exercise 32.6% Bike riding 30.3% Bird watching 28.7% Exercising dog(s) 27.3% Relaxing/tanning on a beach 22.9% Swimming 20.5% Boating (motorized) 18.1% Photography 13.3% Fishing from shore or a pier 13.0% Fishing from a boat 12.1% Other 11.2% Camping in improved area 8.0% Kayaking 7.8% Canoeing 7.5% Historical Education 6.9% Frisbee golf 6.2% Environmental Education 6.0% Floating on an inner tube 6.0% Camping in unimproved area 5.4% Operating a personal watercraft (jet ski) 5.1% Rafting 5.0% Boat-in camping 4.5% Waterskiing 4.2% Playing 2.1% Drift boating 1.7% Sailing 0.8% Horseback riding 0.5% Windsurfing 0.3% n = 663
Primary Activity
Respondents were asked to indicate their primary activity (Table 4). Twenty-one percent
reported that walking was their primary activity, nearly 11% reported exercising dog(s), just over
10% reported picnicking, and over 8% reported motorized boating. Approximately six percent
22

Willamette River and Greenway Survey
of respondents wrote in an activity that wasn’t included as a choice in the questionnaire and
common responses included reading and wakeboarding.
Table 4. Primary activity percentages Walking for pleasure and hiking 21.4% Exercising dog(s) 10.9% Picnicking 10.1% Boating (motorized) 8.4% Other 6.2% Scenic enjoyment 6.0% Bike riding 5.6% Jogging, running, or walking for exercise 5.0% Kayaking 3.8% Fishing from shore or a pier 3.6% Relaxing/tanning on a beach 3.0% Operating a personal watercraft (jet ski) 2.4% Fishing from a boat 2.3% Playing 2.1% Canoeing 1.7% Rafting 1.5% Swimming 1.2% Nature/wildlife observation 1.1% Camping in improved area 0.9% Floating on an inner tube 0.6% Drift boating 0.5% Frisbee golf 0.5% Photography 0.5% Waterskiing 0.5% Sailing 0.3% Boat-in camping 0.2% n = 663
Reason for Visiting Park
Respondents were also asked to list the reasons why they chose to visit the park on the
day that they completed their questionnaire (Table 5). This was an open-ended question and
resulted in many different responses. Responses were categorized for reporting purposes.
23

Willamette River and Greenway Survey
Nearly 36% percent reported that proximity to the park was the primary reason for their visits,
followed by river access (7.5%), and park appeal (6.5%).
Table 5. Primary reason for visiting the park Close by 35.9% River access 7.5% Nice park 6.5% Other 6.0% Nice day 5.6% Family/Friends 5.0% Market/business 4.8% Dog 4.5% Walk 2.9% Boat ramp/dock 2.7% Scenery 2.6% Play 2.4% Uncrowded/quiet 2.3% Bike 2.1% Picnic 1.8% Exercise 1.7% Water fountain 1.7% Fishing 1.4% Shade 0.6% No reason given 2.1% N = 663
Nearly 52% of respondents did not report a secondary reason for visiting the park at
which they were interviewed (Table 6). Over 7% indicated that proximity was an important
secondary reason, followed by park appeal (5.7%), and river access (3.9%).
24

Willamette River and Greenway Survey
Table 6. Secondary reason for visiting the park Close by 7.4% Nice park 5.7% River access 3.9% Other 3.6% Scenery 3.6% Uncrowded/quiet 3.3% Nice day 2.9% Walk 2.6% Dog 2.3% Family/Friends 1.8% Fishing 1.4% Picnic 1.4% Boat ramp/dock 1.2% Shade 1.1% Market/business 0.9% Outdoors 0.9% Play 0.9% Water fountain 0.9% Wildlife 0.9% Exercise 0.8% Bike 0.5% Exercise 0.3% No reason given 51.9% N = 663
Time Spent on Trip to Willamette
On-site questionnaire respondents were asked to list the amount of time spent during their
trip to the Willamette River. On average, respondents reported spending about 3 hours and 45
minutes during their stay. Some respondents had spent several days or more either boat camping
or camping, resulted in a skewed distribution of reported time. Respondents were also asked to
list the number of miles they had traveled to reach the park. On average, respondents drove
nearly 11 miles to reach the park. In several cases, distances over 100 miles were driven in order
to attend a family reunion.
25

Willamette River and Greenway Survey
Transportation to Park
On-site questionnaire respondents were also asked to list the form of transportation that
they used to travel to the park (Table 7). All but one respondent listed a transportation type. Of
those who reported a transportation type, the majority (82.6%) reported using a personal vehicle,
nearly nine percent reported walking, and about five percent rode a bicycle. Just over one
percent reported other means of transportation including skateboarding and running.
Table 7. Transportation source to park Personal Vehicle 82.6% Walk 8.8% Bicycle 5.4% Watercraft 1.7% Other 1.1% Public Transportation 0.5% n = 662
Group Type
Respondents were asked to report whether they visited the park alone or, if they were
with others, to identify the type of group (Table 8). All but one respondent indicated an answer
and of those who answered, almost 40% were with family, 22.5% with friends, 22.4% alone, and
14.4% were with family and friends. The remainder of respondents reported being associated
with an organized group during their trip.
Table 8. Group affiliation while at park Family 39.3% Friends 22.5% Alone 22.4% Family & Friends 14.4% Organized Group 1.5% n = 662
26
Willamette River and Greenway Survey
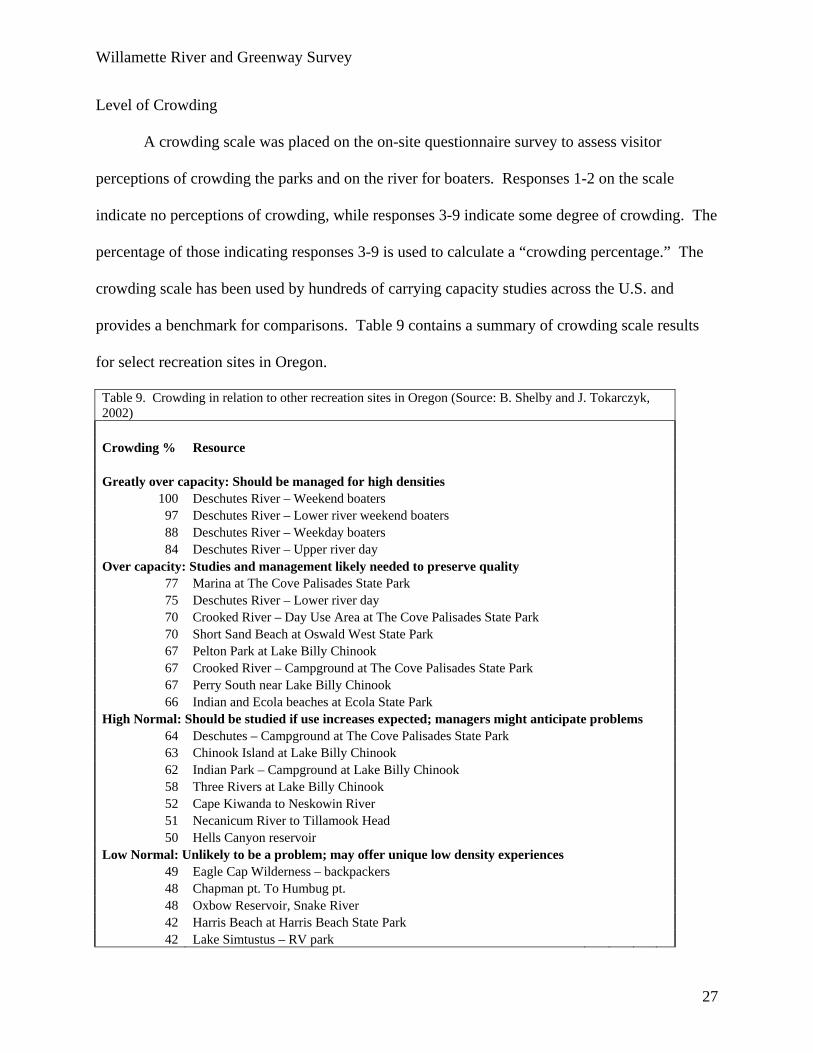
Level of Crowding
A crowding scale was placed on the on-site questionnaire survey to assess visitor
perceptions of crowding the parks and on the river for boaters. Responses 1-2 on the scale
indicate no perceptions of crowding, while responses 3-9 indicate some degree of crowding. The
percentage of those indicating responses 3-9 is used to calculate a “crowding percentage.” The
crowding scale has been used by hundreds of carrying capacity studies across the U.S. and
provides a benchmark for comparisons. Table 9 contains a summary of crowding scale results
for select recreation sites in Oregon.
Table 9. Crowding in relation to other recreation sites in Oregon (Source: B. Shelby and J. Tokarczyk, 2002) Crowding % Resource Greatly over capacity: Should be managed for high densities
100 Deschutes River – Weekend boaters 97 Deschutes River – Lower river weekend boaters 88 Deschutes River – Weekday boaters 84 Deschutes River – Upper river day
Over capacity: Studies and management likely needed to preserve quality 77 Marina at The Cove Palisades State Park 75 Deschutes River – Lower river day 70 Crooked River – Day Use Area at The Cove Palisades State Park 70 Short Sand Beach at Oswald West State Park 67 Pelton Park at Lake Billy Chinook 67 Crooked River – Campground at The Cove Palisades State Park 67 Perry South near Lake Billy Chinook 66 Indian and Ecola beaches at Ecola State Park
High Normal: Should be studied if use increases expected; managers might anticipate problems 64 Deschutes – Campground at The Cove Palisades State Park 63 Chinook Island at Lake Billy Chinook 62 Indian Park – Campground at Lake Billy Chinook 58 Three Rivers at Lake Billy Chinook 52 Cape Kiwanda to Neskowin River 51 Necanicum River to Tillamook Head 50 Hells Canyon reservoir
Low Normal: Unlikely to be a problem; may offer unique low density experiences 49 Eagle Cap Wilderness – backpackers 48 Chapman pt. To Humbug pt. 48 Oxbow Reservoir, Snake River 42 Harris Beach at Harris Beach State Park 42 Lake Simtustus – RV park
27

Willamette River and Greenway Survey
Table 9. Crowding in relation to other recreation sites in Oregon- continued from previous page Crowding % Resource
Low Normal: Unlikely to be a problem; may offer unique low density experiences
41 Sutton Creek to Siuslaw River 40 Hug Point to Arch Cape 40 Netarts River to Cape Lookout 37 North Sand Lake Spit 37 Sand Lake to Cape Kiwanda 37 Brownlee Reservoir, Snake River 36 Point Maxwell to Netarts
No Crowding: No problem; may offer unique low-density experiences 34 Roads End to Siletz River 34 Devils Puchbowl to Schooner Bay 33 Columbia River to Necanicum River 31 Humbug Point to Hug Point 31 Yaquina Head to Yaquina River 30 Cape Sebastian to Pistol River 27 Siuslaw River to Siltcoos River 26 Illinois River – Rafters 25 Harbor Beach 24 Nehalem River to Tillamook Bay 24 Rocky Knoll to Heceta Head 23 Tenmile Creek to Coos Bay 23 Whaleshead Beach 22 Neahkanie Mountain to Nehalem Mountain 21 Siletz River to Boiler Bay 20 Round Butte Observatory, Lake Billy Chinook 19 Bay Ocean Spit 16 Alsea River to Star Creek 16 Bastendorf Beach 16 Umpqua River to Tenmile Creek 16 Rogue River to Cape Sebastian 15 Nestucca River to Cascade Head 15 Battle Rock to Humbug Mountain 14 South Beach 12 Face Rock to New River 11 Fivemile Point to Coquille River 11 Winchuck and Chrissie Fields, California Border 10 Collins Creek to Alsea River
About 41% of all respondents indicated some degree of crowding. This percentage falls
roughly in the middle of the “Low Normal” category in Table 9.
28

Willamette River and Greenway Survey
Watercraft Crowding
Respondents were asked if they had used a motorized or non-motorized watercraft on the
Willamette during the day that they completed the survey (Table 10). About 16% percent
reported using a motorized watercraft and 10% a non-motorized watercraft.
Table 10. Percentage reporting using a watercraft Motorized watercraft 16.1% Non-motorized watercraft 10.3% n = 663
Respondents reporting the use of a watercraft were asked to respond to the crowding scale (Table
11). Nearly half of the motorized boaters reported some degree of crowding while almost 40%
of the non-motorized boaters reported some degree of crowding. The crowding percentage for
the motorized boaters is near the top and non-motorized in the middle of the “Low Normal”
category in Table 9.
Table 11. Percentage reporting crowding by watercraft type Motorized watercraft (n = 104) 49.0% Non-motorized watercraft (n = 63) 39.7%
Conflicts
All respondents were asked whether they had experienced a conflict during the day they
completed the survey (Table 12). If a conflict occurred, respondents were asked to describe the
nature of the conflict. About six percent of respondents reported a conflict.
Table 12. Percent reporting a conflict No 94.2% Yes 5.8% n = 654
29

Willamette River and Greenway Survey
Dogs were the most commonly cited reason for a conflict (21.4%), followed by
frustrations with facility design (16.7%), and motorized boater behavior and presence (14.3%)
(Table 13).
Table 13. Nature of reported conflicts Dogs 21.4% Facility design 16.7% Motorboats 14.3% Behavior / Noise 11.9% Homeless 9.5% Bikers 7.1% Litter 7.1% Aggressive birds 2.4% Enforcement 2.4% Insects 2.4% Skateboarders 2.4% Smokers 2.4% n = 42
30

Willamette River and Greenway Survey
Mail Questionnaire Results
A detailed mail questionnaire was sent to those who provided contact information on the
on-site questionnaire. A copy of the mail survey is in Appendix B. The mail survey had three
main sections of question types: Willamette River and nearby lands, Willamette River
Greenway, and demographic questions. Results for each of these sections are provided below for
all study sites. The margin of error for single variable responses should be less than 7% at a 95%
confidence level when all mail survey questionnaire responses (222) are considered.
Appendices D and E contain results for individual study sites for questions with single
responses and questions with multiple responses, respectively. Data reliability is limited for the
mail survey responses for survey sites with a low number of responses. Sites with fewer than 20
responses will have a margin of error between 23-37% at a 95% confidence level and results
should be carefully considered in light of the low response. Assuming a 95% confidence level,
sites with at least 20 responses will have margins of error no greater than 19-21% and sites with
at least 40 responses will margins of error no greater than 14%.
Willamette River and Nearby Lands
Overall Impression of the Willamette River
Respondents were asked to give their overall impression of the Willamette River (Table
14). The majority reported either a highly favorable (67%) or favorable (30.8%) impression.
Less than one percent reported an unfavorable impression.
31

Willamette River and Greenway Survey
Table 14. Overall impression of the Willamette River Highly Favorable 67.0% Favorable, nice to have in my community 30.8% Don't really care about it one way or another 1.4% Unfavorable, not nice to have in my community 0.9% n = 221
Respondents were asked to rate the change in recreational experience quality that they
had experienced in recent years (Table 15). Nearly 32% reported that their experience was
getting somewhat better and about 10% said getting much better. About 21% indicated that their
experience was getting worse to some degree.
Table 15. Quality change of recreational experiences on the Willamette River in recent years Getting Much Worse 5.9% Getting Somewhat Worse 14.9% Not Changing 27.1% Getting Somewhat Better 31.7% Getting Much Better 9.5% Don't Know 10.9% n = 221
Focus for Managing Public Lands
When asked to indicate the most important focus for managing public lands along the
Willamette, the majority of respondents (61.8%) indicated that all provided categories should be
considered (Table 16). Nearly 28% reported that conservation of natural resources should be the
most important focus and just over four percent chose recreation opportunities.
32

Willamette River and Greenway Survey
Table 16. Most important focus for managing public lands along the Willamette A balance of all choices 61.8% Conservation 27.3% Recreation opportunities 4.1% Other 2.7% Natural Scenery 2.3% Protection from flooding 1.8% n = 220 0.0%
Satisfaction with Level of Use
Respondents were asked whether they used the Willamette River and adjoining public
lands as much as they wanted to, or whether they wanted to use them more (Table 17). Nearly
two-thirds (66.4%) reported satisfaction with their use levels while the remainder reported
wanting more use.
Table 17. Willamette River use levels among respondents Used as wanted 66.4% Wanted more 33.6% n = 217
Reasons Preventing Willamette River Use
Respondents who indicated wanting to use the Willamette River and adjoining lands
more were prompted to answer a list of follow-up questions that offered potential reasons for use
limitations (Table 18). The pollution in the Willamette River and lack of publicly-owned lands
for access to the river were among the strongest responses in the “Very Important” category.
Transportation issues, proximity, and familiarity with available resources or activity skills were
cited as not being important by a majority of respondents.
33

Willamette River and Greenway Survey
Table 18. Reasons preventing Willamette River use.
Very Important Important
Somewhat Important
Not Important n
River is dirty/polluted 47.6% 21.9% 20.0% 10.5% 105 Not enough publicly-owned lands to access river 22.9% 19.0% 25.7% 32.4% 105 Facilities poorly kept/maintained 15.7% 19.6% 30.4% 34.3% 102 Admission fees charged 14.4% 10.6% 25.0% 50.0% 104 Facilities overcrowded on weekends 11.0% 19.0% 32.0% 38.0% 100 Recreation areas are far from where I/we live 9.6% 10.6% 26.0% 53.8% 104 No facilities 7.0% 18.0% 26.0% 49.0% 100 Don’t know what’s available to do there 6.9% 15.8% 20.8% 56.4% 101 Need to learn how to do the activity of interest 6.9% 10.9% 20.8% 61.4% 101 No public transportation to parks 5.0% 5.9% 10.9% 78.2% 101 Don't have a car or truck 3.0% 3.0% 6.9% 87.1% 101 Other 23
Respondents who indicated that they used the Willamette River as much as they wanted
to were asked to rate the severity of potential problems on public lands (Table 19). Almost all
respondents chose to complete this question regardless of their reported use level. The most
often cited considerations in the “Big Problem” category was access to shoreline, excessive
motorized boat speed or wakes, litter, and lack of restrooms. Litter and shoreline access were
among the most often cited concerns in the “Moderate Problem” category.
34

Willamette River and Greenway Survey
Table 19. Severity of problems on public lands
Big Problem
Moderate Problem
Slight Problem
Not a Problem N
a. Litter around the park or river 12.4% 28.4% 45.3% 13.9% 201 b. Inconsiderate behavior by other users 8.0% 18.4% 40.8% 32.8% 201 c. Lack of restrooms 10.4% 15.9% 34.8% 38.8% 201 d. Difficulty in finding a picnic table 4.6% 10.7% 23.9% 60.9% 197 e. Difficulty in finding a campsite 6.9% 16.5% 15.4% 61.2% 188 f. Not enough access to shoreline 13.1% 20.6% 27.1% 39.2% 199 g. Noise from motorized boats 9.0% 17.0% 30.5% 43.5% 200 h. Excessive motorized boat speed or wakes 12.5% 17.5% 26.5% 43.5% 200 i. Fear for personal safety 3.5% 13.6% 24.7% 58.1% 198 j. Crowding of hiking trails, parks, and other recreational facilities 1.5% 8.0% 32.0% 58.5% 200 k. Vandalism 6.9% 16.8% 40.6% 35.6% 202 l. Dogs off leash 7.5% 8.0% 32.8% 51.7% 201 m. Traffic congestion on roads along, or leading to, the river 4.5% 8.0% 31.5% 56.0% 200 n. Alcohol and drug use along the river 7.0% 14.0% 36.5% 42.5% 200 o. Other 27
Satisfaction with Park Facilities and Services
Respondents were asked to rate their satisfaction with services and facilities at parks and
recreation areas along the Willamette River (Table 20). In general, respondents reported being
either “Very Satisfied” or “Satisfied” with the majority of services and activities they were asked
to rate. One notable exception to this general level of satisfaction was for swimming
opportunities. Over 42% of respondents voiced some degree of dissatisfaction with swimming
availability.
35

Willamette River and Greenway Survey
Table 20. Satisfaction with services and activities at Willamette River parks
Very Satisfied Satisfied
Somewhat Dissatisfied
Very Dissatisfied
Don't Know n
a. Restroom facilities 15.1% 53.4% 17.8% 7.8% 5.9% 219 b. Boat launches 27.3% 37.5% 7.9% 4.2% 23.1% 216 c. Picnic facilities 23.9% 52.8% 10.6% 1.8% 11.0% 218 d. Camping facilities 11.1% 31.5% 13.4% 3.2% 40.7% 216 e. Walking/hiking/jogging/biking trails 41.1% 39.3% 9.1% 3.7% 6.8% 219 f. Horseback riding opportunities 6.0% 9.3% 3.2% 1.4% 80.1% 216 g. Swimming opportunities 11.9% 17.0% 25.2% 17.0% 28.9% 218 h. Motorized boating opportunities 22.9% 22.0% 4.7% 2.3% 48.1% 214 i. Non-motorized boating opportunities 24.1% 37.0% 8.8% 4.6% 25.5% 216 j. Nature programs 13.1% 21.5% 9.8% 2.8% 52.8% 214 k. Historical programs 9.8% 22.9% 7.9% 2.3% 57.0% 214 l. Overall quality of recreational experience 29.8% 61.0% 7.8% 0.9% 0.5% 218
Respondents were asked to rate the importance of Willamette River features (Table 21).
Among the choices given, clean water was a dominant choice (83.2%) among those in the
extremely important category, followed by scenic beauty (66.4%), natural resources (51.6%),
and public river access (43.6%). The latter three categories were also the most often chosen as
being quite important.
Table 21. Importance of Willamette River features
Extremely Important
Quite Important Important
Somewhat Important
Not Important n
a. Clean water 83.2% 12.3% 3.2% 1.4% 0.0% 220 b. Scenic beauty 66.4% 25.0% 8.2% 0.5% 0.0% 220 c. Public river access 43.6% 25.0% 21.4% 7.3% 2.7% 220 d. Natural resources 51.6% 28.3% 12.3% 5.5% 2.3% 219 e. Historic resources 24.3% 21.6% 29.4% 16.1% 8.7% 218 f. Cultural resources 21.9% 22.8% 28.4% 17.2% 9.8% 215 g. Flooding potential 29.2% 25.9% 22.7% 13.9% 8.3% 216
36

Willamette River and Greenway Survey
Survey participants were asked whether certain facility additions or improvements would
encourage their use of parks and recreation areas along the Willamette River (Table 22).
Walking/Biking trails, river views, and restrooms were the most often cited responses.
Table 22. Ability of potential additions or improvements to increase use of Willamette Parks Yes Maybe No n Restrooms 40.6% 30.0% 29.5% 217 Boat launches 28.6% 24.4% 47.0% 217 Picnic facilities 33.6% 38.2% 28.1% 217 Lights 27.8% 30.1% 42.1% 216 Sport facilities 19.2% 29.9% 50.9% 214 Walking/Biking trails 65.0% 26.3% 8.8% 217 Swimming beaches 22.0% 47.0% 31.1% 164 Fishing from bank or dock 33.0% 24.7% 42.3% 215 Views of river 55.8% 32.6% 11.6% 215 Interpretive Information 29.0% 41.5% 29.5% 217 Facility guides/maps 35.8% 42.0% 22.2% 212 Other 12
Frequency of Activity Participation
Survey respondents were asked to indicate their frequency of use for the Willamette
River and lands along the river for specific recreational activities (Table 23). Scenic enjoyment,
enjoying peace and quiet, walking for pleasure, and nature/wildlife observations were the most
common activities.
37

Willamette River and Greenway Survey
Table 23. Frequency of Willamette River parks for specific activities Often Sometimes Seldom Never n a. Scenic driving 20.1% 36.1% 24.7% 19.2% 219 b. Walking for pleasure and hiking 46.1% 35.2% 16.9% 1.8% 219 c. Jogging, running, or walking for exercise 37.9% 28.8% 22.8% 10.5% 219 d. Bike riding 22.2% 33.8% 22.7% 21.3% 216 e. Exercising dog(s) 26.6% 15.1% 13.8% 44.5% 218 f. Scenic enjoyment 54.6% 32.1% 10.6% 2.8% 218 g. Enjoying the peace and quiet 51.1% 33.8% 11.9% 3.2% 219 h. Nature/wildlife observation 43.8% 29.7% 17.8% 8.7% 219 i. Bird watching 29.2% 25.6% 21.5% 23.7% 219 j. Picnicking 9.2% 40.4% 33.9% 16.5% 218 k. Camping in improved area 5.5% 14.2% 25.1% 55.3% 219 l. Camping in unimproved area 4.1% 12.3% 18.7% 64.8% 219 m. Boat-in camping 5.0% 10.6% 14.7% 69.7% 218 n. Fishing from a boat 8.3% 14.3% 18.4% 59.0% 217 o. Fishing from shore or pier 10.6% 15.1% 20.6% 53.7% 218 p. Swimming 6.0% 24.0% 23.0% 47.0% 217 q. Relaxing/tanning on a beach 7.4% 22.1% 28.1% 42.4% 217 r. Frisbee golf 3.7% 7.9% 15.7% 72.7% 216 s. Historical education 3.7% 19.4% 26.4% 50.5% 216 t. Environmental education 6.0% 23.4% 30.7% 39.9% 218 u. Photography 9.7% 33.2% 25.3% 31.8% 217 v. Horseback riding 0.5% 2.8% 5.1% 91.7% 217 w. Operating a personal watercraft (jet ski) 1.9% 5.6% 3.7% 88.9% 216 x. Boating (motorized) 11.5% 13.4% 13.4% 61.8% 217 y. Water skiing 4.6% 6.0% 10.6% 78.8% 217 z. Sailing 1.8% 5.1% 8.8% 84.3% 217 aa. Windsurfing 0.9% 2.8% 4.2% 92.1% 216 bb. Floating on an inner tube 5.1% 10.2% 21.9% 62.8% 215 cc. Canoeing 6.5% 20.8% 24.5% 48.1% 216 dd. Kayaking 7.4% 15.3% 16.2% 61.1% 216 ee. Rafting 5.0% 16.1% 18.3% 60.6% 218 ff. Drift boating 2.8% 11.6% 11.6% 74.1% 216 gg. Hunting/trapping 2.8% 5.6% 4.2% 87.4% 214 hh. Community events/festivals 13.0% 45.4% 24.5% 17.1% 216 ii. Other 8
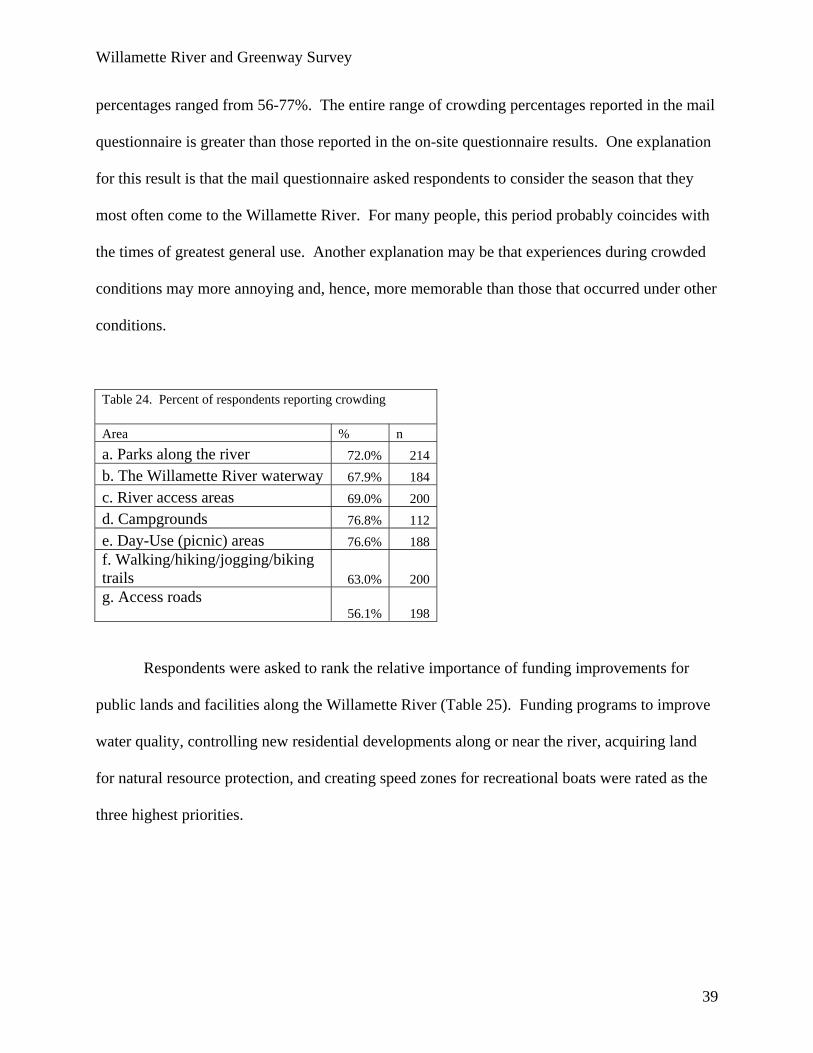
Survey respondents were asked to respond to a crowding scale in relation to different
areas along the Willamette River and to their season of most frequent use (Table 24). Crowding
38
Willamette River and Greenway Survey
percentages ranged from 56-77%. The entire range of crowding percentages reported in the mail
questionnaire is greater than those reported in the on-site questionnaire results. One explanation
for this result is that the mail questionnaire asked respondents to consider the season that they
most often come to the Willamette River. For many people, this period probably coincides with
the times of greatest general use. Another explanation may be that experiences during crowded
conditions may more annoying and, hence, more memorable than those that occurred under other
conditions.
Table 24. Percent of respondents reporting crowding Area % n a. Parks along the river 72.0% 214 b. The Willamette River waterway 67.9% 184 c. River access areas 69.0% 200 d. Campgrounds 76.8% 112 e. Day-Use (picnic) areas 76.6% 188 f. Walking/hiking/jogging/biking trails 63.0% 200 g. Access roads 56.1% 198
Respondents were asked to rank the relative importance of funding improvements for
public lands and facilities along the Willamette River (Table 25). Funding programs to improve
water quality, controlling new residential developments along or near the river, acquiring land
for natural resource protection, and creating speed zones for recreational boats were rated as the
three highest priorities.
39

Willamette River and Greenway Survey
Table 25. Importance of funding improvements for public lands and facilities along the Willamette River
Very Important
Somewhat Important
Not Important
Don't Know n
a. More land for recreation 33.5% 47.9% 15.8% 2.8% 215 b. More land for natural resource protection 50.0% 33.3% 12.5% 4.2% 216 c. Developed boat landings 13.8% 28.6% 49.8% 7.8% 217 d. More camping facilities in park areas 11.6% 33.3% 41.7% 13.4% 216 e. More primitive camping areas along river 13.8% 36.7% 36.7% 12.8% 218 f. Law and behavior enforcement 30.3% 50.5% 15.1% 4.1% 218 g. More litter and trash clean up 35.5% 54.4% 7.8% 2.3% 217 h. More trails 29.0% 50.2% 14.7% 6.0% 217 i. More land for new trails 33.3% 42.1% 17.1% 7.4% 216 j. Routine upkeep of trails 33.6% 51.2% 9.2% 6.0% 217 k. Fix deteriorated trails 34.1% 50.7% 7.4% 7.8% 217 l. Landscaping along trails 14.4% 36.6% 40.7% 8.3% 216 m. New trails for competitive events 9.8% 23.3% 53.5% 13.5% 215 n. Repairing major facility damage 31.6% 50.7% 10.7% 7.0% 215 o. More parking areas 9.7% 42.4% 41.0% 6.9% 217 p. Education 18.0% 46.1% 26.7% 9.2% 217 p. Information, maps, signs 20.3% 58.5% 18.0% 3.2% 217 r. Interpretive information 17.3% 49.5% 27.1% 6.1% 214 s. Preserve historic resources and provide interpretation 25.5% 50.9% 18.5% 5.1% 216 t. Children’s playground areas 19.7% 45.1% 30.0% 5.2% 213 u. More picnic areas along or near the river 21.4% 46.7% 26.2% 5.7% 210 v. Creating speed zones for recreational boats on river 41.9% 34.6% 14.3% 9.2% 217 w. Control new residential developments along or near river 55.8% 29.5% 9.7% 5.1% 217 x. New programs to improve water quality 75.5% 19.4% 3.2% 1.9% 216 y. Other 13
40

Willamette River and Greenway Survey
Willamette River Greenway
A second section of the mail survey asked respondents to consider the public lands that
border the Willamette River, sometimes also referred to as greenways. A definition of a
greenway was provided: “Greenways are typically defined as a corridor of open space that can
vary greatly in scale, from narrow ribbons of green that run through urban, suburban, and rural
areas, to wide corridors that incorporate diverse natural, cultural, and scenic features. A
greenway network protects natural, cultural, and scenic resources, provides recreational benefits,
enhances the natural beauty and the quality of life in neighborhoods and communities, and
stimulates economic development opportunities.”
Greenway Benefits
Survey respondents were asked to assign a relative importance to a list of potential
benefits that could be provided by a Willamette River greenway (Table 26). Making
communities a better place to live, connecting communities with natural corridors and trails, and
improving community image were judged to be the most important benefits.
Table 26. Importance of benefits of a Willamette River greenway parkland
Very Important
Somewhat Important
Not Important
Don't Know n
a. Improve community image 45.0% 40.4% 10.6% 4.1% 218 b. Attract new businesses 22.1% 35.9% 34.6% 7.4% 217 c. Keep existing businesses 25.8% 47.5% 18.9% 7.8% 217 d. Attract new residents 15.6% 28.4% 48.2% 7.8% 218 e. Keep residents from moving away 23.0% 36.9% 32.7% 7.4% 217 f. Attract tourists 23.0% 44.2% 27.6% 5.1% 217 g. Be a vacation destination 19.8% 40.1% 34.1% 6.0% 217 h. Help the local economy 39.4% 44.0% 12.0% 4.6% 216 i. Make your community a better place to live 67.3% 27.6% 2.8% 2.3% 217 j. Improve property values 31.7% 39.4% 23.9% 5.0% 218 l. Connecting communities all along the river with natural corridors and trails 50.0% 36.7% 9.2% 4.1% 218 m. Other 7
41

Willamette River and Greenway Survey
Survey participants were asked to indicate their support for types of land purchases of
private lands that are adjacent to existing greenway public lands in order to increase public use
areas (Table 27). Respondents most strongly supported purchasing lands for natural area
protection, followed by lands for scenic protection, and then for establishing connectivity
between existing public lands.
Table 27. Support for land purchase types to increase public greenway areas Very
Supportive Somewhat Supportive
Not Supportive
Don't Know
n
a. Land purchases for natural area protection 61.0% 27.1% 9.2% 2.8% 218 b. Land purchases for increasing recreation areas 32.6% 49.5% 14.7% 3.2% 218 c. Land purchases for connecting existing public properties
44.7% 38.2% 11.5% 5.5% 217
d. Land purchases for scenic protection 52.3% 36.2% 7.8% 3.7% 218 e. Land purchases for historic resource protection 32.7% 45.6% 16.1% 5.5% 217
Respondents were asked to indicate their support level for potential funding sources that
could be used to expand greenway parklands along the Willamette River (Table 28). The
strongest support was for using lottery dollars. The second strongest support was for park user
fees.
Table 28. Support for funding sources to increase greenway parklands Very
Supportive Somewhat Supportive
Not Supportive
Don't Know
n
a. Park user fees 26.7% 39.6% 33.6% 0.0% 217 b. Lottery dollars (from Park and Salmon Fund)
68.7% 22.6% 6.5% 2.3% 217
c. Property taxes 17.6% 37.5% 41.7% 3.2% 216 d. Income taxes 16.4% 32.7% 45.8% 5.1% 214 e. Other 20
42

Willamette River and Greenway Survey
Demographics
A final section of the mail questionnaire asked respondents to indicate their gender,
education level, age, income, and household composition (Table 29).
Gender and Age
About 37% were female (average age 43) and 63% of respondents were male (average age 47).
Table 29. Gender and average age of respondents Percent Average age Female 37.3% 43 Male 62.7% 47 n = 217
Education
Thirty-two percent of respondents had attended college, 31.1% had earned a Bachelor’s degree,
29.2% a graduate degree, and the rest had attended or graduated from high school (Table 30).
Table 30. Respondent education level Some College 32.0% Bachelor's Degree 31.1% Graduate Degree 29.2% High School Grad 6.8% Some High School 0.9% n = 219
Income
Reported income levels were relatively evenly split among the income categories
provided on the questionnaire (Table 31). The largest percentage of respondents in any one
category was in the $60,000-69,000 range (15.9%).
43

Willamette River and Greenway Survey
Table 31. Total household income before taxes Under $10,000 4.2% $10,000-19,999 7.9% $20,000-29,999 7.5% $30,000-39,999 11.2% $40,000-49,999 7.9% $50,000-59,999 9.3% $60,000-69,999 15.9% $70,000-79,999 7.9% $80,000-89,999 7.0% $90,000-99,999 8.9% More than $100,000 12.1% n = 214
Household Demographics
Respondents were asked to indicate the composition of their household by checking all
descriptions that applied to their household (Table 32). The largest percentage was for two adult
wage earners (47.5%), followed by one adult wager earner (32.7%), and children (30.9%).
Table 32. Household demographics
Children
High School Students
College Students
One adult wage earner
Two adult wage earners
Single head of household
Retired adults
Person with disability
30.9% 9.3% 16.1% 32.7% 47.5% 6.9% 21.2% 6.5% n 217 216 217 217 217 217 217 217
44