Embed Size (px)
Citation preview
© 2011 The Royal Statistical Society
knowledge of the civil engineering firm and what we do. I wasn’t prepared for his response. He had heard of Arup. It turns out that some 50 years ago his mother was PA to Sir Ove Arup, the founder of the firm. With apologies to all you statisticians out there, but what were the odds? (Given that he has asked the question, it is a near certainty. Had the family relationship not been there, the question would never have been asked – Editor.)
Just a day or two before, I had been part of a project meeting with the contractor, Bouygues Civil Works Florida, a subsidiary of Bouygues Travaux Publics, of Paris, France, and the Florida Department of Trans-portation, the owners and sponsors of the project who, along with their various advisor firms, were debating the difficulties of boring not one but two tunnels, each of them 13 metres in diameter (the height of a four-storey building), and each a kilometre long, through limestone and coral under the cruise ship channel without disturb-ing the ships’ schedules or the channel bed. Part of the meeting and subsequent correspondence involved the development of a risk analysis, common now on major projects and mandated by several federal funding agen-cies. These are sometimes referred to as risk matrices, or even, for those more optimistic, risk and opportunities registers, which at least allows for the possibility of some of the “known and unknown unknowns” (to misquote Mr Rumsfeld) to be to the advantage of the project.
I began to describe the risk register – the risks (and opportunities), likelihoods, odds, costs and time delays
Will the big machine arrive? Engineering the Miami Tunnel
Sitting in a pub with my wife after a dinner out, we fell into conversation with two fellow drinkers whom we had never met before and who had walked in just after us, a bit bewildered by the darkness. We asked the usual questions: Where are you from? Are you on holiday? How long for? How do you like South Beach?
Well, they were not (officially anyway) on holiday but were two of about 5000 participants at the Joint Statistical Meeting of the American Statistical Asso-ciation being held in Miami Beach in July 2011. One represented the Royal Statistical Society and the other is the editor of this publication.
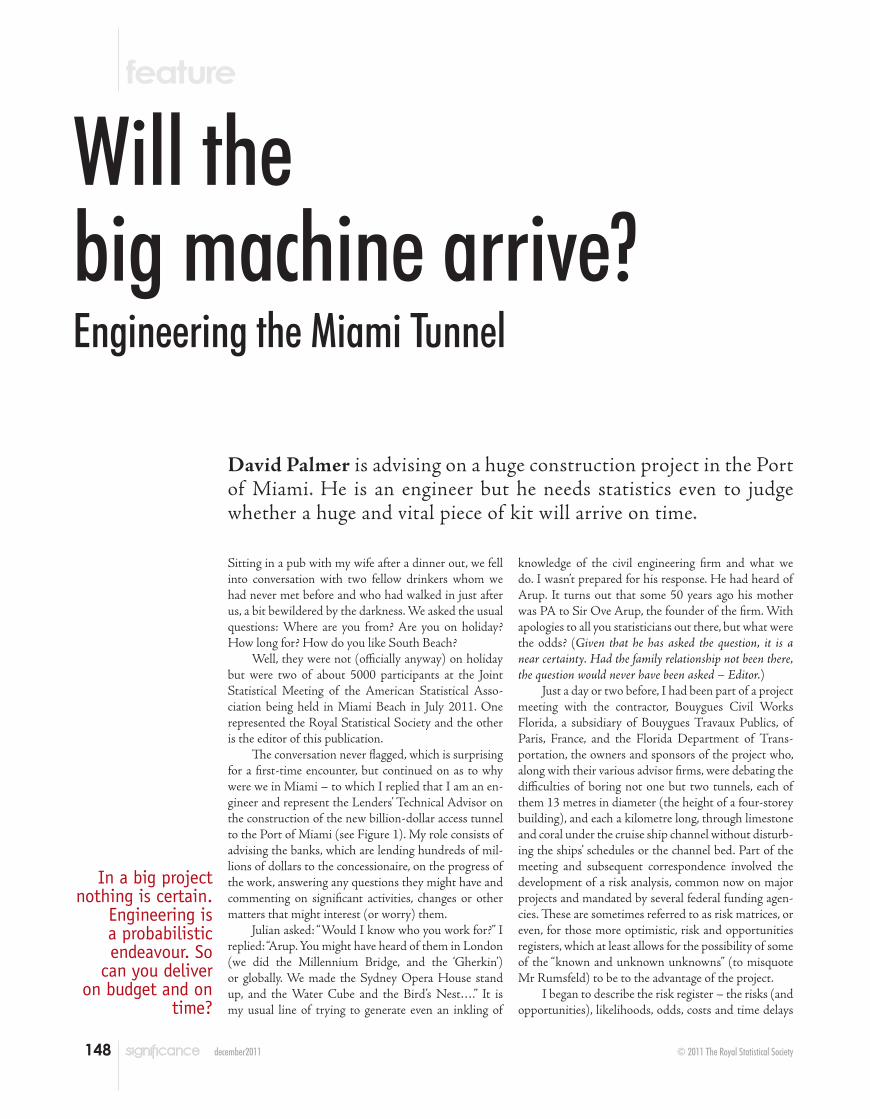
The conversation never flagged, which is surprising for a first-time encounter, but continued on as to why were we in Miami – to which I replied that I am an en-gineer and represent the Lenders’ Technical Advisor on the construction of the new billion-dollar access tunnel to the Port of Miami (see Figure 1). My role consists of advising the banks, which are lending hundreds of mil-lions of dollars to the concessionaire, on the progress of the work, answering any questions they might have and commenting on significant activities, changes or other matters that might interest (or worry) them.
Julian asked: “Would I know who you work for?” I replied: “Arup. You might have heard of them in London (we did the Millennium Bridge, and the ‘Gherkin’) or globally. We made the Sydney Opera House stand up, and the Water Cube and the Bird’s Nest….” It is my usual line of trying to generate even an inkling of
David Palmer is advising on a huge construction project in the Port of Miami. He is an engineer but he needs statistics even to judge whether a huge and vital piece of kit will arrive on time.
In a big project nothing is certain.
Engineering is a probabilistic endeavour. So
can you deliver on budget and on
time?
148 december2011
149december2011
or accelerations, Monte Carlo analyses … I am an engineer but was in the realm of statistics. Would I be prepared to write something about it for the magazine? I said yes. So here it is.
Engineering gambles and statistics
Statistics has a long history in engineering. Even though the profession is a “hard” applica-tion of science there are forces that cannot be measured or predicted accurately. To a certain extent they can be guesstimated from engineer-ing judgement, they can be studied empirically in laboratories or in the field, or they can be derived probabilistically from a set of data. In most cases this is adequate protection to the public, but, because it is not exact, that is not always the case. The recent earthquake in Christchurch, New Zealand, exhibited forces far in excess of the predicted outcomes of a 500-year return event, as required by the design codes, which in New Zealand are some of the most stringent in the world; the buildings were
subjected to maybe twice the shaking they were designed for. Of course, it could be argued that the built environment should be constructed to withstand any force of nature, but that would be clearly cost prohibitive, so a statistical approach to reasonableness in design has to be employed. Engineering is a probabalistic enterprise.
Similarly, in any given project there are unpredictable events, possibly leading to out-comes different than expected. For example, it is common practice, and indeed law in many ju-risdictions, that construction contracts go to the lowest bidder (sometimes coming from a field of “qualified” bidders who meet certain published minimal requirements in performance, experi-ence, size and financial stability). If construction costs could be accurately determined, then all bidders would bid at or about the same price. That does not happen often, except in clearly defined simple circumstances or through pure luck.
Construction pricing is therefore also a gamble, an educated and informed one perhaps,
but still a gamble. On a major contract a con-tractor could be dealing with dozens or even hundreds of subcontractors, who often have been in their own bidding wars with each other for the right to be on the job. The contractor might select the cheapest, the best quality, the best value, the most politically expedient (the mayor’s son-in-law) or by using any number of other criteria. Sometimes there is no choice, as when a public sector owner mandates that selection of subcontractors must be the lowest bid from a minimum number of bidders, usu-ally three, some of them unknown to the main contractor. Risk is therefore built in from the very start, even before the work has begun.
Contractors price this risk. It could be a small contingency if they have the freedom to select the subcontractors they know and love, or a large one if their choices are limited. The whole exercise is balanced, of course, by their competitive desire to win the work.
Now we move to the field, or more accu-rately to the “site”. The work could be routine for
Figure 1. Map of the location of the Miami Access Tunnel into the Port of Miami
150 december2011
the contractor; it could be straightforward, in, on and using material that the contractor knows well, for a fair and reasonable client whom he knows and has worked for before, with subcon-tractors he trusts … and the sun could always be shining, the wind always on his back ….
These projects no doubt do exist but I would venture that the majority of large infrastructure projects, and particularly those underground, do not offer such comfort.
What if the ground is not what it was thought to be? What if you are new to the area, to the country even, and have no experience of local customs, regulations and obligations? What if the subcontractors do not perform as expected or, worse, what if they go bankrupt? What if material prices go through the roof – or, back to the “opportunities” – fall through the floor? What if that high-tension power line is not under the sidewalk exactly where the local utility company said it was? What if the gov-ernment changes and the project is cancelled? (This happens far more often than would be expected.) What if the press takes a strong dislike to the project and makes life hell for all, contractor and client included? What if there is a serious, even fatal, accident? What if there is a credit crisis and your friendly banker is not so friendly any longer? What if …?
These are very real risks. There are oth-ers, possibly more extreme, but they are often referred to as “acts of God” (hurricanes, earth-quakes, invasion, war and so on) and are usually excluded from risk to the contractor by a force majeure clause in the contract. Nevertheless, there is plenty left to worry about.
Clients (often the ultimate owner) and contractors have to consider those risks related to their responsibility. They could be separated into external – political, world economy, NIMBY (not in my back yard) objectors and so on – and internal – connected to technical matters, materials, labour force, ground condi-tions and many other factors that could affect day-to-day construction work.
Recently, with the trend towards privately financed public projects and public–private partnerships, there has been an attempt at greater sharing of risks. For example, instead of leaving a particular risk up to the contractor, the owner might agree to share it.
To take a backyard example: I want a swimming pool in my garden. I think it is all soft soil since we have dug some holes (test pits in infrastructure parlance) and poked about (test borings) to see if it there is anything else
there. I had neither the money nor the tools to cover every square metre though. You could ask the contractor for a quote (or several contractors for bids), telling him or them what you think you know of the ground but adding that what-ever is there is their risk, since you need a firm price. They will, if they are smart and not too hungry for work, assume that something might be there, and add a contingency into their bid.
Or you could offer to share the risk. Ask them for a firm price assuming 10% is rock (or less or more, whatever you guess to be reasonable) but agreeing to pay them so much per measure of volume or weight above that amount, if it exists. The contractor then has a limit to his risk and can give you (you hope) a worthwhile lower fixed price. You run the risk of paying more if there is indeed more rock but we would hope still less than you would have paid in the original “contractor-takes-all-the-risk” proposal.
Whether you are the owner or the contractor, the outcome costs and completion date of the work are frequently seen, along with the quality of the work, as the predominant measures of a successful contract. “On time, on budget” is a phrase we in construction love to hear and therefore strive for. After all, the pro-ject can then be put to use to benefit the public or to generate revenue, or both, when we said it would. The project’s backers, whether financial, political or local stakeholders, are happy – the detractors are quietened, if not silenced once and for all.
Quantifying the time risks
So it is not only costs that are crucial to success, but times as well. How do we arrive at a most likely outcome for them? What is that final cost and final completion date that we can take to the bank – literally in some cases?
Each risk, as we have outlined them above (and not forgetting the opportunities), can be described, and a probability of its occurrence guessed at, a range of values for its effect on the duration and the cost of the work quantified, mitigation efforts considered and responsibility for action assigned.
Of course this is not a static exercise that happens just once in the life of a project. Risks be-come known as the work progresses, are solved, mitigated or just have to be lived with. They can be shared or not shared, insured or not insured (or indeed may be uninsurable). New risks and opportunities appear and have to be added into
the mix, possibly affecting the ultimate outcome or some of the milestone outcomes along the way. Therefore an additional purpose of risk management to that of forecasting outcomes is to improve the effective management of changes throughout its progress.
Information and uncertainty are key characteristics of complex construction projects, affecting the targets of cost, time and quality. A probabilistic approach to determining a most likely outcome is now considered standard practice in risk management, with particular application to large and complex construction projects.
First, and at the risk of oversimplifying for our statistician readership, some definitions:
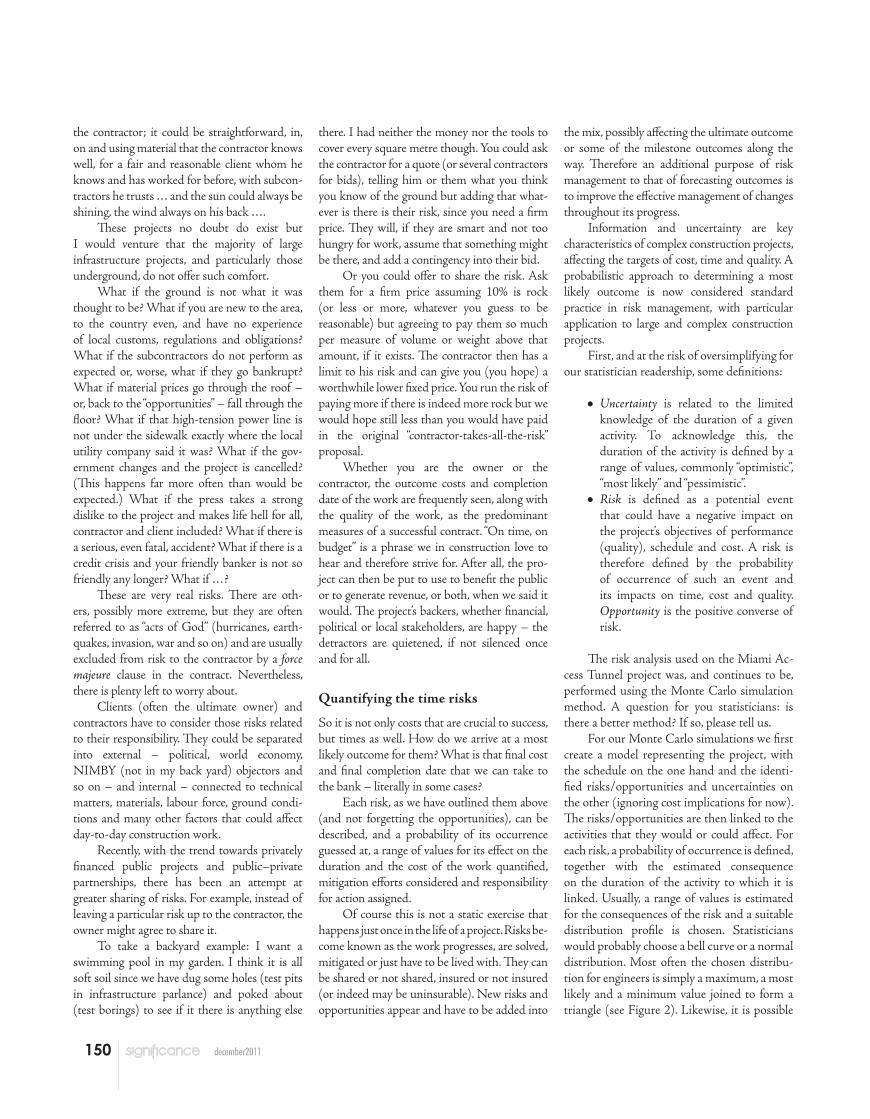
•Uncertainty is related to the limited knowledge of the duration of a given activity. To acknowledge this, the duration of the activity is defined by a range of values, commonly “optimistic”, “most likely” and “pessimistic”.
•Risk is defined as a potential event that could have a negative impact on the project’s objectives of performance (quality), schedule and cost. A risk is therefore defined by the probability of occurrence of such an event and its impacts on time, cost and quality. Opportunity is the positive converse of risk.
The risk analysis used on the Miami Ac-cess Tunnel project was, and continues to be, performed using the Monte Carlo simulation method. A question for you statisticians: is there a better method? If so, please tell us.
For our Monte Carlo simulations we first create a model representing the project, with the schedule on the one hand and the identi-fied risks/opportunities and uncertainties on the other (ignoring cost implications for now). The risks/opportunities are then linked to the activities that they would or could affect. For each risk, a probability of occurrence is defined, together with the estimated consequence on the duration of the activity to which it is linked. Usually, a range of values is estimated for the consequences of the risk and a suitable distribution profile is chosen. Statisticians would probably choose a bell curve or a normal distribution. Most often the chosen distribu-tion for engineers is simply a maximum, a most likely and a minimum value joined to form a triangle (see Figure 2). Likewise, it is possible
151december2011
to define the uncertainty of the duration of an activity by a range of values with a certain distribution profile instead of a single value.
The Monte Carlo-based program then calculates the combined effect of all the risks on the schedule and, eventually, on the end date of the project. The steps are as follows:
•For each risk, a value is selected randomly within the specified range of values of the consequences.
•The outcome is calculated by combining the values selected for each risk.
•The calculation is repeated a number of times to obtain a statistical distribution of the project outcome. Usually, a thousand cycles is enough to make the bias of sampling insignificant.
The big machine
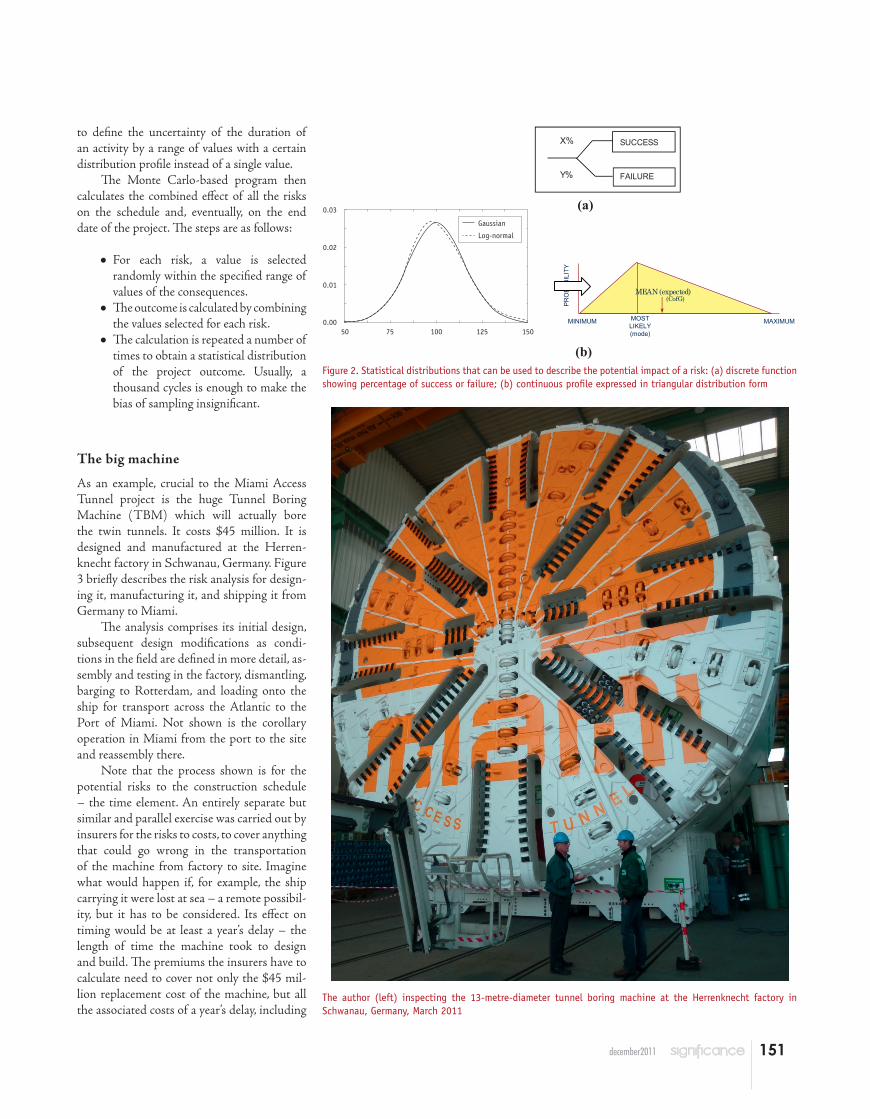
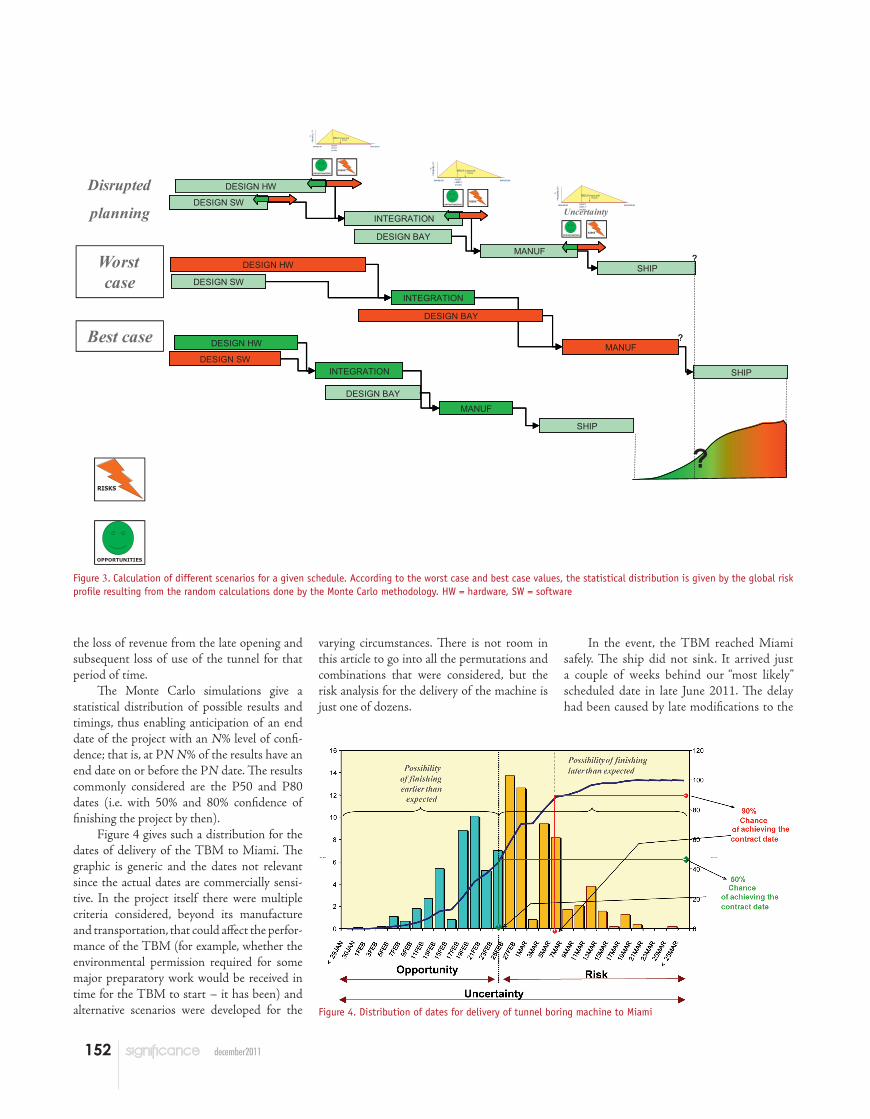
As an example, crucial to the Miami Access Tunnel project is the huge Tunnel Boring Machine (TBM) which will actually bore the twin tunnels. It costs $45 million. It is designed and manufactured at the Herren-knecht factory in Schwanau, Germany. Figure 3 briefly describes the risk analysis for design-ing it, manufacturing it, and shipping it from Germany to Miami.
The analysis comprises its initial design, subsequent design modifications as condi-tions in the field are defined in more detail, as-sembly and testing in the factory, dismantling, barging to Rotterdam, and loading onto the ship for transport across the Atlantic to the Port of Miami. Not shown is the corollary operation in Miami from the port to the site and reassembly there.
Note that the process shown is for the potential risks to the construction schedule – the time element. An entirely separate but similar and parallel exercise was carried out by insurers for the risks to costs, to cover anything that could go wrong in the transportation of the machine from factory to site. Imagine what would happen if, for example, the ship carrying it were lost at sea – a remote possibil-ity, but it has to be considered. Its effect on timing would be at least a year’s delay – the length of time the machine took to design and build. The premiums the insurers have to calculate need to cover not only the $45 mil-lion replacement cost of the machine, but all the associated costs of a year’s delay, including
Figure 2. Statistical distributions that can be used to describe the potential impact of a risk: (a) discrete function showing percentage of success or failure; (b) continuous profile expressed in triangular distribution form
The author (left) inspecting the 13-metre-diameter tunnel boring machine at the Herrenknecht factory in Schwanau, Germany, March 2011
SUCCESS
FAILURE
X%
Y%
(a)
%P
RO
BA
BIL
ITY
MAXIMUMMOSTLIKELY(mode)
MINIMUM
MEAN (expected)(CofG)
(b)
15010050 75 1250.00
0.02
0.01
0.03
Gaussian
Log-normal
152 december2011
the loss of revenue from the late opening and subsequent loss of use of the tunnel for that period of time.
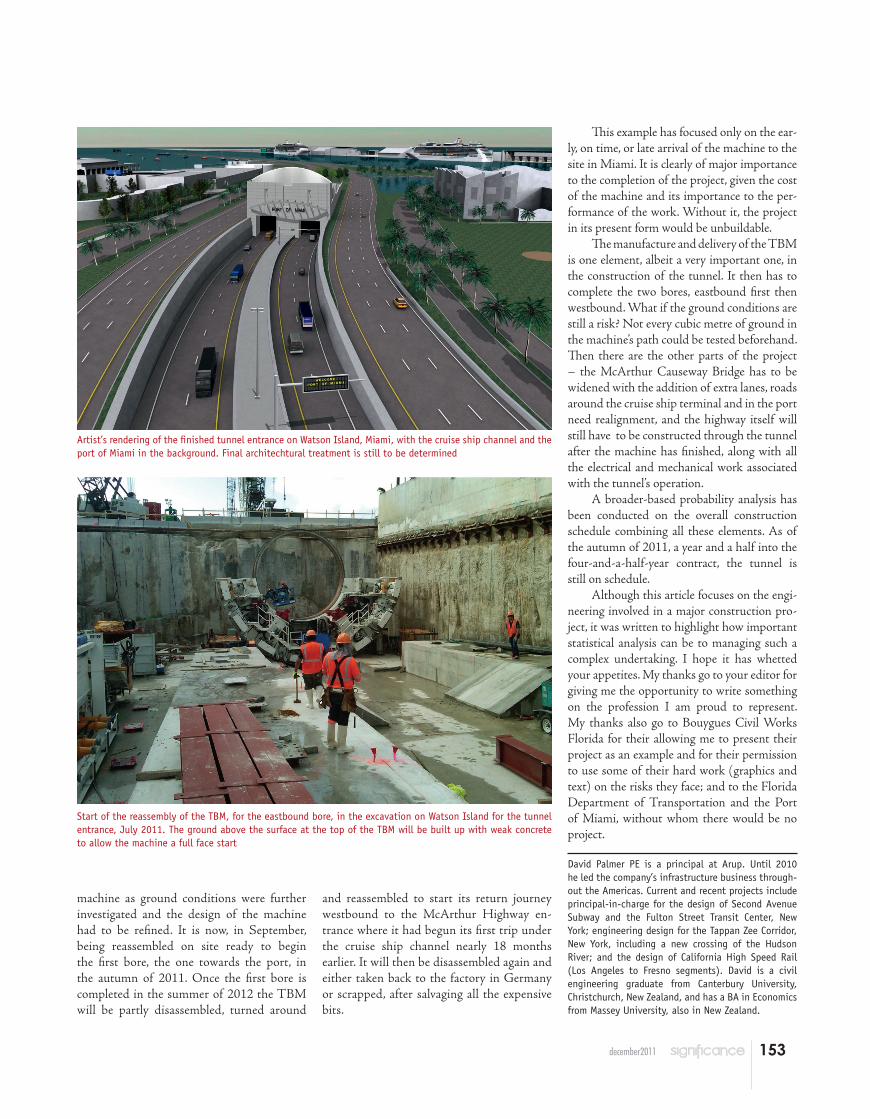
The Monte Carlo simulations give a statistical distribution of possible results and timings, thus enabling anticipation of an end date of the project with an N% level of confi-dence; that is, at PN N% of the results have an end date on or before the PN date. The results commonly considered are the P50 and P80 dates (i.e. with 50% and 80% confidence of finishing the project by then).
Figure 4 gives such a distribution for the dates of delivery of the TBM to Miami. The graphic is generic and the dates not relevant since the actual dates are commercially sensi-tive. In the project itself there were multiple criteria considered, beyond its manufacture and transportation, that could affect the perfor-mance of the TBM (for example, whether the environmental permission required for some major preparatory work would be received in time for the TBM to start – it has been) and alternative scenarios were developed for the
varying circumstances. There is not room in this article to go into all the permutations and combinations that were considered, but the risk analysis for the delivery of the machine is just one of dozens.
In the event, the TBM reached Miami safely. The ship did not sink. It arrived just a couple of weeks behind our “most likely” scheduled date in late June 2011. The delay had been caused by late modifications to the
DESIGN HW
INTEGRATION
MANUF
SHIP
DESIGN SW
DESIGN BAY
?
DESIGN HW
INTEGRATION
MANUF
SHIP
DESIGN SW
DESIGN BAY
?DESIGN HW
INTEGRATION
MANUF
SHIP
DESIGN SW
DESIGN BAY
?
DESIGN HW
INTEGRATION
MANUF
SHIP
DESIGN SW
DESIGN BAY
?DESIGN HW
INTEGRATION
MANUF
SHIP
DESIGN SW
DESIGN BAY
DESIGN HW
INTEGRATION
MANUF
SHIP
DESIGN SW
DESIGN BAY
?
Disrupted
planning
Worst case
Best case
RISKSOPPORTUNITIES
RISKSOPPORTUNITIES
RISKSOPPORTUNITIES
RISKS
OPPORTUNITIES
Uncertainty
%P
RO
BA
BILI
TY
MAXIMUMMOSTLIKELY(mode)
MINIMUM
MEAN (expected)(CofG)
%P
RO
BAB
ILIT
Y
MAXIMUMMOSTLIKELY(mode)
MINIMUM
MEAN (expected)(CofG)
%PR
OB
AB
ILIT
Y
MAXIMUMMOSTLIKELY(mode)
MINIMUM
MEAN (expected)(CofG)
Figure 3. Calculation of different scenarios for a given schedule. According to the worst case and best case values, the statistical distribution is given by the global risk profile resulting from the random calculations done by the Monte Carlo methodology. HW = hardware, SW = software
Figure 4. Distribution of dates for delivery of tunnel boring machine to Miami
153december2011
machine as ground conditions were further investigated and the design of the machine had to be refined. It is now, in September, being reassembled on site ready to begin the first bore, the one towards the port, in the autumn of 2011. Once the first bore is completed in the summer of 2012 the TBM will be partly disassembled, turned around
and reassembled to start its return journey westbound to the McArthur Highway en-trance where it had begun its first trip under the cruise ship channel nearly 18 months earlier. It will then be disassembled again and either taken back to the factory in Germany or scrapped, after salvaging all the expensive bits.
Artist’s rendering of the finished tunnel entrance on Watson Island, Miami, with the cruise ship channel and the port of Miami in the background. Final architechtural treatment is still to be determined
Start of the reassembly of the TBM, for the eastbound bore, in the excavation on Watson Island for the tunnel entrance, July 2011. The ground above the surface at the top of the TBM will be built up with weak concrete to allow the machine a full face start
This example has focused only on the ear-ly, on time, or late arrival of the machine to the site in Miami. It is clearly of major importance to the completion of the project, given the cost of the machine and its importance to the per-formance of the work. Without it, the project in its present form would be unbuildable.
The manufacture and delivery of the TBM is one element, albeit a very important one, in the construction of the tunnel. It then has to complete the two bores, eastbound first then westbound. What if the ground conditions are still a risk? Not every cubic metre of ground in the machine’s path could be tested beforehand. Then there are the other parts of the project – the McArthur Causeway Bridge has to be widened with the addition of extra lanes, roads around the cruise ship terminal and in the port need realignment, and the highway itself will still have to be constructed through the tunnel after the machine has finished, along with all the electrical and mechanical work associated with the tunnel’s operation.
A broader-based probability analysis has been conducted on the overall construction schedule combining all these elements. As of the autumn of 2011, a year and a half into the four-and-a-half-year contract, the tunnel is still on schedule.
Although this article focuses on the engi-neering involved in a major construction pro-ject, it was written to highlight how important statistical analysis can be to managing such a complex undertaking. I hope it has whetted your appetites. My thanks go to your editor for giving me the opportunity to write something on the profession I am proud to represent. My thanks also go to Bouygues Civil Works Florida for their allowing me to present their project as an example and for their permission to use some of their hard work (graphics and text) on the risks they face; and to the Florida Department of Transportation and the Port of Miami, without whom there would be no project.
David Palmer PE is a principal at Arup. Until 2010 he led the company’s infrastructure business through-out the Americas. Current and recent projects include principal-in-charge for the design of Second Avenue Subway and the Fulton Street Transit Center, New York; engineering design for the Tappan Zee Corridor, New York, including a new crossing of the Hudson River; and the design of California High Speed Rail (Los Angeles to Fresno segments). David is a civil engineering graduate from Canterbury University, Christchurch, New Zealand, and has a BA in Economics from Massey University, also in New Zealand.