Embed Size (px)
Citation preview
Will Additional Federal Enforcement Improve
the Performance of Pipelines in the U.S.?
Sarah Stafford College of William and Mary
College of William and Mary Department of Economics
Working Paper Number 144
Current Version: August 2013
COLLEGE OF WILLIAM AND MARY DEPARTMENT OF ECONOMICS WORKING PAPER # 144 August 2013
Will Additional Federal Enforcement Improve the Performance of Pipelines in the U.S.?
Abstract
This paper provides the first empirical analysis of the effectiveness of regulatory enforcement in increasing the environmental and safety performance of U.S. natural gas and hazardous liquid pipeline operators. The analysis combines data on federal regulatory inspections, enforcement actions, and penalties with data on injuries, fatalities, property damage, and barrels of product lost through pipeline “incidents” for 2006-2011 for the 344 largest pipeline operators in the U.S. The results of the analysis do not provide compelling evidence that either federal inspections or civil penalties are particularly effective in increasing performance; however, the number of federal cases initiated against an operator does have a significant effect on many forms of performance, although not for incidents in general. The results also suggest that some targeting of federal enforcement resources is based on past performance, but there may be room for even more effective targeting. Finally, the analysis reveals interesting patterns between state and federal enforcement efforts. Keywords: Regulation, Environmental Performance, Enforcement, Pipelines JEL Classification: K42, L95 Sarah Stafford Department of Economics College of William and Mary Williamsburg, VA 23187-8795 [email protected]
2
WillAdditionalFederalEnforcementImprovethePerformanceofPipelinesintheU.S.?
1. Introduction
Overthepastseveralyears,therolethatoilandnaturalgaspipelinesmightplayin
increasingtheU.S.’senergyindependencehasgainedsignificantattention.Inparticular,
TransCanada’sproposedKeystoneXLPipelinehasbeenthesubjectofheateddebate
betweenthosethatbelievetheprojectisacriticalpartoftheU.S.’senergysecuritystrategy
andwillhaveapositiveeffectonthecountry’seconomyandthosethatbelievetheproject
imposesunacceptablerisksforthenaturalenvironmentincludingdevastatingsensitive
environmentsandpollutingimportantwatersources.Anumberofrelativelyrecentevents
havereinforcedtheargumentsthatpipelinesposeseriousthreatstohumanhealthandthe
environment:inSeptemberof2010anaturalgaspipelineexplosioninSanBruno,
Californiaresultedinamassivefirethatkilledeightpeople,injureddozensofothers,and
destroyedover100homesandinJulyof2011anExxonMobilpipelinerupturespilledover
1,000barrelsofoilintothescenicYellowstoneRiver.
Inlate2011,theU.S.CongressapprovedandPresidentObamasignedthePipeline
Safety,RegulatoryCertainty,andJobCreationActtoimprovetheperformanceofpipelines.
Theactwaspassedduringthe112thCongress,oneoftheleastproductive–ifnottheleast
productive–legislativesessioninrecenthistory[1].Theactdrewunanimoussupportfrom
bothpartiesinpartbecauseofpublicoutcryovertheSanBrunoexplosionandthe
YellowstoneRiverspill.However,theactwasacompromiseanddidnotincludeallofthe
recommendedpolicychangesthatwereproposedbytheNationalTransportationSafety
Boardforincreasingpipelinesafety[2].Themainprovisionsoftheactareanincreasein
3
fundingforfederalinspectionsofpipelines(the“JobCreation”partoftheact)aswellasan
increaseinthefinesassociatedwithviolationsofpipelineregulations.Inaccordancewith
theact,theadministration’s2013fiscalyearbudgetincreasedfundingforthePipelineand
HazardousSafetyMaterialsAdministrationby60percentandadded120newfederal
inspectors.
Whilenumerousstudieshaveassessedtheeffectivenessoffederalenforcementin
improvingcompliancewithgeneralenvironmentalregulations,tomyknowledgetherehas
neverbeenasystematicevaluationoftheeffectoffederalenforcementeffortsonpipeline
performance.ThusitisnotclearwhetherthePipelineSafety,RegulatoryCertainty,andJob
CreationActwillactuallyaccomplishitsstatedgoalofincreasingpipelineperformance.In
particular,becausetheactwaspromptedbypublicpressuretodosomethingabout
pipelineperformance,asMay[3]pointsout,thecompromisesolutionmaynotfully
addresstheunderlyingregulatoryfailure.Thegoalofthispaperistoprovidethefirst
empiricalanalysisoftheeffectthatfederalpipelineenforcementonpipelineperformance.
Theresultsofthisanalysisshouldprovideinsightintowhetherthechangesmandated
underthePipelineSafety,RegulatoryCertainty,andJobCreationActarelikelytoachieve
theirgoalofimprovingpipelinesafety.
2. BackgroundonthePipelineIndustry
Manyliquidproductsaremostcost‐effectivelytransportedviapipelines.However,
manyoftheproductstransportedbypipelinecanposesignificantthreatstohumanhealth
andtheenvironmentifleakedorreleasedfromthepipeline.Althoughpipelinesare
designedandconstructedtomaintainstructuralintegritysincethetransportedmaterials
4
haveintrinsicvalue(unlikemanyeffluentsubstances,suchashazardouswastesorby‐
products),manyfactorsmakeitdifficulttoavoidleaksandotherreleasesduringa
pipeline’slifetime.Naturaldisasters,suchasflooding,earthquakes,andstorms,canresult
inpipelinefailures,ascanaccidentalhuman,machine,andanimalintrusions.Additionally,
pipelinesmaydevelopleaksorrupturesduetocorrosionfromthematerialsbeing
transportedormaterialfatiguefromfluctuatingtemperatureandpressureconditions.
IntheU.S.over2.5millionmilesofpipelinestransportnaturalgas,petroleum
productsandotherhazardousliquids.Overall,pipelinesarearelativelysafemodeof
transportationcomparedtoalternativessuchastankersandrailcars,andthepipeline
transmissionsafetyrecordhasimprovedsignificantlyovertime.However,morethan100
significantpipelinereleasesoccureachyear,anddeathsfrompipelineaccidentsare,
unfortunately,notrareoccurrences.
Priorto1968,pipelineswerenotsubjecttosafetyorenvironmentalregulations.In
1968,CongressestablishedtheOfficeofPipelineSafety(OPS),adivisionoftheDepartment
ofTransportation(DOT),todevelopandimplementsafetyregulationsfornaturalgas
pipelines.HazardousliquidpipelineswereaddedtoOPS’sportfolioin1979,butuntil2002
OPSwasgenerallyseenasineffectual,withweakenforcementandineffectiverules[4].In
2002,CongresspassedthePipelineSafetyImprovementAct,whichincreasedpenaltiesand
enforcementauthority,andlimitedOPSdiscretion.
OPSsetsthefederalstandardswithwhichallpipelineoperatorsmustcomply.Asis
truewithmanyotherregulations,statescananddopasssupplementalregulations.
Additionally,pipelinesin“highconsequence”areasaresubjecttoastrictersetofcontrols
duetotheincreasedriskfordamagetohumanhealthortheenvironment.Bothfederaland
5
stateregulatorsenforceOPSregulations.Intheory,standardinspectionsareconducted
everycoupleofyearsonallpipelinesandmoreoftenonpipelineswithhigherpotential
risks.Ifapipelinecrossesstateborders,enforcementgenerallyfallstoOPS,whilestates
inspectmostintrastatelines.However,notallstateshavebeencertifiedorapprovedto
conductintrastateinspections;inunapprovedstatesfederalregulatorsconductallpipeline
inspections.Conversely,OPShasauthorizedsomestatestoactasitsagentandinspectthe
sectionsofinterstatepipelinesthatrunthroughthestateinadditiontointrastatepipelines.
Tocomplementformalenforcement,regulatedpipelinesmustalsoself‐inspectandreport
anyviolationsdiscoveredduringthecourseofrequiredinspections.
OPSisarelativelysmallagency.In2011priortothepassageofthePipelineSafety,
RegulatoryCertainty,andJobCreationAct,therewereunder120inspectorsworkingfor
OPSoutoffiveregionaloffices(Trenton,NJ;Atlanta,GA;KansasCity,MO;Houston,TX;and
Denver,CO)[5].Anadditional300stateinspectorscarryoutthemajorityofpipeline
inspections.Standardinspectionsaredesignedtoensurethatoperationandmaintenance
procedures,abnormalandemergencyoperatingprocedures,damagepreventionand
publiceducationprocedures,andpipelineinstallation,connection,repair,andoperations
areincompliancewiththerelevantregulations.Constructioninspectionsincludeareview
ofmaterialandcomponentdesignspecifications,weldingproceduresandwelder
qualifications,corrosionprotection,andinstallationaswellaspost‐constructiontesting.
Integritymanagementinspectionsaredesignedtodeterminewhetheranoperatorusesall
availableinformationaboutitspipelinesystemtoassessrisksandtakesappropriateaction
tomitigatethoserisks.
6
OPScaninitiateanenforcementcasewhenaninspectionidentifiesaviolationof
pipelineregulationsorinresponsetoanaccident.Thetypeofenforcementactiontaken
dependsonthesignificanceoftheviolation.Minorproblemsoccurringforthefirsttime
mayonlyreceiveawarningletter,whilemoresignificantviolationsmayrequirea
complianceorderthatspecifiesactionstheoperatormusttaketocomeintocompliance
(e.g.,requiringoperatorstoreplacepipelinesectionsorimplementcorrosioncontroland
remediationstrategies)oracivilpenalty.Civilpenaltiesaregenerallyreservedforserious
violationsleadingtodeaths,injuries,orsignificantenvironmentaldamage.Regulatorsmay
imposecivilpenaltiesassevereas$100,000foreachdayaviolationexisted,uptoa
maximumof$1,000,000.Since2008,OPShasproposedover$21millionincivilpenalties
[6].
Therearecurrently2,705regulatedpipelineoperatorsintheU.S.Ofthese,1,921
operatelessthan10milesofpipeline,440operatebetween10and100milesofpipeline,
and344operate100milesormoreofpipeline.In2010,22fatalitiesand109injurieswere
attributedtopipelineincidents.Ofcoursethesenumbersarequitevariable–overthelast
20years,thenumberoffatalitieshasrangedfromalowof7in2001toahighof53in
1996.Similarlythenumberofinjurieshasrangedfromalowof36in2006toahighof127
in1996.Ofcourseinjuriesanddeathsarenottheonlydamagesthatresultfrompoor
pipelineperformance.In2010,pipelineincidentsresultedinalmost$1.4billiondollarsof
propertydamageandalmost175,000barrelsofspilledhazardousliquids.Onthe
enforcementside,in2010federalregulatorsconductedaround600pipelineinspections,
initiatedjustover200enforcementactionsandassessedover$4.5milliondollarsin
penalties.Duringthesametimeperiodstateregulatorsloggedalmost38,000inspection
7
days,discoveredalmost14,000violations,initiatedover4,000enforcementactions,and
assessedover$13milliondollarsinpenalties.
3. RelatedLiterature
Theobjectiveofthispaperistobetterunderstandtherolethatfederalinspections
andenforcementactionsplayinincreasingpipelineperformanceandcompliance.Tomy
knowledge,therearenoexistingpapersthatexplicitlymodelcompliancewithpipeline
regulations,eithertheoreticallyorempirically.1However,thereisalargeliterature
examiningcompliancewithenvironmentalregulationsmorebroadly,andIusethisasa
startingpointfortheanalysis.
Thetraditionaleconomicviewofenvironmentalcomplianceandperformance
assumesthataregulatedentity’sdecisiontocomplywithenvironmentalregulationsisa
rationalonebasedontheobjectiveofprofitmaximization.Thebasicframeworkforthese
modelsisBecker's[8]paperontheeconomicsofcrime,whichwasadaptedbyRussell,
Harrington,andVaughan[9]toprovideacomprehensiveapplicationtoenvironmental
regulation.Whileanumberofinterestingvariationsonthesemodelshavebeendeveloped
overthepasttwodecadestoallowforvariouscomplexitiessuchasimperfectinformation,
self‐reporting,principal‐agentrelationships,anddynamicsettings,inallofthese
deterrence‐basedmodelscomplianceandperformanceareultimatelyimprovedby
increasingtheexpectedcostofnoncompliance–eitherbyincreasingthelikelihoodthata
violatorgetscaughtorbyincreasingthelevelofsanctionsassociatedwithviolations.
1Thereareanumberofpapersthatanalyzepipelineincidentsfromanengineeringperspectivetobetterunderstandthedistributionofpipelinefailures(see,forexampleSosaandAlvarez‐Ramirez[7]).Thesepapersdonotexamineregulatorystructuresorpolicies.
8
Whiledeterrence‐basedmodelsdominatetheeconomicsliteratureon
environmentalenforcement,anumberofpapersinotherfieldshaverecognizedalternative
motivationsforcomplianceorreasonsfornonperformance.Forexample,aregulatedentity
maycomplywithregulationsoutofaninherentsenseofdutytoobeyrulesorbecauseof
socialpressure,eveniftheprobabilityofdetectionisveryloworthepunishmentfora
violationisnegligible.Alternatively,evenwithseveresanctionsorahighprobabilityof
detection,ifaregulatedentity’smanagersdonotunderstandtheregulatoryrequirements,
orhavepoorinternalcontrols,evenwellintentionedregulatedentitiesmaystillviolate
regulations.Finally,someviolations,suchasthosetriggeredbyextremeweather,may
occurdespitearegulatedentity’sfullycompliantoperations.Insuchcases,deterrence‐
basedmeasureswouldprovegenerallyineffectiveatincreasingperformance.Ofcourse,
whilesometheoreticalmodelsfocusonaparticularmotiveunderlyingthecompliance
decision,inpracticethecompliancedecisionislikelytodependonanumberofdifferent
objectivesandfactorsthatdifferacrossfacilities.
AccordingtoGrayandShimshack[10],mostpolicy‐makersandscholarsbelieve
thatanenforcementregimeofinspectionsandsanctionsisgenerallyeffectiveatincreasing
compliancewithenvironmentalregulations,andmostregulatedentitiesciterigorous
monitoringandenforcementasaprimarymotivatoroftheirenvironmentalcompliance
decisions.Anumberofempiricalanalysesconfirmthesebeliefs.Forexample,Grayand
Deily[11]andGrayandShadbegian[12]examineairpollutioncomplianceforsteelmills
andpulpandpapermillsintheU.S.,respectively,andfindthatbothinspectionsand
enforcementactionshaveastatisticallysignificantpositiveimpactoncompliance.Looking
atcompliancewithU.S.waterregulations,Earnhart[13]andGlicksmanandEarnhart[14]
9
similarlyfindthatinspectionsandsanctionsdeterviolationsandreduceemissionsatwater
treatmentplantsandchemicalfacilities,respectively.Stafford[15]showsthatcompliance
inspectionsandpenaltiesforviolationshaveasignificantdeterrenteffectonviolationsat
facilitiessubjecttohazardouswasteregulations.2
Theseresultsfromtheenvironmentalcomplianceliteratureechofindingsinother
regulatoryareas.Inparticular,anumberofpapersexaminethedeterrenteffectof
OccupationalSafetyandHealthAdministration(OSHA)inspectionsandsanctionson
workplaceinjuries.Manyofthesepapersfindthatinspectionsandsanctionsdodeter
injuries,althoughtheeffectsofdeterrencedependsignificantlyonthecharacteristicsofthe
regulatedentitybeinginspectedorsanctionedandwhethertheinspectionresultsina
sanction[16,17,18].Thegoalofthispaperistoaddevidencefromanothercloselyrelated
regulatorysector,pipelines,onthedeterrenteffectoffederalinspectionsandenforcement
actionsinincreasingcomplianceandperformance.
4. FrameworkfortheAnalysisandDescriptionoftheData
Whilepipelinesarefixedstructures,theyarenotconstrainedwithinaparticular
geographicarealikemostentitiessubjecttoenvironmentalandsafetyregulations.While
manypipelinearerelativelyshort,therearealsooperatorsthathavethousandsofmilesof
pipelinecrossingnumerousstateborders.Federalandstateregulatorsdodividepipelines
into'inspectionunits'.Foroperatorswithshortpipelines,theentirecompanymay
constituteoneinspectionunitwhilelargeroperatorsmaybedividedbasedonoperating
areas(e.g.,citiesormetropolitanareas)orcompanyorganization(e.g.,allelements2SeeGrayandShimshack[10]foracomprehensivesurveyoftheempiricalliteratureonenvironmentalmonitoringandenforcement.
10
reportingtoasinglevicepresident).Unfortunately,dataonpipelineperformanceand
enforcementisnotavailableattheinspection‐unitlevel.Thusthisanalysisfocusesonthe
aggregateperformanceofindividualpipelineoperators,ratherthantheperformanceofa
particularsectionofapipeline.Thisanalysisismostanalogoustofirm‐levelstudiesof
complianceandenvironmentalperformance,suchasKhannaandAnton[19]andThornton,
Gunningham,andKagan[20],althoughitisbasedondatareportedtothefederal
governmentratherthandatacollectedthroughavoluntarysurvey.
Asdiscussedearlier,thereare2,705regulatedpipelineoperatorsintheU.S,over
two‐thirdsofwhooperatelessthan10milesofpipeline.Thisanalysisfocusesonthe344
operatorsthatoperate100milesormoreofpipeline.Theseoperatorsrepresentover90%
ofallpipelineincidentsthatoccurredbetween2006and2011and80%ofallfederal
inspectionsduringthatsametimeframe.OPSdefinesanincidentasanyeventthatresults
inadeathorpersonalinjurynecessitatingin‐patienthospitalization;anexplosionor
unintentionalfire;anyeventthatresultsinpropertydamageof$50,000ormore(excluding
costofmateriallost);anyeventthatresultsinunintentionallossoffivegallonsormoreof
hazardousliquidorcarbondioxideorthreemillioncubicfeetofgas;anyemergencythat
resultsinanemergencyshutdownofafacility;oranyothereventthatissignificantinthe
judgmentoftheoperator.
ThePipelineandHazardousMaterialsSafetyAdministration(PHMSA)provides
dataontheperformanceofpipelineoperatorsstartingin2006.3Theperformance
measuresincludethetotalnumberofreportedincidents,fatalities,andinjurieseachyear;
thetotaldollaramountofpropertydamagereportedeachyear;andthereportedtotal
3TheOPSisanofficewithinthePHMSA.
11
barrelsofproductspilledandthenetbarrelsofproductlosteachyear.Whilethesedataare
self‐reported,thecivilpenaltiesfornotreportinganincidentwithin30dayscanbeupto
$1milliondollarsandanyindividualthat“willfullyandknowinglyviolates”the
requirementscanfaceacriminalfineofupto$25,000andbeimprisonedforuptofive
years.Additionally,manyofthepipelineincidentsdirectlyaffectorinvolvethirdparties,
makingitmuchlesslikelythatoperatorscouldunder‐reportthoseincidents.Forexample,
almostthree‐quartersofthepipelinefatalitiesandthree‐quartersofthepipelineinjuries
reportedduringthe2008to2012periodinvolvedthird‐party(non‐industry)individuals.4
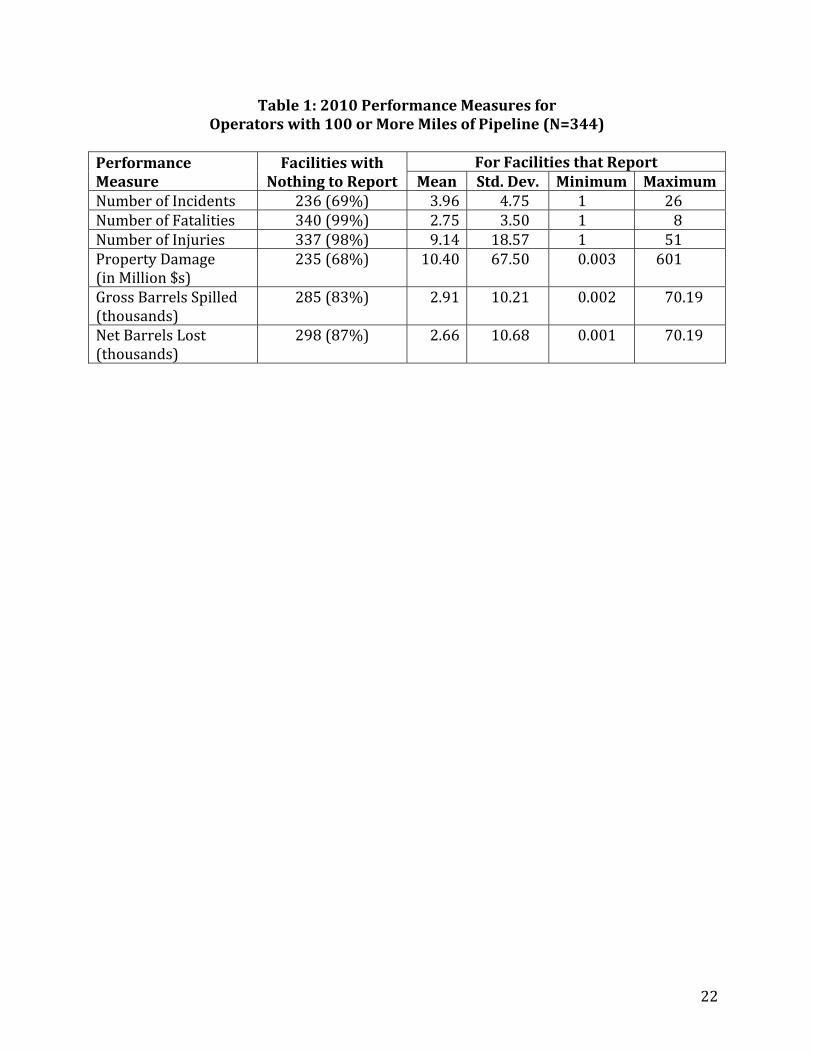
Table1presentsasummaryoftheperformancemeasuresfor2010forthe
operatorsinthisstudy.First,notethatforallofthesemeasures,themajorityofoperators
havenothingtoreport.Themostwidelyreportedmeasureispropertydamage,followed
closelybyincidents.Propertydamageisreportedmoreoftenthanincidentsbecauseevents
thatcauselessthan$50,000inpropertydamagearenotconsideredincidentsiftheydonot
alsoresultinfatalities,significantinjuries,orsufficientlossofmaterial.Giventherelatively
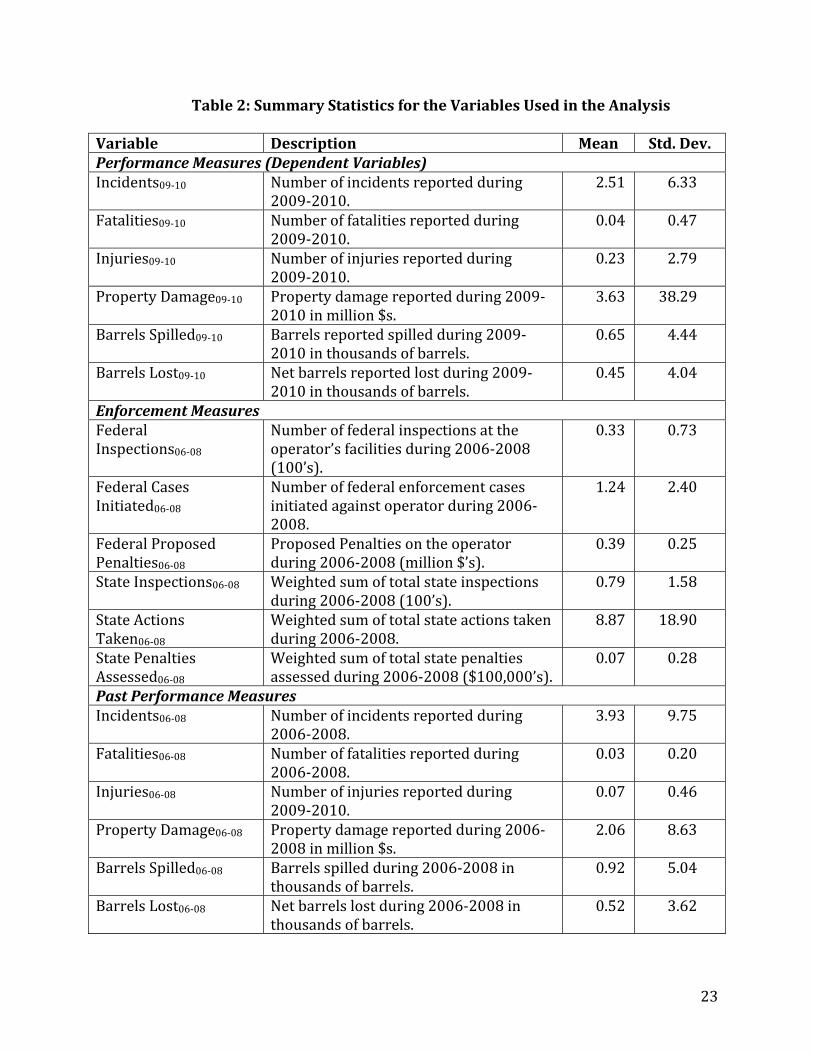
smallnumberofoperatorsthatreportinagivenyear,Iaggregateperformancedatafor
2009and2010toincreasethenumberofoperatorsreporting.Themeanandstandard
deviationsfortheaggregateddataarepresentedinTable2whichincludessummary
statisticsforallvariablesusedintheanalysis.Notethatthesummarystatisticsareforall
operatorsinthestudy,notjustthosereporting.
Oneoftheprincipalchallengesthatcanarisewhentryingtoestimatethe
effectivenessofinspectionsandenforcementonperformanceisthatofendogeneityor
reversecausality,whichcanoccurifthereareomittedexplanatoryvariablesorthe4See“ConsequencestothePublicandthePipelineIndustry”availableathttp://primis.phmsa.dot.gov/comm/reports/safety/cpi.html(lastaccessedJuly11,2013).
12
complianceandenforcementdecisionsaremadesimultaneously.Withrespecttothe
omittedvariablesconcern,duetodatalimitationstheanalysismaynotincludesome
factorsthataffectboththeoperator’senvironmentalperformanceaswellastheregulator’s
decisiontoconductinspections.Forexample,significantfloodinginanareamaycause
pipelinestorupture,butmightalsobringincreasedinspectionstothatarea.Withrespect
tothesimultaneityconcern,contemporaneousinspectionsmaybeendogenoustothe
numberofincidentsreportedifinspectionsserveasasignificantmechanismthrough
whichincidentsarediscoveredorreported.Similarly,thenumberofenforcementcases
andamountofproposedpenaltiesinaparticularperiodarelikelytodependonthe
numberofincidentsandfatalitiesthatoccurinthatsametimeperiod.Toaddressthis
concernIlagtheenforcementvariables,whichmaybeendogenous,andIalsoincludethe
laggeddependentvariableasanexplanatoryvariable.IdeallyIwouldalsousean
instrumentalvariablesapproachtocontrolforendogeneity,butduetothelimited
informationavailableaboutpipelineinspectionsandenforcement,Ihavenotbeenableto
findanyvalidinstrumentstouseforsuchanapproach.
ThefirstsetofexplanatoryvariablespresentedinTable2depictsthelevelof
federalandstateenforcementforeachoperatorintheanalysis.Thethreefederalmeasures
–FederalInspections06‐08,FederalCasesInitiated06‐08,andFederalProposedPenalties06‐08–
eachcaptureadifferentaspectofthespecificdeterrenceaparticularoperatorfacesfrom
federalsources,astheycapturethelevelofinspectionsandenforcementforthatspecific
operatorduringthe2006‐2008period.Incontrast,thethreestatemeasuresareallgeneral
deterrencemeasuresthatcapturethegenerallevelofenforcementforthestatesthrough
whichtheoperator’spipelinesrun.Thestatemeasuresaregeneralmeasuresratherthan
13
specificmeasuresbecausethestatedataisonlyavailableattheaggregatelevel.Foreach
stateIfirstnormalizetherelevantvariableX–StateInspections06‐08,StateActionsTaken06‐
08,andStateAssessedPenalties06‐08–bythetotalnumberofpipelinemilesinthestate.For
eachoperatori,Ithenusedataonthetotalnumberofpipelinemilestheoperatorhasin
eachstatejtoconstructeachmeasureXforthatoperatorasfollows:
Milesij *X j
Miles jj
ThestateinspectiondatawasobtainedthroughaFreedomofInformationActrequest,
whilethedataonstatecomplianceactionstakenandpenaltiesassessedwascollectedfrom
thePHMSAwebsite.
Thenextsetofexplanatoryvariablesmeasurespastreportedperformance(i.e.,
reportedperformanceduringthe2006‐2008period)and,duetolimiteddatacapturing
operatorcharacteristics,isusedinconjunctionwiththeanalogous2009‐2010variablesto
controlfordifferencesinunderlyingpropensitiestocomplywithpipelineregulations.
Additionally,SosaandAlvarez‐Ramirez[7]showthatthenumberofpreviousincidents
positivelycorrelateswithfutureincidents.OneoftheoperatorcharacteristicsthatIcan
controlforistheMilesofpipelinetheoperatorowns.BothMilesandMilesSquaredare
includedintheanalysistoaccountforthefactthatlongerpipelineshavemore
opportunitiesforfailure.IalsoincludethedummyvariableIntrastatethatindicates
whetherthepipelineisconfinedwithinasinglestate.WhileOPSconcentratesenforcement
effortsoninterstatepipelines,federalinspectorsdoinspectintrastatepipelineson
occasion.NumberofStatesmeasuresthenumberofstatesthroughwhichthepipeline
passes,whilethefourregionaldummiescapturetheCensusregion(s)inwhichthe
14
operatoroperates.Finallytherearefourdummyvariablesthatcapturethetypeof
pipelinesandthematerialstransportedinthepipelinesthateachoperatorowns:
GasGatheringlinescollectandmovenaturalgasfromwellsoroffshorevesselsto
storageorprocessingfacilities.
GasTransmissionlinestransportnaturalgasfromgatheringlinesorstorage
facilitiestodistributioncenters,storagefacilities,powerplants,andindustrial
customersandmunicipalities.Thesearegenerallythelongesttypeofgaslinesand
areusuallyunderground.
GasDistributionlinesmovenaturalgastoindustrialcustomersandresidencesand
areusuallylocatedinundergroundutilityeasementsalongstreets.
HazardousLiquidlinestransportpetroleumproductsandotherhazardousliquids,
usuallyoverlongdistancesandunderground.
5. ResultsandPolicyImplications
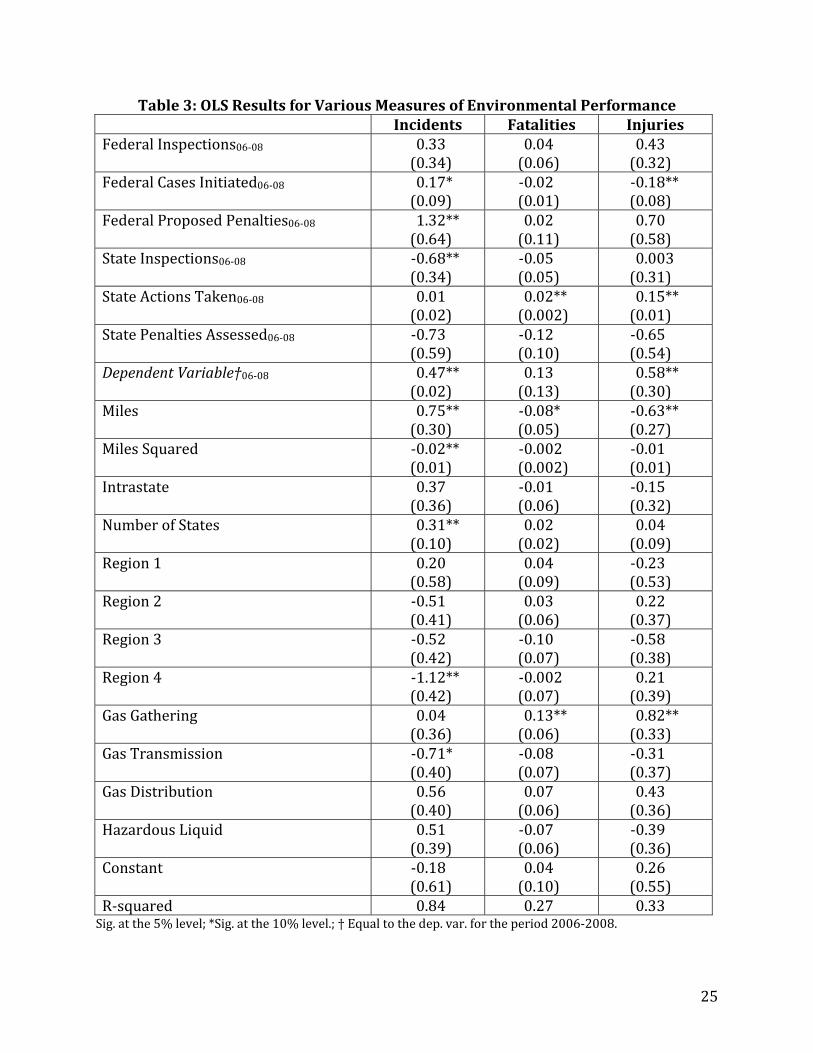
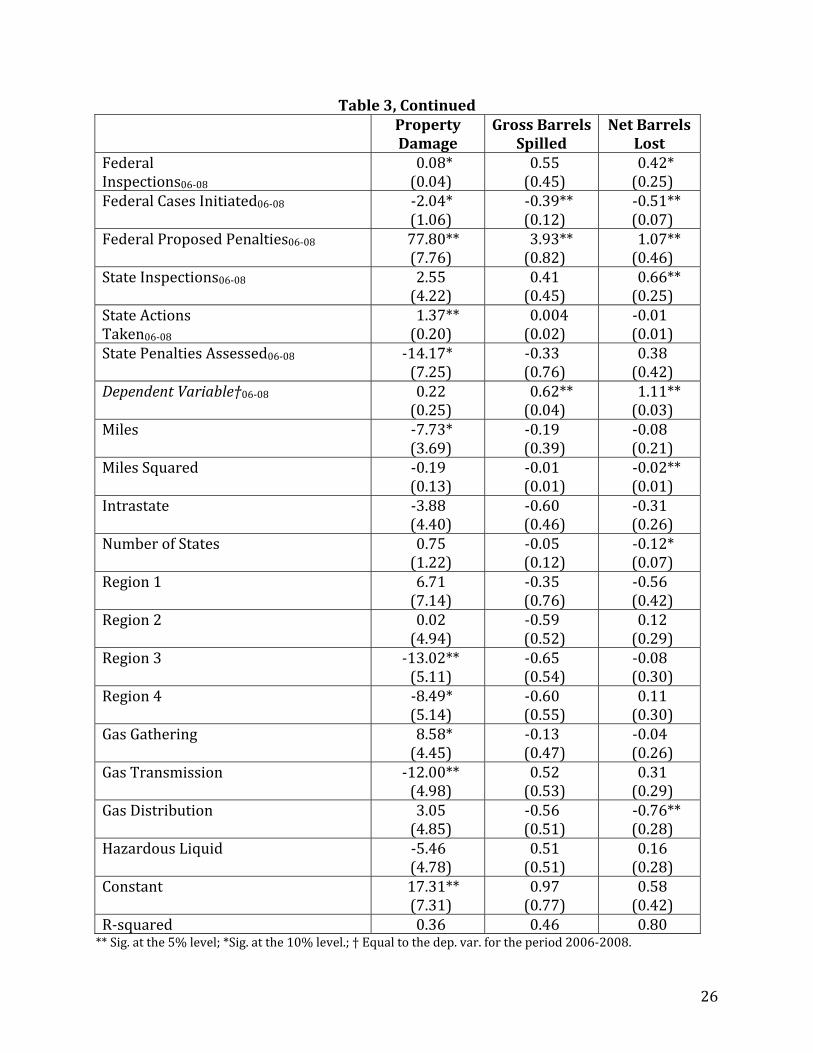
Table3presentstheresultsoftheordinaryleastsquaresregressionforeachofthe
2009to2010reportedperformancevariables.Inthefirstcolumn,thedependentvariable
isthenumberofincidentsreportedin2009and2010.Lookingfirstatthefederal
enforcementvariables,noticethatnoneofthecoefficientsarenegative.Moreover,the
positivecoefficientsforFederalCasesInitiated06‐08andFederalProposedPenalties06‐08are
bothsignificant–theoppositeofwhatonewouldexpectifpastenforcementactionsserved
toincreaseoverallenvironmentalperformance.Onepossibleexplanationcouldbethatit
takesalongperiodoftimeforoperatorstochangetheirperformance;thus,operatorswith
pastincidentsthatwarrantedsignificantenforcementmaybemorelikelytocontinueto
15
reportahighnumberofincidents.Tocontrolforthis,Ididincludepastincidents
(DependentVariable06‐08)intheregression,whichalsohasapositiveandsignificantsign,
butitmaynotbeaperfectcontrol.Theresultsforthestateenforcementvariablesaremore
consistentwithexpectations.BothStateInspections06‐08andStatePenaltiesAssessed06‐08
havenegativecoefficients,andtheformerissignificant.
Lookingacrosstheotherperformancevariables,itisinterestingtonotethatthe
resultsfortheenforcementmeasuresarequitemixed.FederalInspections06‐08andFederal
ProposedPenalties06‐08,alwayshavepositivecoefficients,andthosecoefficientare
significantinanumberoftheregressions.Ontheotherhand,FederalCasesInitiated06‐08
hasanegativecoefficientforallbuttheIncidentsregression,andthecoefficientis
significantforallbuttheFatalitiesregression.Thestateenforcementresultsarealso
mixed.Incontrasttothenegativerelationshipbetweenfederalcasesandperformance–or,
morecorrectly,non‐performance–allofthesignificantcoefficientsonStateActions
Taken06‐08arepositive.Similarly,whilefederalproposedpenaltiesarepositivelyrelatedto
non‐performanceinmostoftheregressions,allofthecoefficientsonStatePenalties
Assessed06‐08arenegative.StateInspections06‐08hasanegativeandsignificantcoefficient
onlyintheIncidentsregression,buthasapositiveandsignificantcoefficientintheNet
BarrelsLostregression.Whileonemightexpectthatsomeofthisinconsistencycouldbe
causedbymulticollinearityamongthefederalandstateenforcementvariables,the
variablesarenotashighlycorrelatedasonemightexpect.Onlythreepairsofvariables
haveacorrelationcoefficientabove0.6:FederalInspectionsandFederalCasesInitiated
haveacorrelationcoefficientof0.67;FederalInspectionsandStateInspectionshavea
16
correlationcoefficientof0.70,andStateInspectionsandStateActionsTakenhavea
correlationcoefficientof0.76.
Clearlytheseresultspaintaverymixedpictureoftheeffectivenessoffederaland
stateenforcementeffortsatdeterringpoorenvironmentalperformanceatpipelines.In
particular,intermsofpredictingthesuccessofthePipelineSafety,RegulatoryCertainty,
andJobCreationActinincreasingpipelinesafety,thereisnoevidencethatindicates
federalinspectionsorfinesincreaseenvironmentalperformance,althoughthereissome
evidencethatstateinspectionsandpenaltiescanhavesuchaneffect.5WhileFederalCases
Initiated06‐08doeshavearelativelyconsistentnegativeandsignificanteffectonnon‐
performance,thePipelineSafety,RegulatoryCertainty,andJobCreationActexplicitly
focusesonincreasedfederalinspectionsratherthanmorerigorousenforcement;thus,itis
notclearhowthenumberofcasesinitiatedwillchangewithincreasedenforcement
resources.
TheremainingresultsinTable3providesomeinsightintowhyfederalenforcement
maynotbeparticularlyeffectiveatdecreasingpoorenvironmentalperformance.First,
observethatthecoefficientonthelaggeddependentvariableineachregression(listedas
DependentVariable06‐08)ispositiveandsignificantforfouroftheregressions.Thus,for
overallincidents,injuries,grossbarrelsspilled,andnetbarrelslost,thereisconsiderable
persistenceacrosstime–particularlywhenonerecallsthedifferenceintimeframesacross
thetwovariables(threeyearstotwoyears).Thelesspredictablenatureoffatalitiesand
5Onemightbeconcernedthatduetotheself‐reportednatureofthedata,someincidentsaresystematicallygoingunreportedinwaythatbiasesthefindingsofthisstudy.AppendixApresentstheresultsofasensitivityanalysisthatsuggeststhatunder‐reportingcannotexplainthelackofsignificantnegativecoefficientsonfederalinspections.
17
propertydamagemakesintuitivesenseandisconsistentwiththeSosaandAlvarez‐
Ramirez[7]findingthatmoresevereincidentsareunpredictable.
Ihadexpectedthatthenon‐performancemeasureswouldallbepositivelyrelatedto
thelengthofthepipeline,butinterestinglyMileshastheexpectedpositiveandsignificant
coefficientonlyintheIncidentsregression.ForFatalities,Injuries,andPropertyDamage,
longerpipelineshavefewernegativeoutcomes,ceterisparibus.Also,acrossallofthe
regressionsthecoefficientonMilesSquaredisnegative(althoughsignificantinonlytwoof
thesixregressions).Ofcourse,thereareanumberofothervariablesthatindirectlycapture
thelengthofthepipeline,includingthestateenforcementvariables.However,theseresults
suggestsforatleastsomeoftheperformancevariables,theremaybeimportantnon‐
linearities.
Whileveryfewoftheremainingexplanatoryvariableshaveaconsistenteffecton
theperformancevariables,notethatGasGatheringhasasignificantandpositivecoefficient
intheFatalities,Injuries,andPropertyDamageregressions.Comparingthesizeofthethree
significantGasGatheringcoefficientstothemeanandstandarddeviationforthethree
performancemeasures,notethatoperatingagasgatheringpipelineisquantitativelyavery
importantdeterminantforfatalities,injuriesandpropertydamageandmayhelpexplain
whyfederalandstatelevelenforcementactionsarenotmoreimportantdeterrentsforat
leastthesetypesofnon‐performance.
Althoughlaggingthefederalenforcementvariablesandconditioningonpriorvalues
ofthedependentvariablesshouldhelptoidentifyandestimatecausaleffects,asdiscussed
insection4onemightstillbeconcernedthattheseresultscouldbeduetoendogeneity.In
similarsituationsotherresearchershaveemployedaninstrumentalvariablesapproachto
18
trytocontrolforpotentialendogeneity,butgiventhelimitedinformationavailableabout
pipelineinspectionsandenforcement,Ihavenotbeenabletofindvalidinstrumentsfor
suchanapproach.Asanalternative,IuseManski’spartialidentificationapproach[21,22]
toestimateplausibleboundsforthecausaleffectsoffederalenforcement.Asdiscussedin
moredetailinAppendixB,thispartialidentificationapproachsuggeststhatallofthe
positivecoefficientsonthefederalenforcementvariablesintheIncidents,Property
Damage,GrossBarrelsSpilled,andNetBarrelsLostregressionsareplausibleevenifone
assumesthatregulatorsdotargetoperatorswithhigherlevelsofnon‐performancefor
enforcementactions.However,partialidentificationsuggeststhatsignificantpositive
coefficientsonthefederalenforcementvariablesfortheFatalitiesandInjuriesregressions
wouldnotbeconsistentwiththatassumption.Interestingly,Idonotfindanypositiveand
significantcoefficientsforthefederalenforcementvariablesineithertheFatalitiesorthe
Injuriesregressions.
ToprovideadditionalinsightintothemixedresultspresentedinTable3,Ialso
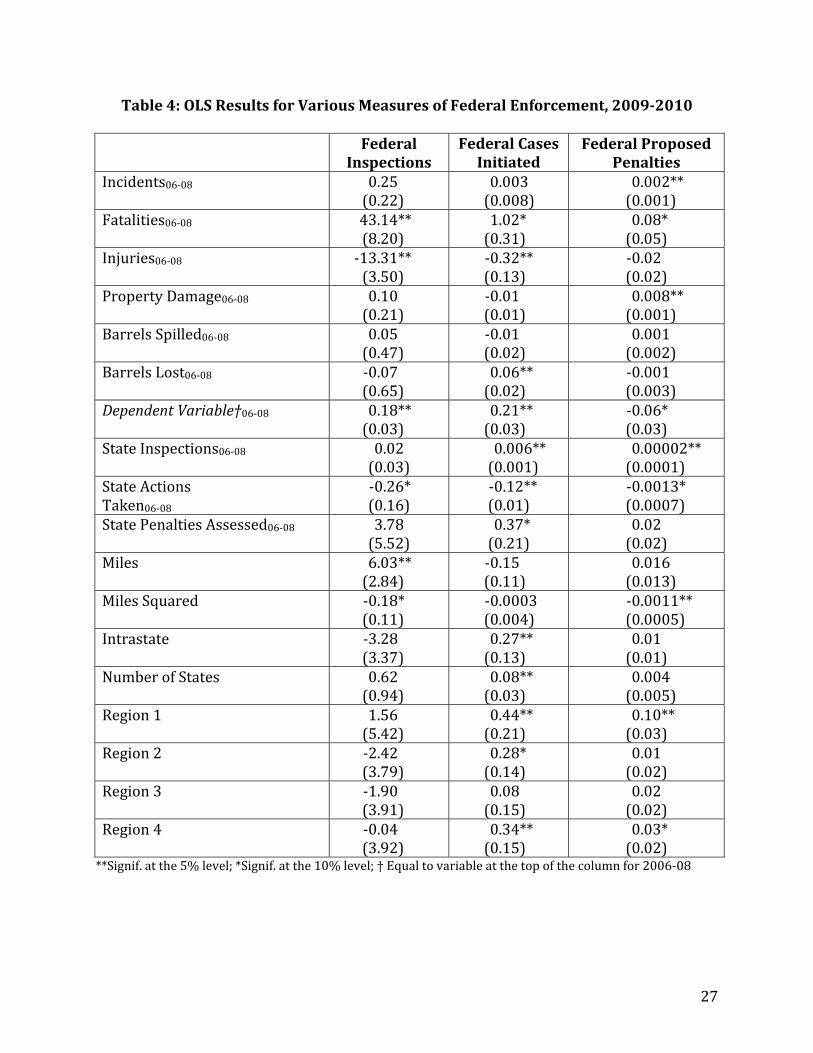
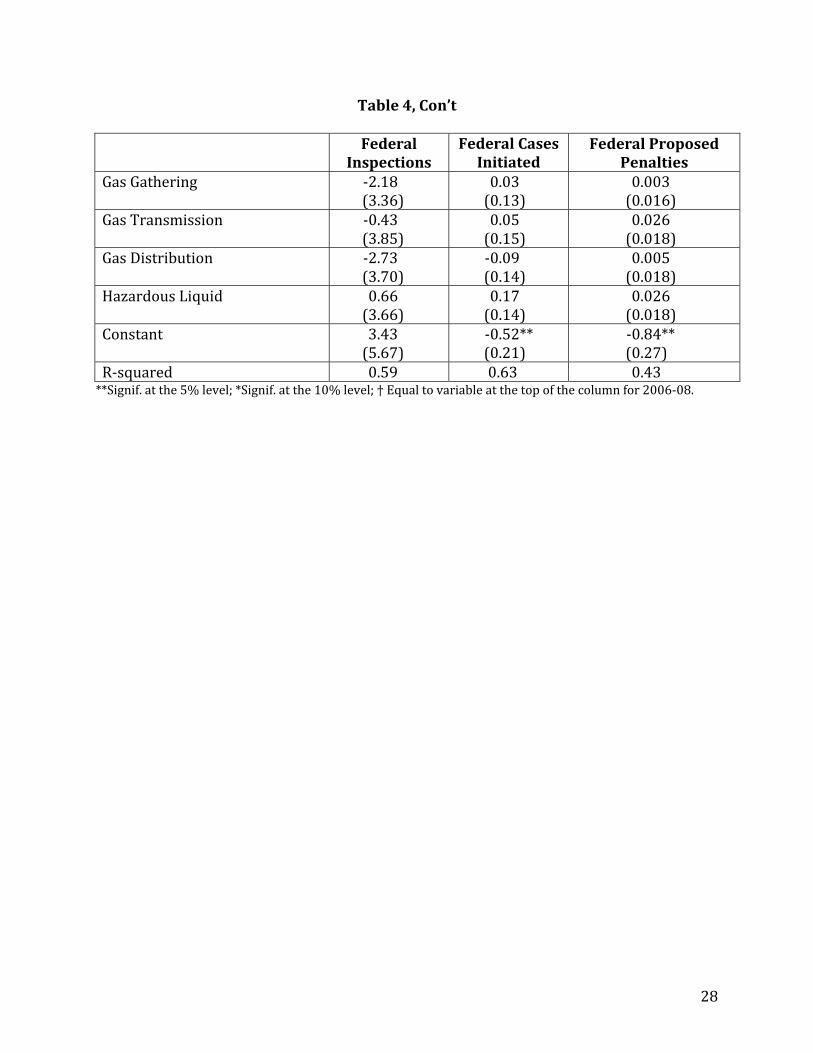
analyzedfederalinspectionsandenforcementasafunctionofpastperformance.Table4
presentstheresultsofordinaryleastsquareregressionsofFederalInspections09‐10,Federal
CasesInitiated09‐10,andFederalProposedPenalties09‐10asafunctionofthelagged
performancemeasures,thelaggeddependentvariable,andtheexplanatoryvariablesused
intheperformanceregressions.LookingfirstattheresultsfortheFederalInspections
regression,notethatonlyFatalities06‐08hasapositiveandsignificantcoefficientamongthe
performancemeasures,indicatingthatfederalinspectorsdotargetoperatorsfor
inspectionsiftherehavebeenfatalitiesattheoperator’spipelinesintherecentpast.
Interestingly,thecoefficientonInjuries06‐08isnegativeandsignificantwhichisnot
19
consistentwiththeideaoftargetingbasedonpastperformance.Thispatternshowsupin
bothoftheotherregressions;thatis,thecoefficientonFatalities06‐08ispositiveand
significantforbothFederalCasesandFederalPenalties,whilethecoefficientonInjuries06‐08
isnegativeforbothandsignificantforFederalCases.BarrelsLost06‐08isalsoasignificant
determinantofFederalCasesInitiated09‐10,whileIncidents06‐08andPropertyDamage06‐08are
significantdeterminantsofFederalProposedPenalties09‐10.
ForbothFederalInspectionsandFederalCasesthereissomepersistenceacrossthe
twoperiodsgiventhepositiveandsignificantcoefficientsonthelaggeddependent
variable.Thereareanumberofpossibleexplanationsforthisresult.Recallthatpipelines
whichpassthrough“highconsequence”areasaresubjecttomorestringentregulationand
mayalsofacemoreinspections.Similarly,pipelinescarryingparticularlyhazardous
materialsmaybeinspectedmoreoften.Interestingly,thereisanegativerelationship
betweencurrentandlaggedFederalPenalties,sothatfacilitiesthatfacedhigherpenalties
inthepastfacelowerpenaltiescurrently,ceterisparibus.
Next,considerthelaggedstateenforcementvariables.StateInspections06‐08hasa
positivecoefficientinallthreeregressions,anditissignificantforFederalCasesand
FederalPenalties.Ifstateinspectionsuncoverbehaviorthathelpsfederalregulatorsinitiate
enforcementproceedings,onewouldexpecttoseeapositiverelationshipbetweenthese
variables.Interestingly,thenegativeandsignificantcoefficientonStateActionsTaken06‐08
suggeststhatfederalregulatorsmaytakeintoaccountstateactionsandholdoffontheir
ownenforcementactionsagainstoperatorsthathavebeensubjecttostateactionsinthe
recentpast.However,thepositiveandsignificantcoefficientonStatePenaltiesAssessed06‐08
intheFederalCasesregressionisinconsistentwithsuchaninterpretation.
20
Lookingnextattheoperatorcharacteristicsvariables,asexpectedlongerpipelines
facemoreinspectionsthanshorterpipelines,althoughtheyarenotsubjecttomorefederal
casesorhigherfederalpenalties.Thisfindingmakessense,asinspectionsshoulddepend
onthepotentialforharm,whileenforcementactionsshoulddependonthepresenceof
actualharmorviolations.Theinsignificantcoefficientsonalloftheregionaldummies
indicatetherearenotsignificantdifferencesinthenumberofinspectionsbasedonthe
regionsthroughwhichapipelineruns.However,therearesignificantdifferencesinthe
numberoffederalcasesandpenaltiesproposedbyregion,evenaftercontrollingfor
performance.Whiletherearemanypossibleexplanationsforthesefindings,theyare
consistentwithregulatorsindifferentregionshavingdifferentopinionsaboutwhencases
shouldbeinitiatedandhowpenaltiesshouldbeset.Interestingly,eventhoughthe
regressionsinTable3suggestthatpipelineperformancedependsonthetypeofpipeline–
GasGathering,GasDistribution,etc.–thereisnovariationinfederalenforcementacross
thedifferenttypesofpipelines.
6. Conclusion
Thegoalofthispaperistoprovideinsightintotherolethatfederalinspections,
enforcementactions,andfineshavehadonpipelineperformanceand,inparticular,to
examinewhethertheincreasedinspectionsfundingandcivilpenaltiesmandatedunderthe
PipelineSafety,RegulatoryCertainty,andJobCreationActarelikelytoincreasepipeline
safety.Theresultsoftheanalysisdonotprovidecompellingevidencethateitherfederal
inspectionsorcivilpenaltiesserveasparticularlyeffectivedeterrents.Infact,Ifindthat
laggedfederalinspectionsandpenaltiesarepositivelyassociatedwithenvironmentalnon‐
21
performance,althoughtheresultshavetobeinterpretedwithsomecareaslaggingthe
enforcementvariablesmaynotfullycorrectforomittedvariablesorendogeneitybetween
enforcementandperformance.
Interestingly,myanalysisdoesfindthatthenumberoffederalcasesinitiated
againstanoperatordoeshaveasignificantdeterrenteffectonmanyformsofnon‐
performance,althoughnotforincidentsingeneral.Thus,intheoryincreasingthenumber
offederalcaseswouldresultinbetterenvironmentalperformance.However,thePipeline
Safety,RegulatoryCertainty,andJobCreationActfocusesonincreasinginspectionsand
fines,notincreasingthenumberofcases,althoughadditionalcasescouldindirectlyresult
fromtheAct.
Theanalysisoffederalinspections,enforcementcases,andproposedpenalties
suggeststhatsometargetingoffederalenforcementresourcesisbasedonpast
performance,buttheresultssuggestthattheremayberoomforimprovement.Iffederal
enforcementresourceswerebettertargeted,thedeterrenteffectofsuchresourcesmight
increase.Theanalysisalsopointsoutsomevariationacrossregionsinenforcementthat
couldindicateinefficientresourcedeployment.Finally,theanalysisrevealsinteresting
patternsbetweenstateandfederalenforcementefforts.Additionalresearchtobetter
understandtherelationshipbetweensucheffortscouldhelpincreaseourunderstandingof
howsuchresourcesarecurrentlycoordinatedandwhetherbettercoordinationmight
increasedeterrence.
22
Table1:2010PerformanceMeasuresforOperatorswith100orMoreMilesofPipeline(N=344)
PerformanceMeasure
FacilitieswithNothingtoReport
ForFacilitiesthatReportMean Std.Dev. Minimum Maximum
NumberofIncidents 236(69%) 3.96 4.75 1 26NumberofFatalities 340(99%) 2.75 3.50 1 8NumberofInjuries 337(98%) 9.14 18.57 1 51PropertyDamage(inMillion$s)
235(68%) 10.40 67.50 0.003 601
GrossBarrelsSpilled(thousands)
285(83%) 2.91 10.21 0.002 70.19
NetBarrelsLost(thousands)
298(87%) 2.66 10.68 0.001 70.19
23
Table2:SummaryStatisticsfortheVariablesUsedintheAnalysis
Variable Description Mean Std.Dev.PerformanceMeasures(DependentVariables)Incidents09‐10 Numberofincidentsreportedduring
2009‐2010.2.51 6.33
Fatalities09‐10 Numberoffatalitiesreportedduring2009‐2010.
0.04 0.47
Injuries09‐10 Numberofinjuriesreportedduring2009‐2010.
0.23 2.79
PropertyDamage09‐10 Propertydamagereportedduring2009‐2010inmillion$s.
3.63 38.29
BarrelsSpilled09‐10 Barrelsreportedspilledduring2009‐2010inthousandsofbarrels.
0.65 4.44
BarrelsLost09‐10 Netbarrelsreportedlostduring2009‐2010inthousandsofbarrels.
0.45 4.04
EnforcementMeasuresFederalInspections06‐08
Numberoffederalinspectionsattheoperator’sfacilitiesduring2006‐2008(100’s).
0.33 0.73
FederalCasesInitiated06‐08
Numberoffederalenforcementcasesinitiatedagainstoperatorduring2006‐2008.
1.24 2.40
FederalProposedPenalties06‐08
ProposedPenaltiesontheoperatorduring2006‐2008(million$’s).
0.39 0.25
StateInspections06‐08 Weightedsumoftotalstateinspectionsduring2006‐2008(100’s).
0.79 1.58
StateActionsTaken06‐08
Weightedsumoftotalstateactionstakenduring2006‐2008.
8.87 18.90
StatePenaltiesAssessed06‐08
Weightedsumoftotalstatepenaltiesassessedduring2006‐2008($100,000’s).
0.07 0.28
PastPerformanceMeasuresIncidents06‐08 Numberofincidentsreportedduring
2006‐2008.3.93 9.75
Fatalities06‐08 Numberoffatalitiesreportedduring2006‐2008.
0.03 0.20
Injuries06‐08 Numberofinjuriesreportedduring2009‐2010.
0.07 0.46
PropertyDamage06‐08 Propertydamagereportedduring2006‐2008inmillion$s.
2.06 8.63
BarrelsSpilled06‐08 Barrelsspilledduring2006‐2008inthousandsofbarrels.
0.92 5.04
BarrelsLost06‐08 Netbarrelslostduring2006‐2008inthousandsofbarrels.
0.52 3.62
24
Variable Description Mean Std.Dev.OtherOperatorCharacteristicsMiles Milesofpipeline,inthousands 1.42 2.60Intrastate =1ifalloperationsinthesamestate 0.39 0.49NumberofStates Numberofstatesthroughwhichthe
operator’spipelinepasses.3.17 3.28
Region1 =1ifanypipelineislocatedintheNortheast.
0.11 0.32
Region2 =1ifanypipelineislocatedintheMidwest.
0.38 0.49
Region3 =1ifanypipelineislocatedintheSouth. 0.63 0.48Region4 =1ifanypipelineislocatedintheWest. 0.29 0.45GasGathering =1ifoperationsincludenaturalgas
gathering.0.24 0.43
GasTransmission =1ifoperationsincludenaturalgastransmission.
0.75 0.44
GasDistribution =1ifoperationsincludenaturalgasdistribution.
0.26 0.44
HazardousLiquid =1ifoperationsincludehazardousliquidtransmission.
0.44 0.50
25
Table3:OLSResultsforVariousMeasuresofEnvironmentalPerformance Incidents Fatalities InjuriesFederalInspections06‐08 0.33
(0.34)0.04(0.06)
0.43(0.32)
FederalCasesInitiated06‐08 0.17*(0.09)
‐0.02(0.01)
‐0.18**(0.08)
FederalProposedPenalties06‐08 1.32**(0.64)
0.02(0.11)
0.70(0.58)
StateInspections06‐08 ‐0.68**(0.34)
‐0.05(0.05)
0.003(0.31)
StateActionsTaken06‐08 0.01(0.02)
0.02**(0.002)
0.15**(0.01)
StatePenaltiesAssessed06‐08 ‐0.73(0.59)
‐0.12(0.10)
‐0.65(0.54)
DependentVariable†06‐08 0.47**(0.02)
0.13(0.13)
0.58**(0.30)
Miles 0.75**(0.30)
‐0.08*(0.05)
‐0.63**(0.27)
MilesSquared ‐0.02**(0.01)
‐0.002(0.002)
‐0.01(0.01)
Intrastate 0.37(0.36)
‐0.01(0.06)
‐0.15(0.32)
NumberofStates 0.31**(0.10)
0.02(0.02)
0.04(0.09)
Region1 0.20(0.58)
0.04(0.09)
‐0.23(0.53)
Region2 ‐0.51(0.41)
0.03(0.06)
0.22(0.37)
Region3 ‐0.52(0.42)
‐0.10(0.07)
‐0.58(0.38)
Region4 ‐1.12**(0.42)
‐0.002(0.07)
0.21(0.39)
GasGathering 0.04(0.36)
0.13**(0.06)
0.82**(0.33)
GasTransmission ‐0.71*(0.40)
‐0.08(0.07)
‐0.31(0.37)
GasDistribution 0.56(0.40)
0.07(0.06)
0.43(0.36)
HazardousLiquid 0.51(0.39)
‐0.07(0.06)
‐0.39(0.36)
Constant ‐0.18(0.61)
0.04(0.10)
0.26(0.55)
R‐squared 0.84 0.27 0.33Sig.atthe5%level;*Sig.atthe10%level.;†Equaltothedep.var.fortheperiod2006‐2008.
26
Table3,Continued
PropertyDamage
GrossBarrelsSpilled
NetBarrelsLost
FederalInspections06‐08
0.08*(0.04)
0.55(0.45)
0.42*(0.25)
FederalCasesInitiated06‐08 ‐2.04*(1.06)
‐0.39**(0.12)
‐0.51**(0.07)
FederalProposedPenalties06‐08 77.80**(7.76)
3.93**(0.82)
1.07**(0.46)
StateInspections06‐08 2.55(4.22)
0.41(0.45)
0.66**(0.25)
StateActionsTaken06‐08
1.37**(0.20)
0.004(0.02)
‐0.01(0.01)
StatePenaltiesAssessed06‐08 ‐14.17*(7.25)
‐0.33(0.76)
0.38(0.42)
DependentVariable†06‐08 0.22(0.25)
0.62**(0.04)
1.11**(0.03)
Miles ‐7.73*(3.69)
‐0.19(0.39)
‐0.08(0.21)
MilesSquared ‐0.19(0.13)
‐0.01(0.01)
‐0.02**(0.01)
Intrastate ‐3.88(4.40)
‐0.60(0.46)
‐0.31(0.26)
NumberofStates 0.75(1.22)
‐0.05(0.12)
‐0.12*(0.07)
Region1 6.71(7.14)
‐0.35(0.76)
‐0.56(0.42)
Region2 0.02(4.94)
‐0.59(0.52)
0.12(0.29)
Region3 ‐13.02**(5.11)
‐0.65(0.54)
‐0.08(0.30)
Region4 ‐8.49*(5.14)
‐0.60(0.55)
0.11(0.30)
GasGathering 8.58*(4.45)
‐0.13(0.47)
‐0.04(0.26)
GasTransmission ‐12.00**(4.98)
0.52(0.53)
0.31(0.29)
GasDistribution 3.05(4.85)
‐0.56(0.51)
‐0.76**(0.28)
HazardousLiquid ‐5.46(4.78)
0.51(0.51)
0.16(0.28)
Constant 17.31**(7.31)
0.97(0.77)
0.58(0.42)
R‐squared 0.36 0.46 0.80**Sig.atthe5%level;*Sig.atthe10%level.;†Equaltothedep.var.fortheperiod2006‐2008.
27
Table4:OLSResultsforVariousMeasuresofFederalEnforcement,2009‐2010
Federal
InspectionsFederalCasesInitiated
FederalProposedPenalties
Incidents06‐08 0.25(0.22)
0.003(0.008)
0.002**(0.001)
Fatalities06‐08 43.14**(8.20)
1.02*(0.31)
0.08*(0.05)
Injuries06‐08 ‐13.31**(3.50)
‐0.32**(0.13)
‐0.02(0.02)
PropertyDamage06‐08 0.10(0.21)
‐0.01(0.01)
0.008**(0.001)
BarrelsSpilled06‐08 0.05(0.47)
‐0.01(0.02)
0.001(0.002)
BarrelsLost06‐08 ‐0.07(0.65)
0.06**(0.02)
‐0.001(0.003)
DependentVariable†06‐08 0.18**(0.03)
0.21**(0.03)
‐0.06*(0.03)
StateInspections06‐08 0.02(0.03)
0.006**(0.001)
0.00002**(0.0001)
StateActionsTaken06‐08
‐0.26*(0.16)
‐0.12**(0.01)
‐0.0013*(0.0007)
StatePenaltiesAssessed06‐08 3.78(5.52)
0.37*(0.21)
0.02(0.02)
Miles 6.03**(2.84)
‐0.15(0.11)
0.016(0.013)
MilesSquared ‐0.18*(0.11)
‐0.0003(0.004)
‐0.0011**(0.0005)
Intrastate ‐3.28(3.37)
0.27**(0.13)
0.01(0.01)
NumberofStates 0.62(0.94)
0.08**(0.03)
0.004(0.005)
Region1 1.56(5.42)
0.44**(0.21)
0.10**(0.03)
Region2 ‐2.42(3.79)
0.28*(0.14)
0.01(0.02)
Region3 ‐1.90(3.91)
0.08(0.15)
0.02(0.02)
Region4 ‐0.04(3.92)
0.34**(0.15)
0.03*(0.02)
**Signif.atthe5%level;*Signif.atthe10%level;†Equaltovariableatthetopofthecolumnfor2006‐08
28
Table4,Con’t
Federal
InspectionsFederalCasesInitiated
FederalProposedPenalties
GasGathering ‐2.18(3.36)
0.03(0.13)
0.003(0.016)
GasTransmission ‐0.43(3.85)
0.05(0.15)
0.026(0.018)
GasDistribution ‐2.73(3.70)
‐0.09(0.14)
0.005(0.018)
HazardousLiquid 0.66(3.66)
0.17(0.14)
0.026(0.018)
Constant 3.43(5.67)
‐0.52**(0.21)
‐0.84**(0.27)
R‐squared 0.59 0.63 0.43**Signif.atthe5%level;*Signif.atthe10%level;†Equaltovariableatthetopofthecolumnfor2006‐08.
29
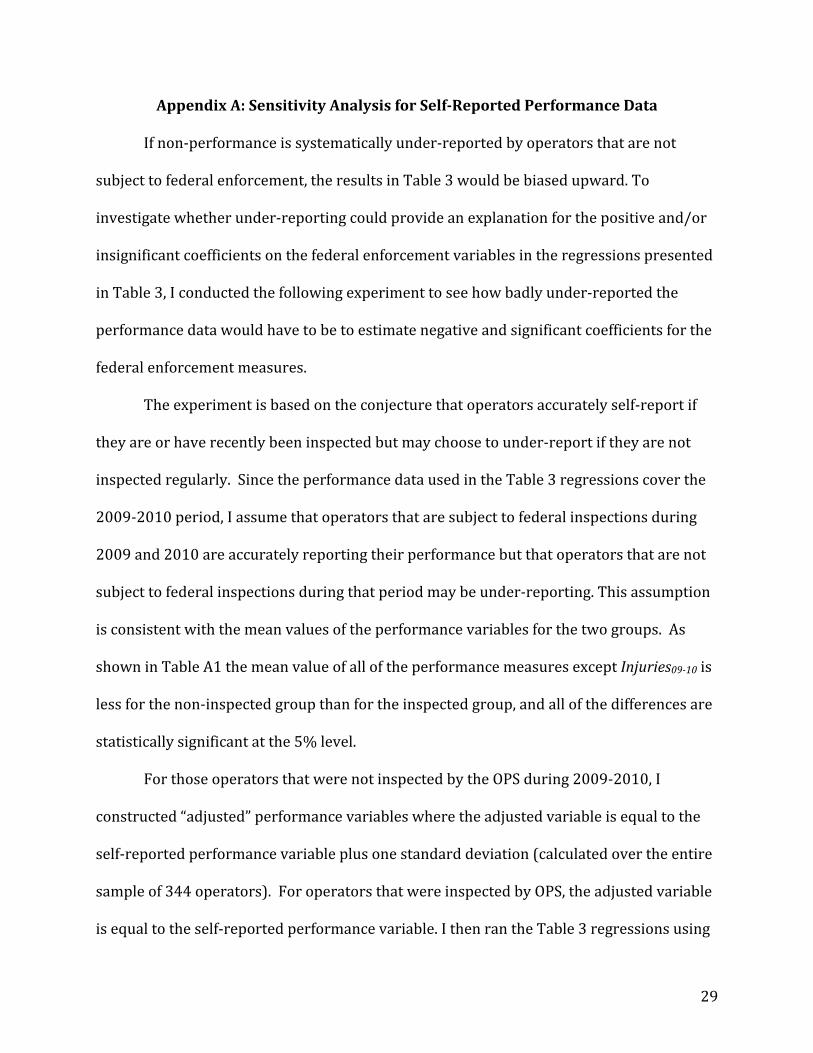
AppendixA:SensitivityAnalysisforSelf‐ReportedPerformanceData
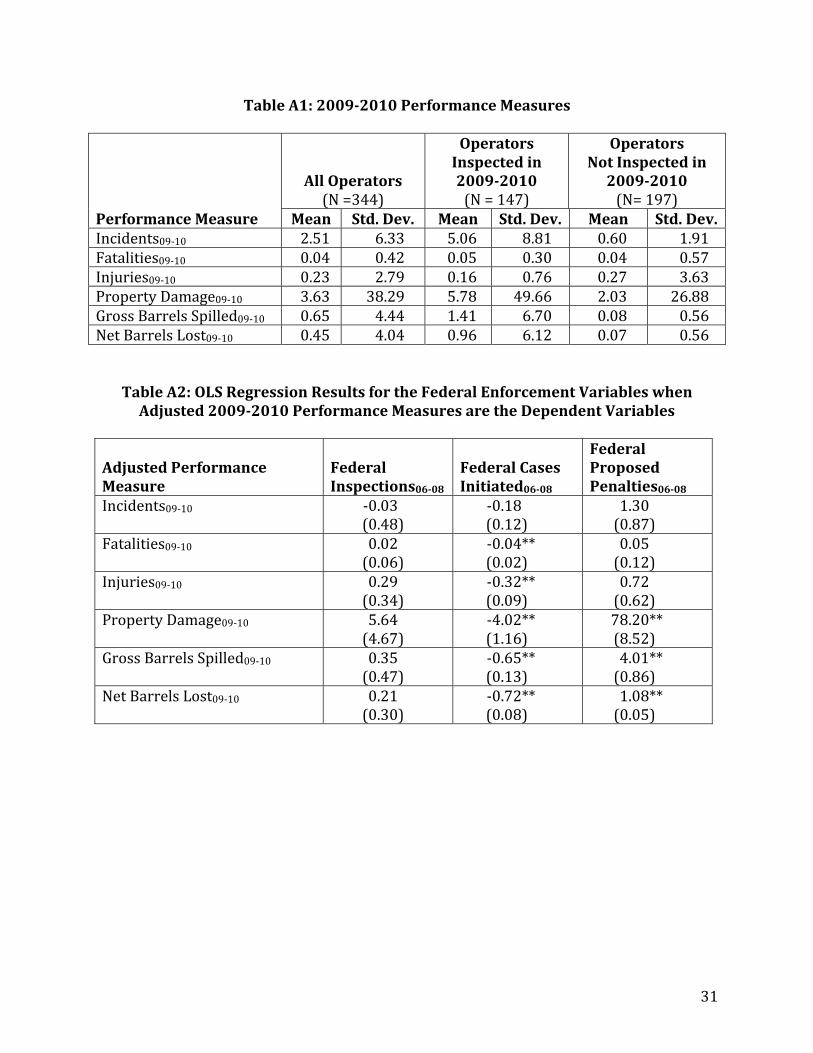
Ifnon‐performanceissystematicallyunder‐reportedbyoperatorsthatarenot
subjecttofederalenforcement,theresultsinTable3wouldbebiasedupward.To
investigatewhetherunder‐reportingcouldprovideanexplanationforthepositiveand/or
insignificantcoefficientsonthefederalenforcementvariablesintheregressionspresented
inTable3,Iconductedthefollowingexperimenttoseehowbadlyunder‐reportedthe
performancedatawouldhavetobetoestimatenegativeandsignificantcoefficientsforthe
federalenforcementmeasures.
Theexperimentisbasedontheconjecturethatoperatorsaccuratelyself‐reportif
theyareorhaverecentlybeeninspectedbutmaychoosetounder‐reportiftheyarenot
inspectedregularly.SincetheperformancedatausedintheTable3regressionscoverthe
2009‐2010period,Iassumethatoperatorsthataresubjecttofederalinspectionsduring
2009and2010areaccuratelyreportingtheirperformancebutthatoperatorsthatarenot
subjecttofederalinspectionsduringthatperiodmaybeunder‐reporting.Thisassumption
isconsistentwiththemeanvaluesoftheperformancevariablesforthetwogroups.As
showninTableA1themeanvalueofalloftheperformancemeasuresexceptInjuries09‐10is
lessforthenon‐inspectedgroupthanfortheinspectedgroup,andallofthedifferencesare
statisticallysignificantatthe5%level.
ForthoseoperatorsthatwerenotinspectedbytheOPSduring2009‐2010,I
constructed“adjusted”performancevariableswheretheadjustedvariableisequaltothe
self‐reportedperformancevariableplusonestandarddeviation(calculatedovertheentire
sampleof344operators).ForoperatorsthatwereinspectedbyOPS,theadjustedvariable
isequaltotheself‐reportedperformancevariable.IthenrantheTable3regressionsusing
30
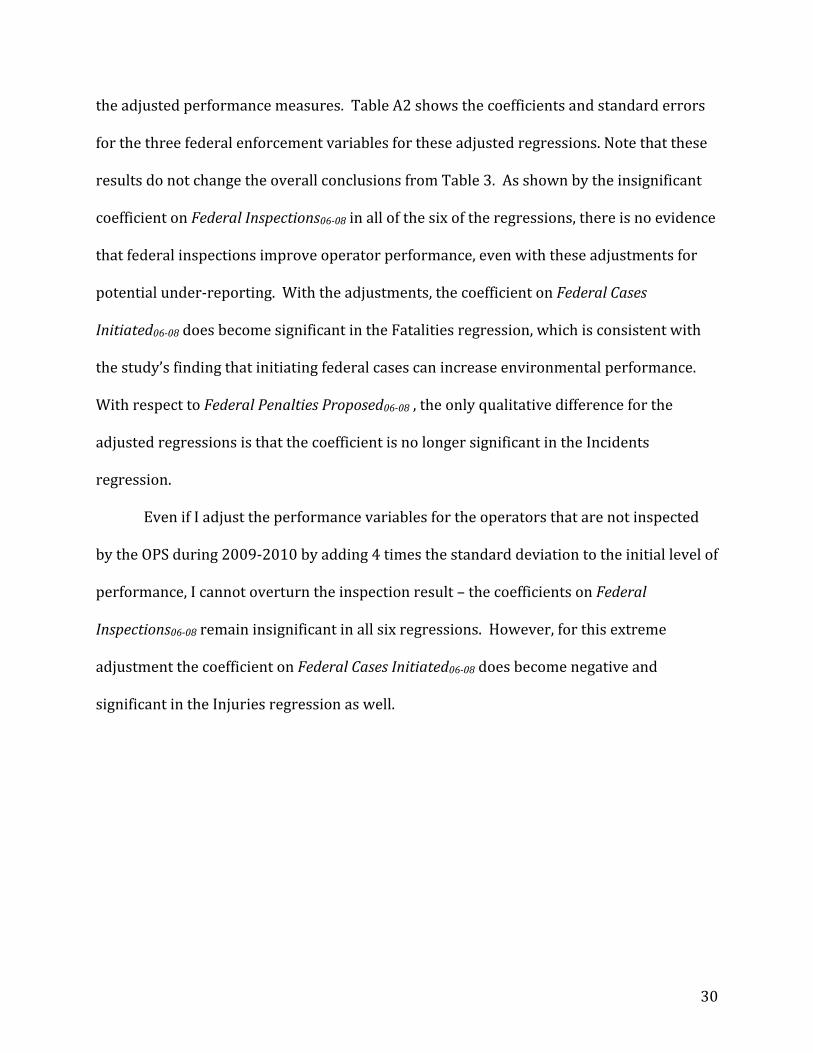
theadjustedperformancemeasures.TableA2showsthecoefficientsandstandarderrors
forthethreefederalenforcementvariablesfortheseadjustedregressions.Notethatthese
resultsdonotchangetheoverallconclusionsfromTable3.Asshownbytheinsignificant
coefficientonFederalInspections06‐08inallofthesixoftheregressions,thereisnoevidence
thatfederalinspectionsimproveoperatorperformance,evenwiththeseadjustmentsfor
potentialunder‐reporting.Withtheadjustments,thecoefficientonFederalCases
Initiated06‐08doesbecomesignificantintheFatalitiesregression,whichisconsistentwith
thestudy’sfindingthatinitiatingfederalcasescanincreaseenvironmentalperformance.
WithrespecttoFederalPenaltiesProposed06‐08,theonlyqualitativedifferenceforthe
adjustedregressionsisthatthecoefficientisnolongersignificantintheIncidents
regression.
EvenifIadjusttheperformancevariablesfortheoperatorsthatarenotinspected
bytheOPSduring2009‐2010byadding4timesthestandarddeviationtotheinitiallevelof
performance,Icannotoverturntheinspectionresult–thecoefficientsonFederal
Inspections06‐08remaininsignificantinallsixregressions.However,forthisextreme
adjustmentthecoefficientonFederalCasesInitiated06‐08doesbecomenegativeand
significantintheInjuriesregressionaswell.
31
TableA1:2009‐2010PerformanceMeasures
PerformanceMeasure
AllOperators(N=344)
OperatorsInspectedin2009‐2010(N=147)
OperatorsNotInspectedin2009‐2010(N=197)
Mean Std.Dev. Mean Std.Dev. Mean Std.Dev.Incidents09‐10 2.51 6.33 5.06 8.81 0.60 1.91Fatalities09‐10 0.04 0.42 0.05 0.30 0.04 0.57Injuries09‐10 0.23 2.79 0.16 0.76 0.27 3.63PropertyDamage09‐10 3.63 38.29 5.78 49.66 2.03 26.88GrossBarrelsSpilled09‐10 0.65 4.44 1.41 6.70 0.08 0.56NetBarrelsLost09‐10 0.45 4.04 0.96 6.12 0.07 0.56
TableA2:OLSRegressionResultsfortheFederalEnforcementVariableswhenAdjusted2009‐2010PerformanceMeasuresaretheDependentVariables
AdjustedPerformanceMeasure
FederalInspections06‐08
FederalCasesInitiated06‐08
FederalProposedPenalties06‐08
Incidents09‐10 ‐0.03(0.48)
‐0.18(0.12)
1.30(0.87)
Fatalities09‐10 0.02(0.06)
‐0.04**(0.02)
0.05(0.12)
Injuries09‐10 0.29(0.34)
‐0.32**(0.09)
0.72(0.62)
PropertyDamage09‐10 5.64(4.67)
‐4.02**(1.16)
78.20**(8.52)
GrossBarrelsSpilled09‐10 0.35(0.47)
‐0.65**(0.13)
4.01**(0.86)
NetBarrelsLost09‐10 0.21(0.30)
‐0.72**(0.08)
1.08**(0.05)
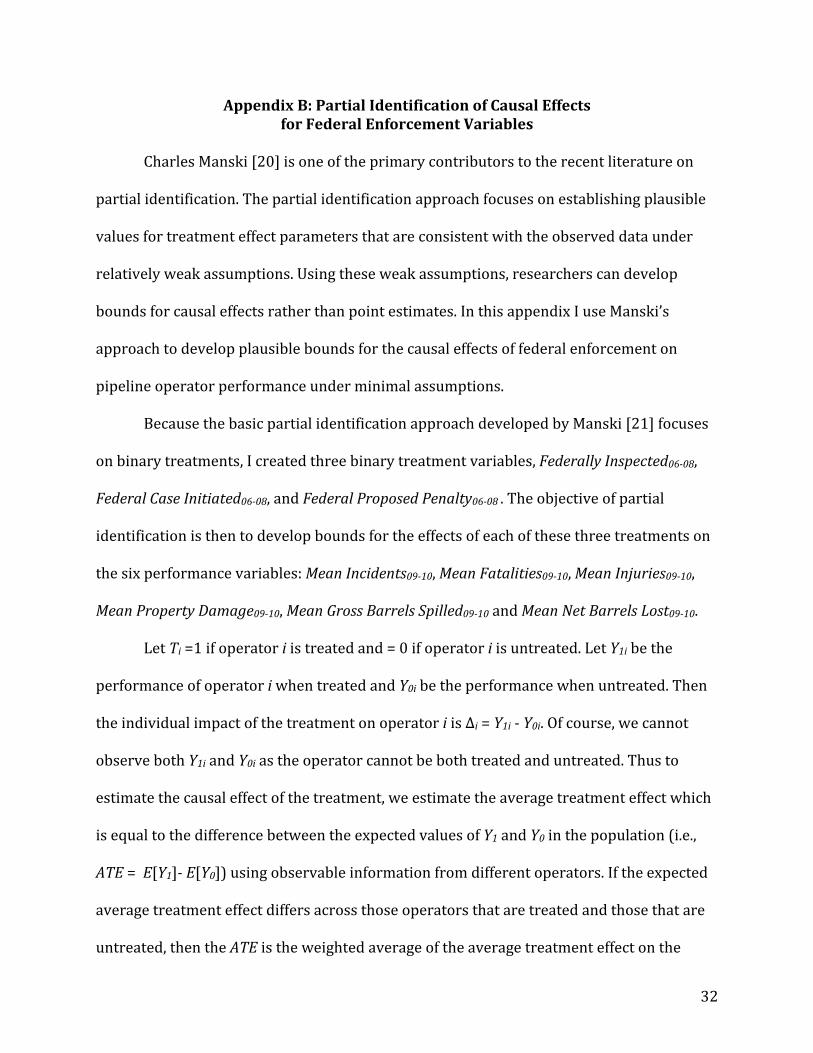
32
AppendixB:PartialIdentificationofCausalEffectsforFederalEnforcementVariables
CharlesManski[20]isoneoftheprimarycontributorstotherecentliteratureon
partialidentification.Thepartialidentificationapproachfocusesonestablishingplausible
valuesfortreatmenteffectparametersthatareconsistentwiththeobserveddataunder
relativelyweakassumptions.Usingtheseweakassumptions,researcherscandevelop
boundsforcausaleffectsratherthanpointestimates.InthisappendixIuseManski’s
approachtodevelopplausibleboundsforthecausaleffectsoffederalenforcementon
pipelineoperatorperformanceunderminimalassumptions.
BecausethebasicpartialidentificationapproachdevelopedbyManski[21]focuses
onbinarytreatments,Icreatedthreebinarytreatmentvariables,FederallyInspected06‐08,
FederalCaseInitiated06‐08,andFederalProposedPenalty06‐08.Theobjectiveofpartial
identificationisthentodevelopboundsfortheeffectsofeachofthesethreetreatmentson
thesixperformancevariables:MeanIncidents09‐10,MeanFatalities09‐10,MeanInjuries09‐10,
MeanPropertyDamage09‐10,MeanGrossBarrelsSpilled09‐10andMeanNetBarrelsLost09‐10.
LetTi=1ifoperatoriistreatedand=0ifoperatoriisuntreated.LetY1ibethe
performanceofoperatoriwhentreatedandY0ibetheperformancewhenuntreated.Then
theindividualimpactofthetreatmentonoperatoriis∆i=Y1i‐Y0i.Ofcourse,wecannot
observebothY1iandY0iastheoperatorcannotbebothtreatedanduntreated.Thusto
estimatethecausaleffectofthetreatment,weestimatetheaveragetreatmenteffectwhich
isequaltothedifferencebetweentheexpectedvaluesofY1andY0inthepopulation(i.e.,
ATE=E[Y1]‐E[Y0])usingobservableinformationfromdifferentoperators.Iftheexpected
averagetreatmenteffectdiffersacrossthoseoperatorsthataretreatedandthosethatare
untreated,thentheATEistheweightedaverageoftheaveragetreatmenteffectonthe
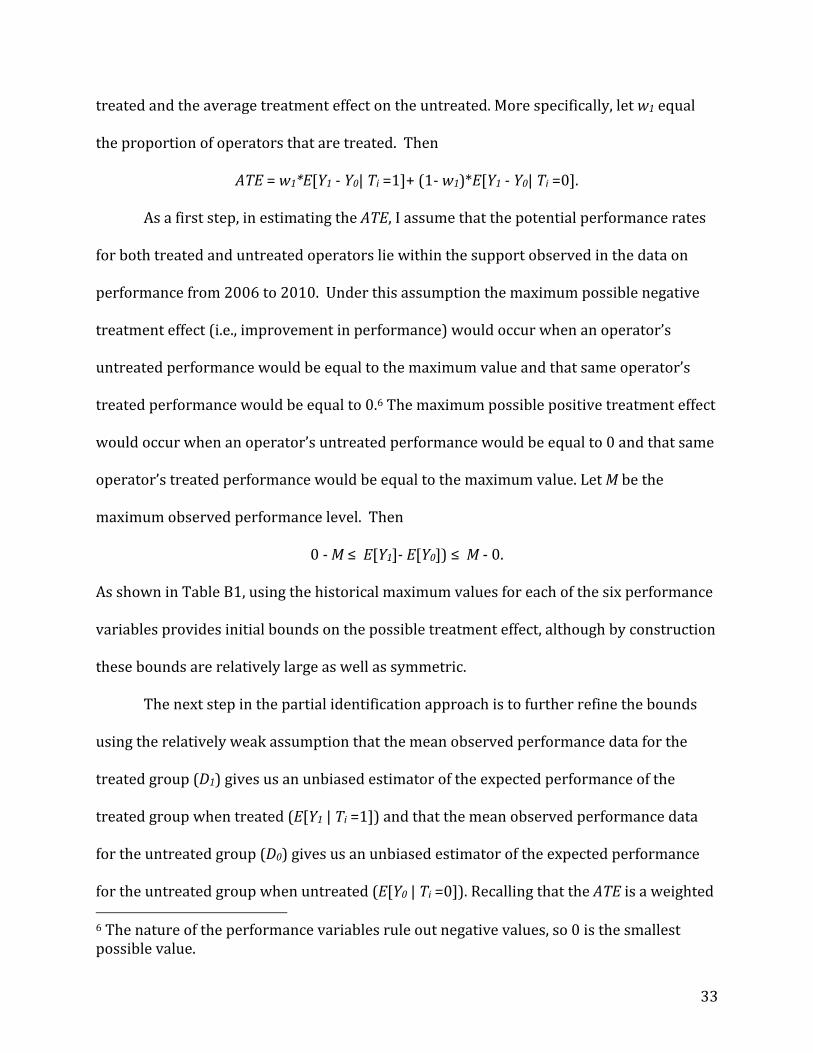
33
treatedandtheaveragetreatmenteffectontheuntreated.Morespecifically,letw1equal
theproportionofoperatorsthataretreated.Then
ATE=w1*E[Y1‐Y0|Ti=1]+(1‐w1)*E[Y1‐Y0|Ti=0].
Asafirststep,inestimatingtheATE,Iassumethatthepotentialperformancerates
forbothtreatedanduntreatedoperatorsliewithinthesupportobservedinthedataon
performancefrom2006to2010.Underthisassumptionthemaximumpossiblenegative
treatmenteffect(i.e.,improvementinperformance)wouldoccurwhenanoperator’s
untreatedperformancewouldbeequaltothemaximumvalueandthatsameoperator’s
treatedperformancewouldbeequalto0.6Themaximumpossiblepositivetreatmenteffect
wouldoccurwhenanoperator’suntreatedperformancewouldbeequalto0andthatsame
operator’streatedperformancewouldbeequaltothemaximumvalue.LetMbethe
maximumobservedperformancelevel.Then
0‐M≤E[Y1]‐E[Y0])≤M‐0.
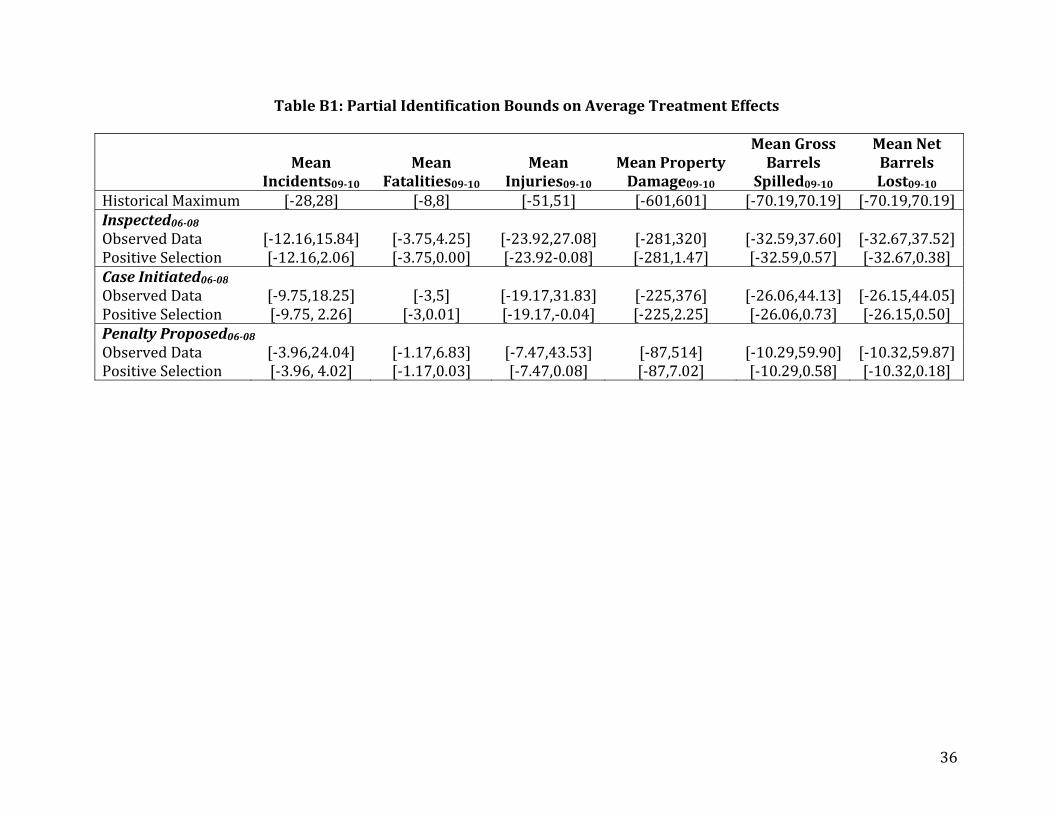
AsshowninTableB1,usingthehistoricalmaximumvaluesforeachofthesixperformance
variablesprovidesinitialboundsonthepossibletreatmenteffect,althoughbyconstruction
theseboundsarerelativelylargeaswellassymmetric.
Thenextstepinthepartialidentificationapproachistofurtherrefinethebounds
usingtherelativelyweakassumptionthatthemeanobservedperformancedataforthe
treatedgroup(D1)givesusanunbiasedestimatoroftheexpectedperformanceofthe
treatedgroupwhentreated(E[Y1|Ti=1])andthatthemeanobservedperformancedata
fortheuntreatedgroup(D0)givesusanunbiasedestimatoroftheexpectedperformance
fortheuntreatedgroupwhenuntreated(E[Y0|Ti=0]).RecallingthattheATEisaweighted6Thenatureoftheperformancevariablesruleoutnegativevalues,so0isthesmallestpossiblevalue.
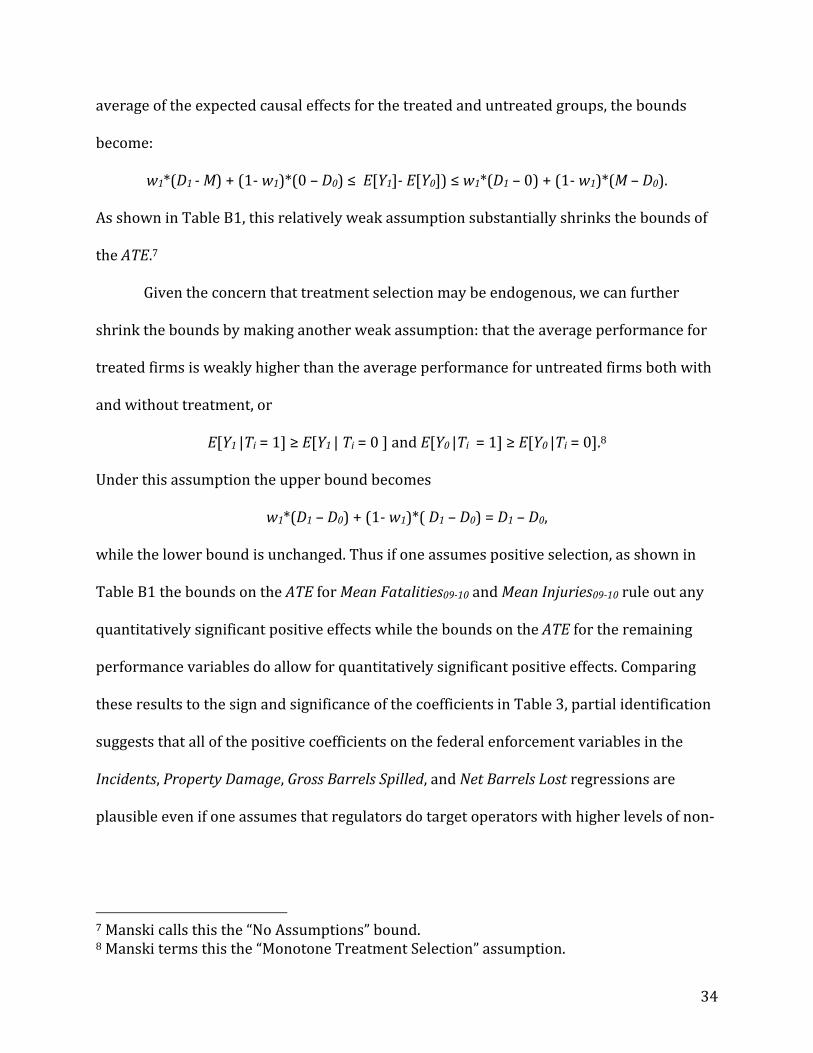
34
averageoftheexpectedcausaleffectsforthetreatedanduntreatedgroups,thebounds
become:
w1*(D1‐M)+(1‐w1)*(0–D0)≤E[Y1]‐E[Y0])≤w1*(D1–0)+(1‐w1)*(M–D0).
AsshowninTableB1,thisrelativelyweakassumptionsubstantiallyshrinkstheboundsof
theATE.7
Giventheconcernthattreatmentselectionmaybeendogenous,wecanfurther
shrinktheboundsbymakinganotherweakassumption:thattheaverageperformancefor
treatedfirmsisweaklyhigherthantheaverageperformanceforuntreatedfirmsbothwith
andwithouttreatment,or
E[Y1|Ti=1]≥E[Y1|Ti=0]andE[Y0|Ti=1]≥E[Y0|Ti=0].8
Underthisassumptiontheupperboundbecomes
w1*(D1–D0)+(1‐w1)*(D1–D0)=D1–D0,
whilethelowerboundisunchanged.Thusifoneassumespositiveselection,asshownin
TableB1theboundsontheATEforMeanFatalities09‐10andMeanInjuries09‐10ruleoutany
quantitativelysignificantpositiveeffectswhiletheboundsontheATEfortheremaining
performancevariablesdoallowforquantitativelysignificantpositiveeffects.Comparing
theseresultstothesignandsignificanceofthecoefficientsinTable3,partialidentification
suggeststhatallofthepositivecoefficientsonthefederalenforcementvariablesinthe
Incidents,PropertyDamage,GrossBarrelsSpilled,andNetBarrelsLostregressionsare
plausibleevenifoneassumesthatregulatorsdotargetoperatorswithhigherlevelsofnon‐
7Manskicallsthisthe“NoAssumptions”bound.8Manskitermsthisthe“MonotoneTreatmentSelection”assumption.
35
performanceforenforcementactions.9Howeversignificantpositivecoefficientsonthe
federalenforcementvariablesfortheFatalitiesandInjuriesregressionswouldnotbe
consistentwiththatassumption.Interestingly,Idonotfindanypositiveandsignificant
coefficientsforthefederalenforcementvariablesineithertheFatalitiesortheInjuries
regressions.
9BecausetheregressionspresentedinTable3usecontinuousratherthanbinaryfederalenforcementvariables,thesizeofthecoefficientscannotbedirectlycomparedtothebounds.
36
TableB1:PartialIdentificationBoundsonAverageTreatmentEffects
Mean
Incidents09‐10Mean
Fatalities09‐10Mean
Injuries09‐10MeanPropertyDamage09‐10
MeanGrossBarrels
Spilled09‐10
MeanNetBarrelsLost09‐10
HistoricalMaximum [‐28,28] [‐8,8] [‐51,51] [‐601,601] [‐70.19,70.19] [‐70.19,70.19]Inspected06‐08ObservedData [‐12.16,15.84] [‐3.75,4.25] [‐23.92,27.08] [‐281,320] [‐32.59,37.60] [‐32.67,37.52]PositiveSelection [‐12.16,2.06] [‐3.75,0.00] [‐23.92‐0.08] [‐281,1.47] [‐32.59,0.57] [‐32.67,0.38]CaseInitiated06‐08ObservedData [‐9.75,18.25] [‐3,5] [‐19.17,31.83] [‐225,376] [‐26.06,44.13] [‐26.15,44.05]PositiveSelection [‐9.75,2.26] [‐3,0.01] [‐19.17,‐0.04] [‐225,2.25] [‐26.06,0.73] [‐26.15,0.50]PenaltyProposed06‐08ObservedData [‐3.96,24.04] [‐1.17,6.83] [‐7.47,43.53] [‐87,514] [‐10.29,59.90] [‐10.32,59.87]PositiveSelection [‐3.96,4.02] [‐1.17,0.03] [‐7.47,0.08] [‐87,7.02] [‐10.29,0.58] [‐10.32,0.18]
37
References
[1]Terkel,Amada.“112thCongressSetToBecomeMostUnproductiveSince1940s,”TheHuffingtonPost,December28,2012.
[2]Frosch,Dan.“CongressPassesBillBolsteringPipelineSafetyRules,”TheNewYork
Times,December17,2011.[3]May,PeterJ.1991.“ReconsideringPolicyDesign:PoliciesandPublics,”JournalofPublic
PolicyVol.11,No.2,pp.187‐206.
[4]Parker,CarolM.2004.“ThePipelineIndustryMeetsGriefUnimaginable:CongressReactswiththePipelineSafetyImprovementActof2002”NaturalResourcesJournal44:243‐282.
[5]Frosch,DanandJanetRoberts.“PipelineSpillsPutSafeguardsUnderScrutiny,”,The
NewYorkTimes,September9,2011.[6]Quarterman,CynthiaL.(Administrator,PipelineandHazardousMaterialsSafety
Administration,U.S.DepartmentofTransportation).TestimonyofbeforetheHouseEnergyandCommerceCommittee,June16,2011.
[7]E.SosaandJ.Alvarez‐Ramirez.2009.“Time‐CorrelationsintheDynamicsofHazardous
MaterialsPipelineIncidents,”JournalofHazardousMaterials165:1204‐1209.
[8]Becker,GaryS.1968.“CrimeandPunishment:AnEconomicApproach.”JournalofPoliticalEconomy,76:169‐172.
[9]Russell,CliffordS.,WinstonHarringtonandWilliamJ.Vaughan.1986.EconomicModels
ofMonitoringandEnforcement:EnforcingPollutionControlLaws,Washington,D.C:ResourcesfortheFuture.
[10]Gray,WayneB.andJayP.Shimshack.2011.“TheEffectivenessofEnvironmental
MonitoringandEnforcement:AReviewoftheEmpiricalEvidence,”ReviewofEnvironmentalEconomicsandPolicy5:3–24.
[11]Gray,WayneB.andMaryDeily.1996.“ComplianceandEnforcement:AirPollution
RegulationintheU.S.SteelIndustry,”JournalofEnvironmentalEconomicsandManagement31:96–111.
[12]Gray,WayneandRonShadbegian.2005.“WhenandWhyDoPlantsComply?Paper
Millsinthe1980s,”LawandPolicy27:238–61.[13]Earnhart,Dietrich.2004.“RegulatoryFactorsShapingEnvironmentalPerformanceat
PubliclyOwnedTreatmentPlants,”JournalofEnvironmentalEconomicsandManagement48:655–81.
38
[14]Glicksman,R.,andDietrichEarnhart.2007.“TheComparativeEffectivenessof
GovernmentInterventionsonEnvironmentalPerformanceintheChemicalIndustry,”StanfordEnvironmentalLawJournal26:317–71.
[15]Stafford,Sarah.2002.“TheEffectofPunishmentonFirmCompliancewithHazardous
WasteRegulations,”JournalofEnvironmentalEconomicsandManagement44:290–308.
[16]Gray,WayneB.,andJohnT.Scholz.1993.“DoesRegulatoryEnforcementWork?A
LongitudinalStudyofOSHAEnforcement,”LawandSocietyReview27:177–213.[17]Gray,WayneB.andJohnMendeloff.2005.“TheDecliningEffectsofOSHAInspections
onManufacturingInjuries,1979‐1998,”IndustrialandLaborRelationsReview58:571‐587.
[18]Haviland,Amelaietal.2010.“WhatkindsofinjuriesdoOSHAinspectionsprevent?”
JournalofSafetyResearch41:339‐345.[19]Khanna,MadhuandWilliamRoseQ.Anton.2002.“CorporateEnvironmental
Management:RegulatoryandMarket‐BasedIncentives,”LandEconomics78:539‐558.
[20]Thornton,Dorothy,NeilGunningham,RobertKagan.2005."GeneralDeterrenceand
CorporateEnvironmentalBehavior,"Law&Policy27:262‐288.[21]Manski,CharlesF.2007.IdentificationforPredictionandDecision.Cambridge,MA:
HarvardUniversityPress.[22]Morgan,StephenL.andChristopherWinship.2007.CounterfactualsandCausal
Inference:MethodsandPrinciplesforSocialResearch.Cambridge,UK:CambridgeUniversityPress.