Embed Size (px)
Citation preview

Widening Participation in Higher Education: A
Quantitative Analysis
Institute of Education
Institute for Fiscal Studies
Centre for Economic Performance

Background and Motivation
• Expansion of HE– 43% of 17-30 year olds participate in higher
education
• Widening participation still cause for concern– gap in the HE participation rate between
richer and poorer students actually widened in the mid and late 1990s

Background and Motivation
• Concerns about who is accessing HE increased following the introduction of tuition fees– another barrier to HE participation by poorer students
(Callender, 2003)• Introduction of fees in 1998 not associated with
any sustained overall fall in the number of students
• Recent policy developments may, however, affect future participation. – 2004 Higher Education Act with higher and variable
tuition fees– increased support for students

Research Questions
• How does the likelihood of HE participation vary by ethnicity and socio-economic background?
• How much of this is explained by prior achievement?
• When do differences by socio-economic background and ethnicity emerge?
• How does the type of HE participation vary across these socio-economic and ethnic groups?
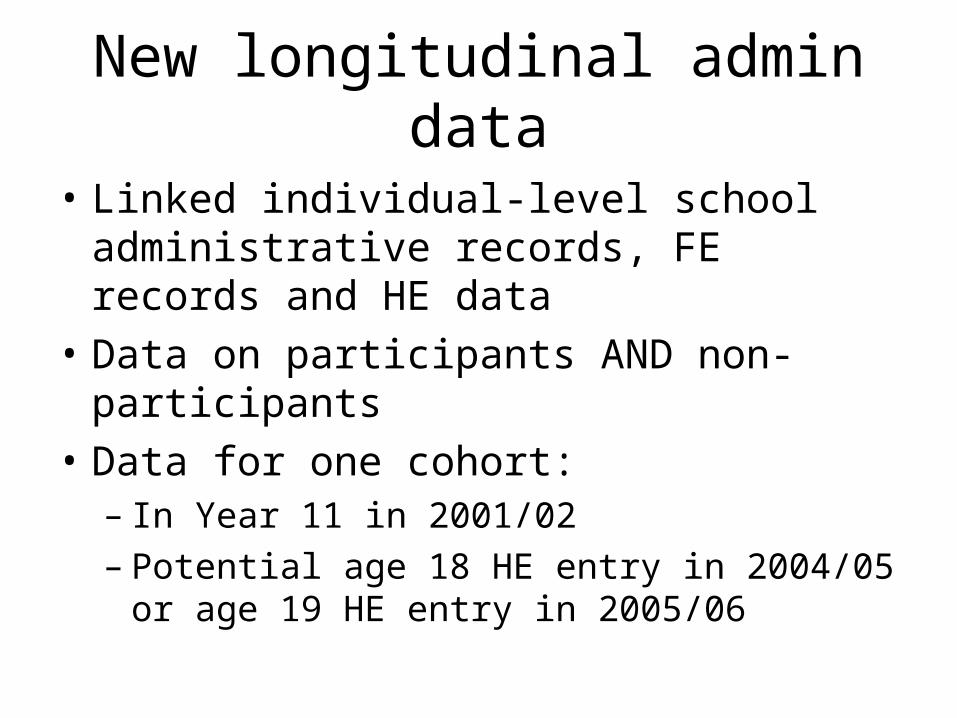
New longitudinal admin data
• Linked individual-level school administrative records, FE records and HE data
• Data on participants AND non-participants
• Data for one cohort:– In Year 11 in 2001/02– Potential age 18 HE entry in 2004/05 or age
19 HE entry in 2005/06

Data
• Socio-economic background– Free school meals– Neighbourhood based measures– Combined to create a “deprivation index”
(split into 5 equally sized groups)
• Ethnicity
• Measures of prior attainment i.e. all Key Stage results through to KS5

Methodology
• Linear probability regression model.• Two models:
– HE participation (at age 18/19)– HE participation in a “high status” institution
• Dependent variables are binary, taking a value of one if the person participates and zero otherwise.
• The regression model is estimated using Ordinary Least Squares

Model
iisiiis PASXSEGHE 4321

Participation by deprivation status
0 .1 .2 .3 .4 .5Proportion attending HE at age 18/19
Most deprived
4
3
2
Least deprived

Participation by deprivation status and gender
Males Females
Raw Within schools
Raw Within schools
4th quintile 0.049** [0.003]
0.049** [0.003]
0.067** [0.004]
0.072** [0.003]
3rd quintile 0.124** [0.004]
0.116** [0.003]
0.161** [0.005]
0.158** [0.003]
2nd quintile 0.196** [0.005]
0.175** [0.004]
0.245** [0.005]
0.231** [0.004]
Least deprived quintile
0.290** [0.006]
0.241** [0.004]
0.346** [0.006]
0.306** [0.004]

Participation by deprivation status for males
Plus other
controls
Plus Key
Stage 2
Plus Key
Stage 3
Plus Key
Stage 4
Plus Key
Stage 5
4th quintile 0.022** [0.002]
0.013** [0.002]
0.008** [0.002]
0.000 [0.002]
0.000 [0.002]
3rd quintile 0.064** [0.003]
0.043** [0.003]
0.027** [0.003]
0.008** [0.002]
0.001 [0.002]
2nd quintile 0.102** [0.003]
0.072** [0.003]
0.049** [0.003]
0.019** [0.003]
0.003 [0.002]
Least deprived quintile
0.143** [0.004]
0.105** [0.004]
0.073** [0.004]
0.032** [0.003]
0.010** [0.003]

Participation by deprivation status
• Very large raw differences in HE participation rates by deprivation status
• Controlling for individual characteristics approximately halves the gap
• Disparity all but disappears once we add in controls for prior attainment– 1ppt for males– 2.1ppts for females

Participation by ethnicity
0 .2 .4 .6 .8Proportion attending HE at age 18/19
Other
Mixed
Other Asian
Chinese
Bangladeshi
Pakistani
Indian
Other Black
Black Caribbean
Black African
Other White
White British
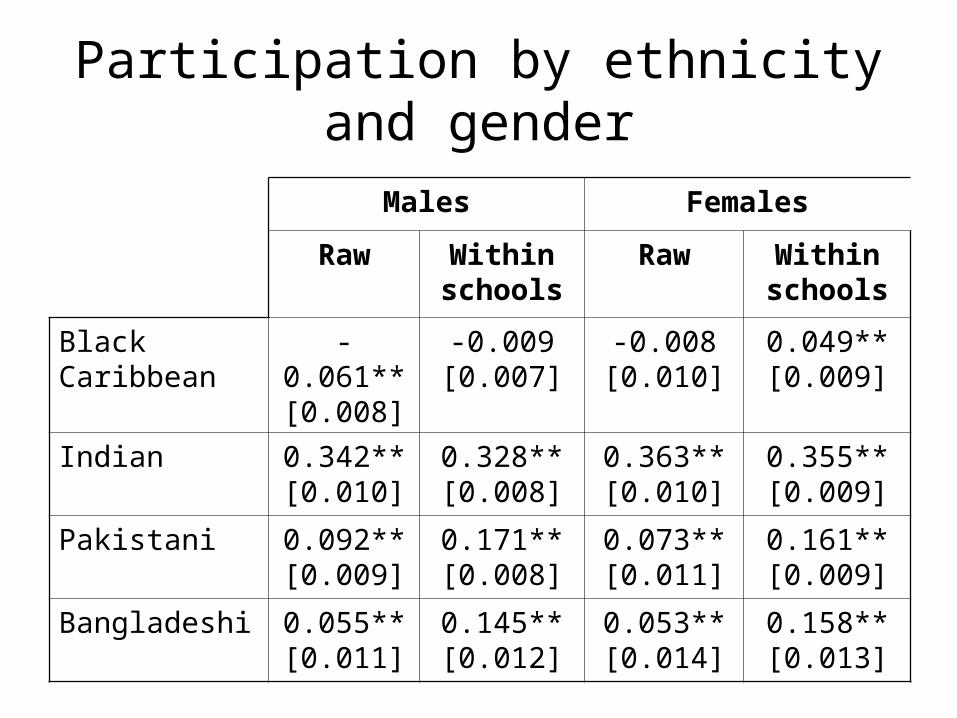
Participation by ethnicity and gender
Males Females
Raw Within schools
Raw Within schools
Black Caribbean
-0.061** [0.008]
-0.009 [0.007]
-0.008 [0.010]
0.049** [0.009]
Indian 0.342** [0.010]
0.328** [0.008]
0.363** [0.010]
0.355** [0.009]
Pakistani 0.092** [0.009]
0.171** [0.008]
0.073** [0.011]
0.161** [0.009]
Bangladeshi 0.055** [0.011]
0.145** [0.012]
0.053** [0.014]
0.158** [0.013]
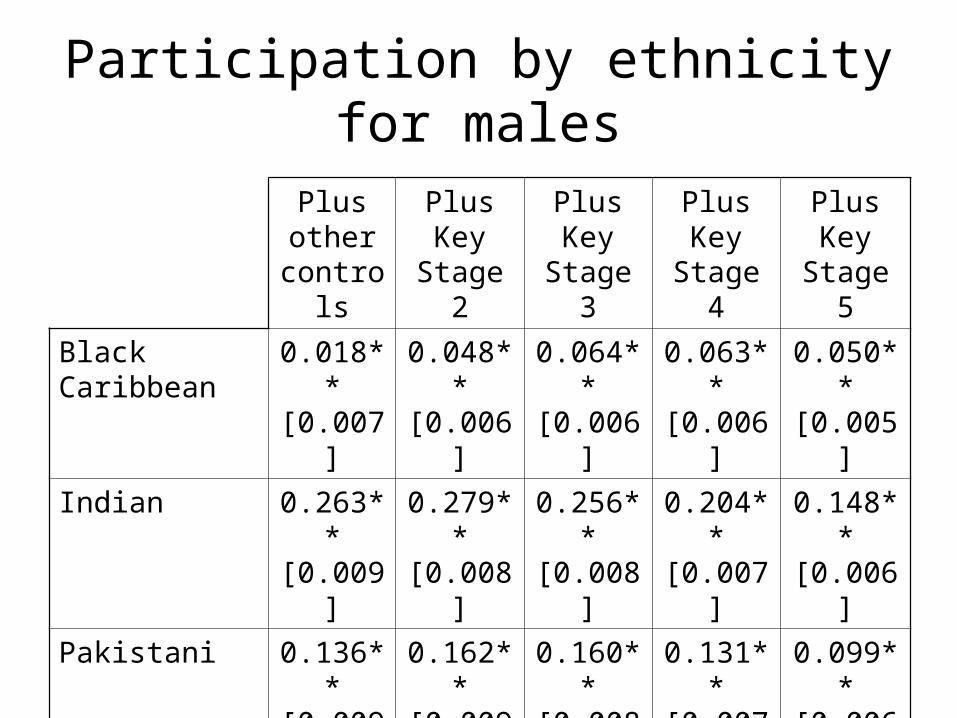
Participation by ethnicity for males
Plus other
controls
Plus Key
Stage 2
Plus Key
Stage 3
Plus Key
Stage 4
Plus Key
Stage 5
Black Caribbean
0.018** [0.007]
0.048** [0.006]
0.064** [0.006]
0.063** [0.006]
0.050** [0.005]
Indian 0.263** [0.009]
0.279** [0.008]
0.256** [0.008]
0.204** [0.007]
0.148** [0.006]
Pakistani 0.136** [0.009]
0.162** [0.009]
0.160** [0.008]
0.131** [0.007]
0.099** [0.006]
Bangladeshi 0.106** [0.013]
0.120** [0.012]
0.110** [0.012]
0.075** [0.011]
0.063** [0.009]

Participation by ethnicity
• Most ethnic minority groups are more likely to participate in HE than White British students– Except Black Caribbean and Other Black students
• But these groups tend to go to worse schools and are more likely to be deprived– Gap turns positive when we include controls
• Including KS2 results also increases gap• But declines once we add in KS3-5 results
– Ethnic minority students improve performance more than White British students during secondary school

Type of Participation
• Also consider type of HE participation, because:– Students at less prestigious institutions more likely to
drop out and/or achieve lower degree classification – Graduates from more prestigious institutions earn
higher returns in the labour market
• Define “high status” university as:– Russell Group university (20 in total)– Any UK university with an average 2001 RAE score
greater than lowest found amongst Russell Group• Adds Bath, Durham, Lancaster, York, etc (21 in total)

“High status” participation by deprivation status
0 .1 .2 .3 .4Proportion attending a high status institute at age 18/19
Most deprived
4
3
2
Least deprived
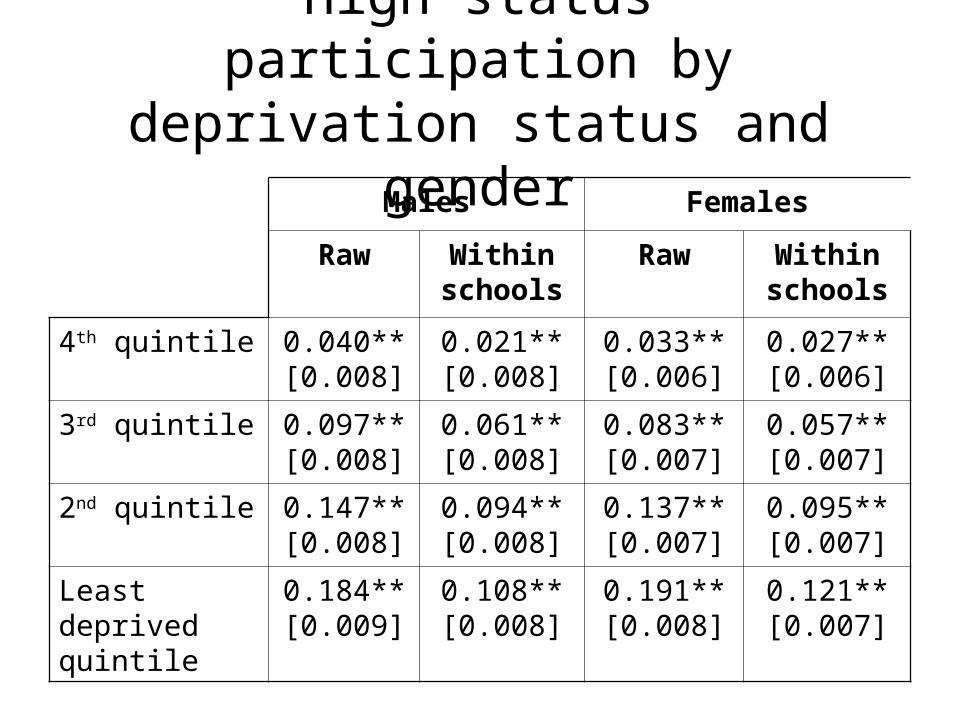
“High status” participation by deprivation status and gender
Males Females
Raw Within schools
Raw Within schools
4th quintile 0.040** [0.008]
0.021** [0.008]
0.033** [0.006]
0.027** [0.006]
3rd quintile 0.097** [0.008]
0.061** [0.008]
0.083** [0.007]
0.057** [0.007]
2nd quintile 0.147** [0.008]
0.094** [0.008]
0.137** [0.007]
0.095** [0.007]
Least deprived quintile
0.184** [0.009]
0.108** [0.008]
0.191** [0.008]
0.121** [0.007]

“High status” participation by deprivation status for males
Plus other
controls
Plus Key
Stage 2
Plus Key
Stage 3
Plus Key
Stage 4
Plus Key
Stage 5
4th quintile 0.003 [0.008]
-0.002 [0.008]
-0.004 [0.007]
-0.007 [0.007]
-0.007 [0.006]
3rd quintile 0.028** [0.008]
0.016** [0.008]
0.010 [0.008]
-0.001 [0.007]
-0.004 [0.007]
2nd quintile 0.049** [0.009]
0.033** [0.009]
0.022** [0.008]
0.008 [0.008]
0.004 [0.007]
Least deprived quintile
0.052** [0.009]
0.034** [0.009]
0.021** [0.009]
0.005 [0.008]
-0.002 [0.008]
“High status” participation by deprivation status
• Students from deprived backgrounds are less likely to attend a high status university than less deprived students– Although gap smaller than for participation
• Prior attainment is key to widening participation in “high status” institutions amongst more deprived students– Gap disappears amongst students with same
Key Stage 4 results

“High status” participation by ethnicity
0 .1 .2 .3 .4 .5Proportion attending a high status institute at age 18/19
Other
Mixed
Other Asian
Chinese
Bangladeshi
Pakistani
Indian
Other Black
Black Caribbean
Black African
Other White
White British

“High status” participation by ethnicity and gender
Males Females
Raw Within schools
Raw Within schools
Black Caribbean
-0.198** [0.013]
-0.161** [0.016]
-0.149** [0.013]
-0.114** [0.013]
Indian -0.050** [0.012]
-0.029** [0.010]
-0.053** [0.010]
-0.016 [0.010]
Pakistani -0.141** [0.012]
-0.086** [0.012]
-0.100** [0.013]
-0.063** [0.011]
Bangladeshi -0.073** [0.018]
-0.020 [0.022]
-0.089** [0.015]
-0.044* [0.018]
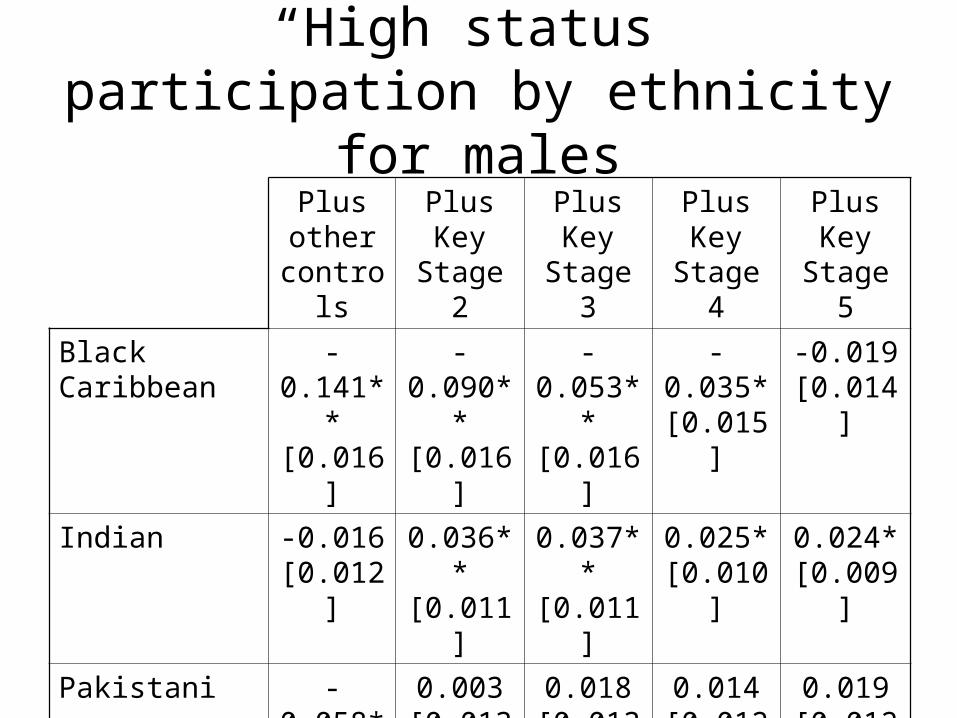
“High status” participation by ethnicity for males
Plus other
controls
Plus Key
Stage 2
Plus Key
Stage 3
Plus Key
Stage 4
Plus Key
Stage 5
Black Caribbean
-0.141** [0.016]
-0.090** [0.016]
-0.053** [0.016]
-0.035* [0.015]
-0.019 [0.014]
Indian -0.016 [0.012]
0.036** [0.011]
0.037** [0.011]
0.025* [0.010]
0.024* [0.009]
Pakistani -0.058** [0.014]
0.003 [0.013]
0.018 [0.013]
0.014 [0.012]
0.019 [0.012]
Bangladeshi 0.007 [0.024]
0.048* [0.023]
0.045* [0.022]
0.033 [0.021]
0.044* [0.019]

“High status” participation by ethnicity for females
Plus other
controls
Plus Key
Stage 2
Plus Key
Stage 3
Plus Key
Stage 4
Plus Key
Stage 5
Black Caribbean
-0.093** [0.013]
-0.039** [0.013]
-0.020 [0.013]
-0.012 [0.012]
-0.010 [0.012]
Indian 0.002 [0.012]
0.046** [0.012]
0.041** [0.011]
0.031** [0.011]
0.039** [0.010]
Pakistani -0.033* [0.014]
0.026* [0.013]
0.039** [0.013]
0.029* [0.012]
0.042** [0.012]
Bangladeshi -0.009 [0.020]
0.042* [0.018]
0.044* [0.018]
0.027 [0.018]
0.031 [0.017]

“High status” participation by ethnicity
• Many ethnic minority participants are less likely to attend a “high status” institution than White British participants
• Once we add controls for prior attainment, all ethnic minority groups are at least as likely to attend a “high status” institution as White British students

Conclusions
• Widening participation in HE to students from deprived backgrounds is largely about tackling low prior achievement– The gap is evident as early as age 11
• Focusing policy interventions on KS5 phase is unlikely to have a serious impact on reducing the raw socio-economic gap in HE participation.
• Does not remove the onus on universities

Limitations
• Young participants only– But other work looks at mature students
• Excludes private school students– But work-in-progress suggests that
participation rates amongst private school students may not be much higher than amongst state school students