Embed Size (px)
Citation preview

WID Resource and Training Guide
Welcome
WELCOME to the Analyst Resource Center’s DBA Guide
We have designed this resource to make it easy to find answers to questions you may have about the WID.
This is a living document and will be updated as changes occur. We suggest bookmarking or saving the link to this document on your desktop for easy reference.
2
WE are committed to helping you be successful
You are part of a network of peers who are ready to assist you when needed. Please feel free to reach out to the various contacts for additional help.
If you don’t find what you need here, please let us know so we can answer your questions and add that information to this resource guide.
3|
Table of Contents
4
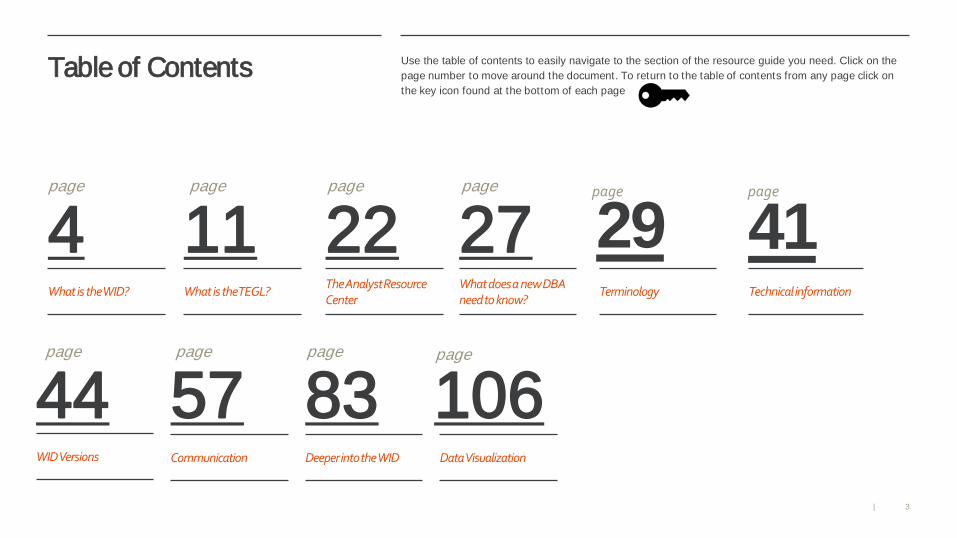
Use the table of contents to easily navigate to the section of the resource guide you need. Click on the page number to move around the document. To return to the table of contents from any page click on the key icon found at the bottom of each page
11 22 27 29page page page page page
44 57 83 106page page page page
What is the WID? What is the TEGL? The Analyst Resource Center
What does a new DBA need to know?
Terminology
Communication Deeper into the WID Data Visualization
Technical information
WID Versions
41page

This section contains basic information on the WID and the organization responsible for the WID maintenance
4
1. What is the WID?
2. Evolution of the WID
3. Why is it needed?
4. What is the TEGL?
5. Who is the WID audience?
6. The Analyst Resource Center (ARC)
What is the WID?

What is the WID?Workforce Information Database
5
Workforce Information Database
WID
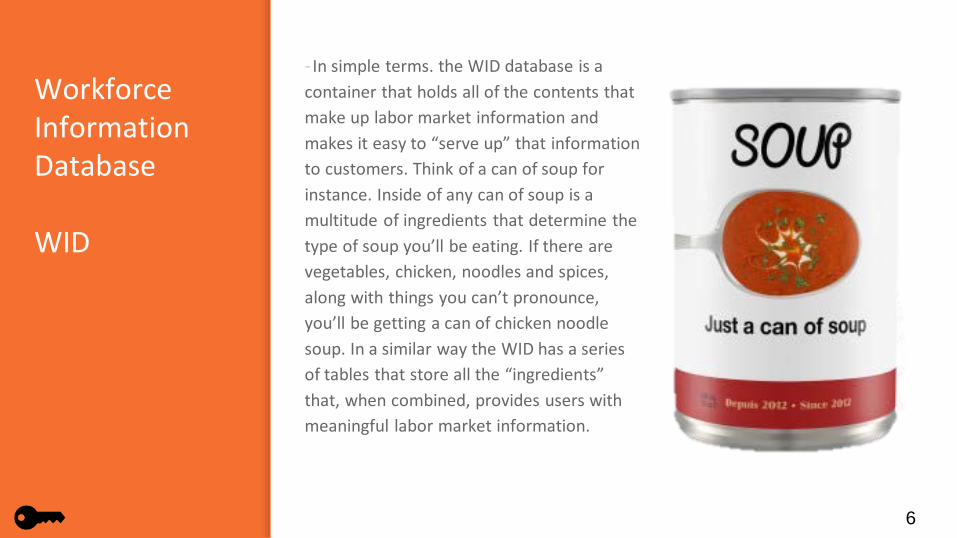
- In simple terms. the WID database is a container that holds all of the contents that make up labor market information and makes it easy to “serve up” that information to customers. Think of a can of soup for instance. Inside of any can of soup is a multitude of ingredients that determine the type of soup you’ll be eating. If there are vegetables, chicken, noodles and spices, along with things you can’t pronounce, you’ll be getting a can of chicken noodle soup. In a similar way the WID has a series of tables that store all the “ingredients” that, when combined, provides users with meaningful labor market information.
6
Evolution of the WID
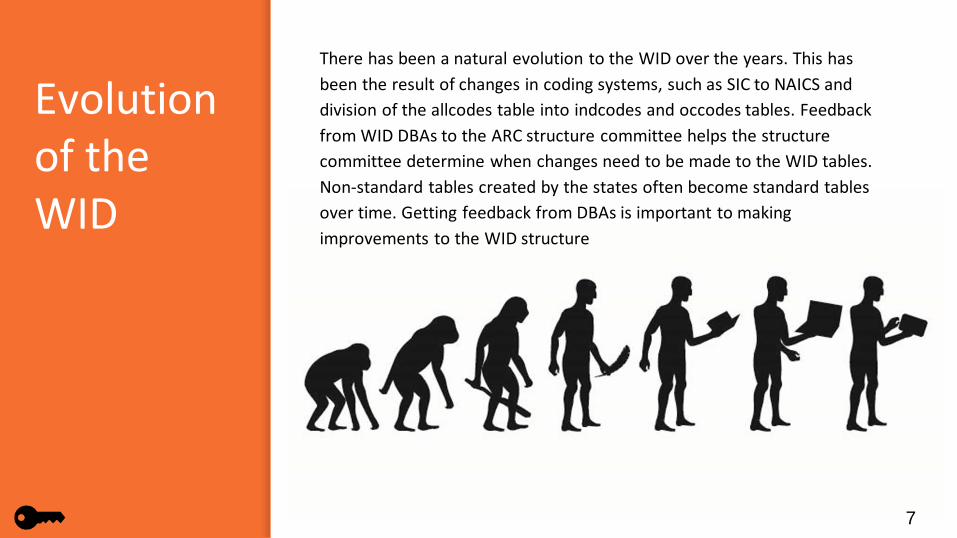
There has been a natural evolution to the WID over the years. This has been the result of changes in coding systems, such as SIC to NAICS and division of the allcodes table into indcodes and occodes tables. Feedback from WID DBAs to the ARC structure committee helps the structure committee determine when changes need to be made to the WID tables. Non-standard tables created by the states often become standard tables over time. Getting feedback from DBAs is important to making improvements to the WID structure
7
Why is it needed?
Previous to the WID there was not a common structure that allowed state by state comparisons of data, or a way of providing a larger array of data together in one place.
It is essential that when comparing data across states, localities, and nationally that there is a common structure in coding, naming conventions etc.
8
9
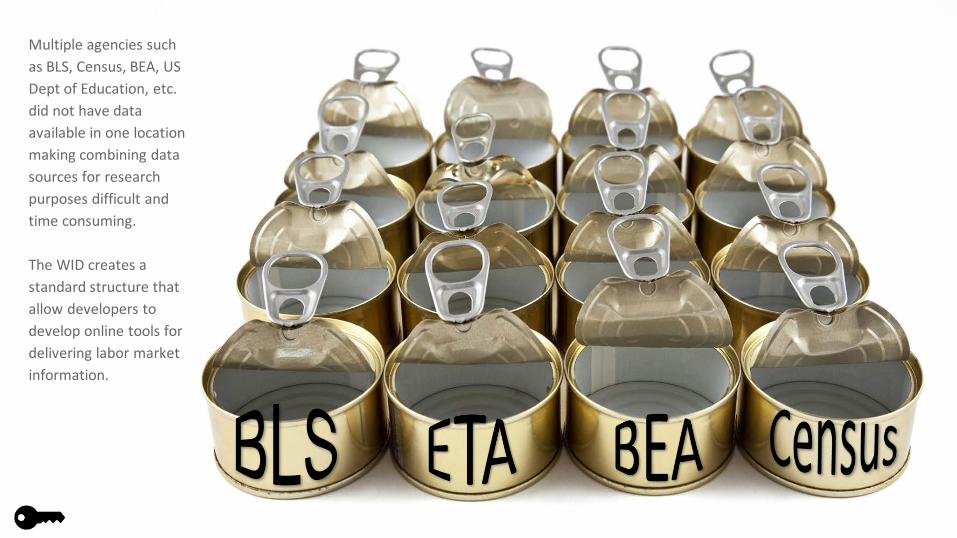
Multiple agencies such as BLS, Census, BEA, US Dept of Education, etc. did not have data available in one location making combining data sources for research purposes difficult and time consuming.
The WID creates a standard structure that allow developers to develop online tools for delivering labor market information.
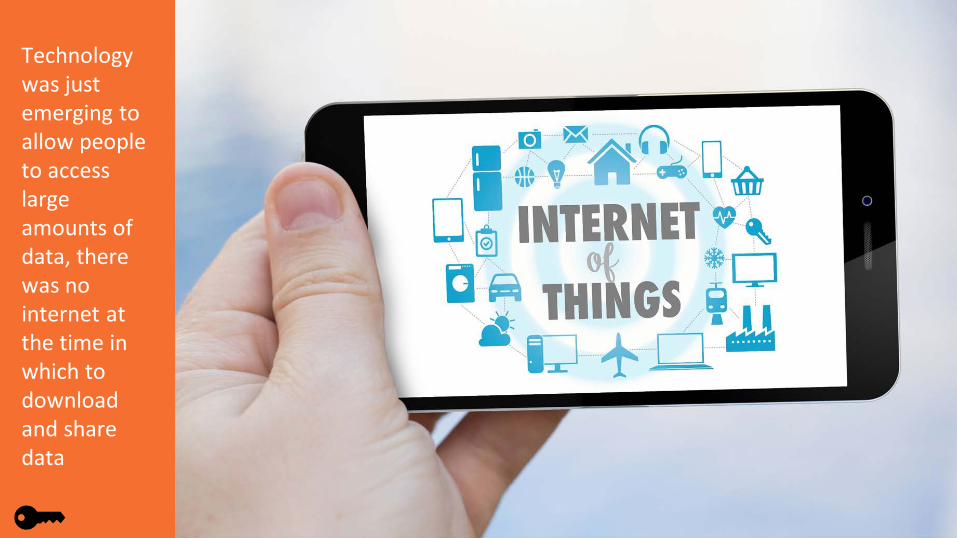
Technology was just emerging to allow people to access large amounts of data, there was no internet at the time in which to download and share data
10
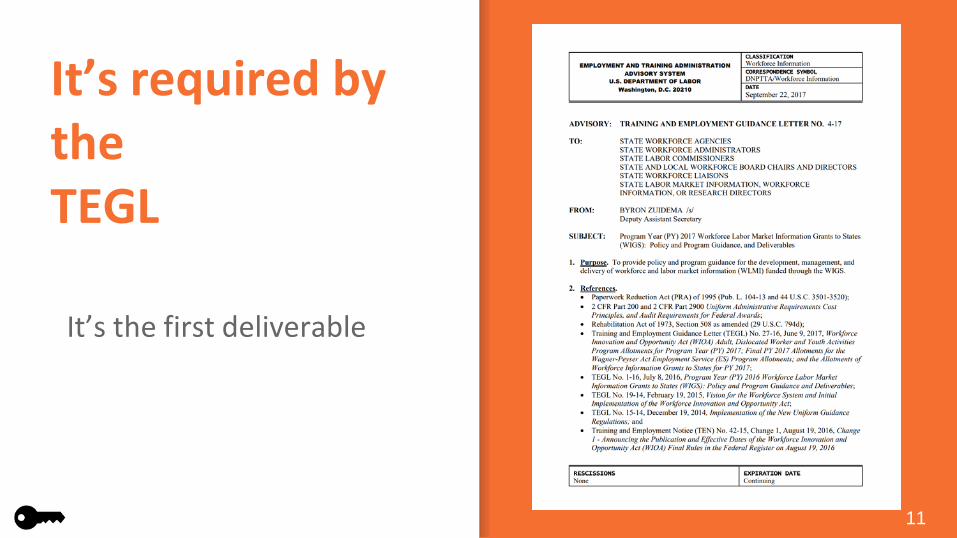
It’s required by the TEGL
11
It’s the first deliverable

What is the TEGL and the WIG?
12
Some more alphabet soup. The Employment and Training Administration (ETA) provides the funds to support the work of the Analyst Resource Center that manages the WID. They provide the money and the instructions on the deliverables.
ETA creates a document called a TEGL, which stands for Training and Employment Guidance Letter.
Each state’s LMI office that receives money from ETA under the Workforce Information Grant (WIG)has to meet the deliverables outlined in the TEGL.
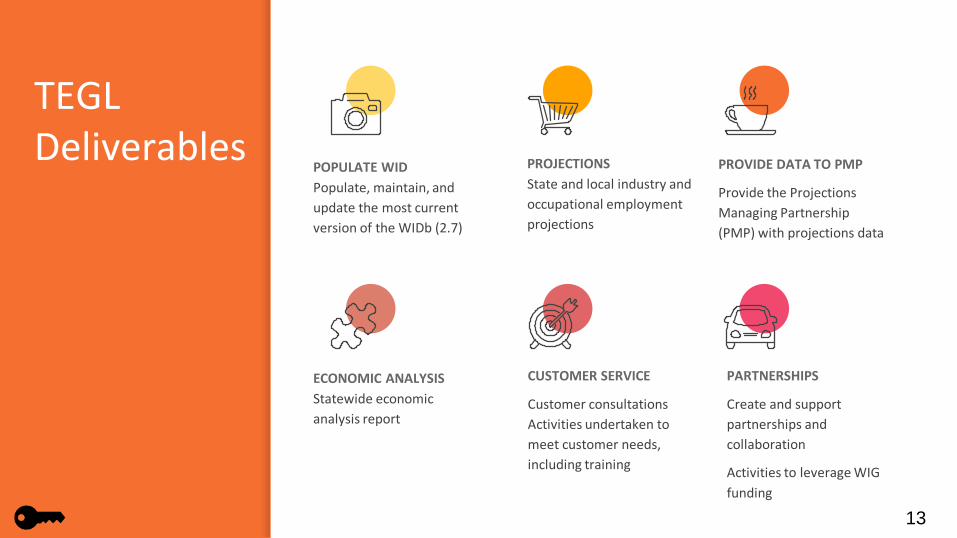
TEGL Deliverables
POPULATE WIDPopulate, maintain, and update the most current version of the WIDb (2.7)
ECONOMIC ANALYSISStatewide economic analysis report
PROJECTIONSState and local industry and occupational employment projections
13
PROVIDE DATA TO PMP
Provide the Projections Managing Partnership (PMP) with projections data
PARTNERSHIPS
Create and support partnerships and collaboration
Activities to leverage WIG funding
CUSTOMER SERVICE
Customer consultationsActivities undertaken to meet customer needs, including training

14
Because of data standardization through use of the Workforce Information Database, an unprecedented ability to link the various systems, classifications, and coding schemes can be achieved. These integrated resources, provide unlimited opportunities for the delivery of customized, local information to customers in useful formats.

Who is the audience of the WID?
Primary audience is LMI shops and web developers
15
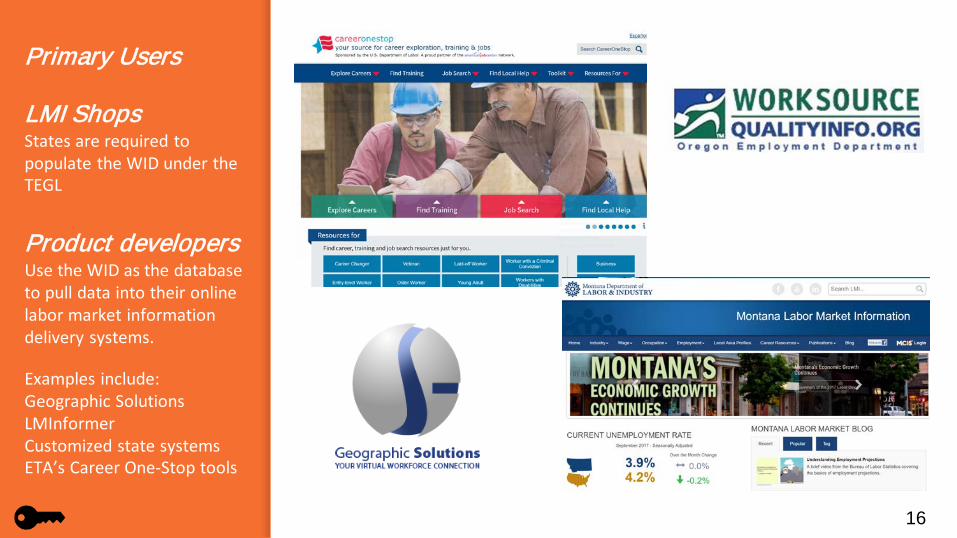
Primary Users
LMI ShopsStates are required to populate the WID under the TEGL
Product developersUse the WID as the database to pull data into their online labor market information delivery systems.
Examples include:Geographic SolutionsLMInformerCustomized state systemsETA’s Career One-Stop tools
16
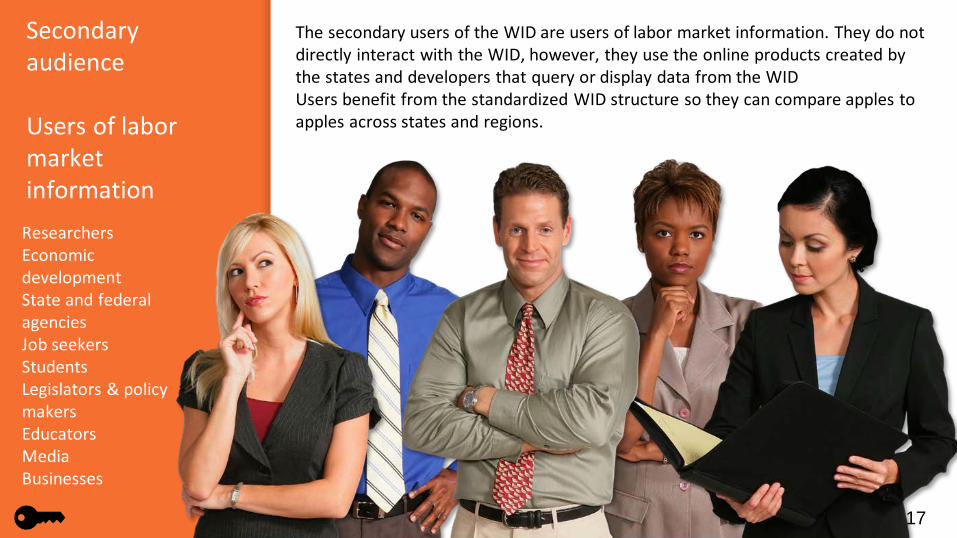
Secondary audience
Users of labor market information
17
The secondary users of the WID are users of labor market information. They do not directly interact with the WID, however, they use the online products created by the states and developers that query or display data from the WIDUsers benefit from the standardized WID structure so they can compare apples to apples across states and regions.
ResearchersEconomic developmentState and federal agenciesJob seekersStudentsLegislators & policy makersEducatorsMediaBusinesses
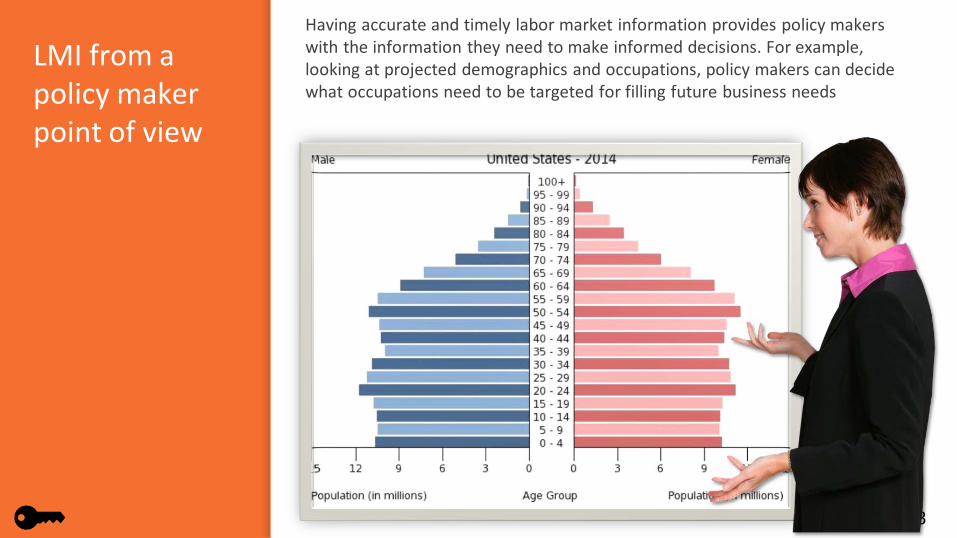
LMI from a policy maker point of view
18
Having accurate and timely labor market information provides policy makers with the information they need to make informed decisions. For example, looking at projected demographics and occupations, policy makers can decide what occupations need to be targeted for filling future business needs

LMI from an educator point of view
19
Having projections data is important as educators plan their programs of study and coursework.

LMI from a business point of view
20
During tight labor markets, occupational wage information becomes an important dataset in order to determine wage competitiveness.
Projected supply and demand helps businesses determine strategies for growth and recruitment.

ETA provides funding to States via Workforce Information Grants
Funds the ARC which is responsible for the WID and LEWIS
21
ETA
ANALYST RESOURCE
CENTER (ARC)
WID LEWIS
STATES (WIG)
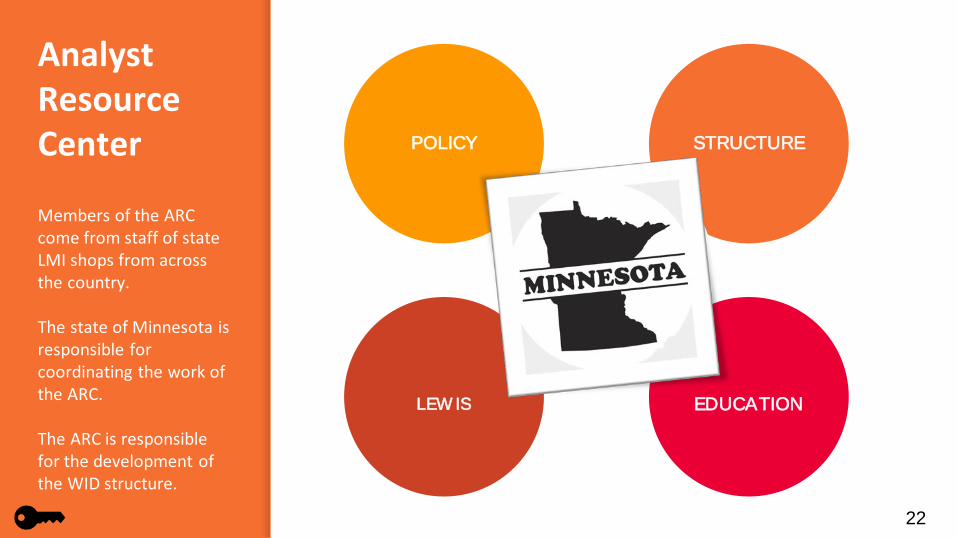
Analyst Resource Center
Members of the ARC come from staff of state LMI shops from across the country.
The state of Minnesota is responsible for coordinating the work of the ARC.
The ARC is responsible for the development of the WID structure.
22
POLICY STRUCTURE
LEW IS EDUCATION
CORE BLS PROGRAMS
23
The Analyst Resource Center members serve on one of three committees: Policy, Structure, or Education/CommunicationsThe Policy Committee defines the mission and objectives for the consortium and provides management services for its contractors, e.g. National Crosswalk Service Center and the Employer Database. The chair of the committee serves as primary point of contact for ETA dealing with contractual and financial arrangements and details. Members of this committee serve as contacts for other federal projects such as Projections Central.

24
Structure
The Structure Committee reviews and make recommendations for updates or modifications to the database structure
The Structure Committee collects feedback from state DBAs and discusses modifications to the WID structure based on feedback as well as changing demands under the WIG or WIOA

25
As its name suggests, the Education/communication Committee work to communicate and educate state DBAs.
This committee is responsible for the newsletter, website and all training materials provided at widcenter.org
26
Local Employment and Wage Information System
LEWIS or Local Employment and Wage Information System is overseen and funded by the ARC. LEWIS is the software program that states use to calculate state and sub-state area SOC-based employment and wage estimates.

In this section you will learn some important terminology as well as technical information important for maintaining your WID
27
1. Terminology
2. Technical things you need to know
3. WID version, past, present and future
4. The employer database
What does a new DBA need to know?

What does a new DBA need to know?
28
Congratulations, you’ve just started in your agency as the new DBA for the WID. You may be wondering what you’ve gotten yourself into. In this resource guide we will be providing you with the best tools and expertise to help you successfully work with the WID. This portion covers the basic things a DBA needs to know.

29
Vous devez ajouter une nouvelle table dans la base
Что вы имеете в виду?
TerminologyTo really be fluent in any language, you need to know some basic words of that language. If one person is speaking French and the other person only speaks Russian, there will be little understanding going on. Getting familiar with the terminology of databases will help us better understand each lesson.
What is a database?
A database is where your data lives. It is structured/managed to ensure that accurate values are inserted, valuable data is retained, irrelevant data is removed and duplication is avoided. A well-managed database ensures that correct and complete information is always accessible in one place.
30

Normalized Relational Database
-The Workforce Information Database is a normalized relational database structure developed for the storage and maintenance of employment statistics, labor market information, employer listings and related economic and demographic data. The database development project originated from the need for a single, multi-purpose database structure to drive analytical and data display systems.
-The resulting cost savings to the workforce information system as a whole is significant because states and national entities do not have to “reinvent the wheel”.
31
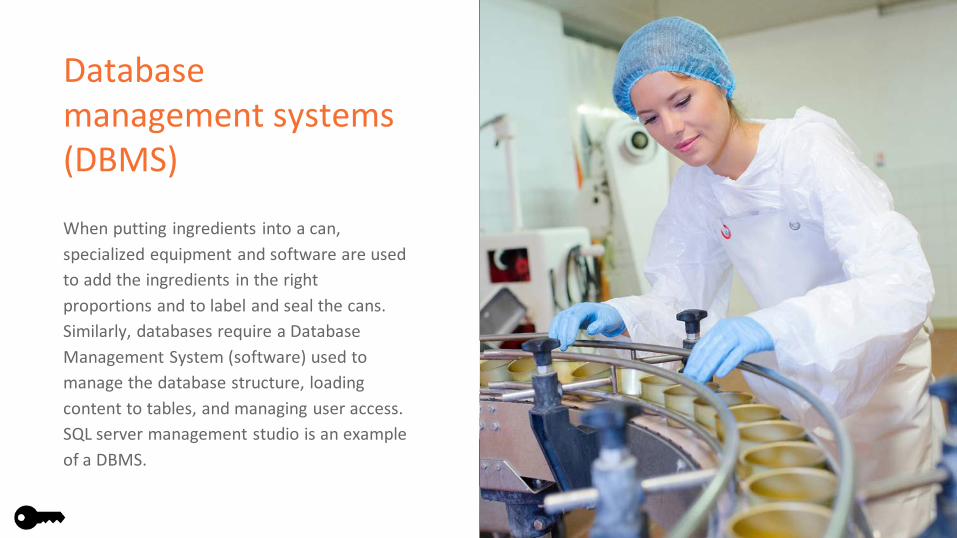
Database management systems (DBMS)
32
When putting ingredients into a can, specialized equipment and software are used to add the ingredients in the right proportions and to label and seal the cans. Similarly, databases require a Database Management System (software) used to manage the database structure, loading content to tables, and managing user access. SQL server management studio is an example of a DBMS.

User products
33
User products are how most people access or query the information contained in the database, limited to read access. They may include an Access, Excel or other program front-end that connects to the database, or web tools. The DBMS can also be used to access the database.Knowing the distinction is helpful because not all LMI shops have access to their DBMS – they may be end users from a technical standpoint, even if they’re running jobs created to load files.Understanding the distinction helps aid interactions with IT staff

34
Views
Views are stored queries that make data available in a prescribed structure –they’re often used for permissions reasons, so users don’t have access to sensitive data, or to connect tables, so users don’t have to look up the name of a firm in a separate table.

35
PackagesPackages are processes with pre-defined steps that have been set up to run in sequence. This is often how data in a predictable format is loaded, since it minimizes error

36
This is a type of connection outside programs used to access a database. Flat files are text-based documents sometimes used to transport data for uploadExcel or other programs can also be used for transporting data for upload, but they have their own challenges – users sometimes fill them up with elaborate headings or color-coding, none of which can be imported. The database can also be finicky about how it interprets their field types, which aren’t as well-defined as in a database.
ODBC connection, flat files, Excel

37Web Services
Generally bypasses the internal database and allows data from another entity’s database to be displayed on your websiteReduces maintenance costs, but makes you susceptible to other people’s management decisions (frequency of updates, responsiveness to need for edits, being discontinued). Examples of a web service is Google maps or data.gov.

What’s in a name?
The way data sources and programs are described varies: BLS programs are sometimes referred to by their program name, an acronym, the software/interface used by the program, or an outdated program name. File names can also be named by any of those things – if your documentation says to request the EDS file, it will be easier to determine who to request it from if, for example, you know that EDS was the precursor to LEWIS, which is software that produces correctly aggregated and suppressed OES estimates.
38
Funding stems from maintaining the WID, so the DBA is an advocate for the WID
Understanding obligations under the grant and fulfilling them is a large part of the job.
Program requirements come from many agencies and funding streams: Direct BLS products have their own requirements in the cooperative agreements, but may also be inputs in other federal programs. LAUS is used to determine eligibility for ETA funding, Department of Ag funding, USCIS programs and state incentives. State budget offices or planning organizations may require employment numbers.
39
You are not alone! There are other people doing the same kind of data loads in all the other states. Tap those resources and solve problems.

Structured Query Language
40
It was decided that the WID needed to be a Relational Database but also needed to have flexibility to work in multiple systems with the basis being it would use a Structured Query Language or SQL. SQL comes in many forms, MYSQL, T-SQL or MSSQL, Oracle or PLSQL, PostgrSQL, etc. This allows the states to use a database version that fits their systems. After deciding to use a Relational Database Management System (RDBMS) a structure had to be built and documented, that could be used by all and maintain consistency. The result is the WID Data Dictionary.

Technical things you need to know
File and field typesA lot of organizations don’t rely as heavily on file imports as we in LMI do. Even DBAs experienced in other organizations can encounter import problems when field types are incorrectly formatted, leading zeroes aren’t preserved, commas are or are not present, and the list goes on. There is no way to avoid data imports to the WID and the variety of federal and state programs that feed our content means that there will never be a single standard.
Sensitive dataThere are different kinds of sensitive data: pre-release data, which is public after a certain deadline, personally identifiable data like UI claims information or QCEW employer data which is never public, and suppressed data, which is deemed unreliable or may reveal personally identifiable data.
Data changesData can change for prior periods:LAUS and CES have different vintages of the same data –monthly estimates are revised in the subsequent month, and annually after that. The number of prior years affected by benchmark revisions/annual processing can vary from year to year and differs depending on whether you’re talking about state data or small areas. For QCEW, data is edited for six quarters at a time. Other programs don’t revise data at all.
41

Technical things you need to know
Data SourcesData source files vary by program: The programs that have state involvement each have their own sets of software and tools for managing data. Export formats are different from program to program, and there are often a couple of formats for extracting data. When new extract formats get added, old ones are usually retained and analysts may stick with them. If a file format isn’t ideal, investigate if there’s another way.
Official estimates have required standards▪Official estimates have required standards: For many BLS programs there’s a specific value that needs to be displayed, including rounding rules and number of decimals. This affects imports, web display, and reporting.
Theory and practice▪The database plays a central role in LMI products: Every change has implications elsewhere, both in the database and products that depend on it. Even minor changes should be well-researched.
42
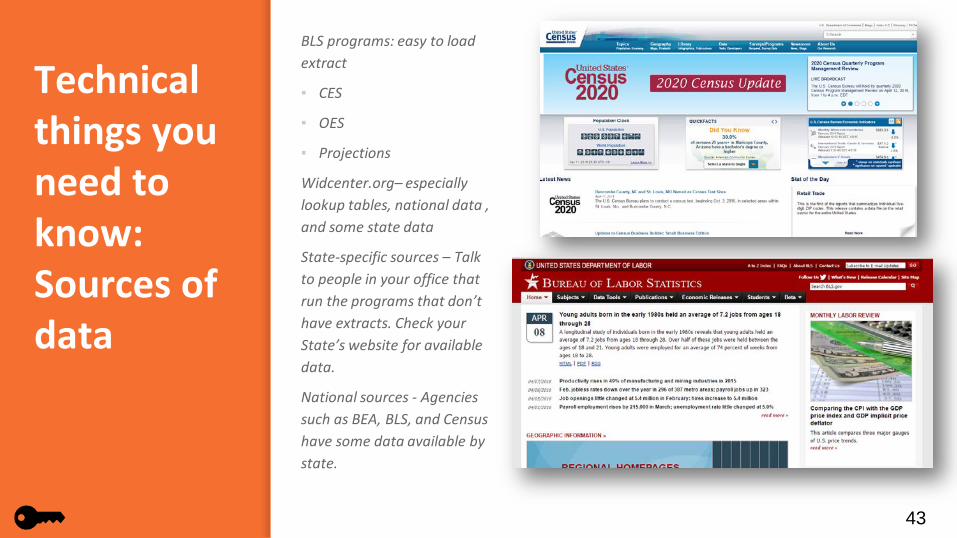
Technical things you need to know: Sources of data
BLS programs: easy to load extract
▪ CES
▪ OES
▪ Projections
Widcenter.org– especially lookup tables, national data , and some state data
State-specific sources – Talk to people in your office that run the programs that don’t have extracts. Check your State’s website for available data.
National sources - Agencies such as BEA, BLS, and Census have some data available by state.
43
WID VersionsALMIS 1.0
WID 2.7
WID 2.4
ALMIS 2.3
ALMIS 2.0 WID 2.5
ALMIS 1.1
ALMIS 2.2WID 2.6
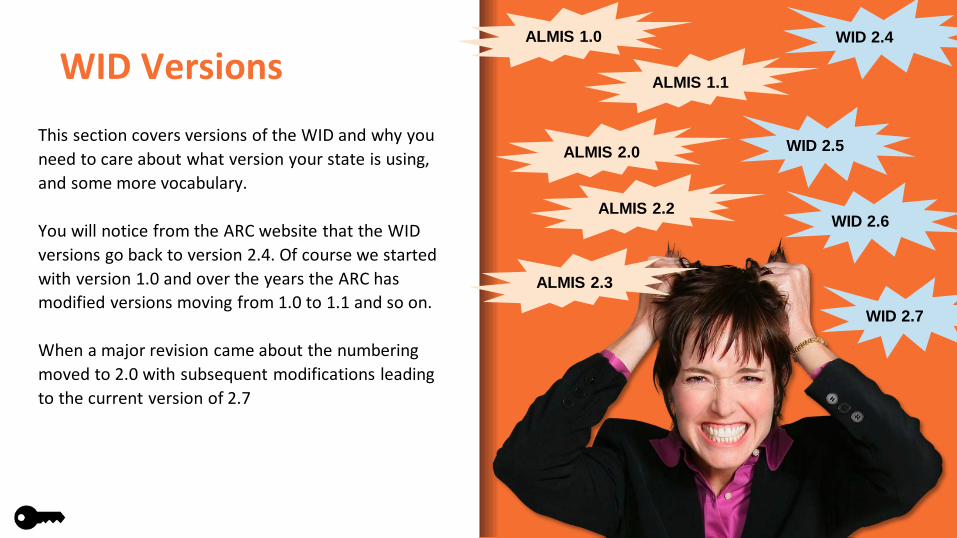
This section covers versions of the WID and why you need to care about what version your state is using, and some more vocabulary.
You will notice from the ARC website that the WID versions go back to version 2.4. Of course we started with version 1.0 and over the years the ARC has modified versions moving from 1.0 to 1.1 and so on.
When a major revision came about the numbering moved to 2.0 with subsequent modifications leading to the current version of 2.7

45
ALMIS 1.0
• 62 look up tables
• 42 data tables• 14 crosswalk
tables• 6
administrative tables
ALMIS 1.1
• 67 look up tables
• 39 data tables• 14 crosswalk
tables• 6
administrative tables
ALMIS 2.0
• 78 look up tables
• 37 data tables• 16 crosswalk
tables• 6
administrative tables
ALMIS 2.1
• 86 look up tables
• 40 data tables• 16 crosswalk
tables• 7
administrative tables
ALMIS 2.2
• 83 look up tables
• 39 data tables• 18 crosswalk
tables• 7
administrative tables
ALMIS 2.3
• 89 look up tables
• 41 data tables• 27 crosswalk
tables• 9
administrative tables
In the beginning there was ALMIS

46
Change from ALMIS to WID
WID 2.4• 98 look up• 51 data• 28 crosswalk• 10
administrative
WID 2.5• 109 look up• 52 data• 43 crosswalk• 10
administrative
WID 2.6• 115 look up• 54 data• 46 crosswalk• 10
administrative
WID 2.7• 111 look up• 54 data• 35 crosswalk• 10
administrative
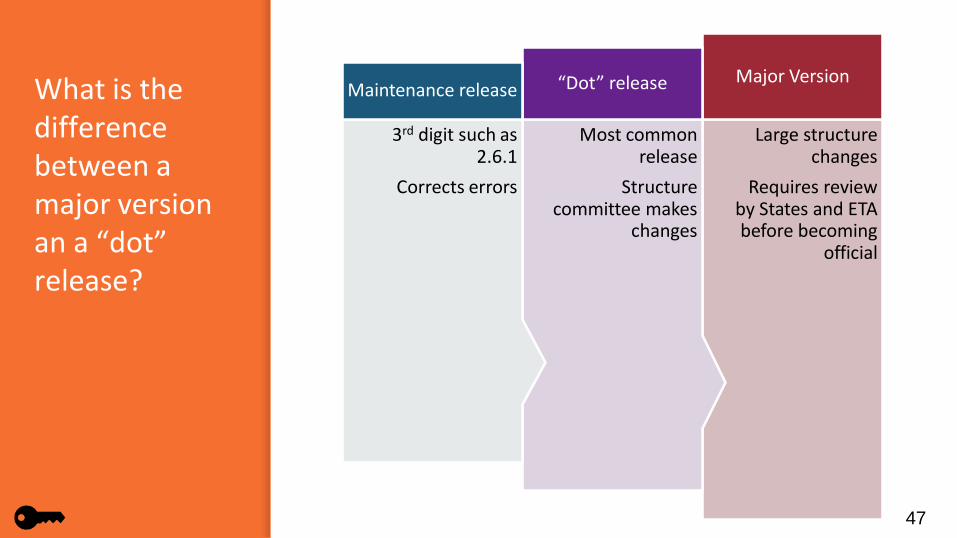
What is the difference between a major version an a “dot” release?
47
Large structure changes
Requires review by States and ETA before becoming
official
Major Version
Most common release
Structure committee makes
changes
“Dot” release
3rd digit such as 2.6.1
Corrects errors
Maintenance release
Incremental changes are easier
48
Big changes all at once can create problems for website developers. Rolling out small changes in the structure helps states control IT costs. Much thought goes into releasing new versions.

Current WID version
49
2.7.1
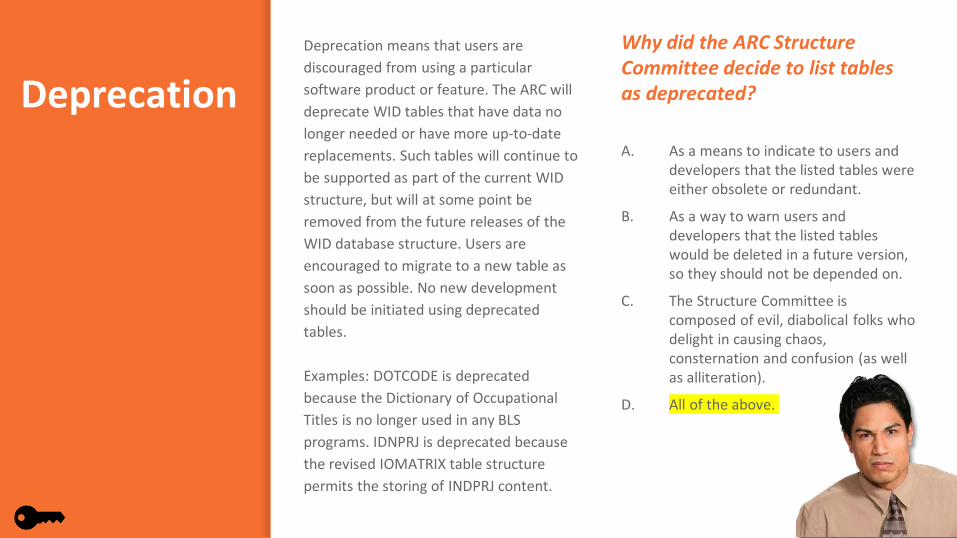
DeprecationDeprecation means that users are discouraged from using a particular software product or feature. The ARC will deprecate WID tables that have data no longer needed or have more up-to-date replacements. Such tables will continue to be supported as part of the current WID structure, but will at some point be removed from the future releases of the WID database structure. Users are encouraged to migrate to a new table as soon as possible. No new development should be initiated using deprecated tables.
Examples: DOTCODE is deprecated because the Dictionary of Occupational Titles is no longer used in any BLS programs. IDNPRJ is deprecated because the revised IOMATRIX table structure permits the storing of INDPRJ content.
50
Why did the ARC Structure Committee decide to list tables as deprecated?
A. As a means to indicate to users and developers that the listed tables were either obsolete or redundant.
B. As a way to warn users and developers that the listed tables would be deleted in a future version, so they should not be depended on.
C. The Structure Committee is composed of evil, diabolical folks who delight in causing chaos, consternation and confusion (as well as alliteration).
D. All of the above.

Deprecation
51
What this does NOT meanThis does not mean that you must stop using the deprecated tables immediately. These tables are still part of the official WID, and are still supported by the ARC
What this does mean: These tables are slated to be deleted in the future (typically 3 versions from time of deprecation), and DBA’s and developers should begin moving to the recommended tables as soon as practical.

Updating to the latest version
Method 1: the GUI method
SQL Server has a GUI that allows you to change tables using a table designer similar to MS Access.
Make a copy of your current ALMIS/WID database, renaming to the latest version
Use the GUI table designer to restructure tables as needed
Note that this assumes that you have an existing WID database. If you don’t, you can use the GUI to create one, but it will be tedious to create the 200+ tables of the WID this way!
52
Method 2: Build scripts
Both SQL Server and Oracle (and other databases) allow you to use code called build scripts to create tables and relationships.
Create a new empty database on your server
Run the build scripts
ARC members do have build scripts for SQL Server, but these are to be used at the your own risk. Neither the ARC nor the Structure Committee guarantee that these will work, nor do we support these scripts.
Caveats:
Both methods assume that you have the permissions needed on your server to execute. If you do not, you’ll have to have your IT folks run the scripts.
For either method, you will need to load data in the order given in Appendix A – Load Order.
Destruction Scripts – if you are really lucky, the build scripts will work the first time. If not, you will need to destroy the resultant database (drop all the tables and relationships). You may want to create a script to do this (unless you’re sure the build script will work on the second try, but see Murphy’s Law.)

The employer database
Employer Database is a privately collected database containing information from over 12 million businesses throughout the country. The ARC is responsible for the procurement and dissemination of the database to states for use in the WID.
A special committee of ARC members and the hosting state (Connecticut) will convene, when needed, and go over the requirements needs and wants, for the employer database and then issue a request for proposal (RFP). Then this same committee will examine all of the proposals, and rate them, make the decision to award the contract to the company that has best met the requirements of the request. The hosting state will then go through the contracting process with the company. The current 2014 contract was awarded to Infogroup and has a term of 3 years with an optional 3 years at a cost of 2.4 million dollars or $400,000 per year. This expense comes from the ARC budget. The database and its updates are provided to the states free of charge.
The database and its updates are provided to the states free of charge. States just need to sign an agreement with the hosting state. Updates to the database are provided twice a year.
Copies of the contract, agreement, and attachment are available on the ARC website
53
The employer database –limitations in the licensing agreement
In the contract with Infogroup there are limitations to the states’ use of the database. Data searches must contain at least a 2 digit NAICS code, and a specified geography, or business description, or occupation.
Another item that has been added to this contract is mapping. You can display a map with an unlimited number of records, showing various symbols along with aggregate data (as long as the display prevents automatic data extraction, such as web scraping, of individual employer information.
54
Data Use
The employer database –limitations in the licensing agreement
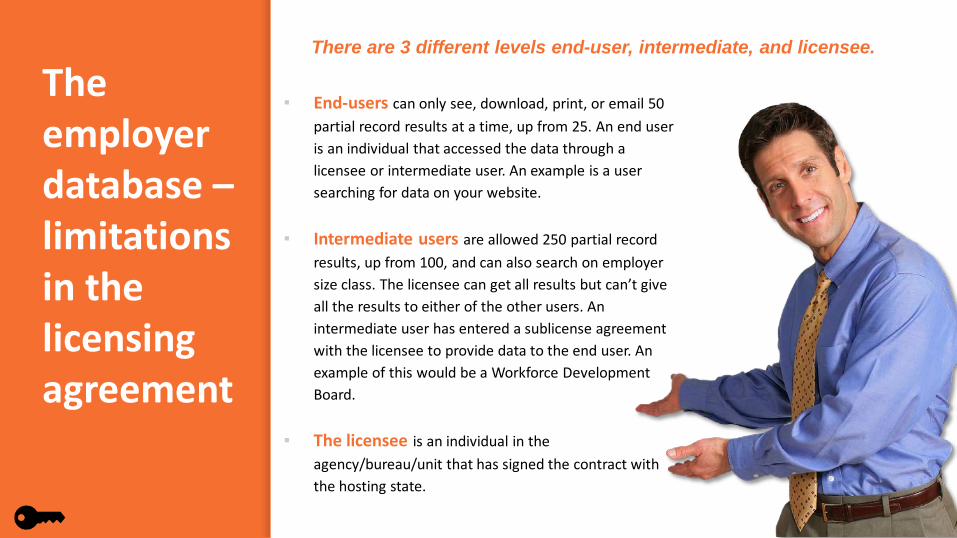
▪ End-users can only see, download, print, or email 50 partial record results at a time, up from 25. An end user is an individual that accessed the data through a licensee or intermediate user. An example is a user searching for data on your website.
▪ Intermediate users are allowed 250 partial record results, up from 100, and can also search on employer size class. The licensee can get all results but can’t give all the results to either of the other users. An intermediate user has entered a sublicense agreement with the licensee to provide data to the end user. An example of this would be a Workforce Development Board.
▪ The licensee is an individual in the agency/bureau/unit that has signed the contract with the hosting state.
55
There are 3 different levels end-user, intermediate, and licensee.

The employer database –API Option from CareerOneStop
Career One Stop is another option for delivering information from the Employer Database. Career One Stop has a contract with Infogroup that is connected to the Live Update site, which is constantly being updated by Infogroup, this allows them to update their information daily if they want; whereas we get the updates twice a year. You can link directly to their website or contact them about using one of their web service api’s. They have a wide selection of web services and are constantly developing more, so it is well worth visiting their site and checking out the developers section.▪ 56
http://careeronestop.org

In this section you will learn who you need to communicate with and the topics/questions that need to be discussed
57
1. Who manages the WID?
2. Questions to ask your IT staff
3. Questions to ask your analysts
4. Who has access to confidential data and what is required of those who do
Communication
Communicating with IT and backup WID DBA
58
When communicating with your IT department you need to have an understanding not only of the terminology/schema of the WID, but the basics for your DBMS and IT’s processes for how they implement change requests.
Each state manages the WID differently
59
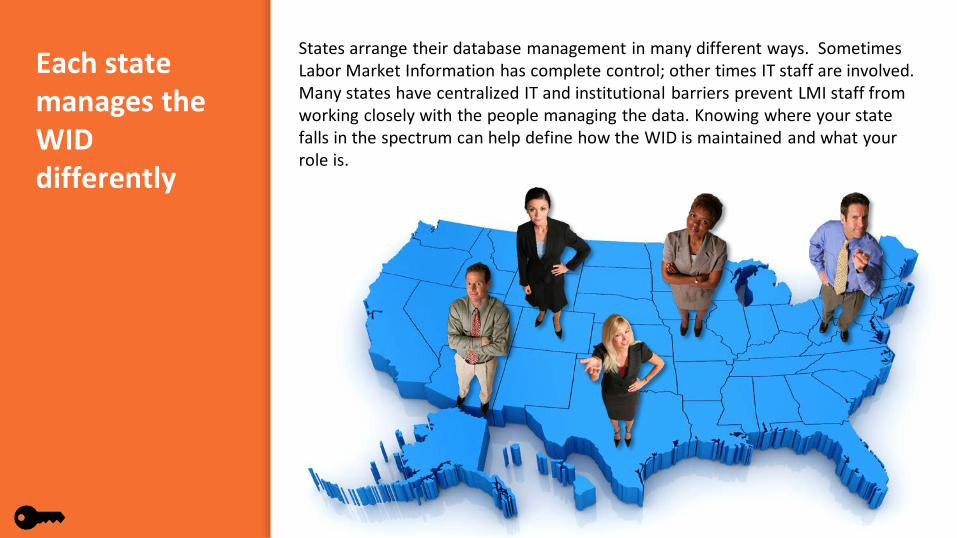
States arrange their database management in many different ways. Sometimes Labor Market Information has complete control; other times IT staff are involved. Many states have centralized IT and institutional barriers prevent LMI staff from working closely with the people managing the data. Knowing where your state falls in the spectrum can help define how the WID is maintained and what your role is.
60
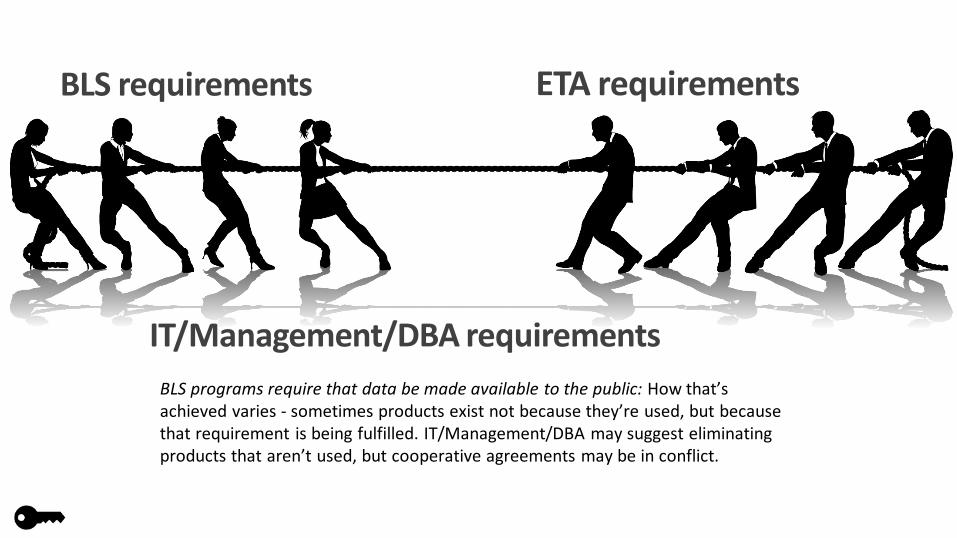
BLS requirements ETA requirements
IT/Management/DBA requirementsBLS programs require that data be made available to the public: How that’s achieved varies - sometimes products exist not because they’re used, but because that requirement is being fulfilled. IT/Management/DBA may suggest eliminating products that aren’t used, but cooperative agreements may be in conflict.
61
There is a balancing act between WID needs and business needs: Sometimes BLS provides a convenient format for data extract, but only after their publication date – if your department releases sooner, that extract does you no good. If web content runs inefficiently on the WID structure or needs additional fields, your department’s needs may be in conflict with the structure.
It’s a balancing act

62
When communicating your needs IT, having the ability to communicate in terminology specific to your DBMS has two benefits.
One, you can tell IT in their terms what you need done.
Two, when IT communicates to you you’ll understand what it is that they are doing.
Questions to ask your IT staff
63
Are you a BLS agent?Per BLS rules, anyone who has access to sensitive data, including IT staff, must be a BLS agent. Depending on how the office is managed, LMI may have assigned IT staff or may have rotating IT staff, and maintaining BLS agent status can get cumbersome if IT are not under the same management as LMI. Understanding what the arrangement is with IT staff can help avoid unintentional lapses.
What are your institution’s policies regarding data access and backups?Some processes are established institution-wide and even a DBA may not have much control over them. Know the policies relating to data backups, security policies on public-facing servers, how user access is assigned or removed, and when and where LMI data may be replicated for the use of other agencies.
How do you bill your time?Is there a contract that covers routine maintenance and inquiries at a set cost, or is it based on hours spent on your projects? The payment structure might dictate interactions with IT.
What maintenance tasks fall to IT and what fall to the LMI shop?This depends a lot on your organization’s structure. IT might produce packages for uploading data and LMI analysts are only able to run them, or they may only work on web tasks or server maintenance.

64
Finally, having a firm understanding of WID terminology and schema allows you to communicate what needs to be done and more importantly why. Being able to communicate why, for example, it is important to have leading zeroes in a field will hopefully keep IT from setting it as a numeric field causing data issues.
We need to maintain leading zeroes
65
It is important to establish a backup WID DBA.
First, and most importantly, is continuity of operations. If you win the lottery and decide to move to Jamaica, someone needs to be able to pick up where you left off and keep the flow of data coming.
66
Second, it gives you someone locally to be able to bounce ideas off of, aid in troubleshooting issues, and to help with communication to IT and upper management.
It’s also important to have regular conversations with your backup. In these conversations you can communicate any changes that have been made, if the ARC has released a WID update, and answer any questions your backup has.

67
Understanding IT’s processes and policies can improve your relationship because you are following their rules. While often cumbersome, these rules are in place to ensure that changes don’t result in utter chaos and protects systems from unnecessary down time
“A data retention policy is a recognized and proven protocol within an organization for retaining information for operational use while ensuring adherence to the laws and regulations concerning them. The objectives of a data retention policy are to keep important information for future use or reference, to organize information so it can be searched and accessed at a later date and to dispose of information that is no longer needed.” Wikipedia, https://en.wikipedia.org/wiki/Data_retention
Many states have very specific data retention policies. Working with your agencies legal staff to ensure you are adhering to these policies is an important and necessary part of your job as the WID DBA.
68
Using development servers and production servers
69
Using development servers and production servers – best practices
Depending on your state’s and LMI unit’s processes and capabilities you may have 3 separate server instances of the WID database, at the least I would advocate for 2 as a best practice. If you are involved in a shop that develops and designs, websites, apps, web services it would be recommended to use a 3 server system. This would give you a development server to use for testing purposes, when you are creating new tables, changing table structures, creating stored procedures, updating the WID. It allows you to have a database to test against when you create apps or services, without having to worry about causing issues with the current database. I know not everyone does development, so you don’t need to have a development server, but you should have the 2 server system with a staging, or test server, and a production server. If possible you should never load data directly to the production server, you should have some type of interface that will update the Production server from the Staging server. This is even more critical in a public-facing data environment, by loading and updating data to the staging server, where it can be reviewed, checked for errors, and resolve any issues before it is accessible to the public. The staging database can also be a back-up in case the public facing server fails. For this reason it is recommended to try and keep them identical, with the exception being any data that shouldn’t be released publicly yet. Be sure that your IT shop is maintaining backups of the servers. It can be labor intensive and time consuming to restore the server. It is easier to be able to restore across servers or switch servers if the one has to be replaced.
Updating the WID and Altering the Structure. When it comes time to update the WID to a new version, one of the first things you should do is check out the change document in the Appendix of the data dictionary. This lists all of the changes in the structure from the previous version. You now have a lot of options on how you are going to update your database. In all cases do not start with your production server, and preferably not the staging server either. Some of your options for updating, you can use alter and create statements to change your current database to the new version. You can write your own script, use someone else’s SQL script to create the new structure, or use the management tool for your database and export the current script and then alter it to conform to the new version. The latest version of the access database provided by the NCSC can be imported in.
70

Permissions
71
IT people hate letting users access the database. The fewer people who can muck around in there, the better for ensuring data quality. In most cases, the majority of LMI people will have read-only access, meaning they can’t change things.
Write access – it can be set up so that a user has permission to run a specific job, or have editing/loading rights on a specific table. This is sometimes done to make sure data can be loaded on schedule by the person who needs to access it.
Admin access – this is needed to change table structure or jobs/packages or views. There are a lot of different ways this can be configured, but it will dictate who makes changes and loads data
BLS programs are older than the database
72
Most of these data products were originally produced in ledgers or on punch cards. New technologies are adopted, but a lot of old ways of doing things are brought forward. As a result, industry standards may have been ignored or adequate documentation may not exist, may be incorrect, or may be outdated. Knowing enough about the internal workings of the database and the processes that run against it so that you can work backwards to determine what is actually happening to produce output is sometimes necessary. Keep documentation up to date and delete outdated files and instructions.
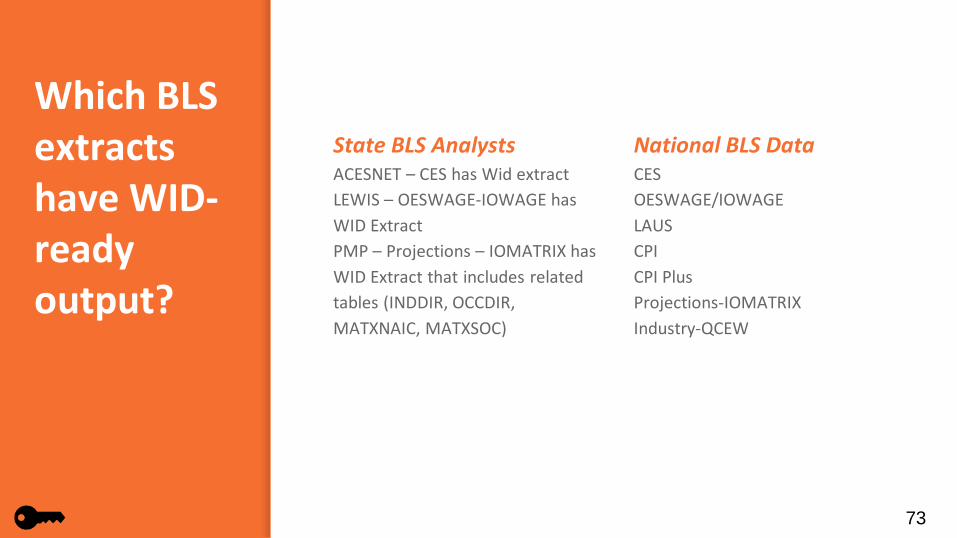
Which BLS extracts have WID-ready output?
73
State BLS AnalystsACESNET – CES has Wid extractLEWIS – OESWAGE-IOWAGE has WID ExtractPMP – Projections – IOMATRIX has WID Extract that includes related tables (INDDIR, OCCDIR, MATXNAIC, MATXSOC)
National BLS DataCESOESWAGE/IOWAGELAUSCPICPI PlusProjections-IOMATRIXIndustry-QCEW
Questions to ask your analysts
74
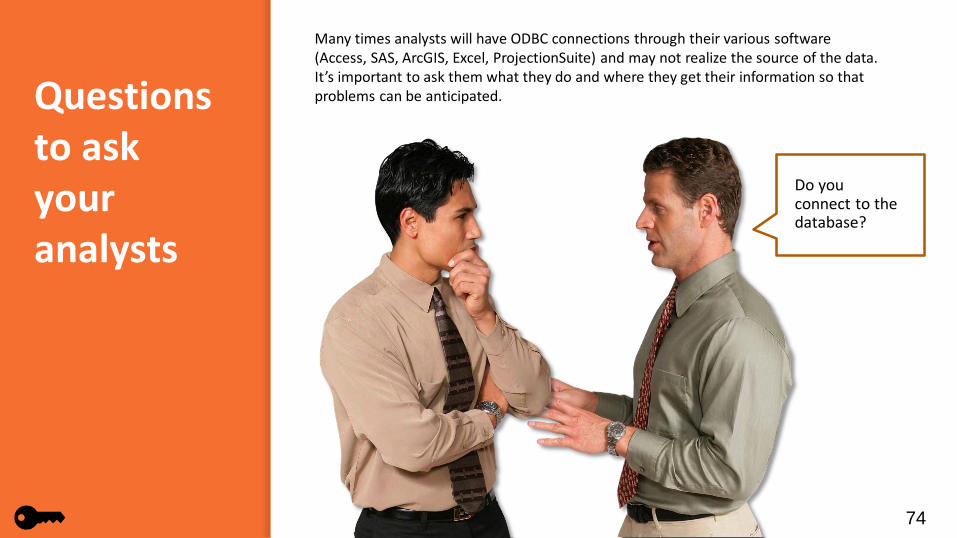
Do you connect to the database?
Many times analysts will have ODBC connections through their various software (Access, SAS, ArcGIS, Excel, ProjectionSuite) and may not realize the source of the data. It’s important to ask them what they do and where they get their information so that problems can be anticipated.
Questions to ask your analysts
75
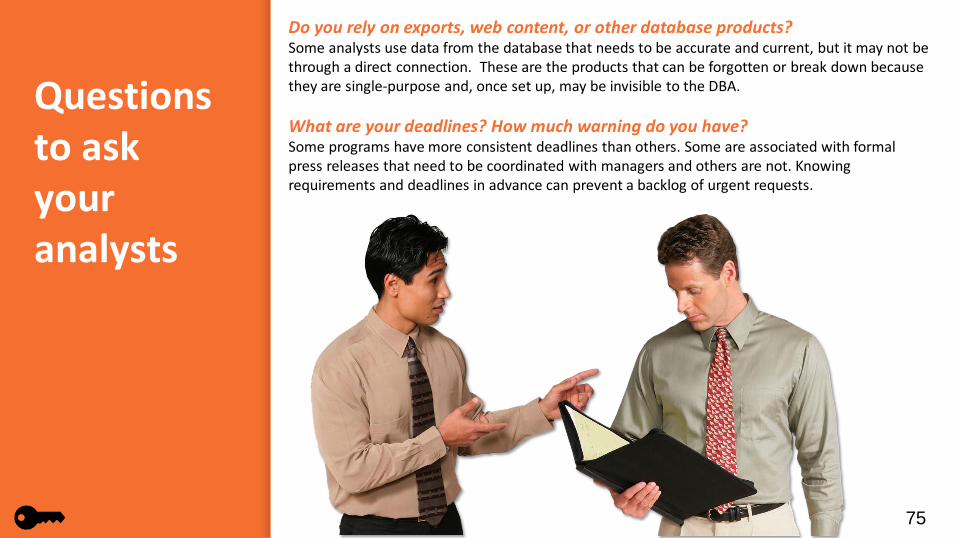
Do you rely on exports, web content, or other database products?Some analysts use data from the database that needs to be accurate and current, but it may not be through a direct connection. These are the products that can be forgotten or break down because they are single-purpose and, once set up, may be invisible to the DBA.
What are your deadlines? How much warning do you have?Some programs have more consistent deadlines than others. Some are associated with formal press releases that need to be coordinated with managers and others are not. Knowing requirements and deadlines in advance can prevent a backlog of urgent requests.

Questions to ask your analysts
76
Who’s the program owner?Knowing who is responsible for a program helps to streamline data checking and verifying sources. If there’s a problem with the upload process, knowing who produced the import file or who knows all the steps that created that file can often be helpful. Sometimes, the DBA is the program owner, especially if the data is produced externally.
Are you assigned to LMI specially or do you rotate projects?LMI has different program requirements than a lot of other government agencies. If IT staff is not familiar with them, LMI staff will have to ensure that requirements are being met in a much more hands-on way. Understanding that dynamic will help to assign responsibilities.
What are the products you’re responsible for? Labor Market Information offices produce products like a website, publications, analysis and extracts for other agencies. Talking to analysts is the best way to find out about minor products and requirements.
Do you run any jobs or packages or otherwise update data in the WID?This can be apparent from the permissions assigned to a user, but it’s good to clarify what people are doing and why.
Are calculations done during the import process or before?Some programs (LAUS, CES) yield a final output and values just need to be checked for accuracy. Other programs may require aggregation, and that may be done as a calculation in the database rather than externally. If calculations are done in the database, the DBA is responsible for the output.
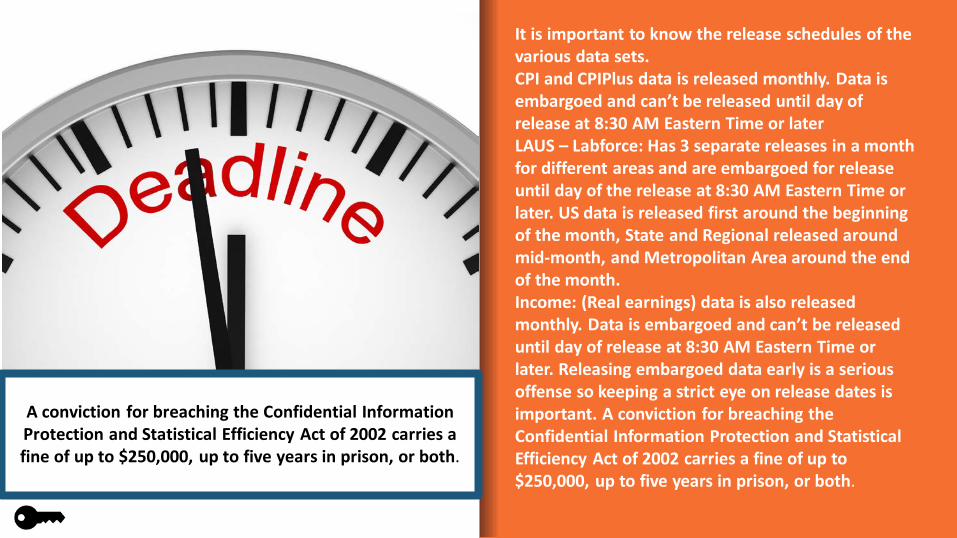
It is important to know the release schedules of the various data sets.CPI and CPIPlus data is released monthly. Data is embargoed and can’t be released until day of release at 8:30 AM Eastern Time or laterLAUS – Labforce: Has 3 separate releases in a month for different areas and are embargoed for release until day of the release at 8:30 AM Eastern Time or later. US data is released first around the beginning of the month, State and Regional released around mid-month, and Metropolitan Area around the end of the month.Income: (Real earnings) data is also released monthly. Data is embargoed and can’t be released until day of release at 8:30 AM Eastern Time or later. Releasing embargoed data early is a serious offense so keeping a strict eye on release dates is important. A conviction for breaching the Confidential Information Protection and Statistical Efficiency Act of 2002 carries a fine of up to $250,000, up to five years in prison, or both.
A conviction for breaching the Confidential Information Protection and Statistical Efficiency Act of 2002 carries a fine of up to $250,000, up to five years in prison, or both.
Who has access to confidential
data?
For the purposes of this exercise we'll say there are two classes of users that could have access to confidential data. Those that use and manage the data and those that manage the servers/computers that house the data.
Those that use and manage the data would be you (the WID DBA), other LMI staff, and any other BLS agents.
Those that manage the servers/computers are your helpdesk, server administrators and in some states database administrators. These users shouldn't actively use or access the data, but there is the chance they may come in contact with it in the course of doing their job.

Data Users and Managers
Must be BLS agents
Must complete BLS training
Must sign the BLS agent agreement

Data Users and Managers
If they have not completed the training or signed the agreement you can do your best soup Nazi impersonation and say, “No data for you!” (remember the accent).

Systems Administrator and Desktop Support
System administrators and desktop support staff must complete the BLS training but do not have to sign an agent agreement so long as an authority within their agency or team has signed Statement of Assurance for Information Security for the State in the Cooperative Agreement. These users should not actively access the data, however, this does protect them should they accidentally come in contact with confidential data in the course or their work.

CIPSEA Compliant Layer
82
Developing views of the data can often be beneficial to the users of the data. They may not fully understand the schema of the WID so providing them with views can help speed up analysis. Especially with commonly asked questions where the same data is pulled over and over.
Another feature that should be leveraged is the stored procedure. Using a stored procedure you can develop code to apply the appropriate suppressions to data and then rerun the code each time you need updated data. Suppression can be extremely difficult so why rewrite the wheel each time you need data. This also comes in handy when you’re exporting data for use in products like Tableau or for publication to the web.
Commercial products often take what you give them so make sure what you give them is properly suppressed data.
In this section you will learn about the WID structure and data dictionary
83
1. Load order
2. Geography
3. Triggers
4. Data dictionary
5. Core tables
6. Primary keys
7. Updating the WID and altering the structure
8. WID Best practices
Deeper into the WID

84
Have you ever gone to a grocery store and watched an inexperienced person bag your groceries? Putting the eggs in the bottom of the bag and putting juice bottles, cans of soup, and other heavy items on top of the eggs leads to disaster. An experienced bagger knows to put the heavy items across the bottom, spread nicely over the base to even out the load, with fragile items waiting until the very last. It is similar to loading data into your WID. The order in which you load data makes a huge difference, and will make the difference between a WID that works and one that doesn’t.
Load order

Load order matters
Practical effect – you cannot load a data table unless the associated lookup tables are loaded first! Hence – Load Order!
85
Recall:
Primary keys maintain data integrity by preventing duplicate records into a table.
Foreign keys maintain data integrity by restricting values such as industry and occupation codes via a lookup table of valid codes.
By following the Load Order, you should have no trouble.
Note though, that if your data has some new codes, you will need to add these to either indcodes or occcodes.

WID and Geography
Labor market data relates to specific places. WID handles geography using a 3-field system:▪ stfips – the US State of the data▪ areatype – the substate area ▪ area - the specific substate area
So for Hartford, CT unemployment:- stfips = 09 State of Connecticut- areatype = 12 Town- area = 000075 City of Hartford
Of course, you can also specify statewide:- stfips = 09 State of Connecticut- areatype = 01 State
To relate smaller geographic areas to larger ones, use the subgeog table.
Ex: You have town data, and want to sum this up to county data. Connecting the data by town code to subgeog will get you the county for each town. You can then summarize by grouping on county to get the county totals.
86
The GeogTable
87
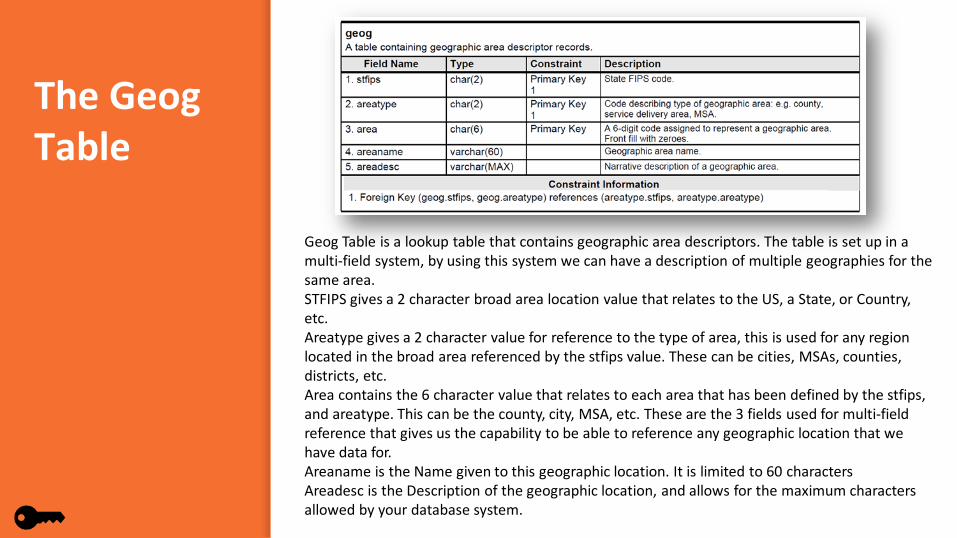
Geog Table is a lookup table that contains geographic area descriptors. The table is set up in a multi-field system, by using this system we can have a description of multiple geographies for the same area. STFIPS gives a 2 character broad area location value that relates to the US, a State, or Country, etc. Areatype gives a 2 character value for reference to the type of area, this is used for any region located in the broad area referenced by the stfips value. These can be cities, MSAs, counties, districts, etc.Area contains the 6 character value that relates to each area that has been defined by the stfips, and areatype. This can be the county, city, MSA, etc. These are the 3 fields used for multi-field reference that gives us the capability to be able to reference any geographic location that we have data for.Areaname is the Name given to this geographic location. It is limited to 60 charactersAreadesc is the Description of the geographic location, and allows for the maximum characters allowed by your database system.
88
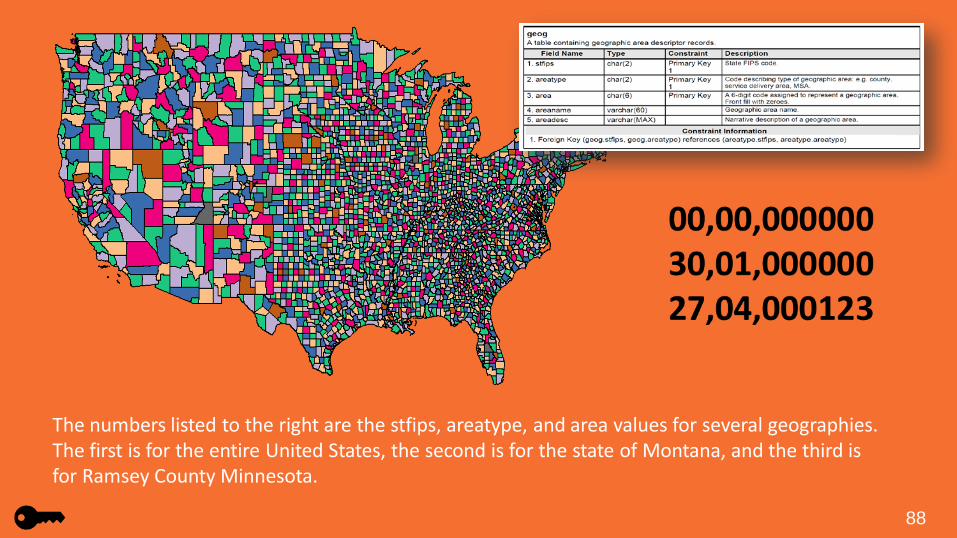
The numbers listed to the right are the stfips, areatype, and area values for several geographies. The first is for the entire United States, the second is for the state of Montana, and the third is for Ramsey County Minnesota.
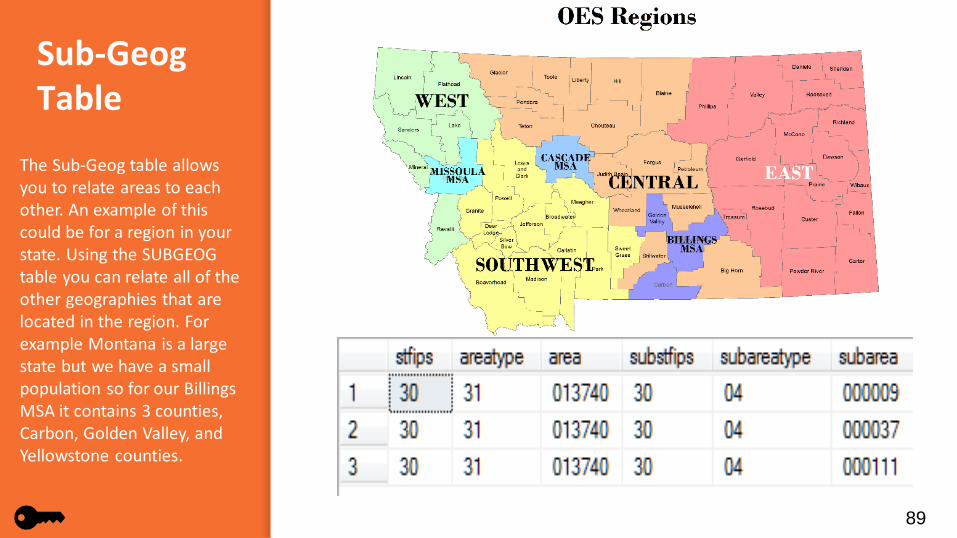
Sub-GeogTable
89
The Sub-Geog table allows you to relate areas to each other. An example of this could be for a region in your state. Using the SUBGEOG table you can relate all of the other geographies that are located in the region. For example Montana is a large state but we have a small population so for our Billings MSA it contains 3 counties, Carbon, Golden Valley, and Yellowstone counties.

Place your screenshot here
Triggers90
If you’ve ever seen a classic Rube Goldberg device, such as the game Mouse Trap or the Honda video on YouTube, this gives you an idea of how fascinating and important triggers are.
Codes in the WID exist in both the indcodes/occodes tables and in their respective lookup tables. These codes are kept in synch with the use of triggers.
Triggers are code that runs when something happens to a table (the triggering event). The events are:
Adding a record
Editing a record
Deleting a record
Whenever you do any of the above to indcodes or occcodes, the associated record in the lookup table is automatically changed.
The most important documentation – the WID Data Dictionary
91
The importance of this document is two-fold, it allows the flexibility to be used in multiple database products, and makes sure that states can compare data, collaborate, and share techniques. The document is broken up into 7 major sections.

Grab your data dictionary and check out each of the seven sections
Section 1The first is the introduction, definitions, and index. It gives a brief introduction about the WID, defines the standards used in the document, and an index of all of table types and their location.
Section 5Section 5 contains the Admin Tables, with their structure and relationships. Admin tables contain information about the database, such as the empdbinf table that contains the version information of the Employer Database or empdb table.
Section 6Section 6 has Field Values. This is a list of standard field values for tables, which allows continuity across all databases so you know if you have an areatype of 01 it means the data is at the state level and 04 is county level.
Section 7Section 7 is the Appendix. It contains the load order document, race/ethnicity notes, deprecated tables list with reasons for deprecation and replacement tables, and finally the change document that lists the changes from the previous version of the database.
Section 2The second section contains the Lookup Tables in alphabetical order and includes their structure and relationships. Lookup tables contain information that describes the types of data such as types of codes, time periods, locations, along with giving you one place to make changes to the data so it will be updated in all related tables.
92
Section 3Section 3 contains the Data Tables, with their structure and relationships. Data tables contain values. For example the cpi table contains values for the state, area and area types, the period by year month and type, the cpi type and source, and then the actual values for the cpi and percent changes by month and year. These values are compared to the appropriate lookup tables and then can return the definition of the value from the lookup table.
Section 4
Section 4 contains the Crosswalk Tables, their structure and relationships. Crosswalk tables are used to relate data of different types. A good example of this is the MOCXSOC table that relates Military Occupation Codes (MOC) to Standard Occupation Classification Codes (SOC).
93
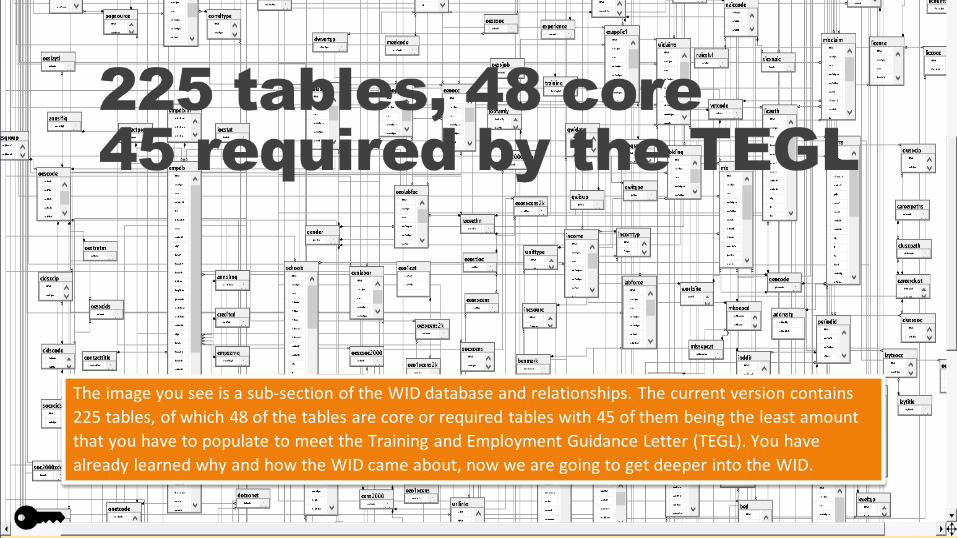
The image you see is a sub-section of the WID database and relationships. The current version contains 225 tables, of which 48 of the tables are core or required tables with 45 of them being the least amount that you have to populate to meet the Training and Employment Guidance Letter (TEGL). You have already learned why and how the WID came about, now we are going to get deeper into the WID.
Core Tables
94
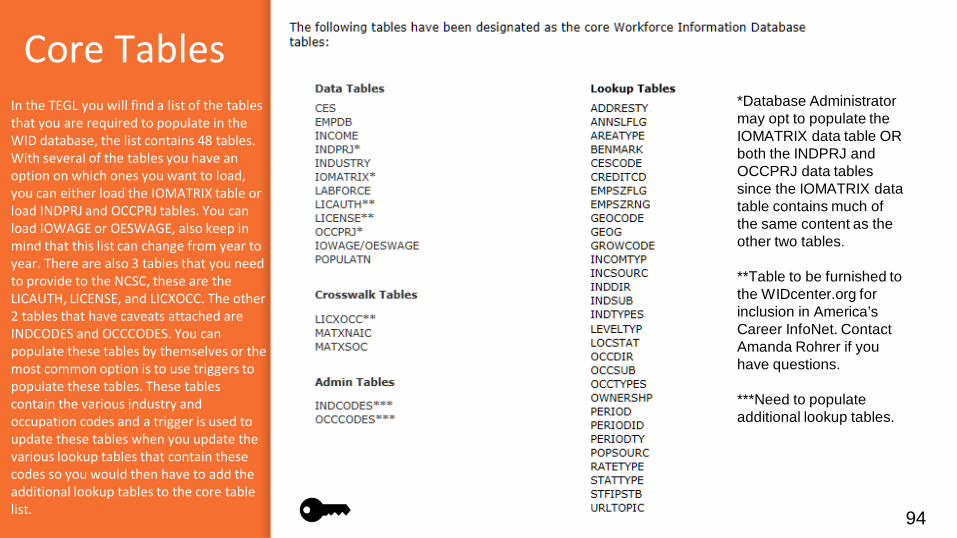
In the TEGL you will find a list of the tables that you are required to populate in the WID database, the list contains 48 tables. With several of the tables you have an option on which ones you want to load, you can either load the IOMATRIX table or load INDPRJ and OCCPRJ tables. You can load IOWAGE or OESWAGE, also keep in mind that this list can change from year to year. There are also 3 tables that you need to provide to the NCSC, these are the LICAUTH, LICENSE, and LICXOCC. The other 2 tables that have caveats attached are INDCODES and OCCCODES. You can populate these tables by themselves or the most common option is to use triggers to populate these tables. These tables contain the various industry and occupation codes and a trigger is used to update these tables when you update the various lookup tables that contain these codes so you would then have to add the additional lookup tables to the core table list.
*Database Administrator may opt to populate the IOMATRIX data table OR both the INDPRJ and OCCPRJ data tables since the IOMATRIX data table contains much of the same content as the other two tables.
**Table to be furnished to the WIDcenter.org for inclusion in America’s Career InfoNet. Contact Amanda Rohrer if you have questions.
***Need to populate additional lookup tables.

Non-defined and/or state-defined tables
95
Non-Defined and/or State-Defined tables were designed to be flexible. Part of this flexibility is that you can add tables and/or fields to tables in your database and relate them to other tables currently in the WID. Admittedly part of this flexibility depends on the amount of control that you have over your database. If you are using a hosted system you will have to go through its process to get tables added or changed in your database. For our terminology a non-defined table is one that has not been added to the WID but has been structured for use with the WID. These tables have been added to a list that can be found on the ARC websites. These tables have been suggested to be included in a future version of the WID. Part of the vetting process to have these tables added to the WID is they have to be currently populated and in use by at least one state, submitted to the ARC Structure committee to be added to the list of non-standard tables, and then at a Structure committee meeting they are brought up for discussion to see if they need further development or voted in for inclusion in the next version of the WID. A state-defined table is also structured for use with the WID and has been added to their WID database for their own purpose. They may later ask to have it included in the non-defined tables if they think that it would be useful to other states. A state-defined table can also be a table that has been modified or added for a hosting system. With Montana's LMInformer system, level fields have been added to occupation code tables with a new code level table that is used in their data search tool.
Primary Keys
96
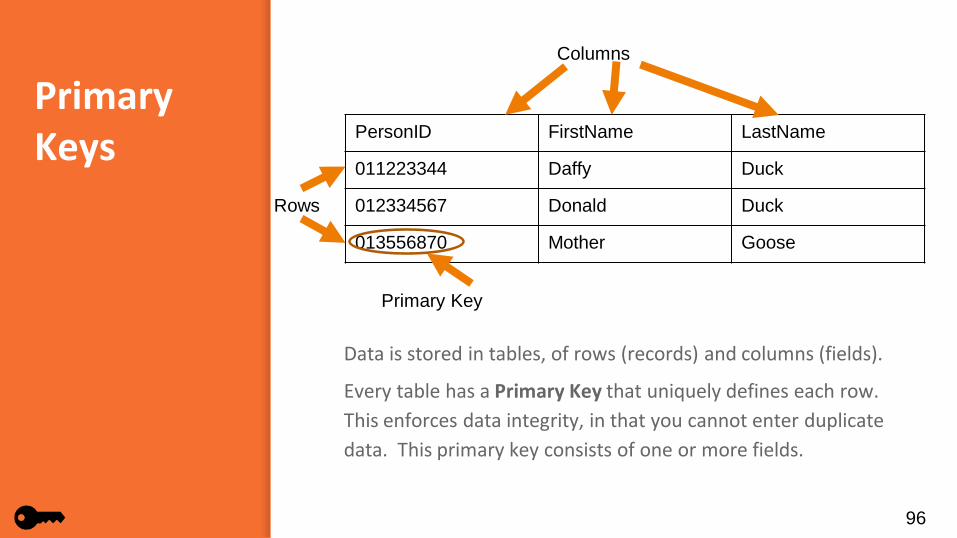
Data is stored in tables, of rows (records) and columns (fields).
Every table has a Primary Key that uniquely defines each row. This enforces data integrity, in that you cannot enter duplicate data. This primary key consists of one or more fields.
PersonID FirstName LastName
011223344 Daffy Duck
012334567 Donald Duck
013556870 Mother Goose
Columns
Primary Key
Rows

Multi-field Primary Keys
97
This is an example of a multi-field primary key (fields in yellow are part of the PK). With this key, a person can show up more than once, as long as that person has wages in a different year/quarter, or with a different employer (or both). In this example, person 011223344 has wages in two different quarters, as well as working for two different employers in the same quarter. Also, employer 000999994 is in the table twice, as two people work for that employer.
Year4 Qtr PersonID EmployerID Wage
2013 1 011223344 000998465 950
2015 4 011223344 000999984 1000
2015 4 011223344 000999994 560
2015 4 012334567 000999994 1200

Databases are relational
98
Recall that in a relational database, tables relate to each other through a common field or fields (the primary key of one relates to the foreign key in another.) Pick any data table, and it will have foreign keys to other tables.
Year4 Qtr PersonID FirstName LastName EmployerID Wage
2013 1 011223344 Daffy Duck 000998465 950
2015 4 011223344 Daffy Duck 000999984 1000
2015 4 011223344 Daffy Duck 000999994 560
2015 4 012334567 Donald Duck 000999994 1200
PersonID FirstName LastName
011223344 Daffy Duck
012334567 Donald Duck
013556870 Mother Goose
Primary Key
Foreign Key
Views
99
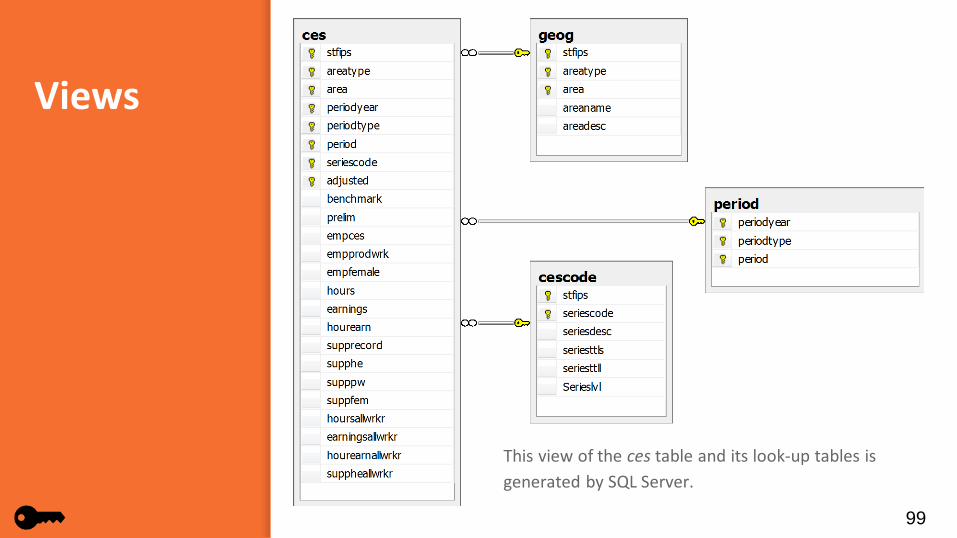
This view of the ces table and its look-up tables is generated by SQL Server.
Normalization
100
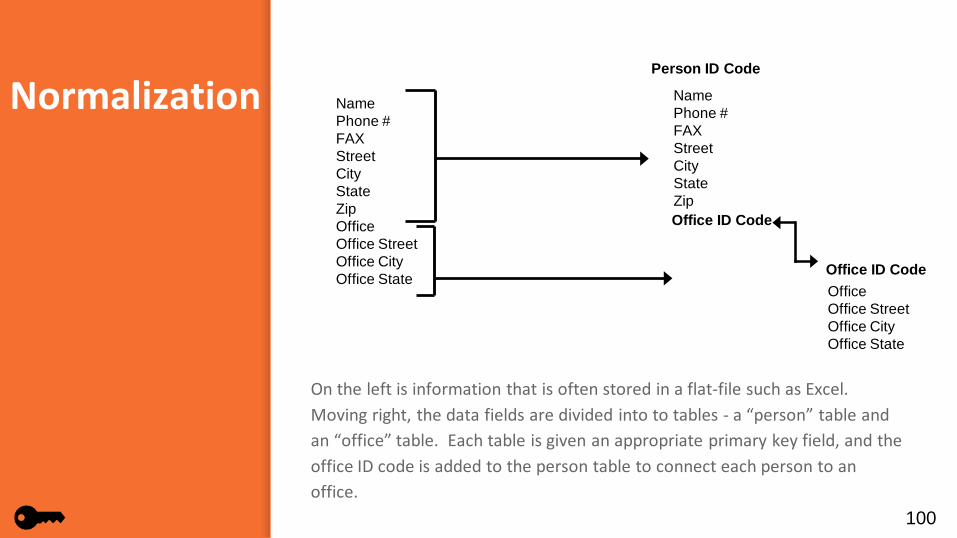
On the left is information that is often stored in a flat-file such as Excel. Moving right, the data fields are divided into to tables - a “person” table and an “office” table. Each table is given an appropriate primary key field, and the office ID code is added to the person table to connect each person to an office.
NamePhone #FAXStreetCityStateZipOfficeOffice StreetOffice CityOffice State
NamePhone #FAXStreetCityStateZip
OfficeOffice StreetOffice CityOffice State
Person ID Code
Office ID Code
Office ID Code

Linked tables enforce data validity
101
Here is the WID table ces, shown with its related look-up tables. Each linked table enforces data validity, as the geography fields, time period fields, and the CES codes are all constrained by the values in their respective look-up tables.

Transforming an Excel table into the WID format
102
The Excel table on the top needs to be transformed into the WID format, below, by adding geography fields based on town name, and also transposing the time periods from horizontal to vertical.
TOWNJan-2015
Feb-2015
Mar-2015
Apr-2015
May-2015
Jun-2015
Andover 0 0 0 0 0 0Ansonia na na na na na naAshford na na na na na naAvon 2 0 1 6 2 3Barkhamsted na na na na na naBeacon Falls na na na na na naBerlin 2 2 3 1 1 1Bethany na na na na na naBethel 3 2 3 7 7 6Bethlehem na na na na na naBloomfield 0 4 0 0 8 2
TownName stfips areatype area periodyear periodtype period unitsAndover 09 12 000001 2015 03 01 0Avon 09 12 000004 2015 03 01 2Berlin 09 12 000007 2015 03 01 2Bethel 09 12 000009 2015 03 01 3Bloomfield 09 12 000011 2015 03 01 0Danbury 09 12 000044 2015 03 01 111

Transforming LAUS data into the WID format
103
The LAUS area crosswalk table is used to assign WID area values to the LAUS areas. This allows transforming the LAUS data into WID format.
Lausarea lausareatitle STFIPS AreaType Area
CN0900100000000 Fairfield County, CT 09 04 000001
CN0900300000000 Hartford County, CT 09 04 000003
CN0900500000000 Litchfield County, CT 09 04 000005
CN0900700000000 Middlesex County, CT 09 04 000007
CN0900900000000 New Haven County, CT 09 04 000009
CN0901100000000 New London County, CT 09 04 000011
CN0901300000000 Tolland County, CT 09 04 000013
CN0901500000000 Windham County, CT 09 04 000015
IM0976450000000 Norwich-New London-Westerly, CT-RI Metropolitan NECTA, CT part
09 10 076450
MT0971950000000 Bridgeport-Stamford-Norwalk, CT Metropolitan NECTA
09 10 071950

Updating the WID and Altering the Structure
When it comes time to update the WID to a new version, one of the first things you should do is check out the change document in the Appendix of the data dictionary. This lists all of the changes in the structure from the previous version. You now have a lot of options on how you are going to update your database. In all cases do not start with your production server, and preferably not the staging server either. Some of your options for updating - you can use alter and create statements to change your current database to the new version. You can write your own script, use someone else’s SQL script to create the new structure, or use the management tool for your database and export the current script and then alter it to conform to the new version. The latest version of the access database provided by the ARC can be imported in.
104
Avoid making changes on staging
Avoid making changes on the production server

105
Document, Document, Document!
Document your code, document your procedures and document any custom features implemented in your WID. Developing standard operating procedures helps everyone have a better understanding of what needs to be accomplished and how to accomplish it.

WID Best Practices
PermissionsLimit access to minimum.Maintaining BLS agent status is easier if direct access is limited to CIPSEA compliant data or to all internal LMI people.
Sometimes having the DBA load data is preferable to giving an analyst permanent write-access to data.
Gear public-facing data to the needs of state partners to limit requests for direct access that may not be maintained.
PublicationsConnect applications as directly as possible to WID standard tables or views.
Tableau and other tools like it can become tough to maintain if they need their data refreshed on schedule – users get confused if different LMI sources have different vintages of data.
Duplicating data in non-standard tables whether for tools or for direct access can needlessly complicate processes.
ProceduresAutomate where possible –this makes replication and troubleshooting easier.
Document everything –procedures, anomalies, records of when things are done – and keep it in the same place (in package as note or attachment, if possible).Other people will thank you if they have to fill in
106
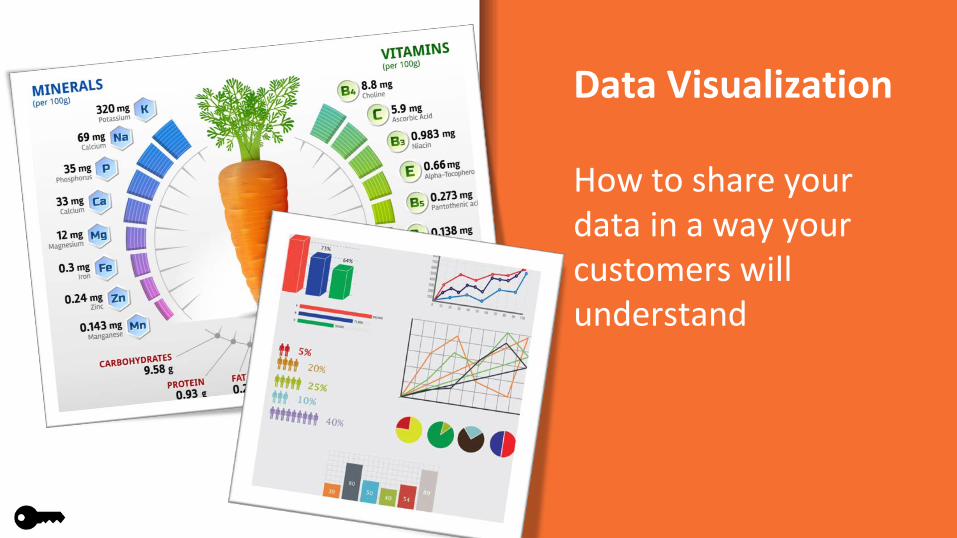
Data Visualization
How to share your data in a way your customers will understand

What is Data Visualization?
108
Data Visualization helps people understand the importance of data by placing it in a visual context.
It is the simplest, most powerful method for analyzing and communicating statistical information
It can be an instrument for reasoning about the information presented.
“
109
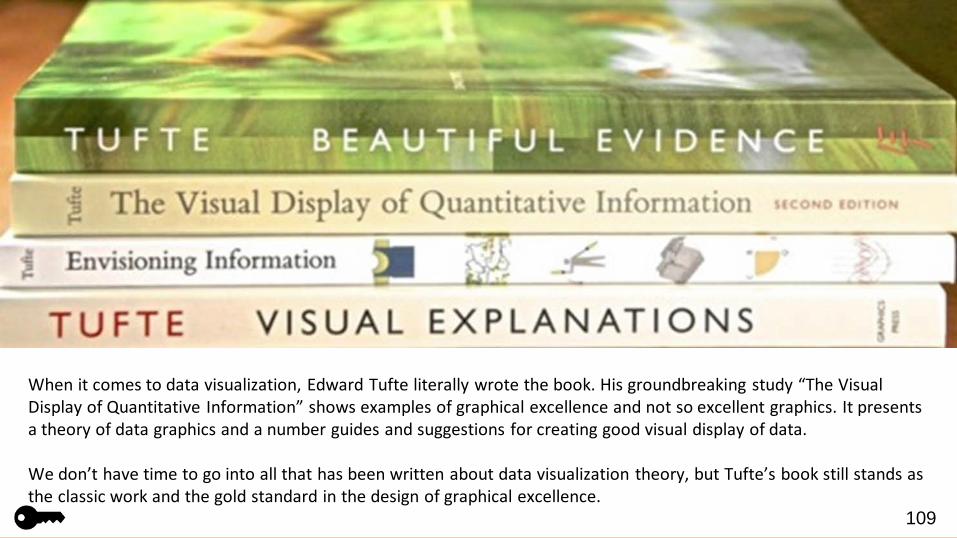
When it comes to data visualization, Edward Tufte literally wrote the book. His groundbreaking study “The Visual Display of Quantitative Information” shows examples of graphical excellence and not so excellent graphics. It presents a theory of data graphics and a number guides and suggestions for creating good visual display of data.
We don’t have time to go into all that has been written about data visualization theory, but Tufte’s book still stands as the classic work and the gold standard in the design of graphical excellence.
How to get the data for data visualizations
110
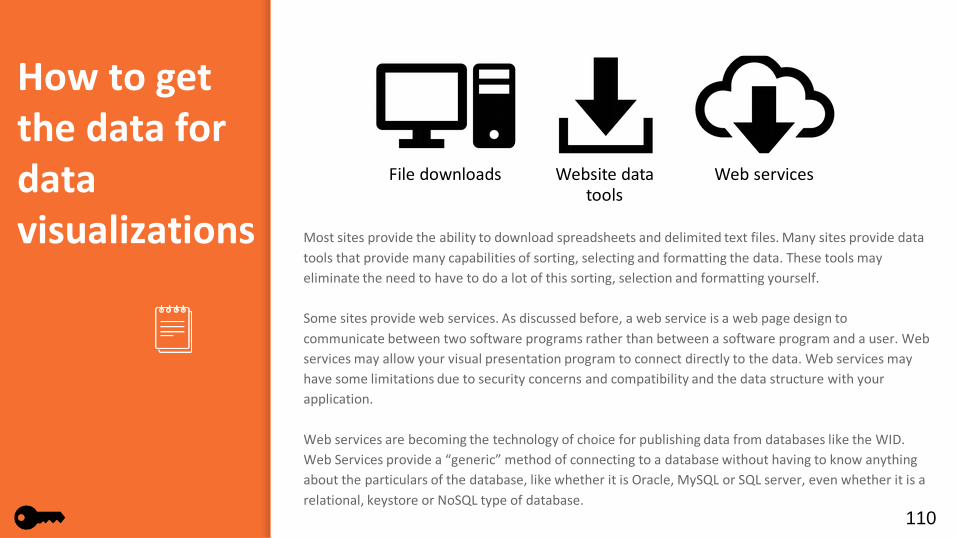
Most sites provide the ability to download spreadsheets and delimited text files. Many sites provide data tools that provide many capabilities of sorting, selecting and formatting the data. These tools may eliminate the need to have to do a lot of this sorting, selection and formatting yourself.
Some sites provide web services. As discussed before, a web service is a web page design to communicate between two software programs rather than between a software program and a user. Web services may allow your visual presentation program to connect directly to the data. Web services may have some limitations due to security concerns and compatibility and the data structure with your application.
Web services are becoming the technology of choice for publishing data from databases like the WID. Web Services provide a “generic” method of connecting to a database without having to know anything about the particulars of the database, like whether it is Oracle, MySQL or SQL server, even whether it is a relational, keystore or NoSQL type of database.
File downloads Website data tools
Web services
Data formatting and structure
111
Data formatting and structure are important, both for the efficient storage and access (searching and querying) of the data and the graphical and tabular presentation of it. What may be advantageous for one purpose may not work as well for another.
As we mentioned previously WID data is stored in tables in a normalized form, with certain standards for encoding geography (FIPS), Occupations (SOC), Industries (NAICS).
Schema matching (transforming values) and aliasing (representing some values with more common names) help to display data in more usable and understandable fashion.
Creating calculated columns (one example we will see are calculated date / timestamp columns) also help to make the data more usable by visualization tools.
Some calculations, notably indexing and logarithmic plotting, help to display different data sets in such a way that they may be more easily compared.

Dimensions and Values
112
All WID data tables contain two different sorts of columns. Dimension columns define characteristics of the data that is being measured. They also form the uniquely identified key of the table. The value (or data measures) columns contain the actual values of what is being measured.
For example: the LABFORCE table contains dimensions for geography (stfips, areatype, area), time (periodyear, periodtype, period) , adjusted (whether the data are seasonally adjusted or not) and prelim (whether the data are preliminary or revised).
The dimensions in the WID refer to a national coding systems such FIPS, SOC, NAICS, etc. When used in presentation graphics these coding systems must be aliased to titles denoting what the codes represent, for example an stfips code of 41 represents Oregon, and an areatype of 03 combined with an area code of ‘000001 represents Baker County in Oregon.
The actual values being measured are the size of the labor force, the number of employed workers, the number of unemployed workers and the unemployment rate. The BENCHMARK notifies the annual estimate level for this particular record. It is not part of the primary key in the WID structure because DBAs seldom retain multiple benchmark levels for a record.
STFIPS
AREATYPE
AREA
PERIODYEAR
PERIODTYPE
PERIOD
ADJUSTED
PRELIM
BENCHMARK
LABORFORCE
EMPLAB
UNEMP
UNEMPRATE
Dimensions (Database Key)
Values (Data measures)
Dimensions and Values
113
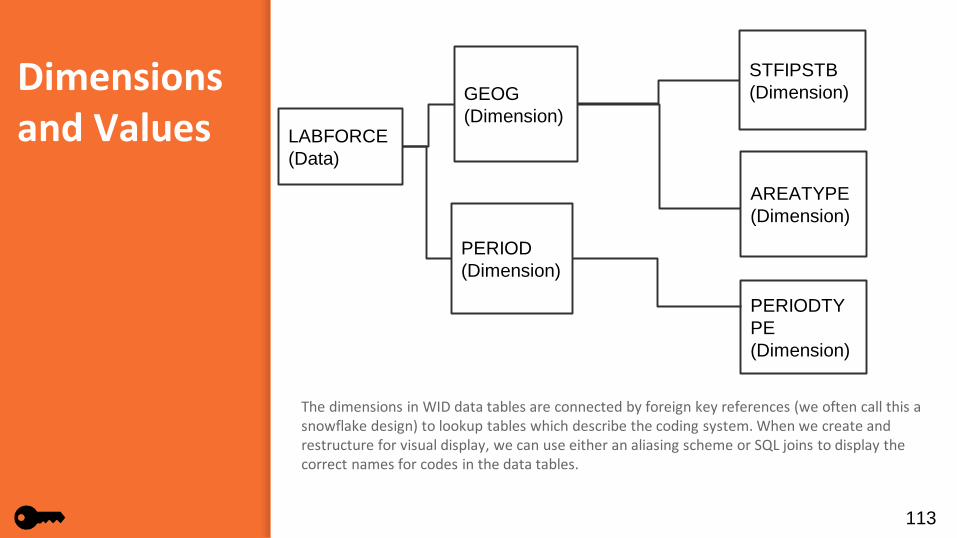
The dimensions in WID data tables are connected by foreign key references (we often call this a snowflake design) to lookup tables which describe the coding system. When we create and restructure for visual display, we can use either an aliasing scheme or SQL joins to display the correct names for codes in the data tables.
LABFORCE(Data)
GEOG(Dimension)
PERIOD(Dimension)
STFIPSTB(Dimension)
AREATYPE(Dimension)
PERIODTYPE(Dimension)
Calculating columns
114
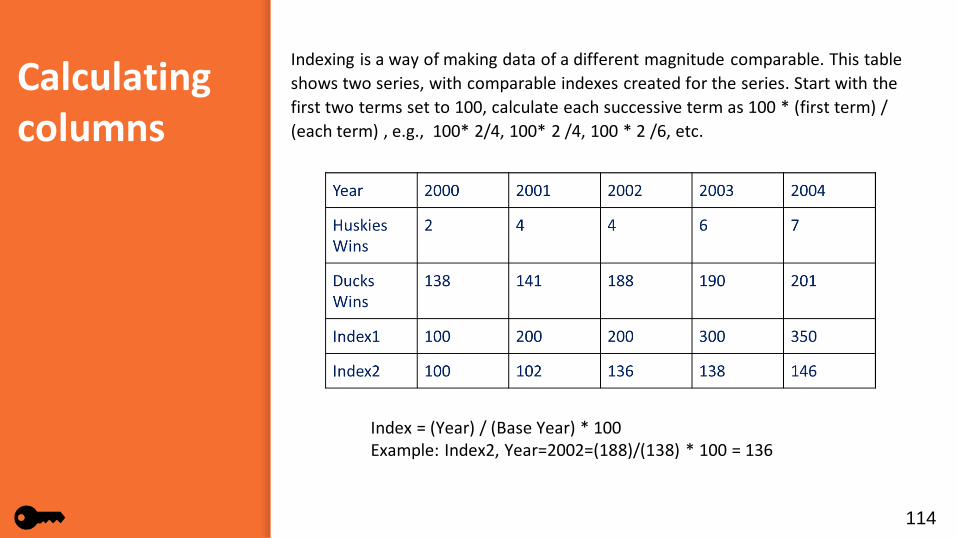
Indexing is a way of making data of a different magnitude comparable. This table shows two series, with comparable indexes created for the series. Start with the first two terms set to 100, calculate each successive term as 100 * (first term) / (each term) , e.g., 100* 2/4, 100* 2 /4, 100 * 2 /6, etc.
Index = (Year) / (Base Year) * 100Example: Index2, Year=2002=(188)/(138) * 100 = 136

115
Note the difference in comparison in plotting the indexed data. This shows that while the Huskies had fewer wins overall they were a much improved team.
Before indexing After indexing

116
Similar to an index plot, plotting data on a logarithmic axis provides for comparing data of very different magnitude. But unlike an indexed plot, it is used in cases where one wants to compare the actual data values.
Before indexing After indexing
Data quality and integrity
117
Many data in the WID are taken from surveys and are initially published in a preliminary status. They are later revised as more accurate survey data become available. Be sure to indicate that data are preliminary where appropriate and ensure that the revised data gets updated when they become available.
Series breaks describe a change in the classification, definition or source of a data point over time. Series breaks need to be documented so that they are not misinterpreted as trends in the data.
Outliers are data points that fall outside the expected norm of the data set being examined. If they are legitimate they may be a valuable source of information. If not, they may be either noise, or worse, data entry or processing errors.
Tableau
118
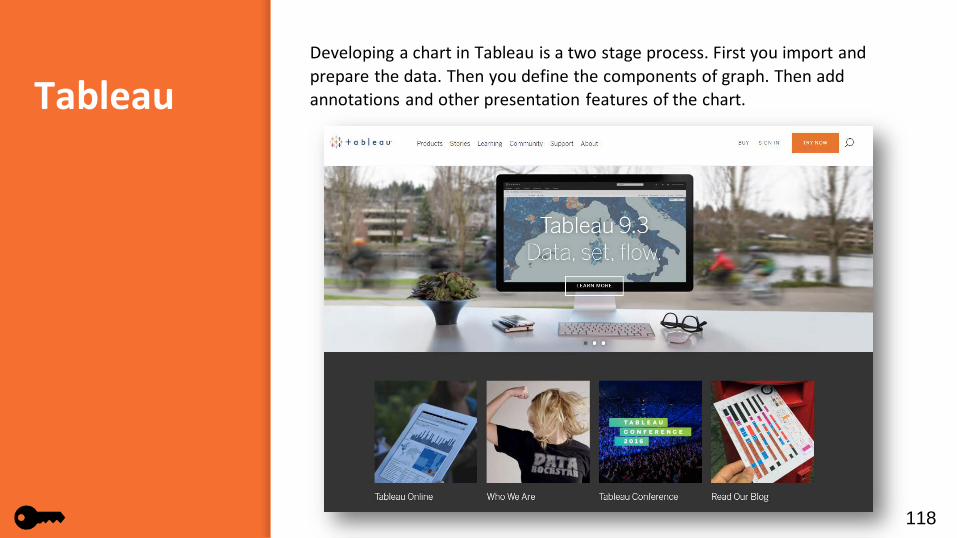
Developing a chart in Tableau is a two stage process. First you import and prepare the data. Then you define the components of graph. Then add annotations and other presentation features of the chart.
Google visualization
119
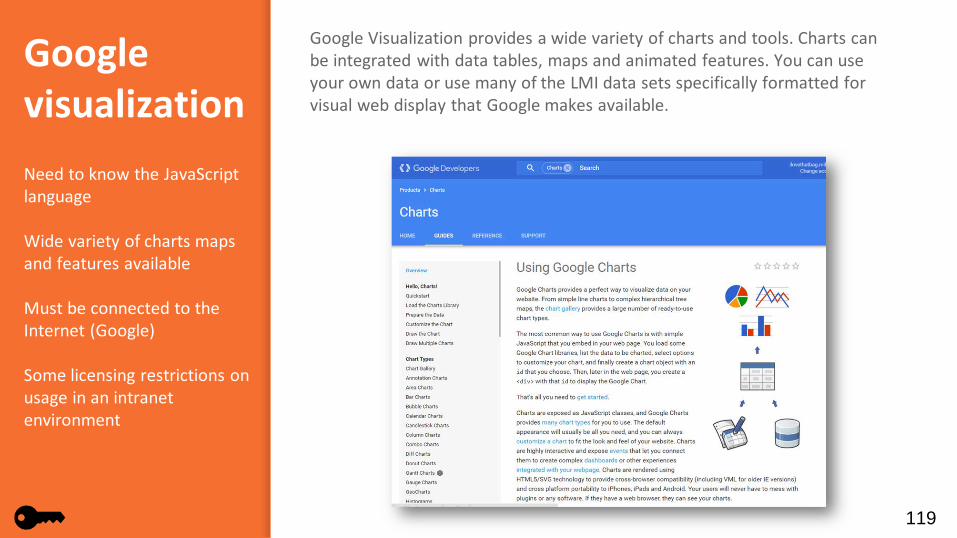
Google Visualization provides a wide variety of charts and tools. Charts can be integrated with data tables, maps and animated features. You can use your own data or use many of the LMI data sets specifically formatted for visual web display that Google makes available.
Need to know the JavaScript language
Wide variety of charts maps and features available
Must be connected to the Internet (Google)
Some licensing restrictions on usage in an intranet environment
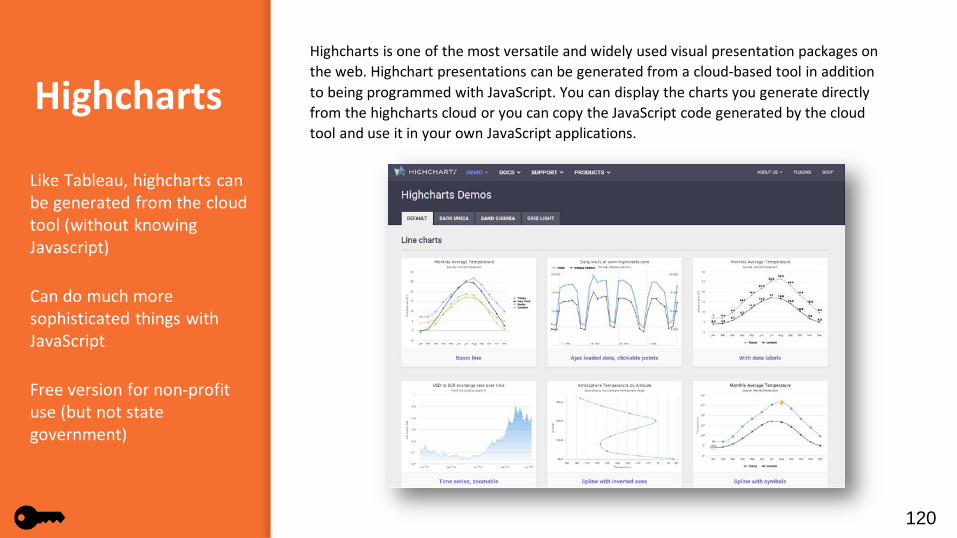
Highcharts
120
Highcharts is one of the most versatile and widely used visual presentation packages on the web. Highchart presentations can be generated from a cloud-based tool in addition to being programmed with JavaScript. You can display the charts you generate directly from the highcharts cloud or you can copy the JavaScript code generated by the cloud tool and use it in your own JavaScript applications.
Like Tableau, highcharts can be generated from the cloud tool (without knowing Javascript)
Can do much more sophisticated things with JavaScript
Free version for non-profit use (but not state government)
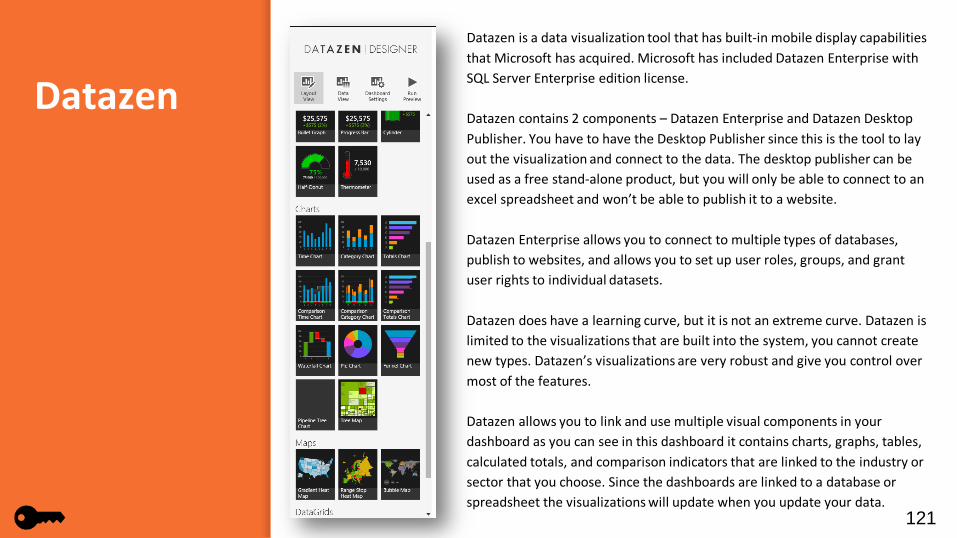
Datazen
121
Datazen is a data visualization tool that has built-in mobile display capabilities that Microsoft has acquired. Microsoft has included Datazen Enterprise with SQL Server Enterprise edition license.
Datazen contains 2 components – Datazen Enterprise and Datazen Desktop Publisher. You have to have the Desktop Publisher since this is the tool to lay out the visualization and connect to the data. The desktop publisher can be used as a free stand-alone product, but you will only be able to connect to an excel spreadsheet and won’t be able to publish it to a website.
Datazen Enterprise allows you to connect to multiple types of databases, publish to websites, and allows you to set up user roles, groups, and grant user rights to individual datasets.
Datazen does have a learning curve, but it is not an extreme curve. Datazen is limited to the visualizations that are built into the system, you cannot create new types. Datazen’s visualizations are very robust and give you control over most of the features.
Datazen allows you to link and use multiple visual components in your dashboard as you can see in this dashboard it contains charts, graphs, tables, calculated totals, and comparison indicators that are linked to the industry or sector that you choose. Since the dashboards are linked to a database or spreadsheet the visualizations will update when you update your data.