Embed Size (px)
Citation preview

Why Multidimensional Poverty
Measures?

Most people are other people. Their thoughts are
someone else's opinions, their lives a mimicry,
their passions a quotation.
~Oscar Wilde, De Profundis, 1905

Why the new emphasis on measurement?
1) More and better data becoming available
2) More Measures being developed
3) 2010 HDR measures sparked interest and debate
4) Technical resources do not reflect Human
Development measures
5) Political space is opening; demand increasing
6) Income poverty: important but incomplete.

1. Relevant Data are Increasing
• Since 1985, the multi-topic household survey
data has increased in frequency and coverage.
• Even greater breathtaking increases have
occurred with income and expenditure data.
• Technology exists to process these data.

1. Relevant Data are Increasing
2. Multidimensional Measures are
exploding
• Bandura (2006) found that over 50% of
composite (multidimensional) indices had
been developed since 2001; now is greater.
• Examples: Doing Business Index,
Governance, Global Peace Index, Quality of
Life Indices, Multidimensional Poverty
Indices, SIGI, CGD Index.

3. 2010 HDR
sparked debate
• HDI: Blogs and Lets Talk
HD
• MPI: Blogs and papers
• Governments: what data?
Our voice?
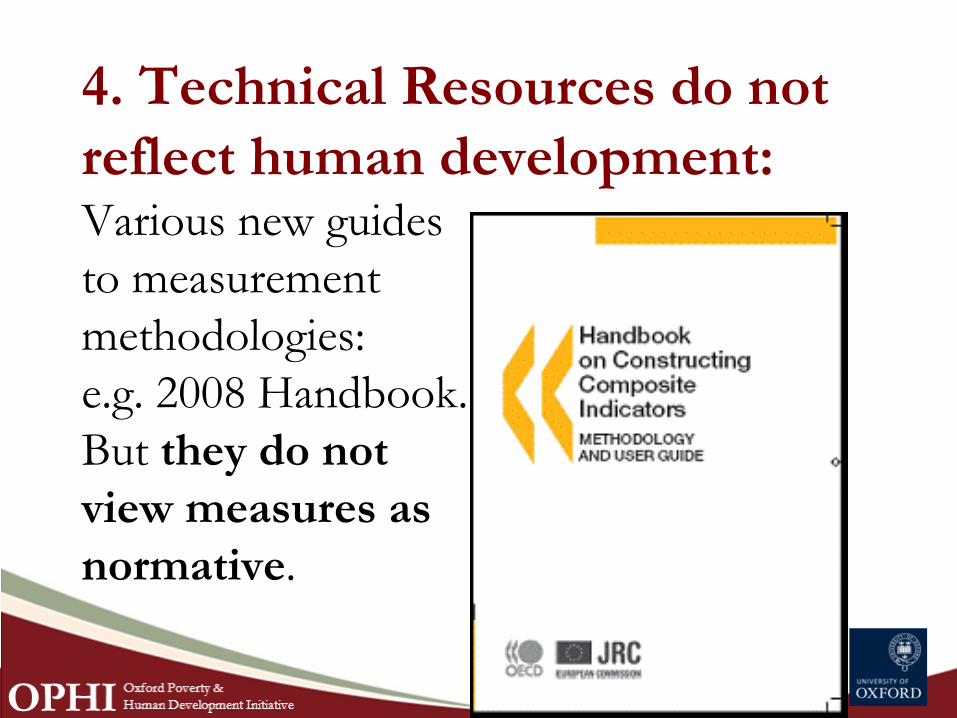
4. Technical Resources do not
reflect human development: Various new guides
to measurement
methodologies:
e.g. 2008 Handbook.\
But they do not
view measures as
normative.

5. Political space is opening;
demand increases
• Basic need: to distill information
• Governments demand – and use – new
measures
• Financial Crisis was not predicted
• Sarkozy Commission: Stiglitz Sen Fitoussi
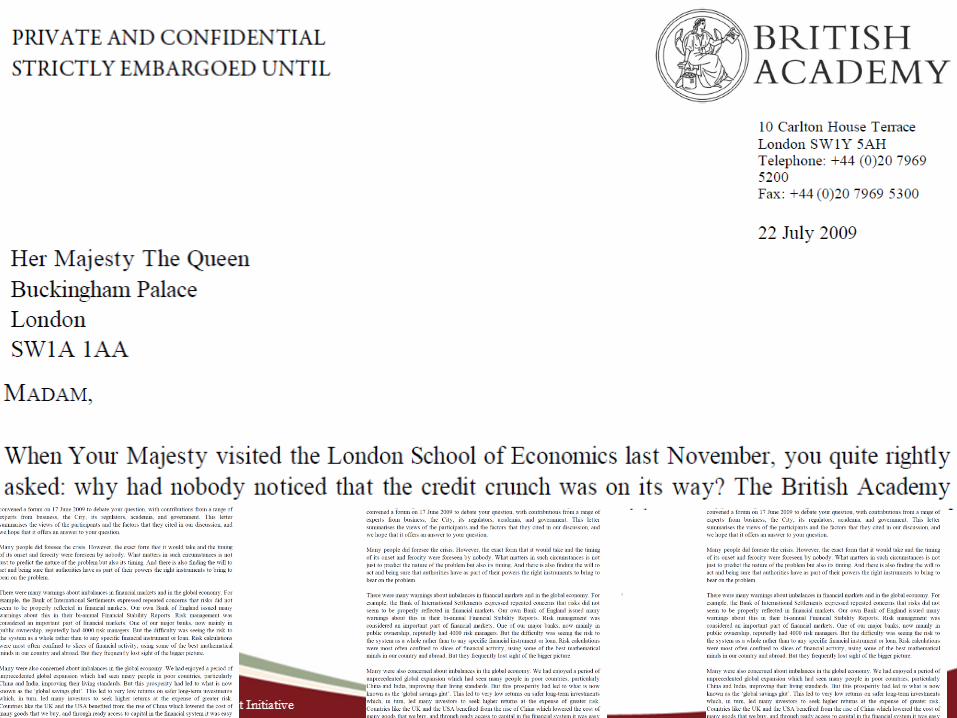

“principally a failure
of the collective
imagination”

European Economic Association
Presidential Address
the giants of our
profession… straddled
many areas of our
subject.
As such their judgments
were founded on a range
of insights and
observations.
Nicholas Stern

• “We are almost blind
when the metrics on
which action is based are
ill-designed or when they
are not well understood.
For many purposes, we
need better metrics.”
Stiglitz Sen Fitoussi: Commission on the
Measurement of Economic Performance and Social
Progress: www.stiglitz-sen-fitoussi.fr
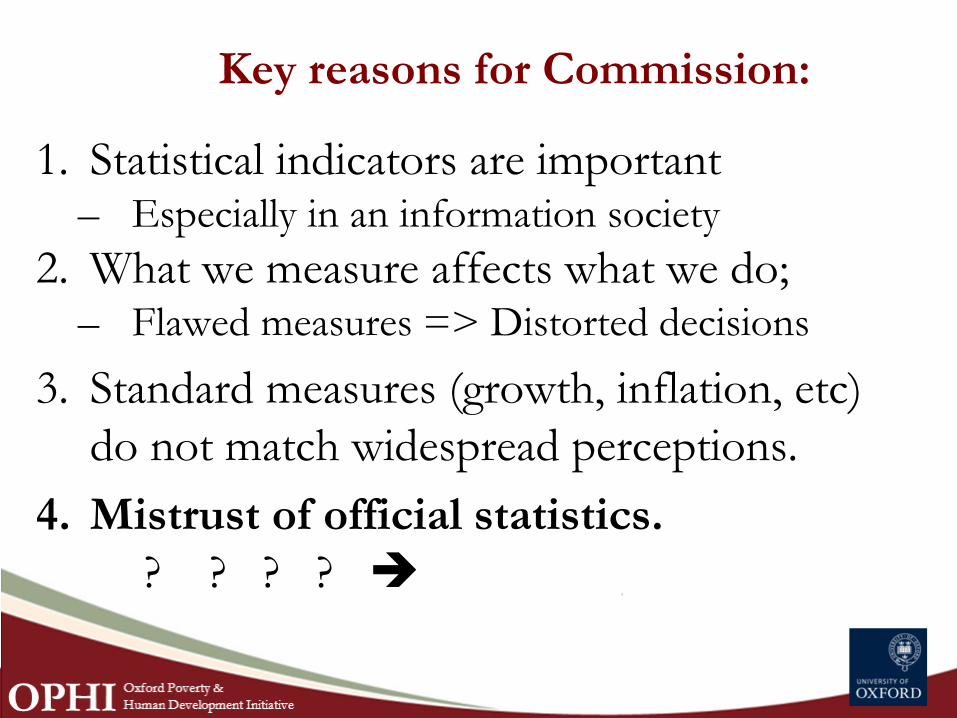
1. Statistical indicators are important – Especially in an information society
2. What we measure affects what we do; – Flawed measures => Distorted decisions
3. Standard measures (growth, inflation, etc)
do not match widespread perceptions.
4. Mistrust of official statistics.
? ? ? ?
Key reasons for Commission:
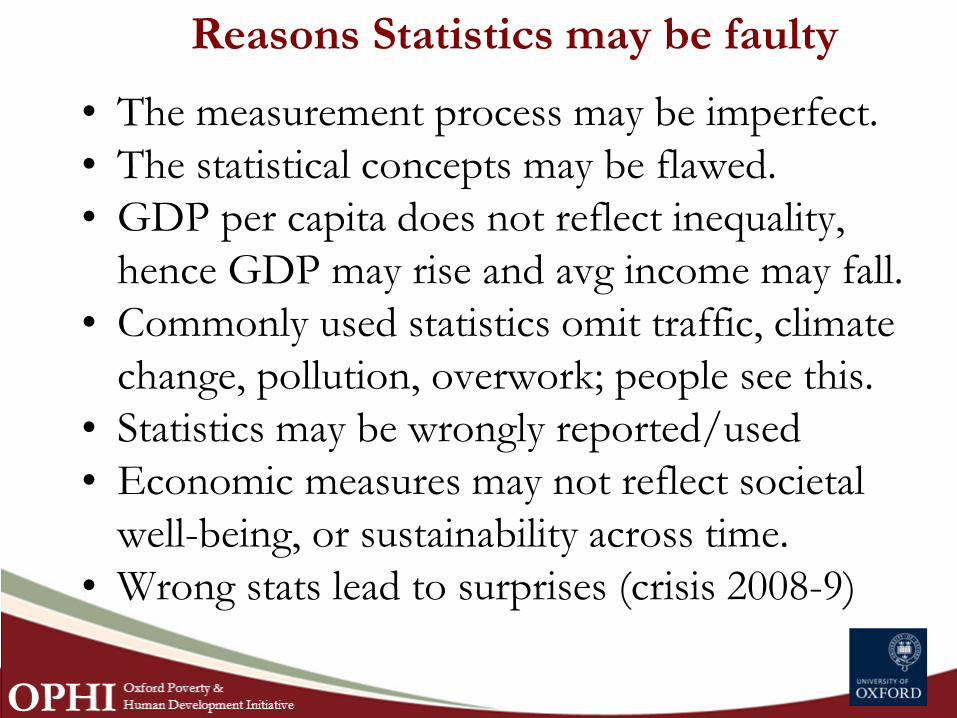
• The measurement process may be imperfect.
• The statistical concepts may be flawed.
• GDP per capita does not reflect inequality,
hence GDP may rise and avg income may fall.
• Commonly used statistics omit traffic, climate
change, pollution, overwork; people see this.
• Statistics may be wrongly reported/used
• Economic measures may not reflect societal
well-being, or sustainability across time.
• Wrong stats lead to surprises (crisis 2008-9)
Reasons Statistics may be faulty

• “those attempting to guide the economy
and our societies are like pilots trying to
steering a course without a reliable
compass. The decisions they (and we as
individual citizens) make depend on what
we measure, how good our measurements
are and how well our measures are
understood. We are almost blind …
The Commission‟s Consensus (p 9)
1. Classical GDP issues
2. Quality of life
3. Sustainability
Commission‟s Working Groups:

„It has to be as vulgar as
GDP/capita
− but better.‟
Amartya Sen, recalling Mahbub ul
Haq‟s insistent aims for the HDI.
Global measures: limited yet key

• European Commission‟s Communication on “GDP and Beyond: Measuring Progress in a Changing World”.
• OECD Framework to measure progress.
• CMESP‟s Report.
• G20 Communique.
• III OECD World Forum.
• OECD Roadmap.
2009: A good year for measuring well-being

6. Why Multidimensional Poverty?
Income poverty is incomplete
Mismatches between
income poverty and
deprivations in
education and nutrition.
Education
Nutrition/health
Children
Adults
Children
Adults
deprived in
functionings but not
income/expenditure
India
43%
60%
53%
63%
Perú
32%
37%
21%
55%
income/expenditure
poor persons who are
not deprived in
functionings
India
65%
38%
53%
91%
Perú
93%
73%
66%
94%
Source: Franco et al. (2002) cited in Ruggieri-Laderchi, Saith and Stewart.

Source: Whelan Layte Maitre 2004 Understanding the Mismatch between Income Poverty & Deprivation
6. Why Multidimensional Poverty?
Income poverty is incomplete

Sometimes You Don‟t Need to
Get Every Detail Right
It deosn‟t mttaer in what oredr the
ltteers in a wrod are, the olny
iprmoetnt tihng is that frist and lsat
ltteer is at the rghit pclae. The rset can
be a toatl mses and you can still raed it
wouthit porbelm. This is bcuseae we
do not raed ervey lteter by itslef but
the wrod as a wlohe.
Why multidimensional poverty
measures?
• Because poverty is a multidimensional
phenomenon!
• Yes, but…This is a necessary yet insufficient
justification for MD poverty measures.
•We are going to justify the use of MD poverty
measures by looking at how these measures
respond to two crucial challenges.
Two major challenges to
multidimensional poverty measures
1. Money-metric poverty (e.g. 1.25 US$ a day) is
already multidimensional, it is based on
consumer theory, its embedded trade-offs are
transparent. Certainly it can be improved, but
why replace it?
2. Ok, I do not like monetary poverty either,
but why a composite index? Let‟s apply a
dashboard approach!

1. Monetary poverty is
multidimensional • Yes, poverty is multidimensional.
• But Sen never said we should
construct an index of deprivations.
• Monetary poverty works in
“attainment space”: you add the
value of the amounts of goods you
consume, and compare against a
poverty line.
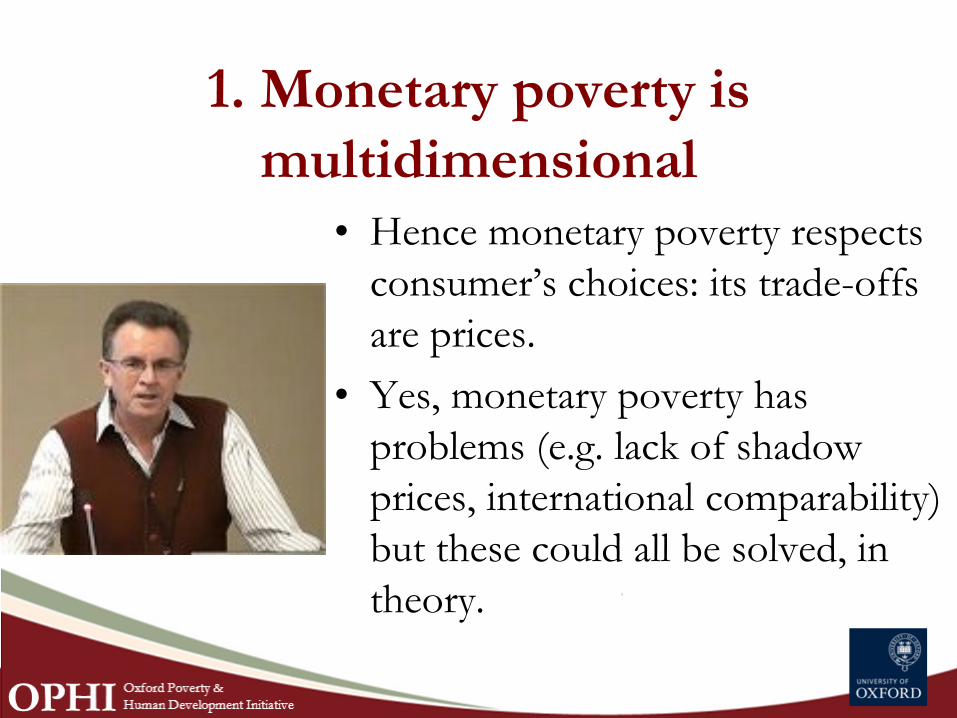
1. Monetary poverty is
multidimensional • Hence monetary poverty respects
consumer‟s choices: its trade-offs
are prices.
• Yes, monetary poverty has
problems (e.g. lack of shadow
prices, international comparability)
but these could all be solved, in
theory.
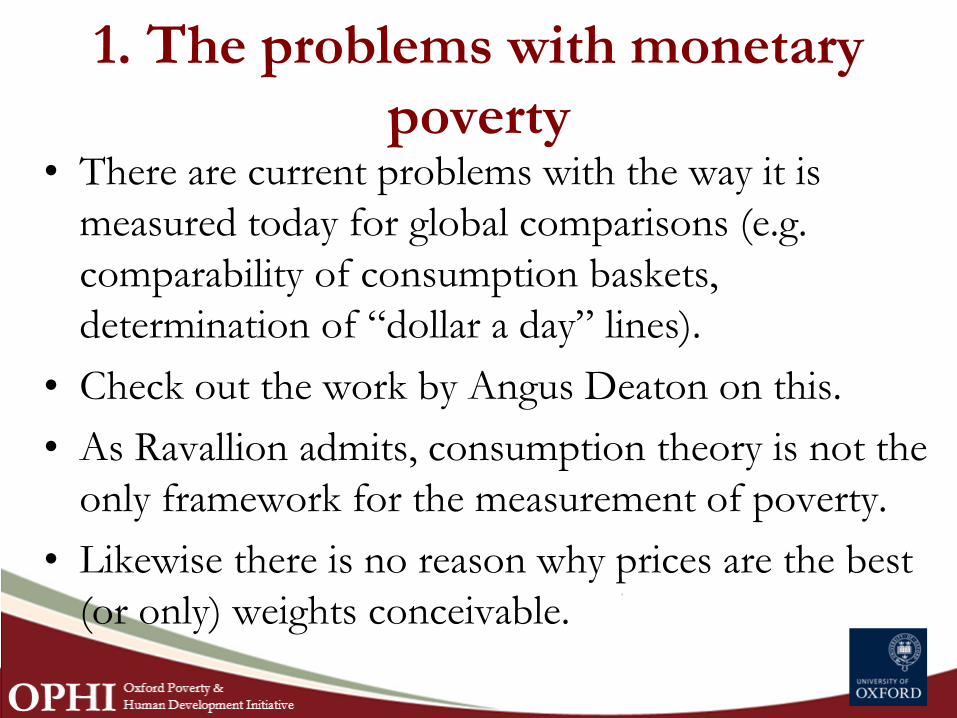
• There are current problems with the way it is
measured today for global comparisons (e.g.
comparability of consumption baskets,
determination of “dollar a day” lines).
• Check out the work by Angus Deaton on this.
• As Ravallion admits, consumption theory is not the
only framework for the measurement of poverty.
• Likewise there is no reason why prices are the best
(or only) weights conceivable.
1. The problems with monetary
poverty

• Another problem (maybe the most important one) is
that monetary poverty does not understand poverty as
capability deprivation.
• Monetary poverty does not give any importance to
specific deprivations.
• It implies perfect substitutability between items,
through relative prices.
• This can be fine in some circumstances (e.g. “broccoli
deprivation”???). But not in others where such perfect
substitution is ethically problematic.
1. The problems with monetary poverty
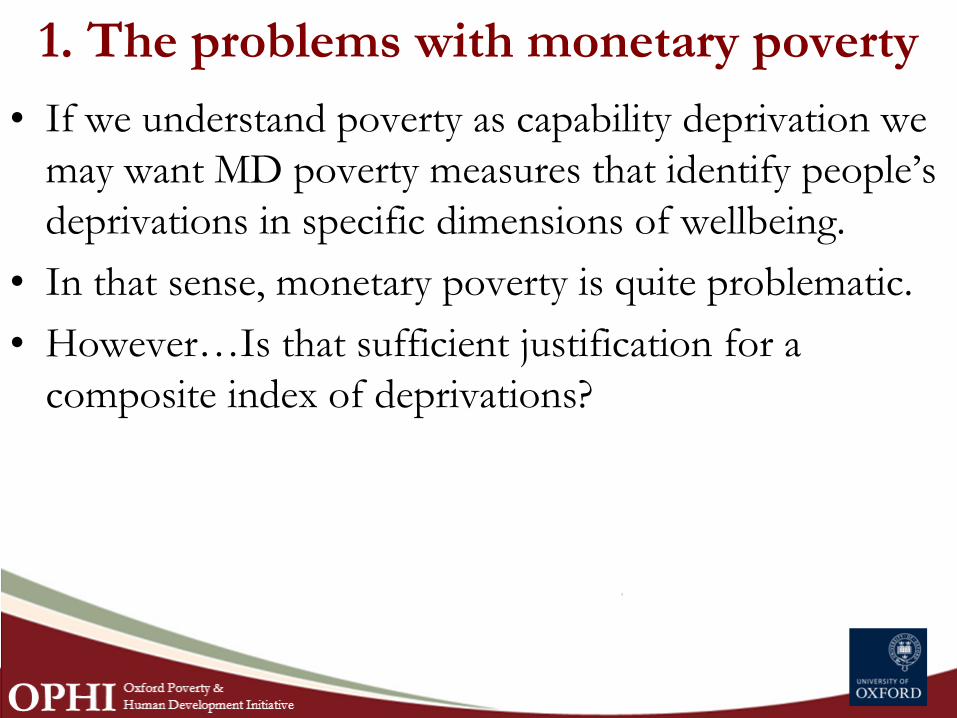
• If we understand poverty as capability deprivation we
may want MD poverty measures that identify people‟s
deprivations in specific dimensions of wellbeing.
• In that sense, monetary poverty is quite problematic.
• However…Is that sufficient justification for a
composite index of deprivations?
1. The problems with monetary poverty

1. The problems with monetary poverty
• “Human lives are battered
and diminished in all kinds
of different ways, and the
first task… is to acknowledge
that deprivations of very
different kinds have to be
accommodated within a
general overarching
framework.”

2. A dashboard approach to
multidimensional poverty
• Why not? Look I do not like monetary poverty
either (it hurts my left-wing, anti-consumerist
feelings, it is a World Bank plot anyway, etc.), let‟s
monitor multiple deprivations using a “dashboard”
approach.
• Advantages: it is transparent; every trend is
monitored; by contrast, composite indices compress
vital information (e.g. Ravallion‟s examples).
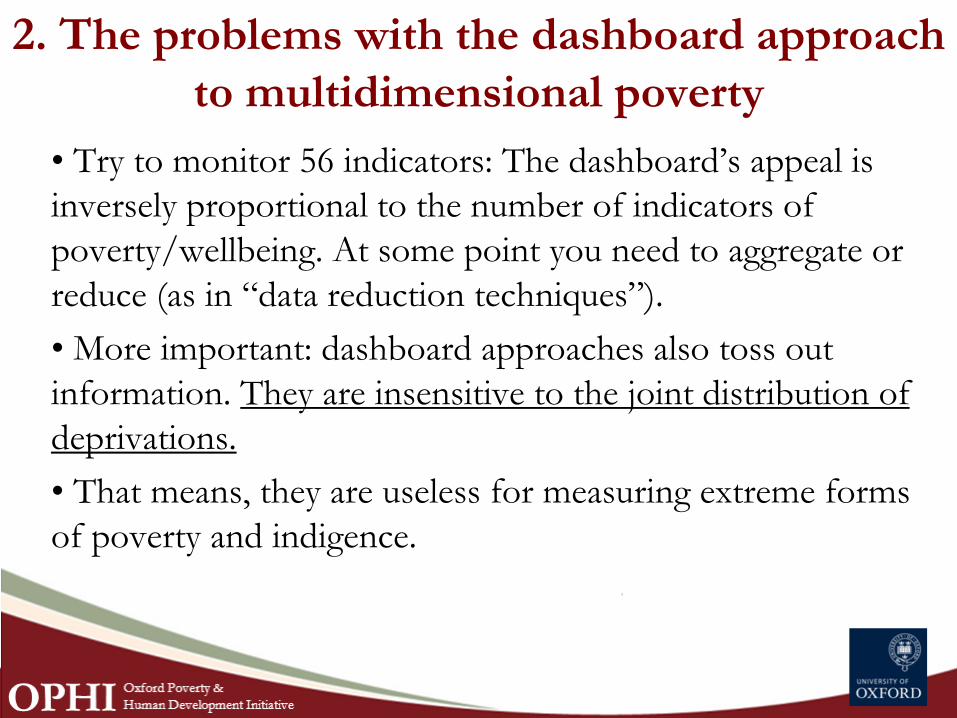
2. The problems with the dashboard approach
to multidimensional poverty
• Try to monitor 56 indicators: The dashboard‟s appeal is
inversely proportional to the number of indicators of
poverty/wellbeing. At some point you need to aggregate or
reduce (as in “data reduction techniques”).
• More important: dashboard approaches also toss out
information. They are insensitive to the joint distribution of
deprivations.
• That means, they are useless for measuring extreme forms
of poverty and indigence.
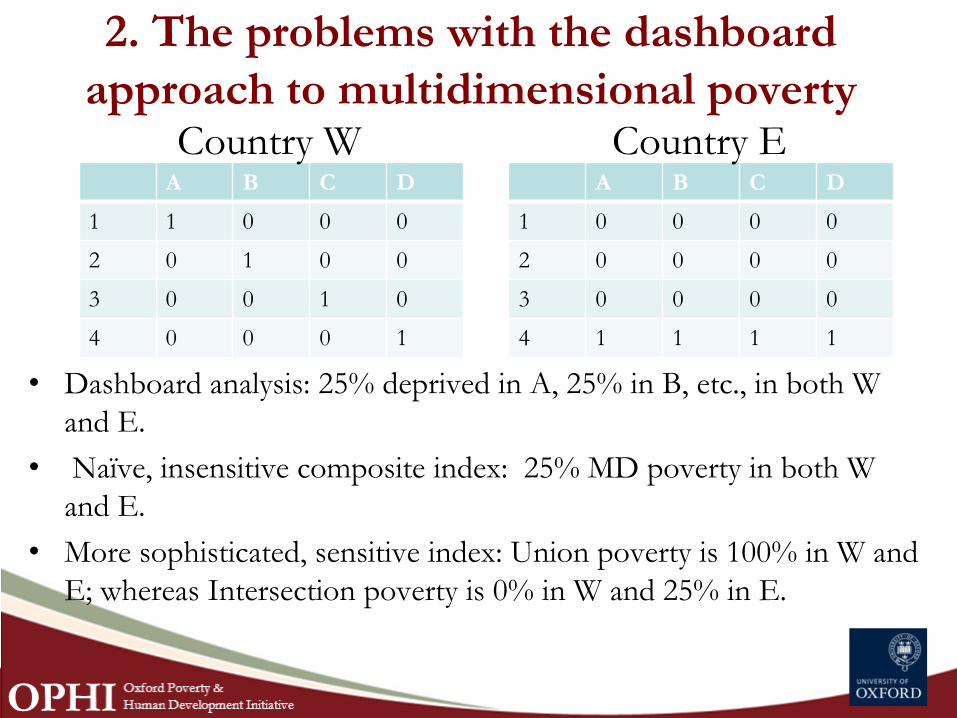
2. The problems with the dashboard
approach to multidimensional poverty
A B C D
1 1 0 0 0
2 0 1 0 0
3 0 0 1 0
4 0 0 0 1
A B C D
1 0 0 0 0
2 0 0 0 0
3 0 0 0 0
4 1 1 1 1
• Dashboard analysis: 25% deprived in A, 25% in B, etc., in both W
and E.
• Naïve, insensitive composite index: 25% MD poverty in both W
and E.
• More sophisticated, sensitive index: Union poverty is 100% in W and
E; whereas Intersection poverty is 0% in W and 25% in E.
Country W Country E
2. The problems with the dashboard
approach to multidimensional poverty
From the Stligitz commission:
• “ [t]he consequences for quality of life of
having multiple disadvantages far exceed the
sum of their individual effects.”
• “Developing measures of these cumulative
effects requires information on the „joint
distribution‟ of the most salient features of
quality of life across everyone in a country
through dedicated surveys.”
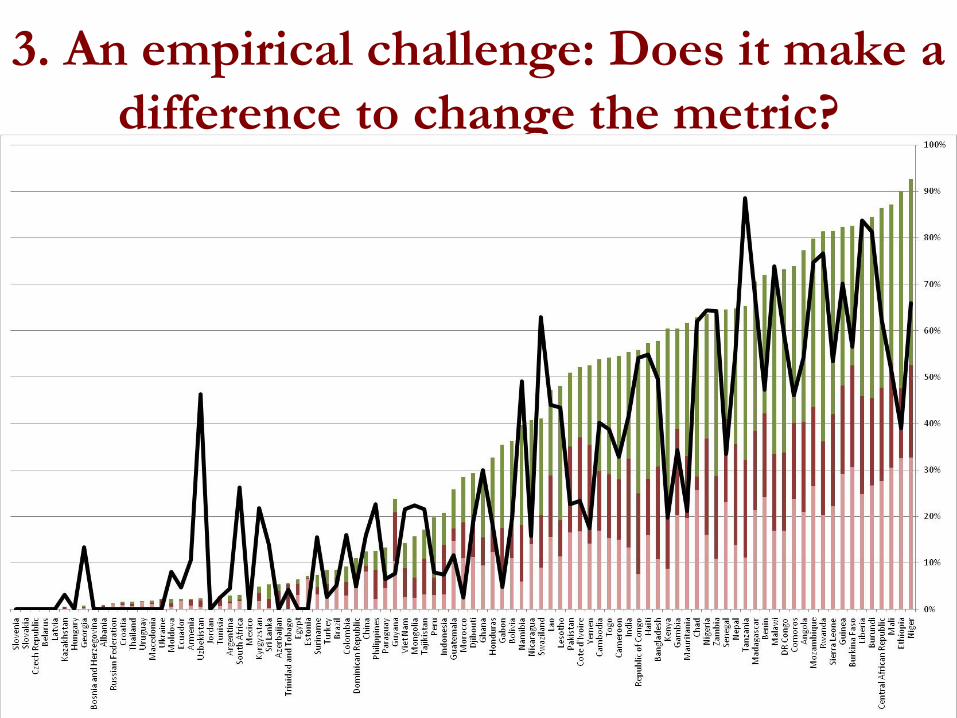
3. An empirical challenge: Does it make a
difference to change the metric?
• MD measures should complement (not
substitute) other measures and approaches:
– We may still be interested in tracking destitution in
command over goods (e.g. with monetary poverty).
– Composite indices do compress information on
individual trends, so we should use them together
with dashboards.
– With a combination of joint-distribution sensitive
indices (e.g. AF) with dashboard approaches,
distribution-insensitive composite indices become
unnecessary (unless too many indicators involved).
MD poverty measures: challenges, improvements,
best practices
• More work needed on the theoretical
foundations of MD poverty measures,
beyond the capability approach, especially
considering the different possible functional
forms.
• In relation to that, more discussion needed
on the implied trade-offs (and relationships,
in general) between dimensions.
MD poverty measures: challenges,
improvements, best practices

• MD measures bring about several non-trivial
decisions:
– Choices of weights, dimension-specific poverty
lines, multidimensional deprivation cut-offs.
• These, in turn, pose a robustness challenge.
Hence the need to develop methods that
assess the sensitivity and robustness of
analyses based on MD poverty mesaures.
MD poverty measures: challenges,
improvements, best practices
From the Stiglitz commission:
• “While assessing quality-of-life requires a
plurality of indicators, there are strong demands
to develop a single summary measure”.
• “Statistical offices should provide the
information needed to aggregate across quality-
of-life dimensions, allowing the construction of
different indexes”.
MD poverty measures: challenges,
improvements, best practices
In a nutshell: Why MD poverty measures? • Traditional monetary measures do not fit that well with
the notion of poverty as capability deprivation.
• A good MD sensitive measure can work in tandem with a
dashboard approach. One generates the interest for
looking into the other.
• Sensitivity to the joint distribution is helpful in order to
measure different degrees of poverty acuteness.
• A summary measure (e.g. MPI) can provide a bird‟s eye
view and generate political and public interest.
• Further appeal if the measure is decomposable by groups,
indicators, and their respective changes across time.