Embed Size (px)
Citation preview

Who Is Coaching High School Girls’ Sport
Teams?
Angela Lumpkin, University of KansasJudy Favor, Baker University
Lacole Hook, University of Minnesota, Crookston
Research Questions
1. What are the demographic characteristics of coaches of high school girls’ sport teams, and do these differ by sex?
2. Who selects coaches of high school girls’ sport teams?
3. Does the person who selects these coaches tend to select coaches of his or her same sex?

Research Questions
4. Are there differences in the reasons why males and females coach high school girls’ sport teams?
5. Are there differences in the levels of enjoyment male and female coaches attach to coaching high school girls’ sport teams?
6. What factors influence coaches of high school girls’ sport teams to resign from coaching, and do these reasons differ by sex?
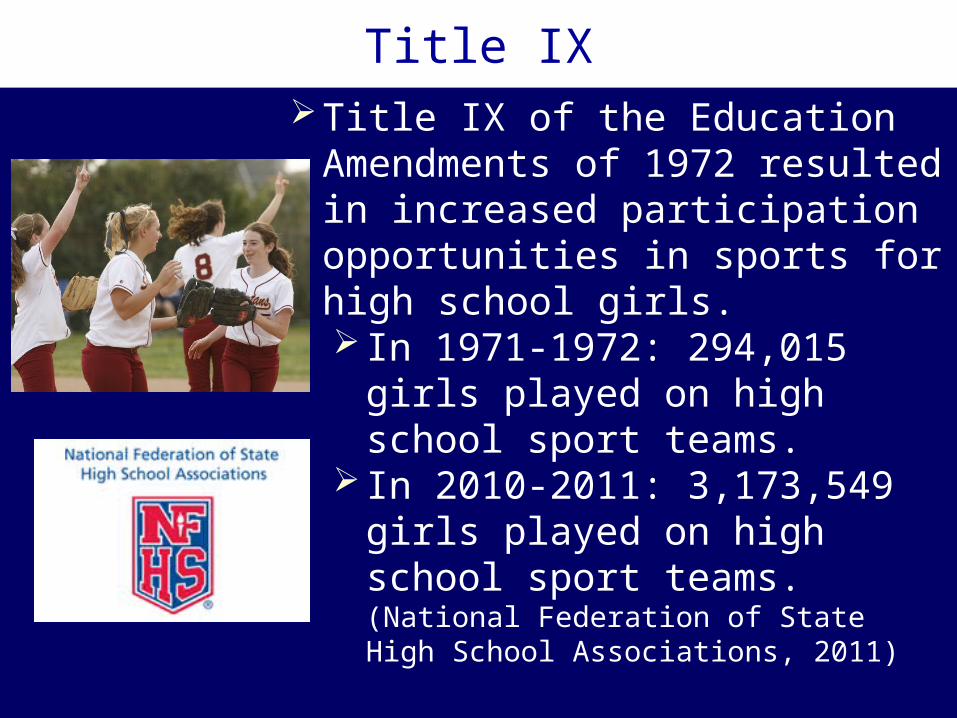
Title IXTitle IX of the Education
Amendments of 1972 resulted in increased participation opportunities in sports for high school girls. In 1971-1972: 294,015
girls played on high school sport teams.
In 2010-2011: 3,173,549 girls played on high school sport teams. (National Federation of State High School Associations, 2011)
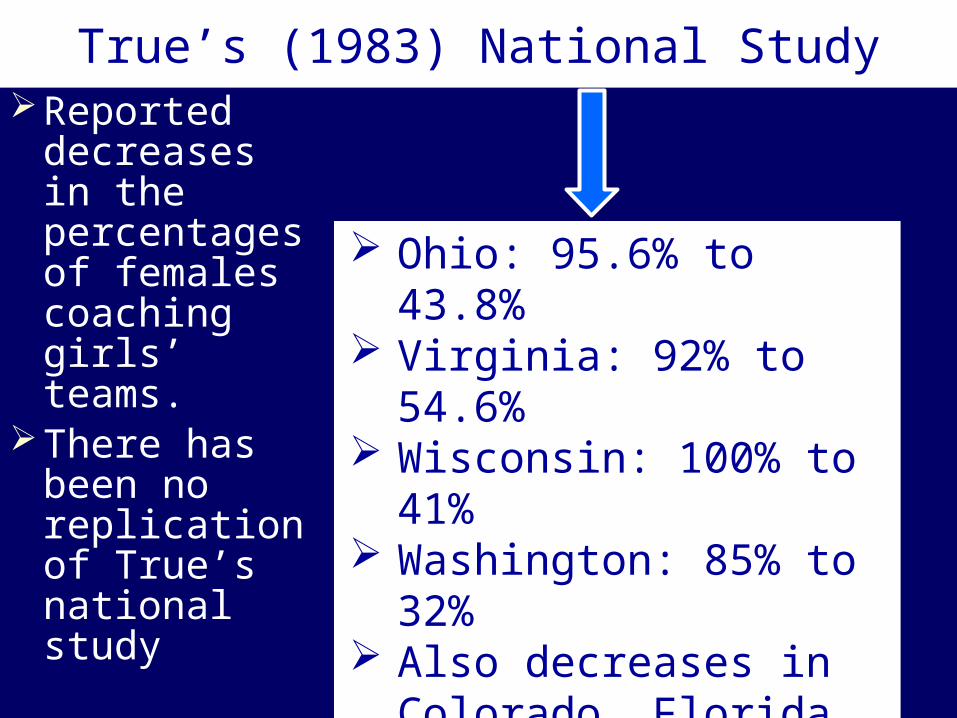
True’s (1983) National StudyReported
decreases in the percentages of females coaching girls’ teams.
There has been no replication of True’s national study
Ohio: 95.6% to 43.8% Virginia: 92% to 54.6% Wisconsin: 100% to
41% Washington: 85% to
32% Also decreases in
Colorado, Florida, Illinois, Iowa, Kansas, Minnesota, and Nebraska

State Studies Reporting Declining Percentages of Female Coaches
Illinois (Chesbro, 1985; Wilkinson & Schneider, 1991)
Oregon (Sisley & Capel, 1986)Missouri (Wilkerson, 1996) Indiana (Greenwood, 2003)Minnesota (Tucker Center for Research
on Girls and Women in Sport, 2009)

Why the Decline in Female Coaches?Knoppers (1987) suggested that coaching
could be perceived as a “dead-end” career for females with opportunities in sports negatively affected by: Homophobia.Lack of opportunities for advancement. Negative attitudes and lack of feedback.Physical and mental costs associated
with occupational stereotyping.Sexual harassment.Time and role conflicts between
coaching and family responsibilities.
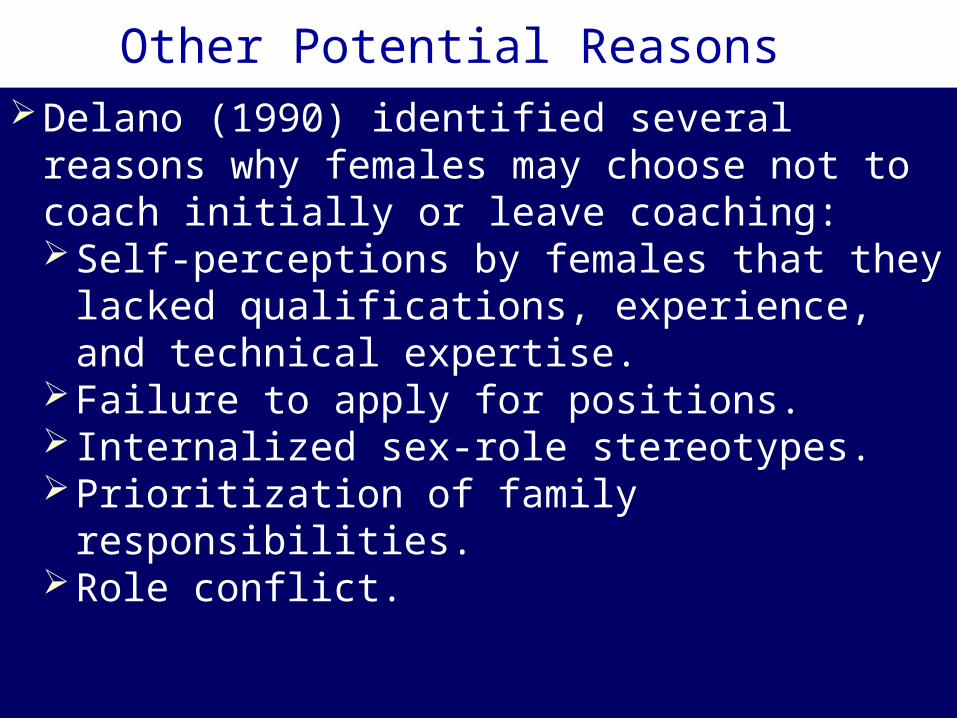
Other Potential Reasons Delano (1990) identified several reasons
why females may choose not to coach initially or leave coaching:Self-perceptions by females that they
lacked qualifications, experience, and technical expertise.
Failure to apply for positions. Internalized sex-role stereotypes.Prioritization of family responsibilities. Role conflict.

More Possible ReasonsWilkinson and Schneider (1991) identified
several possible reasons why females may choose not to coach initially or to leave coaching:Success of the “old boys’ network.”Failure of the “old girls’ network.”Lack of female coaches as role models. Perception of some females that they
lack technical expertise and experience.
Prioritization of family responsibilities.

Hart, Hasbrook, and Mathes (1986)
Former coaches Had enjoyed working with motivated and more skillful students.
Left coaching because of time and role conflicts with their personal lives.
Current coaches Would leave coaching if they were not successful or effective. Enjoyed the competition and challenge of winning.
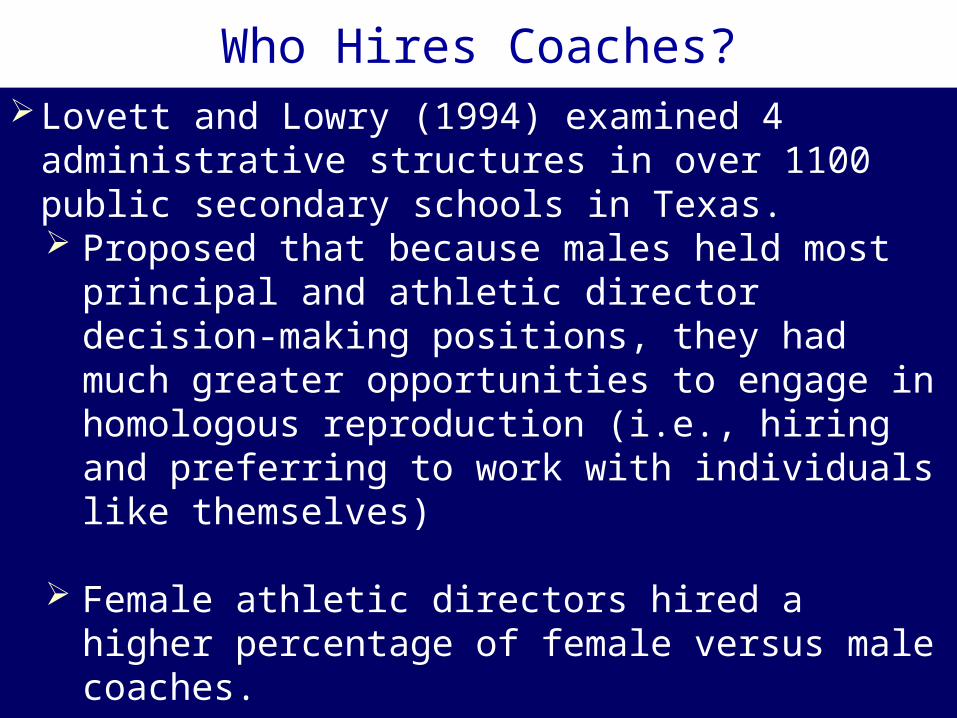
Who Hires Coaches?Lovett and Lowry (1994) examined 4
administrative structures in over 1100 public secondary schools in Texas. Proposed that because males held most
principal and athletic director decision-making positions, they had much greater opportunities to engage in homologous reproduction (i.e., hiring and preferring to work with individuals like themselves)
Female athletic directors hired a higher percentage of female versus male coaches.

Summary of Related LiteratureFewer females are coaching high school
girls’ sport teams.Female athletic directors are more likely to
hire female coaches than male coaches.There are too few female coaches serving as
role models for girls who might aspire to coach.
Factors in decreasing percentages of female coaches: Ø The successful “old boys’ network.” Ø Time demands for family responsibilities.Ø Stereotyping and other social and
psychological factors.

MethodsContacted executive directors of 50 state H.S.
athletic associations and requested them to .a. Forward link to athletic directors. b. Provide list of athletic directors in state.
Athletic directors were each sent an email request to forward survey link to varsity and junior varsity head coaches of H.S. girls’ sport teams.
Respondents completed 15-item, online survey.
Comparisons of responses were made by sex.

Coaches Responded from 15 StatesAlaska (n=64)Arkansas (n=92)Kansas (n=524)Kentucky (n=133)Maryland (n=537) Nebraska (n=305)New Hampshire
(n=111)
North Carolina (n=602)North Dakota (n=183)South Carolina (n=132)Tennessee (n=164)Vermont (n=92)Virginia (n=585)Wisconsin (n=541)Wyoming (n=108)
n=4173
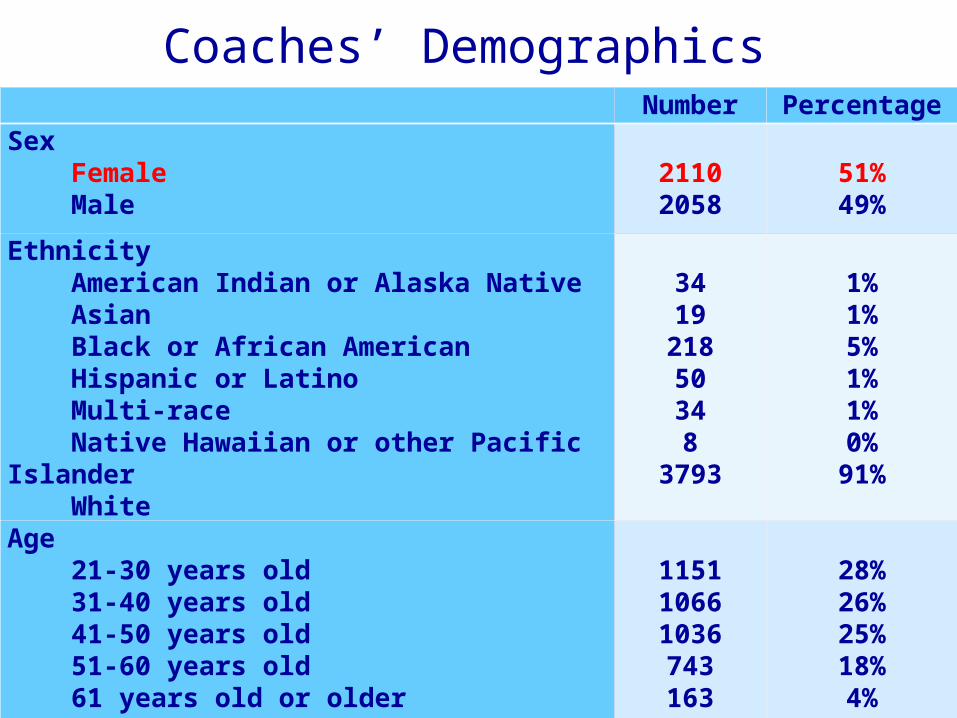
Coaches’ Demographics Number PercentageSex Female Male
21102058
51%49%
Ethnicity American Indian or Alaska Native Asian Black or African American Hispanic or Latino Multi-race Native Hawaiian or other Pacific Islander White
341921850348
3793
1%1%5%1%1%0%91%
Age 21-30 years old 31-40 years old 41-50 years old 51-60 years old 61 years old or older
115110661036743163
28%26%25%18%4%

Coaches’ Professional Credentials Number Percentage
Highest academic degree High school diploma Associate’s degree Bachelor’s degree Master’s degree Specialist degree Doctoral degree
219179
192517168148
5%4%46%41%2%1%
Hold a teaching license or certificate Yes No
31481008
75%24%

Years of Coaching Experience Number PercentageYears of Prior Paid Head Coaching Experience 0-2 years 3-5 years 6-8 years 9-11 years 12-15 years 16-19 years 20-24 years 25-29 years 30 or more years
2457664359228160105933539
59%16%9%6%4%3%2%1%1%
Total Years of Paid Experience as a Head Coach 1-2 years 3-5 years 6-8 years 9-11 years 12-15 years 16-19 years 20-24 years 25-29 years 30 or more years
9891043595432346242206133118
24%25%14%10%8%6%5%3%3%

Years of Paid Experience Prior to Being Hired into Current Position by Sex
Years of Experience Female Percent Male Percent
0 - 2 1413 68% 1038 51%
3 - 5 317 15% 342 17%
6 - 8 145 7% 213 10%
9 - 11 83 4% 145 7%
12 - 15 56 3% 104 5%
16 - 19 28 1% 77 4%
20 or more 40 2% 127 6%

Total Years of Paid Experience as a Head Coach by Sex
Yrs of Experience
Female Percent Male Percent
0 - 2 633 31% 354 17% 3 - 5 585 28% 454 22%
6 - 8 296 14% 298 15%
9 - 11 200 10% 231 11%
12 - 15 118 6% 226 11%
16 - 19 94 5% 148 7%
20 or more 143 7% 312 16%

Top Ten Most Popular High School Girls’ Sports*
Rank
Sport Female Coaches
Male Coache
s
Percentage of Female Coaches
1 Basketball 224 448 33.3%2 Track and Field
(outdoor)153 338
31.2%3 Volleyball 424 130 76.5%4 Softball (fast pitch) 187 274 40.6%5 Cross Country 118 243 32.7%6 Soccer 111 241 31.5%7 Tennis 98 137 41.7%8 Golf 43 133 24.4%9 Swimming and Diving 106 69 60.6%
10 Competitive Spirit Squads
171 398.3%
*Ranking for 2010-2011 from the National Federation of State High School Associations

Who Selects Head Coaches of High School Girls’ Sport Teams?
Number Percentage
Gender of Selecting Person(s) Female Male
628
3503
15%84%
Role of Selecting Person(s) Athletic director Principal Superintendent Coach Other Athletic director and principal Committee AD, principal, and superintendent School Board
26579512491065446352929
64%23%6%3%1%1%1%1%1%

Sex of Selector for Top 10 Sports Rank Sport Female Coach
Male Coach
1 Basketball Female Selector Male Selector
32%34%
68%66%
2 Track and Field (outdoor) Female Selector Male Selector
44%30%
56%79%
3 Volleyball Female Selector Male Selector
73%77%
27%23%
4 Softball (fast pitch) Female Selector Male Selector
42%40%
58%60%
5 Cross Country Female Selector Male Selector
36%32%
64%68%

Sex of Selector for Top 10 Sports Rank Sport Female Coach
Male Coach
6 Soccer Female Selector Male Selector
36%31%
64%69%
7 Tennis Female Selector Male Selector
20%9%
80%91%
8 Golf Female Selector Male Selector
12%10%
88%90%
9 Swimming and Diving Female Selector Male Selector
50%62%
50%38%
10 Competitive Spirit Squads Female Selector Male Selector
100%98%
0%2%

Reasons for Coaching by Sex Sex of
CoachStrongly
Disagree or Disagree
Strongly Agree or
Agree
Wanted to coach but no positions coaching boys were available.
Female 80% 2%
Male 74% 7%
Coaching a girls’ sport team is an easy way to supplement my income.
Female 57% 21%
Male 73% 10%
My teaching contract required coaching a sport.
Female 86% 4%
Male 87% 3%I wanted to coach a high school girls’ sport team.
Female 3% 90%
Male 7% 64%I wanted to teach values and important life lessons to adolescents.
Female 1% 96%
Male 1% 93%

Satisfaction or Enjoyment with Coaching a Girls’ Sport Team
Sex of
Coach
Strongly
Disagree
or
Disagree
Strongly
Agree or
Agree
I thoroughly enjoy
coaching a high
school girls’ sport
team.
Female 1% 94%
Male 2% 96%
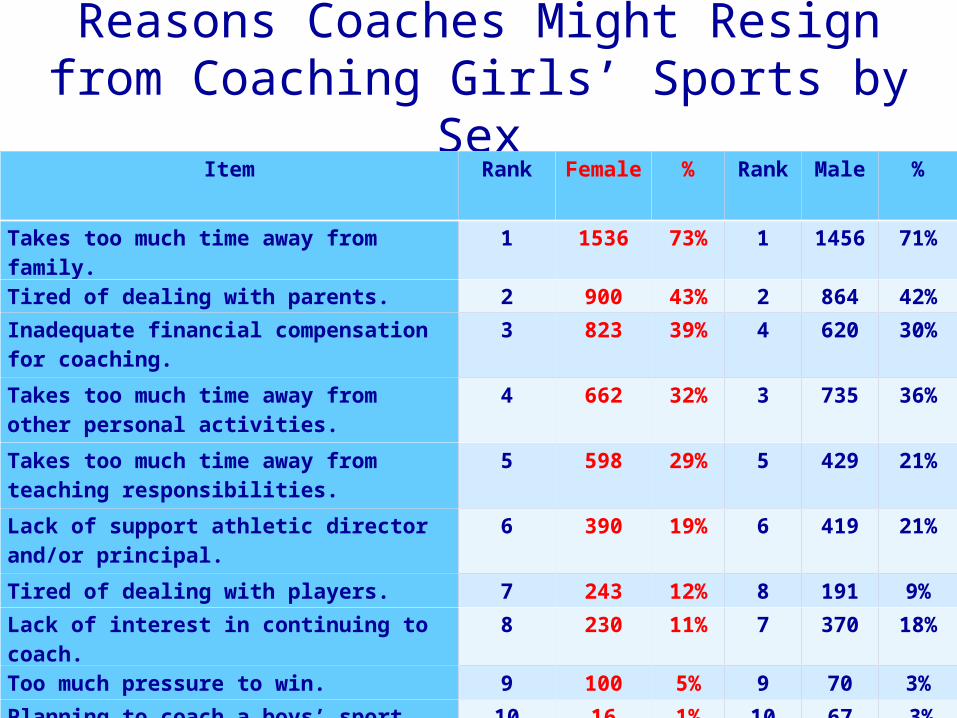
Reasons Coaches Might Resign from Coaching Girls’ Sports by Sex
Item Rank Female
% Rank Male %
Takes too much time away from family.
1 1536 73% 1 1456 71%
Tired of dealing with parents. 2 900 43% 2 864 42%Inadequate financial compensation for coaching.
3 823 39% 4 620 30%
Takes too much time away from other personal activities.
4 662 32% 3 735 36%
Takes too much time away from teaching responsibilities.
5 598 29% 5 429 21%
Lack of support athletic director and/or principal.
6 390 19% 6 419 21%
Tired of dealing with players. 7 243 12% 8 191 9%Lack of interest in continuing to coach.
8 230 11% 7 370 18%
Too much pressure to win. 9 100 5% 9 70 3%Planning to coach a boys’ sport team next year.
10 16 1% 10 67 3%

Other Reasons Why Coaches Might Resign from Coaching Girls’ Sports
Personal-related reasons: 39% - most associated with retirement and age or health.
Career-related reasons: 25% - most associated with current job responsibilities and a new job.
Player-related reasons: 13% - most associated with poor player effort or commitment and weak player interest.
Lack of support-related reasons: 12% primarily a lack of administrative support.
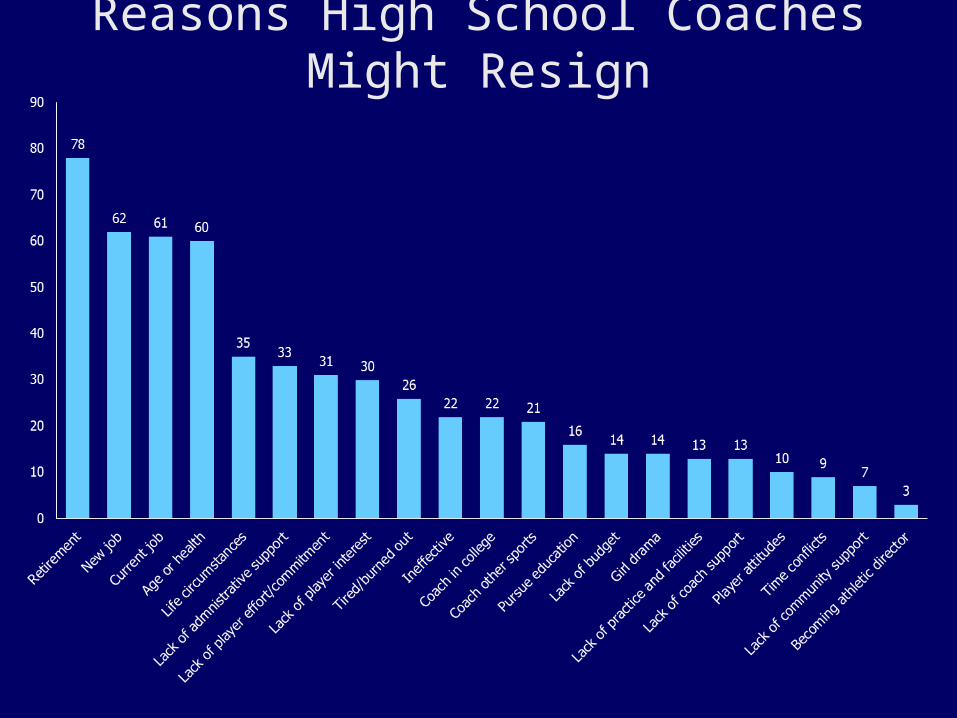
Reasons High School Coaches Might Resign
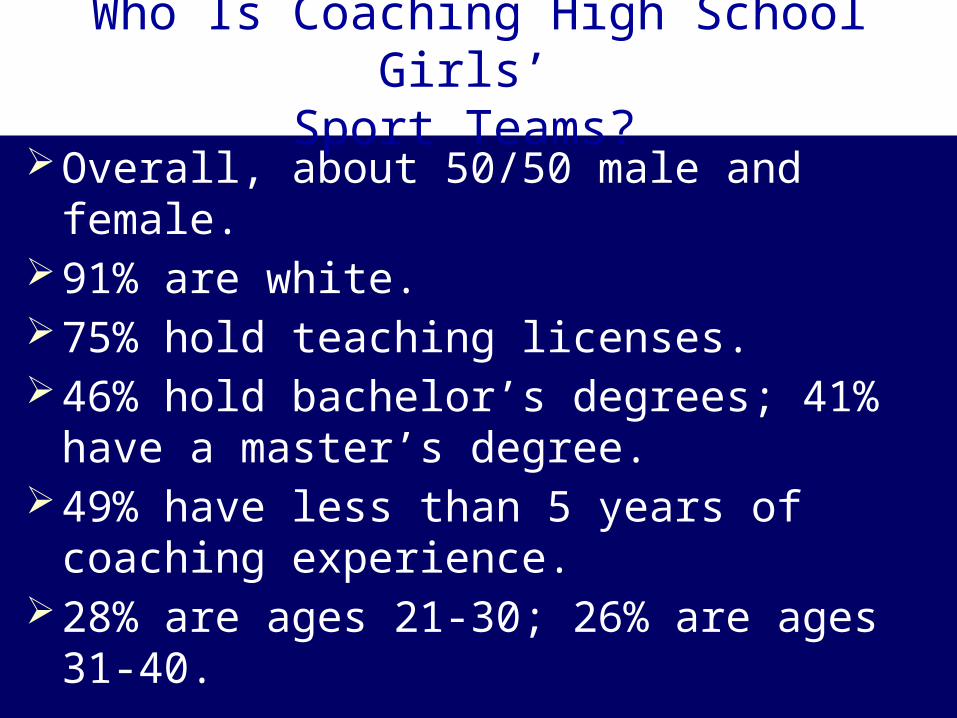
Who Is Coaching High School Girls’ Sport Teams?
Overall, about 50/50 male and female.91% are white.75% hold teaching licenses.46% hold bachelor’s degrees; 41% have
a master’s degree. 49% have less than 5 years of coaching
experience. 28% are ages 21-30; 26% are ages 31-
40.

Differences in Coaching Demographic Characteristics by Sex
59% of females had less than 6 years of paid coaching experience compared to 39% of males.
31% of females had less than 3 years of paid coaching experience compared to 17% of males.
18% of females had more than 12-15 years of experience compared to 34% of males.
7% of females had coached over 20 years compared to 16% of males.

Differences in Coaching Characteristics
by Sport1/3 or fewer of girls’ teams in basketball,
track and field, cross country, soccer, and golf are coached by females; 41% of softball and 42% of tennis teams are coached by females.
Only competitive spirit squads, dance/drill, field hockey, gymnastics, lacrosse, swimming and diving, and volleyball had a higher percentage of female than male coaches in this study.
(Underlined are in the top 10 most popular.)
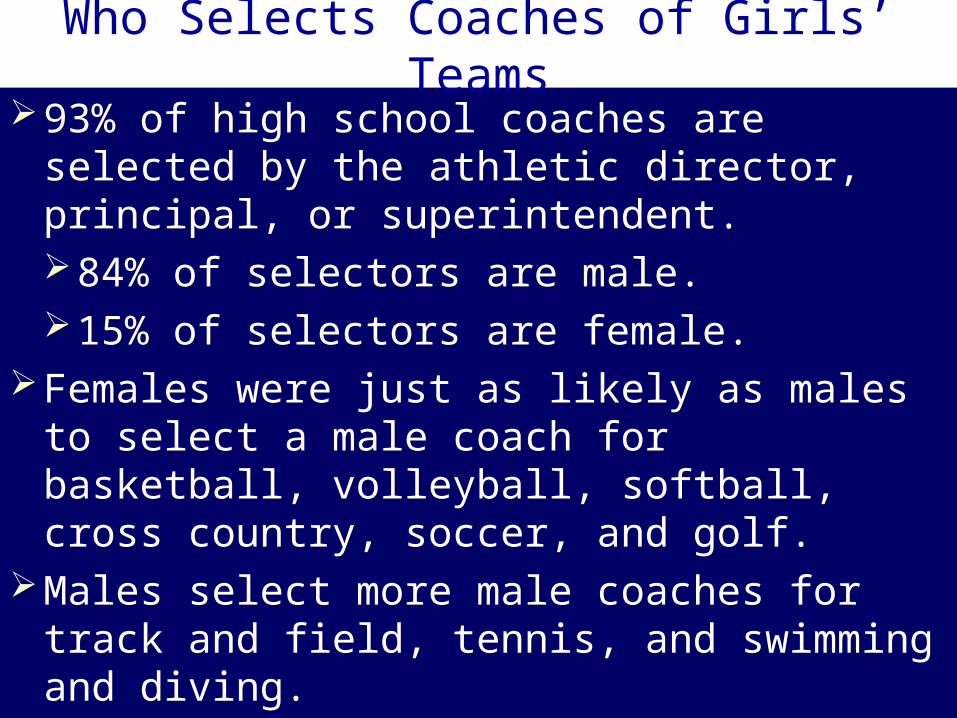
Who Selects Coaches of Girls’ Teams93% of high school coaches are selected
by the athletic director, principal, or superintendent. 84% of selectors are male.15% of selectors are female.
Females were just as likely as males to select a male coach for basketball, volleyball, softball, cross country, soccer, and golf.
Males select more male coaches for track and field, tennis, and swimming and diving.

Tucker Center for Research on Girls and Women in Sport (2009)
Researchers at the Tucker Center concluded that the position of head coach was “the most visible position of power and prestige throughout the sports world.”
They argued that a lack of female role models in power positions was perpetuating a scarcity of female coaches for many high school girls’ sport teams.
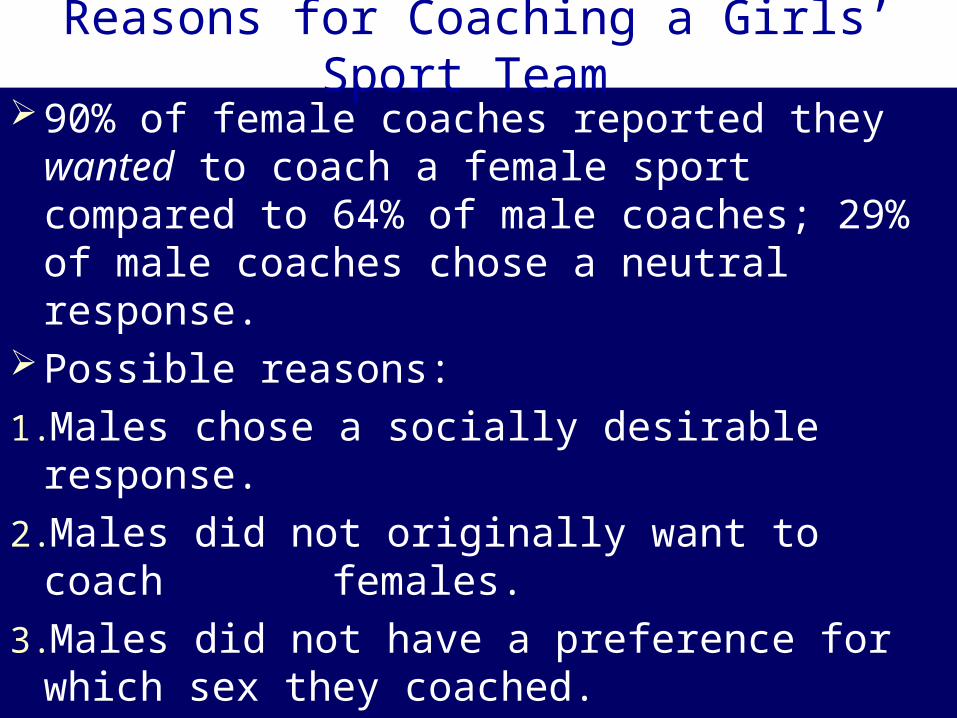
Reasons for Coaching a Girls’ Sport Team
90% of female coaches reported they wanted to coach a female sport compared to 64% of male coaches; 29% of male coaches chose a neutral response.
Possible reasons: 1.Males chose a socially desirable response.2.Males did not originally want to coach
females. 3.Males did not have a preference for which
sex they coached.

Important Findings and Questions
1. In most of the top 10 most popular high school sports for girls, fewer than 1/3 of the teams were coached by females. a.Does this suggest a continued decline
in the percentage of females coaching girls’ teams?
b. If so, why is this occurring?
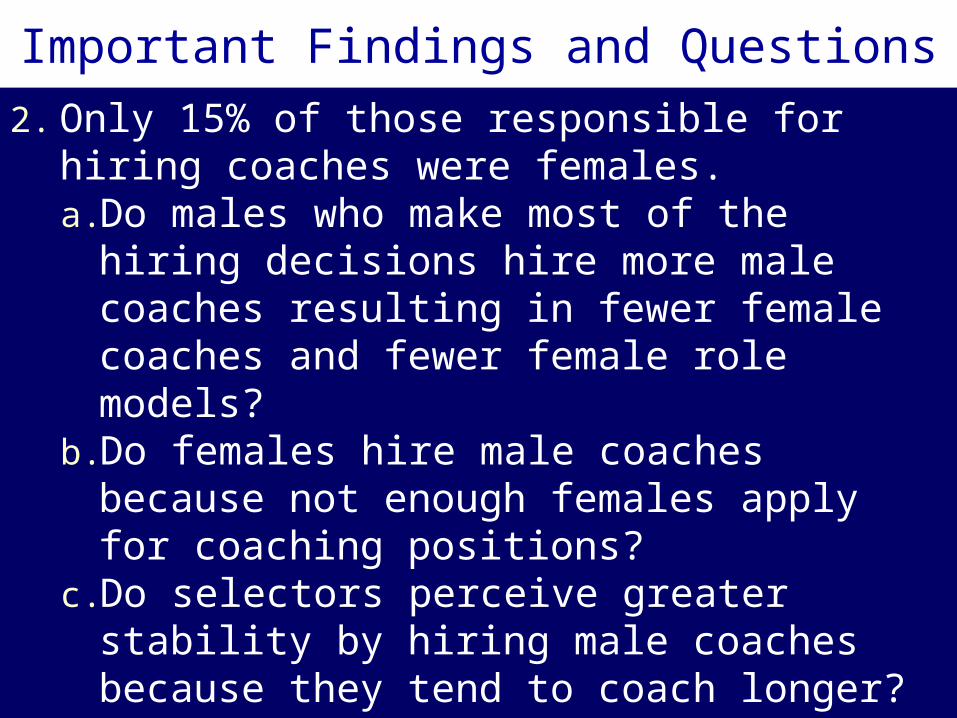
Important Findings and Questions
2. Only 15% of those responsible for hiring coaches were females. a.Do males who make most of the hiring
decisions hire more male coaches resulting in fewer female coaches and fewer female role models?
b.Do females hire male coaches because not enough females apply for coaching positions?
c. Do selectors perceive greater stability by hiring male coaches because they tend to coach longer?
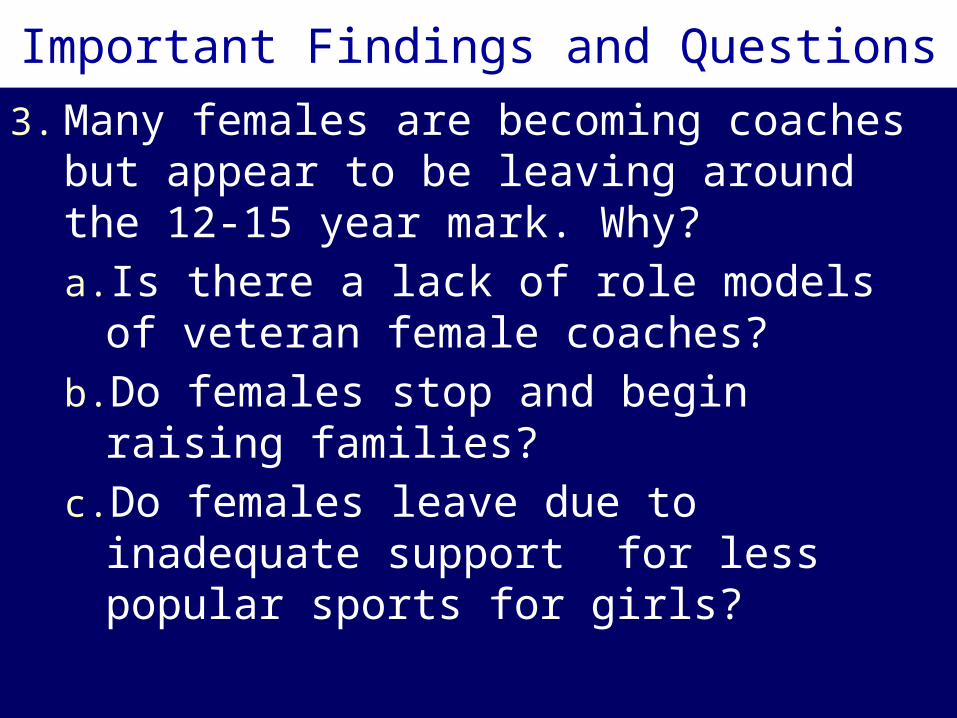
Important Findings and Questions
3. Many females are becoming coaches but appear to be leaving around the 12-15 year mark. Why? a. Is there a lack of role models of
veteran female coaches?b.Do females stop and begin raising
families?c. Do females leave due to inadequate
support for less popular sports for girls?
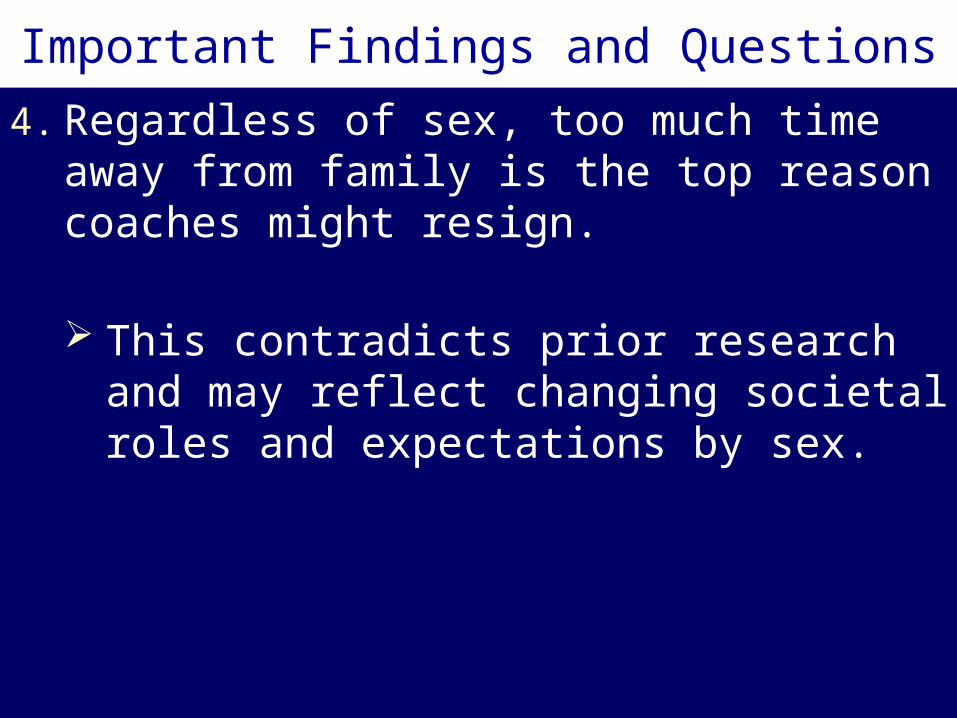
Important Findings and Questions
4. Regardless of sex, too much time away from family is the top reason coaches might resign.
This contradicts prior research and may reflect changing societal roles and expectations by sex.
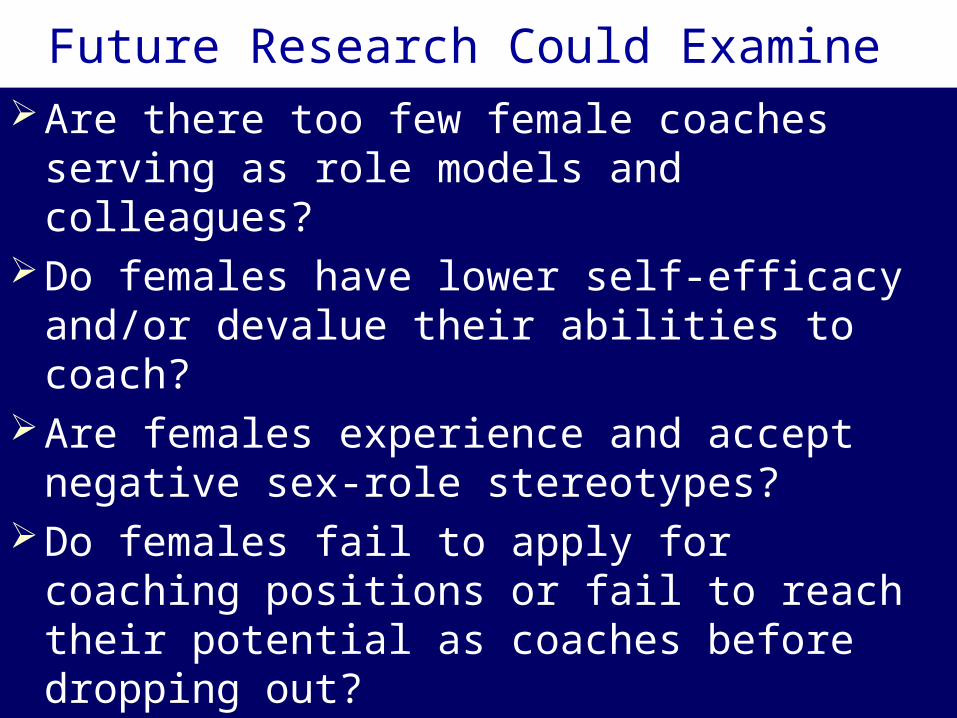
Future Research Could Examine Are there too few female coaches serving
as role models and colleagues?Do females have lower self-efficacy
and/or devalue their abilities to coach?Are females experience and accept
negative sex-role stereotypes?Do females fail to apply for coaching
positions or fail to reach their potential as coaches before dropping out?

References Chesbro, P. A. (1985, Spring). High school
women coaches and athletic directors: Diminishing numbers. Illinois Journal for Health, Physical Education and Recreation, 7-9.
Delano, L. C. (1990). A time to plant — Strategies to increase the number of women in athletic leadership positions. Journal of Physical Education, Recreation and Dance, 61(3), 53-55.
Greenwood, S. R. (2003). A description of Indiana high school varsity head coaches by salary, sex, sport, and school classification (Unpublished master’s thesis). Ball State University, Muncie, Indiana.
References Hart, B. A., Hasbrook, C. A., & Mathes, S. A.
(1986). An examination of the reduction in the number of female interscholastic coaches. Research Quarterly for Exercise and Sport, 57, 68-77.
Knoppers, A. (1987). sex and the coaching profession. Quest, 39, 9-22.
Lovett, D. J., & Lowry, C. D. (1994). ‘Good old boys’ and ‘good old girls’ clubs: Myth or reality? Journal of Sport Management, 8, 27-35.
Molstad, S. M. (1993). Coaching qualities, sex, and role modeling. Women in Sport and Physical Activity Journal, 2(2), 11-19.

References National Federation of State High School
Associations. (2011). 2010-11 High school athletics participation survey. Retrieved from http://www.nfhs.org/content.aspx?id=3282.
Sisley, B. L., & Capel, S. A. (1986). High school coaching: Filled with sex differences. Journal of Physical Education, Recreation and Dance, 57(3), 39-43.
True, S. (1983). Percentage of girls’ high school athletic teams coached by women. Kansas City, MO: National Federation of State High School Associations.

References Tucker Center for Research on Girls and
Women in Sport. (2009). Wanted! Female coaches at all levels of sport. Retrieved from http://www.cehd.umn.edu/tuckercenter/newsletter/2009-spring/feature.asp.
Wilkerson, M. (1996). Explaining the presence of men coaches in women's sports: The uncertainty hypothesis. Journal of Sport and Social Issues, 20, 411-426.
Wilkinson, S., & Schneider, P. M. (1991). The representation of men and women in secondary physical education and interscholastic athletic programs in the state of Illinois. Physical Educator, 48, 100-104.