Embed Size (px)
Citation preview
National Park Service U.S. Department of the Interior Natural Resource Stewardship and Science
White Sands National Monument Visitor Study Summer 2012 Natural Resource Report NPS/NRSS/EQD/NRR—2013/642

ON THE COVER Ripples in the sand and a soaptree yucca, iconic symbols of White Sands National Monument Photograph by: R. Wiles
White Sands National Monument Visitor Study Summer 2012 Natural Resource Report NPS/NRSS/EQD/NRR—2013/642
Ally Begly, Beth Barrie, Lena Le, Steven J. Hollenhorst Visitor Services Project Park Studies Unit College of Natural Resources University of Idaho 875 Perimeter Drive MS 1139 Moscow, ID 83844-1139
March 2013
U.S. Department of the Interior National Park Service Natural Resource Stewardship and Science Fort Collins, Colorado
White Sands National Monument – VSP Visitor Study 253 July 17-23, 2012
ii
The National Park Service, Natural Resource Stewardship and Science office in Fort Collins, Colorado, publishes a range of reports that address natural resource topics. These reports are of interest and applicability to a broad audience in the National Park Service and others in natural resource management, including scientists, conservation and environmental constituencies, and the public.
The Natural Resource Report Series is used to disseminate high-priority, current natural resource management information with managerial application. The series targets a general, diverse audience, and may contain NPS policy considerations or address sensitive issues of management applicability.
All manuscripts in the series receive the appropriate level of peer review to ensure that the information is scientifically credible, technically accurate, appropriately written for the intended audience, and designed and published in a professional manner.
Data in this report were collected and analyzed using methods based on established, peer-reviewed protocols and were analyzed and interpreted within the guidelines of the protocols.
Views, statements, findings, conclusions, recommendations, and data in this report do not necessarily reflect views and policies of the National Park Service, U.S. Department of the Interior. Mention of trade names or commercial products does not constitute endorsement or recommendation for use by the U.S. Government.
This report is available from the Social Science Division (http://www.nature.nps.gov/socialscience/index.cfm) and the Natural Resource Publications Management website (http://www.nature.nps.gov/publications/nrpm/).
This report and other reports by the Visitor Services Project (VSP) are available from the VSP website (http://www.psu.uidaho.edu/c5/vsp/vsp-reports/) or by contacting the VSP office at (208) 885-2585.
Please cite this publication as:
Begly, A., B. Barrie, Y. Le, and S. J. Hollenhorst. 2013. White Sands National Monument visitor study: Summer 2012. Natural Resource Report NPS/NRSS/EQD/NRR—2013/642. National Park Service, Fort Collins, Colorado.
NPS 142/120274, March 2013
White Sands National Monument – VSP Visitor Study 253 July 17-23, 2012
iii
Contents Page
Executive Summary ........................................................................................................................ v Acknowledgements ............................................................................................................... viii About the Authors ................................................................................................................. viii
Introduction ..................................................................................................................................... 1 Organization of the Report ...................................................................................................... 1 Presentation of the Results ....................................................................................................... 2
Methods........................................................................................................................................... 3 Survey Design and Procedures ................................................................................................ 3
Sample size and sampling plan ........................................................................................... 3 Questionnaire design ........................................................................................................... 3 Survey procedure ................................................................................................................ 4 Data analysis ....................................................................................................................... 4 Limitations .......................................................................................................................... 5 Special conditions ............................................................................................................... 5 Checking non-response bias ............................................................................................... 6
Results ............................................................................................................................................. 7 Group and Visitor Characteristics ........................................................................................... 7
Visitor group size ................................................................................................................ 7 Visitor group type ............................................................................................................... 7 Visitors with organized groups ........................................................................................... 8 United States visitors by state of residence ....................................................................... 10 Visitors from New Mexico and adjacent states by county of residence ........................... 11 International visitors by country of residence ................................................................... 12 Number of visits to park in past 12 months ...................................................................... 13 Number of visits to park in lifetime .................................................................................. 13 Visitor age ......................................................................................................................... 14 Visitor ethnicity ................................................................................................................ 15 Visitor race ........................................................................................................................ 15 Language used for speaking and reading .......................................................................... 16 Respondent level of education .......................................................................................... 18 Respondent household income ......................................................................................... 18 Respondent household size ............................................................................................... 19 Awareness of park ............................................................................................................. 19
Trip/Visit Characteristics and Preferences ............................................................................ 20 Information sources prior to visit ...................................................................................... 20 Information sources for future visit .................................................................................. 22 Park website ...................................................................................................................... 23 Park as destination ............................................................................................................ 26 Resident of the area ........................................................................................................... 26 White Sands National Monument as primary reason for visiting the area ....................... 26 Alternative plans to visiting White Sands National Monument ....................................... 27 Support services in communities ...................................................................................... 29 Form of transportation ...................................................................................................... 30
White Sands National Monument – VSP Visitor Study 253 July 17-23, 2012
iv
Contents (continued) Page
Number of vehicles ........................................................................................................... 30 Number of park entries ..................................................................................................... 30 Overnight stays ................................................................................................................. 31 Accommodations used inside the park ............................................................................. 32 Accommodations used outside the park ........................................................................... 33 Length of stay in the park ................................................................................................. 34 Local attractions visited .................................................................................................... 36 Places visited in the park ................................................................................................... 38 Activities on this visit ....................................................................................................... 39 Most important activities .................................................................................................. 40 Activities on future visits .................................................................................................. 41 Ranger-led programs/talks ................................................................................................ 42
Ratings of Services, Facilities, Attributes, Resources, and Elements ................................... 44 Visitor services and facilities used .................................................................................... 44 Importance ratings of visitor services and facilities ......................................................... 45 Quality ratings of visitor services and facilities ................................................................ 47 Mean scores of importance and quality ratings of visitor services and facilities ............. 49 Park gift store sales items ................................................................................................. 51 Importance of protecting park resources and attributes .................................................... 52
Expenditures .......................................................................................................................... 54 Total expenditures inside and outside the park ................................................................. 54 Number of adults covered by expenditures ...................................................................... 55 Number of children covered by expenditures ................................................................... 55 Expenditures inside the park ............................................................................................. 56 Expenditures outside the park ........................................................................................... 59 Income forgone to make this trip ...................................................................................... 64
Preferences for Future Visits ................................................................................................. 65 Preferred interpretive services/programs on future visit ................................................... 66
Overall Quality ...................................................................................................................... 67 Visitor Comment Summaries ................................................................................................ 68
Planning for the future ...................................................................................................... 68 Additional comments ........................................................................................................ 70
Visitor Comments .................................................................................................................. 71 Appendix 1: The Questionnaire .................................................................................................... 78 Appendix 2: Additional Analysis .................................................................................................. 80 Appendix 3: Decision Rules for Checking Non-response Bias .................................................... 82
References .............................................................................................................................. 83

White Sands National Monument – VSP Visitor Study 253 July 17-23, 2012
v
Executive Summary This visitor study report profiles a systematic random sample of White Sands National Monument visitors during July 17-23, 2012. A total of 477 questionnaires were distributed to visitor groups. Of those, 226 questionnaires were returned, resulting in a 51.4% response rate. Group size and type
Thirty percent of visitor groups consisted of two people and 21% were in groups of four. Seventy-two percent of visitor groups consisted of family groups.
State or country of residence
United States visitors were from 34 states, Washington, DC, and Puerto Rico, and comprised 90% of total visitation during the survey period, with 41% from Texas. International visitors were from 16 countries and comprised 10% of total visitation during the survey period with 23% from Germany.
Frequency of visits Eighty percent of visitors visited the park once in the past 12 months and
58% were visiting for the first time. Sixteen percent had visited two times in their lifetime.
Age, ethnicity, race, and educational level
Twenty-six percent of visitors were ages 41-60 years, 25% were ages 15 years or younger, 23% were ages 21-40 years, and 7% were 71 years or older. Twenty-one percent of visitors were Hispanic or Latino. Ninety-two percent of visitors were White, 3% were Asian, and 3% were Black or African American. Thirty-two percent of respondents had completed some college, 32% had a bachelor’s degree, and 29% had a graduate degree.
Awareness of park prior to visit
Seventy-eight percent of visitor groups were aware prior to their visit that White Sands National Monument is part of the National Park System.
Information sources Most visitor groups (80%) obtained information about the park prior to their
visit through friends/relatives/word of mouth (48%) and previous visits (44%). Most of these visitor groups (91%) received the information they needed. For a future visit, 59% of visitor groups prefer to use the park website to obtain information.
Park website Forty-two percent of visitor groups obtained information from the park
website to plan their trip. Of those, 80% rated the quality of the website as “very good” or “good” and most visitors (91%) found the information they needed.
Park as destination For 55% of visitor groups, the park was one of several destinations, and for
34%, the park was the primary destination. Primary reason for visiting the area
Eleven percent of visitor groups were residents of the area (Alamogordo, Tularosa, Las Cruces). For 48% of nonresident group members, visiting the park was the primary reason for visiting the area.
Services used in nearby communities
Most visitor groups (91%) obtained support services in nearby communities. The communities most often used were Alamogordo (56%), Las Cruces (31%), and Ruidoso (23%).

White Sands National Monument – VSP Visitor Study 253 July 17-23, 2012
vi
Executive Summary (continued) Transportation Fifty-eight percent of non-resident visitor group members used a private car to
travel most of the distance from their home to the park area. Most visitor groups (88%) used one vehicle to arrive at the park.
Number of entries Most visitor groups (87%) entered the park one time and 9% entered twice. Overnight stays Forty-two percent of visitor groups stayed overnight away from their
permanent residence in the White Sands National Monument area (Alamogordo, Tularosa, Las Cruces), of which 60% stayed one night. Sixty-nine percent of visitor groups stayed in a lodge, motel, rented condo/home, cabin, B&B, etc. outside the park area.
Length of stay Thirty percent of visitor groups spent two hours in the park. The average
length of stay was 3.3 hours. Twelve percent of visitor groups visited the park on more than one day.
Local attractions visited
Sixty-eight percent of visitor groups visited other attractions in the local area. The most commonly visited attractions were Cloudcroft, Sacramento Mts. (54%), Ruidoso, Sacramento Mts. (41%), and Lincoln National Forest (41%).
Places visited The most commonly visited places in the park were the visitor center/
bookstore (73%), the Dunes Drive (73%), and the gift store (59%). Activities on this visit
The most common activities were general sightseeing (77%), stopping at scenic overlooks/pullouts (52%), and shopping in the park gift store (47%). The most important activity was general sightseeing (39%).
Activities on future visit
On a future visit, 64% percent of visitor groups were interested in general sightseeing and 63% were interested in sledding the dunes.
Ranger-led activities/ programs
Twelve percent of visitor groups attended ranger-led activities/programs at the park. Of those visitor groups who did not attend ranger-led activities/ programs, 71% did not attend due to a lack of time. On a future visit, 57% of visitor groups would likely be interested in attending ranger-led programs and of those, 61% would be interested in a program length of 1/2-1 hour. Thirty-five percent of visitor groups would be interested in interpretive services/ programs on a future visit.
Visitor services and facilities
The visitor services and facilities most commonly used by visitor groups were restrooms (79%), park brochure/map (69%), and the gift shop (53%).
Park gift store sales items
Fifteen percent of visitor groups bought food items from the park gift store. Of those, 67% rated the quality as “very good” or “good.” Thirty-eight percent of visitor groups would prefer to have more picnic items available on a future visit.
Protecting park attributes, resources, and experiences
The highest combined proportions of “extremely important” and “very important” ratings of protecting natural, scenic, and cultural resources included clean water (97%), clean air (visibility) (96%), and scenic views (95%).

White Sands National Monument – VSP Visitor Study 253 July 17-23, 2012
vii
Executive Summary (continued) Expenditures The average visitor group expenditure (inside and outside the park) was
$291. The median group expenditure (50% of groups spent more and 50% of groups spent less) was $108, and the average total expenditure per person (per capita) was $88.
Overall quality Most visitor groups (91%) rated the overall quality of facilities, services, and
recreational opportunities at White Sands National Monument as “very good” or “good.” Less than 1% of groups rated the overall quality as “very poor” or “poor.”
For more information about the Visitor Services Project, please contact the Park Studies Unit at the University of Idaho at (208) 885-2585 or the following website http://www.psu.uidaho.edu.
White Sands National Monument – VSP Visitor Study 253 July 17-23, 2012
viii
Acknowledgements We thank Ally Begly for compiling the report, Beth Barrie for overseeing the fieldwork, Robert Sandlin and the staff and volunteers of White Sands National Monument for assisting with the survey, and Matthew Strawn for data processing. About the Authors Ally Begly is a research assistant for the Visitor Services Project. Beth Barrie, Ph.D., is project manager for the Interagency Volunteer Program of Public Lands Institute at the University of Nevada, Las Vegas. Yen Le, Ph.D., is Director of the Visitor Services Project at the University of Idaho, and Steven Hollenhorst, Ph.D., was the Director of the Park Studies Unit, Department of Conservation Social Sciences, University of Idaho.

White Sands National Monument – VSP Visitor Study 253 July 17-23, 2012
1
Introduction This report describes the results of a visitor study at White Sands National Monument in Alamogordo, NM conducted July 17-23, 2012 by the National Park Service (NPS) Visitor Services Project (VSP), part of the Park Studies Unit (PSU) at the University of Idaho. As described in the National Park Service website for White Sands National Monument, “Rising from the heart of the Tularosa Basin is one of the world's great natural wonders - the glistening white sands of New Mexico. Great wave-like dunes of gypsum sand have engulfed 275 square miles of desert, creating the world's largest gypsum dunefield. White Sands National Monument preserves a major portion of this unique dune field, along with the plants and animals that live here.” (www.nps.gov/whsa, retrieved January 2013). Organization of the Report This report is organized into three sections. Section 1: Methods This section discusses the procedures, limitations, and special conditions that may affect the study results. Section 2: Results This section provides a summary for each question in the questionnaire and includes visitor comments to open-ended questions. The presentation of the results of this study does not follow the order of questions in the questionnaire. Section 3: Appendices Appendix 1. The Questionnaire. A copy of the questionnaire distributed to visitor groups. Appendix 2. Additional Analysis. A list of sample questions for cross-references and cross comparisons. Comparisons can be analyzed within a park or between parks. Results of additional analyses are not included in this report. Appendix 3. Decision Rules for Checking Non-response Bias. An explanation of how the non-response bias was determined.
White Sands National Monument – VSP Visitor Study 253 July 17-23, 2012
2
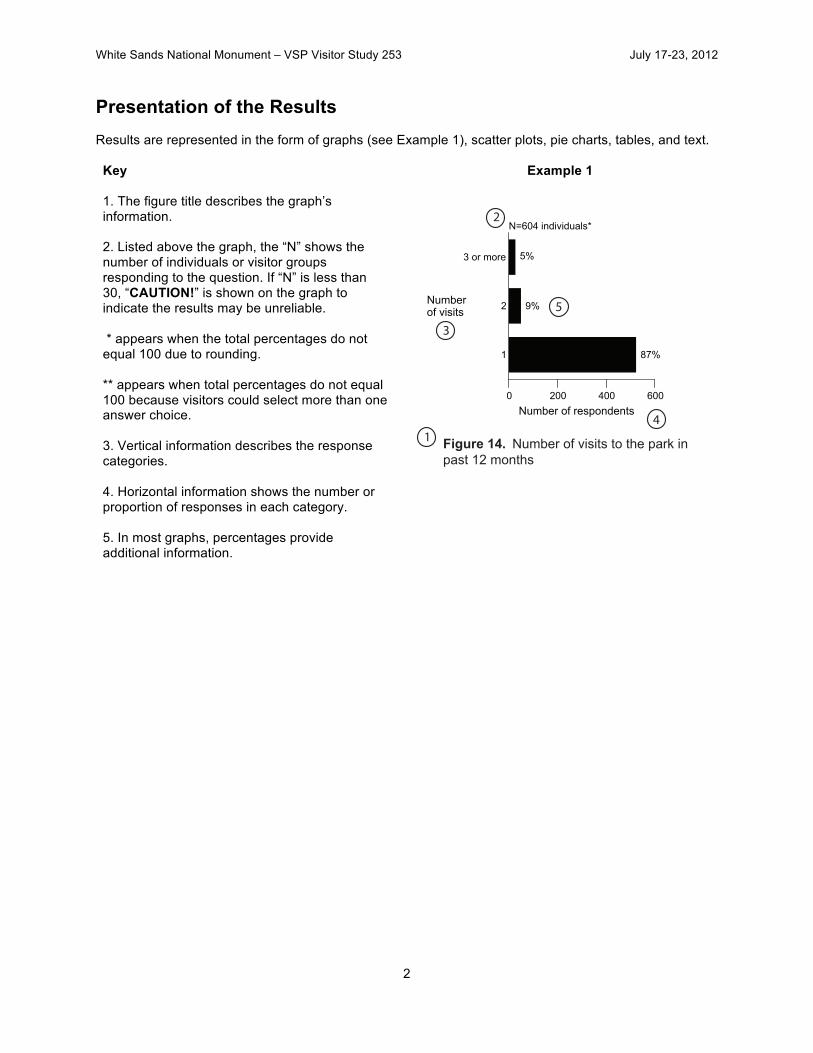
Presentation of the Results Results are represented in the form of graphs (see Example 1), scatter plots, pie charts, tables, and text. Key 1. The figure title describes the graph’s information. 2. Listed above the graph, the “N” shows the number of individuals or visitor groups responding to the question. If “N” is less than 30, “CAUTION!” is shown on the graph to indicate the results may be unreliable. * appears when the total percentages do not equal 100 due to rounding. ** appears when total percentages do not equal 100 because visitors could select more than one answer choice. 3. Vertical information describes the response categories. 4. Horizontal information shows the number or proportion of responses in each category. 5. In most graphs, percentages provide additional information.
Example 1
0 200 400 600
Number of respondents
1
2
3 or more
87%
9%
5%
N=604 individuals*
Numberof visits
1Figure 14. Number of visits to the park in
past 12 months
2
3
4
5
White Sands National Monument – VSP Visitor Study 253 July 17-23, 2012
3
Methods
Survey Design and Procedures Sample size and sampling plan All VSP questionnaires follow design principles outlined in Don A. Dillman’s book Mail and Internet Surveys: The Tailored Design Method (2007). Using this method, the sample size was calculated based on the park visitation statistics of previous years. Brief interviews were conducted with a systematic, random sample of visitor groups that arrived at the main entrance during July 17-23, 2012. Visitors were surveyed between the hours of 9 a.m. and 5 p.m. During this survey, 477 visitor groups were contacted and 440 of these groups (92.2%) accepted questionnaires. (The average acceptance rate for 250 VSP visitor studies conducted from 1988 through 2011 is 91.5%.) Questionnaires were completed and returned by 226 respondents, resulting in a 51.4% response rate for this study. (The average response rate for the 250 VSP visitor studies is 72.3%.) Questionnaire design
The White Sands National Monument questionnaire was developed at a workshop held with park staff to design and prioritize questions. Some of the questions were comparable with VSP studies conducted at other parks while others were customized for White Sands National Monument. Many questions ask respondents to choose answers from a list of responses, often with an open-ended option, while others are completely open-ended. No pilot study was conducted to test the White Sands National Monument questionnaire. However, all questions followed Office Management and Budget (OMB) guidelines and/or were used in previous surveys; thus, the clarity and consistency of the survey instrument have been tested and supported.
White Sands National Monument – VSP Visitor Study 253 July 17-23, 2012
4
Survey procedure Visitor groups were greeted, briefly introduced to the purpose of the study, and asked to participate. If visitors agreed, they were asked which member (at least 16 years old) had the next birthday. The individual with the next birthday was selected to complete the questionnaire for the group. An interview, lasting approximately two minutes, was conducted with that person to determine group size, group type, the age of the member completing the questionnaire, and how this visit to the park fit into their group’s travel plans. These individuals were asked their names, addresses, and telephone numbers or email addresses in order to mail them a reminder/thank-you postcard and follow-ups. Participants were asked to complete the survey after their visit, and return it using the Business Reply Mail envelope provided. Two weeks following the survey, a reminder/thank-you postcard was mailed to all participants who provided a valid mailing address (see Table 1). Replacement questionnaires were mailed to participants who had not returned their questionnaires four weeks after the survey. Seven weeks after the survey, a second round of replacement questionnaires was mailed to participants who had not returned their questionnaires. Table 1. Follow-up mailing distribution
Mailing Date U.S. International Total
Postcards August 7, 2012 385 29 414 1st replacement August 21, 2012 272 18 290 2nd replacement September 11, 2012 228 0 228
Data analysis
Returned questionnaires were coded and the responses were processed using custom and standard statistical software applications—Statistical Analysis Software® (SAS), and a custom designed FileMaker Pro® application. Descriptive statistics and cross-tabulations were calculated for the coded data; responses to open-ended questions were categorized and summarized. Double-key data entry validation was performed on numeric and text entry variables and the remaining checkbox (bubble) variables were read by optical mark recognition (OMR) software.
White Sands National Monument – VSP Visitor Study 253 July 17-23, 2012
5
Limitations As with all surveys, this study has limitations that should be considered when interpreting the results.
1. This was a self-administered survey. Respondents completed the questionnaire after their visit, which may have resulted in poor recall. Thus, it is not possible to know whether visitor responses reflected actual behavior.
2. The data reflect visitor use patterns at the selected sites during the study period of July 17-23,
2012. The results present a ‘snapshot in time’ and do not necessarily apply to visitors during other times of the year.
3. Caution is advised when interpreting any data with a sample size of less than 30, as the results
may be unreliable. When the sample size is less than 30, the word “CAUTION!” is included in the graph, figure, table, or text.
4. Occasionally, there may be inconsistencies in the results. Inconsistencies arise from missing data
or incorrect answers (due to misunderstood directions, carelessness, or poor recall of information). Therefore, refer to both the percentage and N (number of individuals or visitor groups) when interpreting the results.
Special conditions The weather during the survey period was sunny and hot, with temperatures in the 90-100 degree range, with occasional overcast and stormy periods. No special events occurred in the area that would have affected the type and amount of visitation to the park.
White Sands National Monument – VSP Visitor Study 253 July 17-23, 2012
6
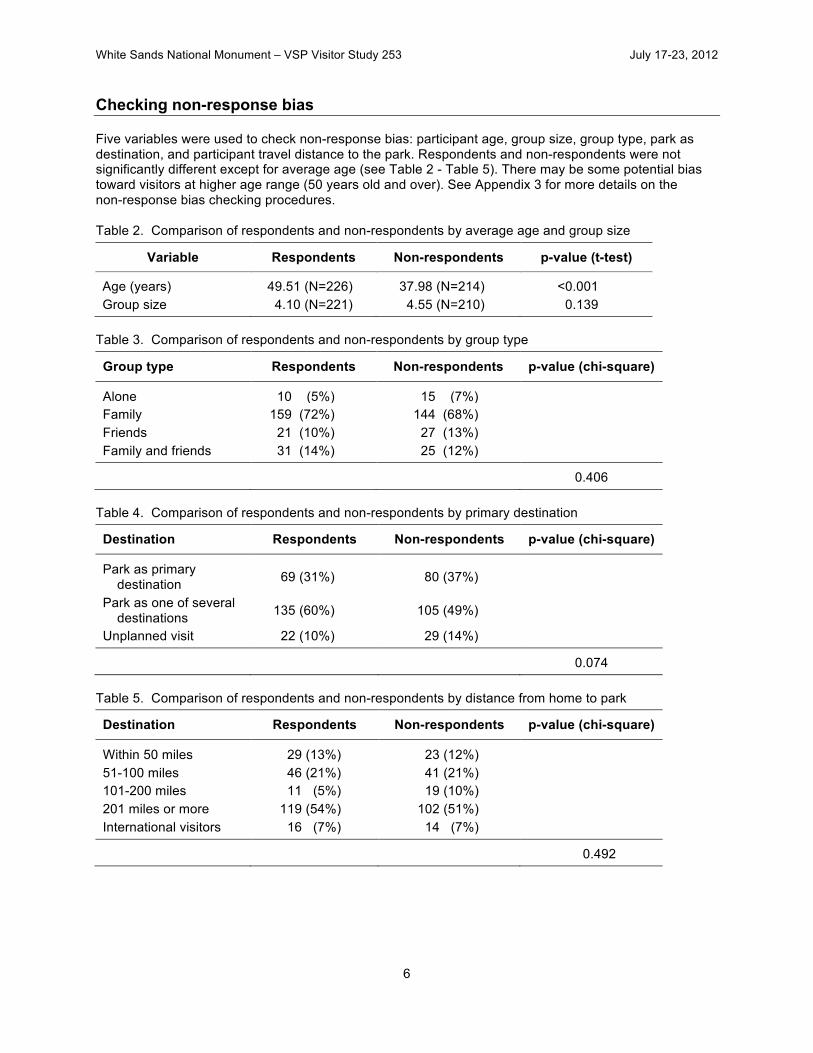
Checking non-response bias Five variables were used to check non-response bias: participant age, group size, group type, park as destination, and participant travel distance to the park. Respondents and non-respondents were not significantly different except for average age (see Table 2 - Table 5). There may be some potential bias toward visitors at higher age range (50 years old and over). See Appendix 3 for more details on the non-response bias checking procedures. Table 2. Comparison of respondents and non-respondents by average age and group size
Variable Respondents Non-respondents p-value (t-test)
Age (years) 49.51 (N=226) 37.98 (N=214) <0.001 Group size 4.10 (N=221) 4.55 (N=210) 0.139
Table 3. Comparison of respondents and non-respondents by group type
Group type Respondents Non-respondents p-value (chi-square)
Alone 10 (5%) 15 (7%) Family 159 (72%) 144 (68%) Friends 21 (10%) 27 (13%) Family and friends 31 (14%) 25 (12%)
0.406 Table 4. Comparison of respondents and non-respondents by primary destination
Destination Respondents Non-respondents p-value (chi-square)
Park as primary destination 69 (31%) 80 (37%)
Park as one of several destinations 135 (60%) 105 (49%)
Unplanned visit 22 (10%) 29 (14%)
0.074 Table 5. Comparison of respondents and non-respondents by distance from home to park
Destination Respondents Non-respondents p-value (chi-square)
Within 50 miles 29 (13%) 23 (12%) 51-100 miles 46 (21%) 41 (21%) 101-200 miles 11 (5%) 19 (10%) 201 miles or more 119 (54%) 102 (51%) International visitors 16 (7%) 14 (7%)
0.492

White Sands National Monument – VSP Visitor Study 253 July 17-23, 2012
7
Results
Group and Visitor Characteristics Visitor group size
Question 20b On this visit, how many people were in your personal group, including yourself?
Results
• 43% of visitor groups consisted of two or three people (see Figure 1).
• 33% were in groups of four or five.
• 18% were in groups of six or more.
Figure 1. Visitor group size
Visitor group type Question 20a
On this visit, which type of personal group (not guided tour/school/other organized group) were you with?
Results
• 72% of visitor groups consisted of family members (see Figure 2).
• 14% were with family and friends.
Figure 2. Visitor group type
0 20 40 60 80
Number of respondents
1
2
3
4
5
6
7 or more
5%
30%
13%
21%
12%
7%
11%
N=221 visitor groups*
Groupsize
0 60 120 180
Number of respondents
Other
Alone
Friends
Family andfriends
Family
0%
5%
10%
14%
72%
N=221 visitor groups*
Grouptype

White Sands National Monument – VSP Visitor Study 253 July 17-23, 2012
8
Visitors with organized groups Question 19a
On this visit, was your personal group with a commercial guided tour group?
Results
• No visitor groups were with a commercial guided tour group (see Figure 3).
Figure 3. Visitors with a commercial guided tour group
Question 19b On this visit, was your personal group with a school/educational group?
Results
• 1% of visitor groups were with a school/educational group (see Figure 4).
Figure 4. Visitors with a school/educational group
Question 19c On this visit, was your personal group with an “other” organized group (scouts, work, church, etc.)?
Results
• 2% of visitor groups were with an “other” organized group (see Figure 5).
Figure 5. Visitors with an “other” organized group
0 70 140 210
Number of respondents
No
Yes
100%
0%
N=204 visitor groups
With commericalguided tourgroup?
0 70 140 210
Number of respondents
No
Yes
99%
1%
N=205 visitor groups
With school/educationalgroup?
0 70 140 210
Number of respondents
No
Yes
98%
2%
N=203 visitor groups
With otherorganizedgroup?
White Sands National Monument – VSP Visitor Study 253 July 17-23, 2012
9
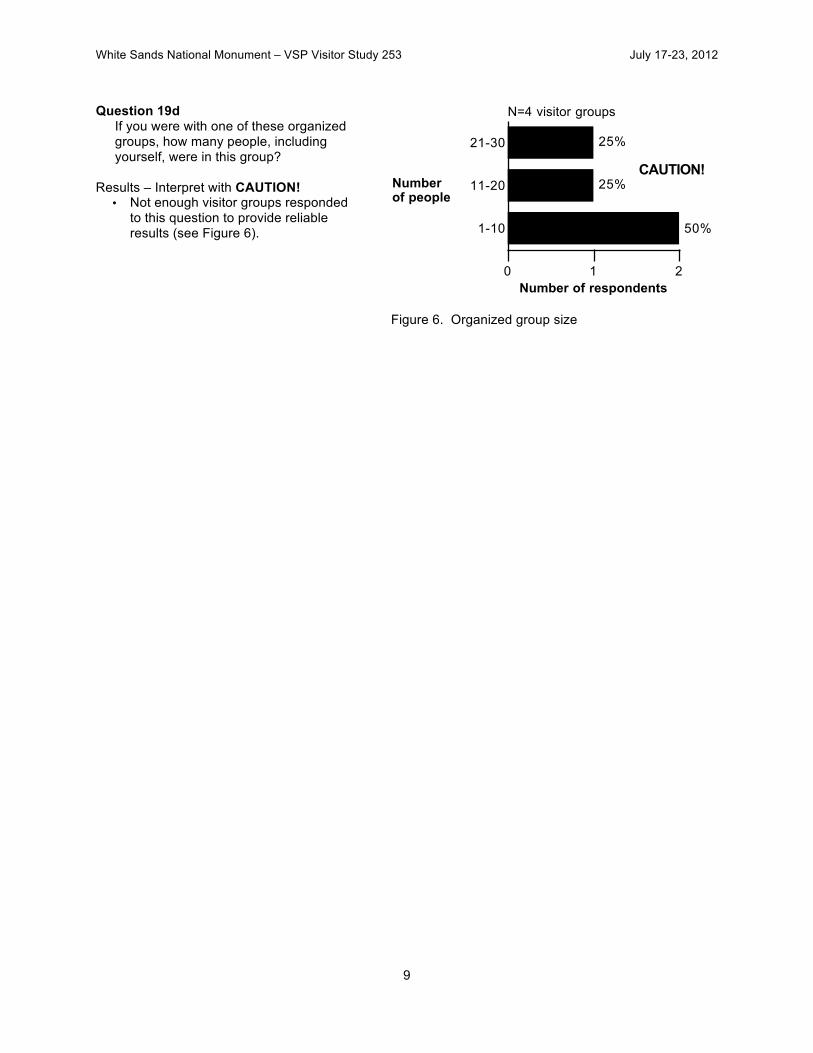
Question 19d If you were with one of these organized groups, how many people, including yourself, were in this group?
Results – Interpret with CAUTION!
• Not enough visitor groups responded to this question to provide reliable results (see Figure 6).
Figure 6. Organized group size
0 1 2
Number of respondents
1-10
11-20
21-30
50%
25%
25%
N=4 visitor groups
Numberof people
CAUTION!
White Sands National Monument – VSP Visitor Study 253 July 17-23, 2012
10
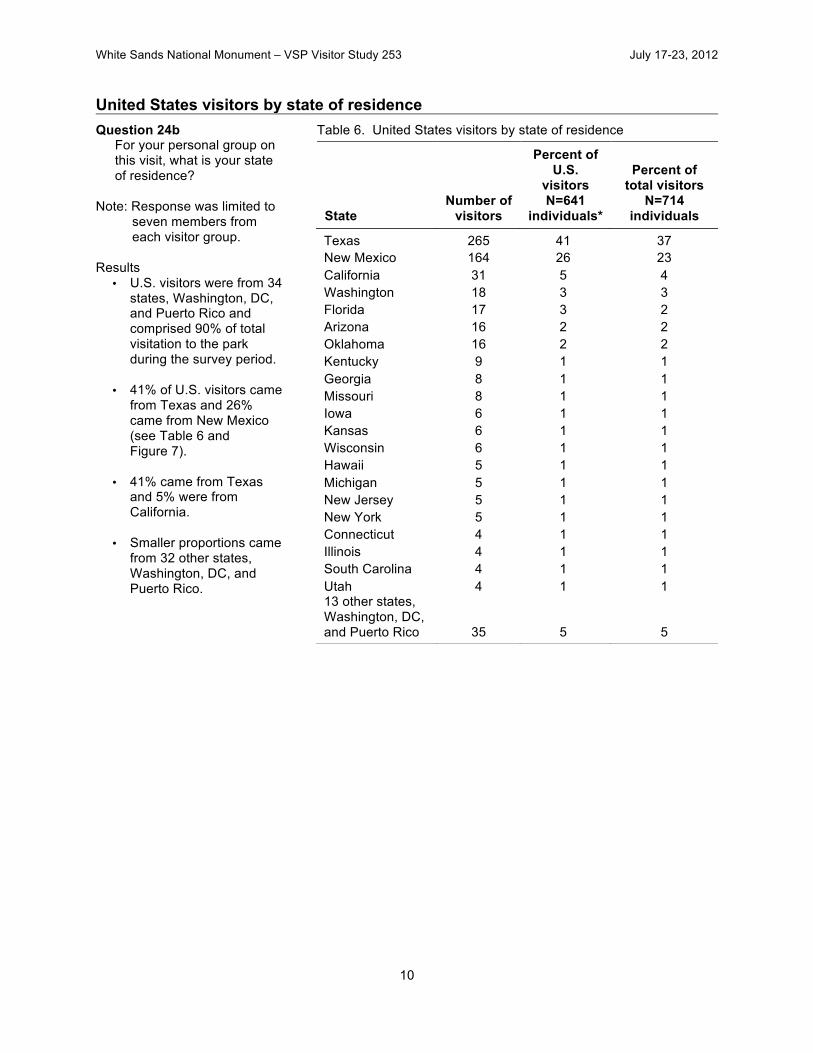
United States visitors by state of residence Question 24b
For your personal group on this visit, what is your state of residence?
Note: Response was limited to
seven members from each visitor group.
Results
• U.S. visitors were from 34 states, Washington, DC, and Puerto Rico and comprised 90% of total visitation to the park during the survey period.
• 41% of U.S. visitors came from Texas and 26% came from New Mexico (see Table 6 and Figure 7).
• 41% came from Texas
and 5% were from California.
• Smaller proportions came
from 32 other states, Washington, DC, and Puerto Rico.
Table 6. United States visitors by state of residence
State Number of
visitors
Percent of U.S.
visitors N=641
individuals*
Percent of total visitors
N=714 individuals
Texas 265 41 37 New Mexico 164 26 23 California 31 5 4 Washington 18 3 3 Florida 17 3 2 Arizona 16 2 2 Oklahoma 16 2 2 Kentucky 9 1 1 Georgia 8 1 1 Missouri 8 1 1 Iowa 6 1 1 Kansas 6 1 1 Wisconsin 6 1 1 Hawaii 5 1 1 Michigan 5 1 1 New Jersey 5 1 1 New York 5 1 1 Connecticut 4 1 1 Illinois 4 1 1 South Carolina 4 1 1 Utah 4 1 1 13 other states, Washington, DC, and Puerto Rico 35 5 5
White Sands National Monument – VSP Visitor Study 253 July 17-23, 2012
11
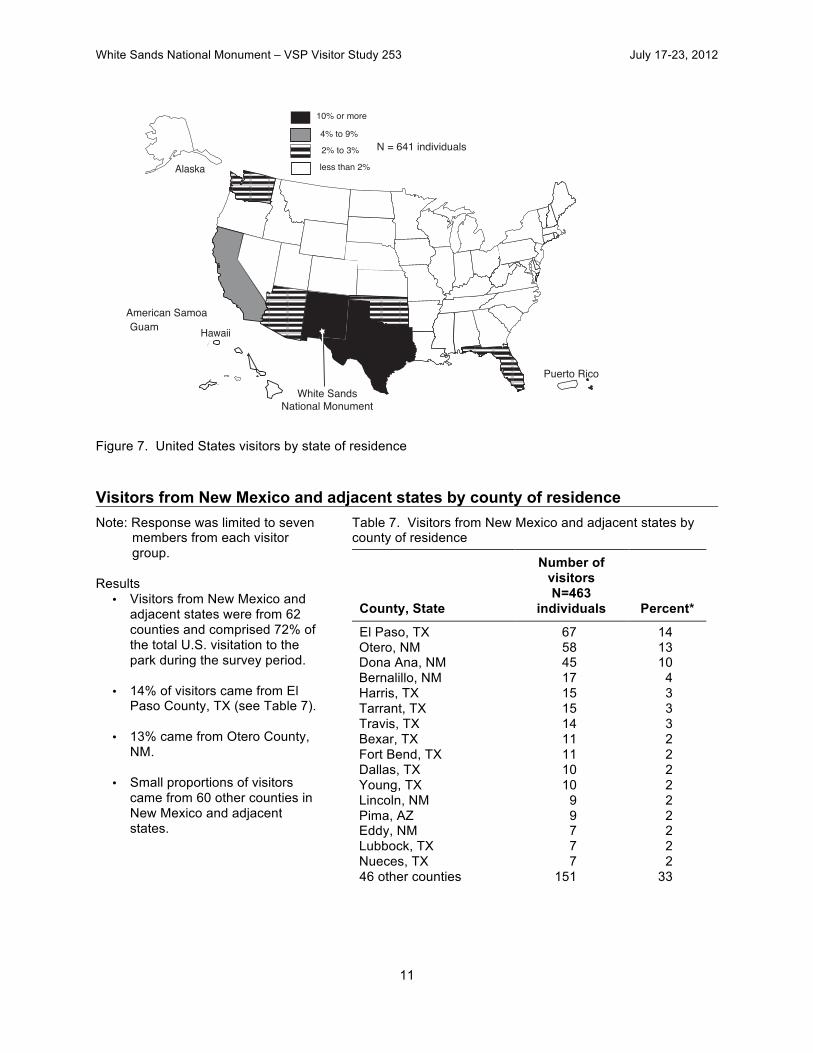
Figure 7. United States visitors by state of residence Visitors from New Mexico and adjacent states by county of residence Note: Response was limited to seven
members from each visitor group.
Results
• Visitors from New Mexico and adjacent states were from 62 counties and comprised 72% of the total U.S. visitation to the park during the survey period.
• 14% of visitors came from El
Paso County, TX (see Table 7).
• 13% came from Otero County, NM.
• Small proportions of visitors
came from 60 other counties in New Mexico and adjacent states.
Table 7. Visitors from New Mexico and adjacent states by county of residence
County, State
Number of visitors N=463
individuals Percent*
El Paso, TX 67 14 Otero, NM 58 13 Dona Ana, NM 45 10 Bernalillo, NM 17 4 Harris, TX 15 3 Tarrant, TX 15 3 Travis, TX 14 3 Bexar, TX 11 2 Fort Bend, TX 11 2 Dallas, TX 10 2 Young, TX 10 2 Lincoln, NM 9 2 Pima, AZ 9 2 Eddy, NM 7 2 Lubbock, TX 7 2 Nueces, TX 7 2 46 other counties 151 33
Alaska
American Samoa
Guam
Puerto Rico
Hawaii
White Sands
National Monument
10% or more
4% to 9%
2% to 3%
less than 2%
N = 641 individuals
White Sands National Monument – VSP Visitor Study 253 July 17-23, 2012
12
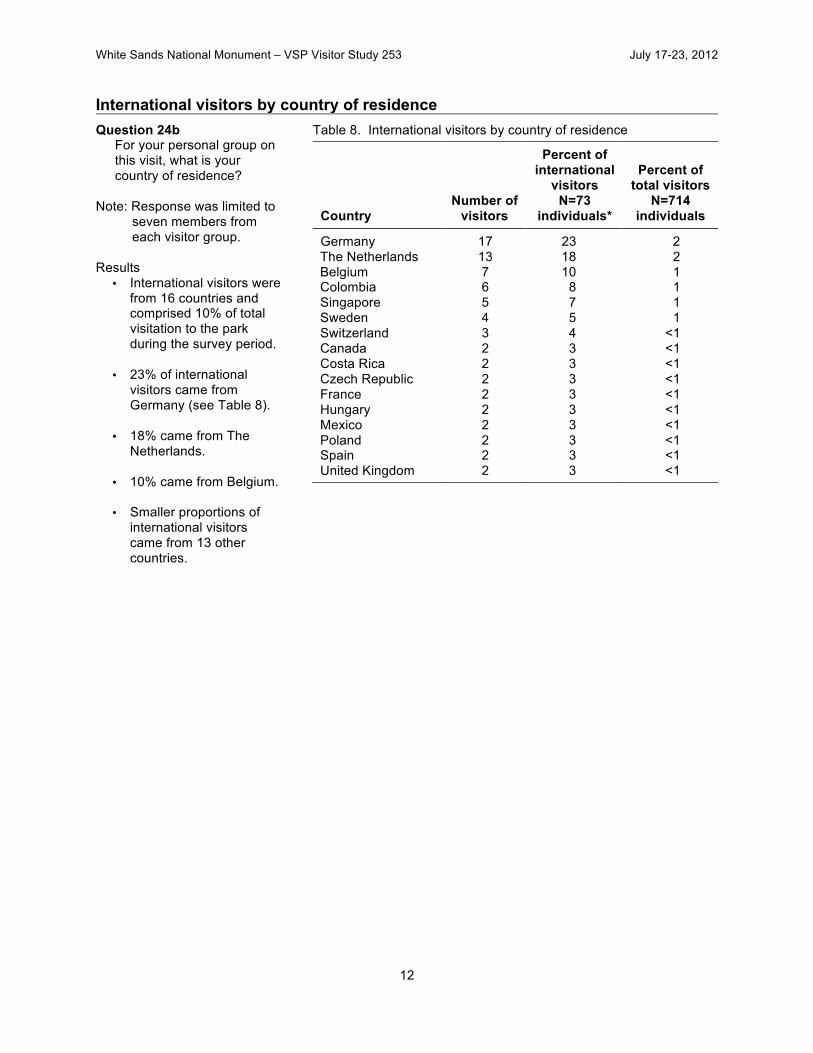
International visitors by country of residence Question 24b
For your personal group on this visit, what is your country of residence?
Note: Response was limited to
seven members from each visitor group.
Results
• International visitors were from 16 countries and comprised 10% of total visitation to the park during the survey period.
• 23% of international
visitors came from Germany (see Table 8).
• 18% came from The
Netherlands.
• 10% came from Belgium.
• Smaller proportions of international visitors came from 13 other countries.
Table 8. International visitors by country of residence
Country Number of
visitors
Percent of international
visitors N=73
individuals*
Percent of total visitors
N=714 individuals
Germany 17 23 2 The Netherlands 13 18 2 Belgium 7 10 1 Colombia 6 8 1 Singapore 5 7 1 Sweden 4 5 1 Switzerland 3 4 <1 Canada 2 3 <1 Costa Rica 2 3 <1 Czech Republic 2 3 <1 France 2 3 <1 Hungary 2 3 <1 Mexico 2 3 <1 Poland 2 3 <1 Spain 2 3 <1 United Kingdom 2 3 <1
White Sands National Monument – VSP Visitor Study 253 July 17-23, 2012
13
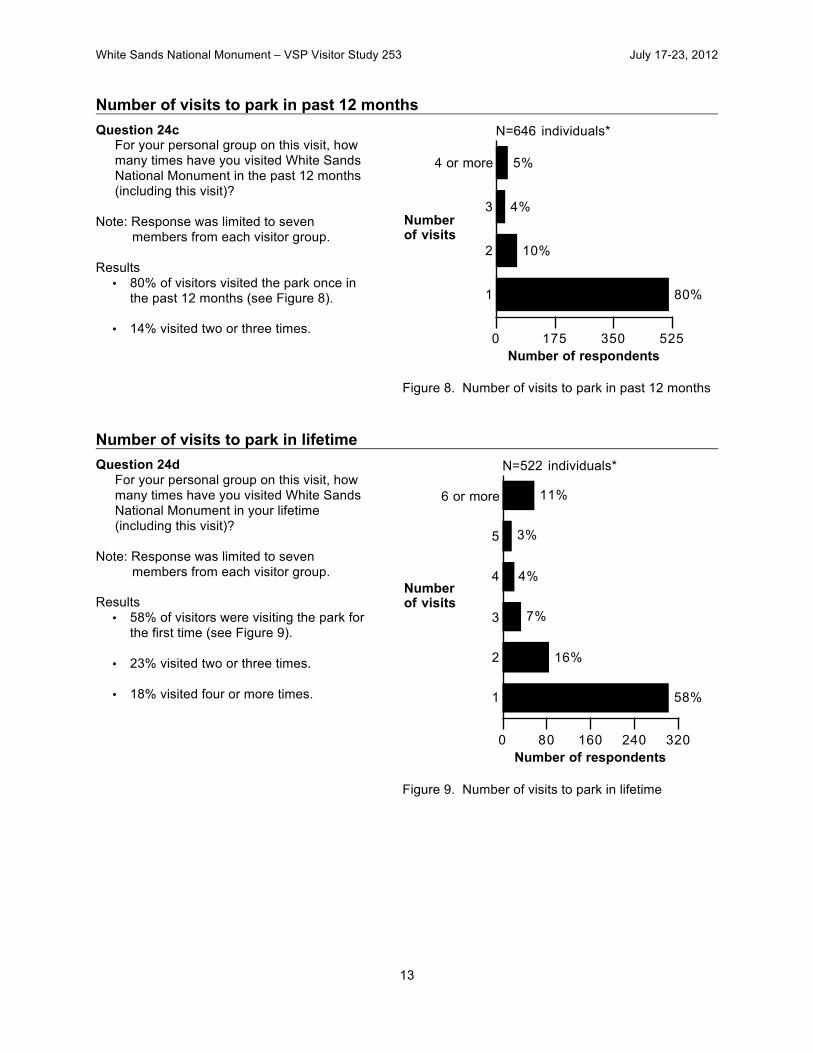
Number of visits to park in past 12 months Question 24c
For your personal group on this visit, how many times have you visited White Sands National Monument in the past 12 months (including this visit)?
Note: Response was limited to seven
members from each visitor group. Results
• 80% of visitors visited the park once in the past 12 months (see Figure 8).
• 14% visited two or three times.
Figure 8. Number of visits to park in past 12 months
Number of visits to park in lifetime Question 24d
For your personal group on this visit, how many times have you visited White Sands National Monument in your lifetime (including this visit)?
Note: Response was limited to seven
members from each visitor group. Results
• 58% of visitors were visiting the park for the first time (see Figure 9).
• 23% visited two or three times.
• 18% visited four or more times.
Figure 9. Number of visits to park in lifetime
0 175 350 525
Number of respondents
1
2
3
4 or more
80%
10%
4%
5%
N=646 individuals*
Numberof visits
0 80 160 240 320
Number of respondents
1
2
3
4
5
6 or more
58%
16%
7%
4%
3%
11%
N=522 individuals*
Numberof visits
White Sands National Monument – VSP Visitor Study 253 July 17-23, 2012
14
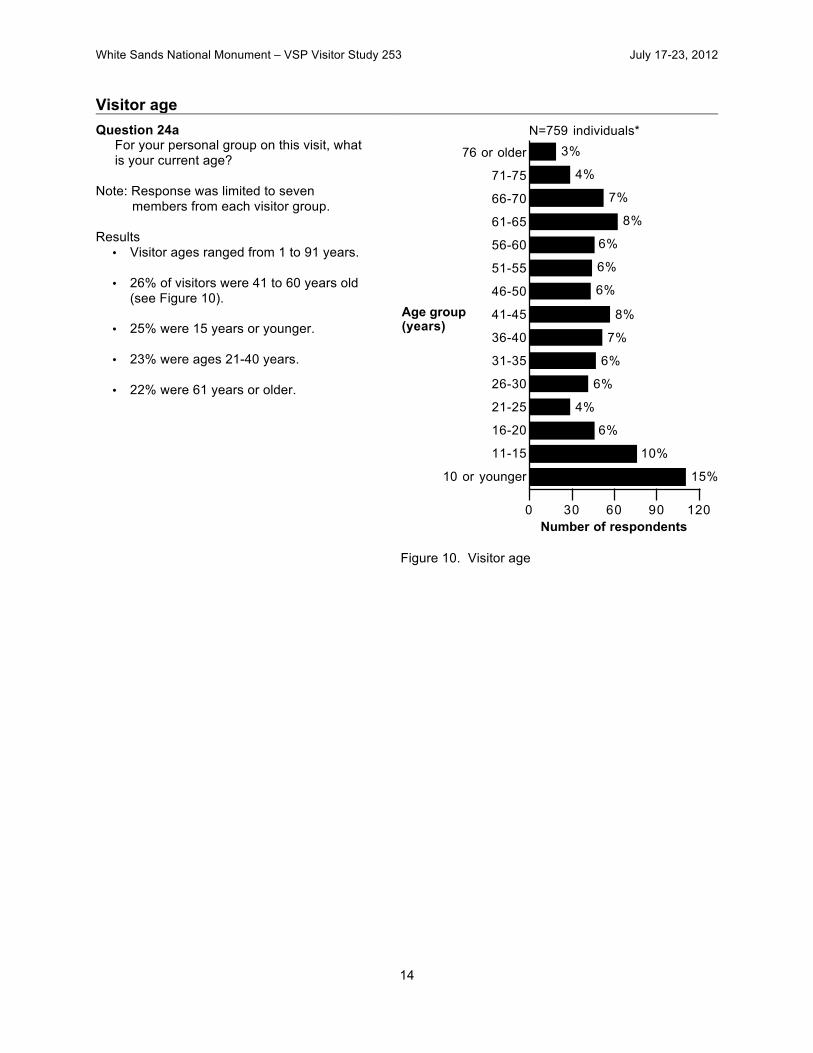
Visitor age Question 24a
For your personal group on this visit, what is your current age?
Note: Response was limited to seven
members from each visitor group. Results
• Visitor ages ranged from 1 to 91 years.
• 26% of visitors were 41 to 60 years old (see Figure 10).
• 25% were 15 years or younger.
• 23% were ages 21-40 years.
• 22% were 61 years or older.
Figure 10. Visitor age
0 30 60 90 120
Number of respondents
10 or younger
11-15
16-20
21-25
26-30
31-35
36-40
41-45
46-50
51-55
56-60
61-65
66-70
71-75
76 or older
15%
10%
6%
4%
6%
6%
7%
8%
6%
6%
6%
8%
7%
4%
3%
N=759 individuals*
Age group(years)
White Sands National Monument – VSP Visitor Study 253 July 17-23, 2012
15
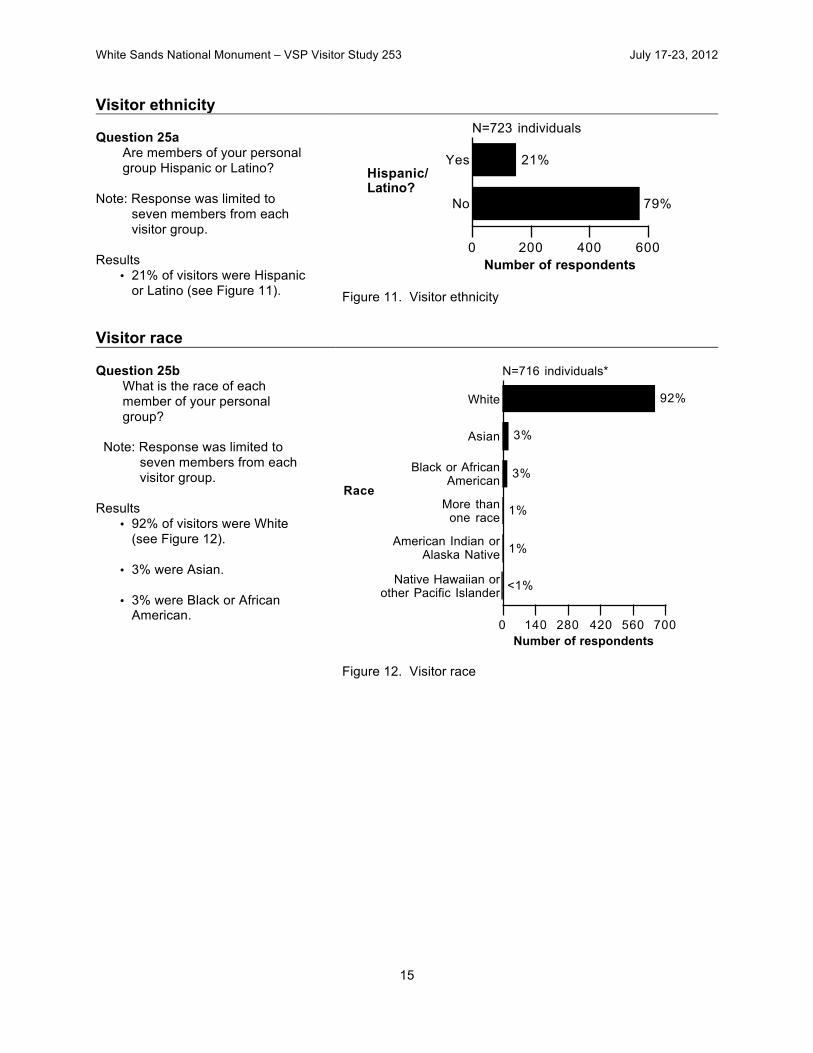
Visitor ethnicity
Question 25a Are members of your personal group Hispanic or Latino?
Note: Response was limited to
seven members from each visitor group.
Results
• 21% of visitors were Hispanic or Latino (see Figure 11).
Figure 11. Visitor ethnicity
Visitor race
Question 25b What is the race of each member of your personal group?
Note: Response was limited to
seven members from each visitor group.
Results
• 92% of visitors were White (see Figure 12).
• 3% were Asian.
• 3% were Black or African American.
Figure 12. Visitor race
0 200 400 600
Number of respondents
No
Yes
79%
21%
N=723 individuals
Hispanic/Latino?
0 140 280 420 560 700
Number of respondents
Native Hawaiian or
other Pacific Islander
American Indian or
Alaska Native
More than
one race
Black or African
American
Asian
White
<1%
1%
1%
3%
3%
92%
N=716 individuals*
Race

White Sands National Monument – VSP Visitor Study 253 July 17-23, 2012
16
Language used for speaking and reading Question 22a
When visiting an area such as White Sands National Monument what language(s) do most members of your personal group prefer to use for speaking?
Results
• 92% of visitor groups preferred English for speaking (see Figure 13).
• “Other” languages (7%) are listed in
Table 9. Figure 13. Language preferred for speaking
Question 22a When visiting an area such as White Sands National Monument what language(s) do most members of your personal group prefer to use for reading?
Results
• 88% of visitor groups preferred English for reading (see Figure 14).
• “Other” languages (6%) are listed in
Table 10.
Figure 14. Language preferred for reading
Table 9. “Other” languages preferred for speaking (N=12 comments) – CAUTION!
Language Number of times
mentioned German 6 Danish 1 Dutch 1 French 1 Gujarati 1 Korean 1 Polish 1
Table 10. “Other” languages preferred for reading (N=12 comments) – CAUTION!
Language Number of times
mentioned German 7 Danish 1 Dutch 1 French 1 Gujarati 1 Polish 1
0 50 100 150 200 250
Number of respondents
Other
Spanish
English
7%
7%
92%
N=225 visitor groups*
Language
0 50 100 150 200
Number of respondents
Other
Spanish
English
6%
6%
88%
N=225 visitor groups
Language
White Sands National Monument – VSP Visitor Study 253 July 17-23, 2012
17
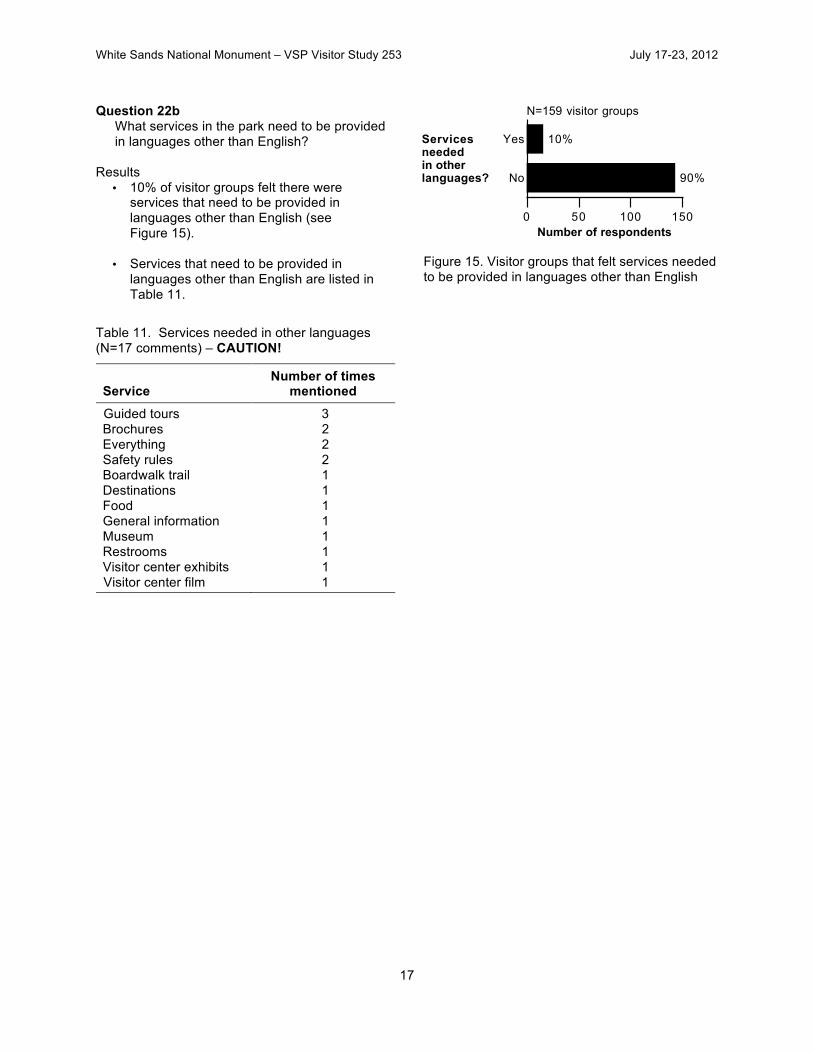
Question 22b What services in the park need to be provided in languages other than English?
Results
• 10% of visitor groups felt there were services that need to be provided in languages other than English (see Figure 15).
• Services that need to be provided in
languages other than English are listed in Table 11.
Figure 15. Visitor groups that felt services needed to be provided in languages other than English
Table 11. Services needed in other languages (N=17 comments) – CAUTION!
Service Number of times
mentioned Guided tours 3 Brochures 2 Everything 2 Safety rules 2 Boardwalk trail 1 Destinations 1 Food 1 General information 1 Museum 1 Restrooms 1 Visitor center exhibits 1 Visitor center film 1
0 50 100 150Number of respondents
No
Yes
90%
10%
N=159 visitor groups
Servicesneededin otherlanguages?
White Sands National Monument – VSP Visitor Study 253 July 17-23, 2012
18
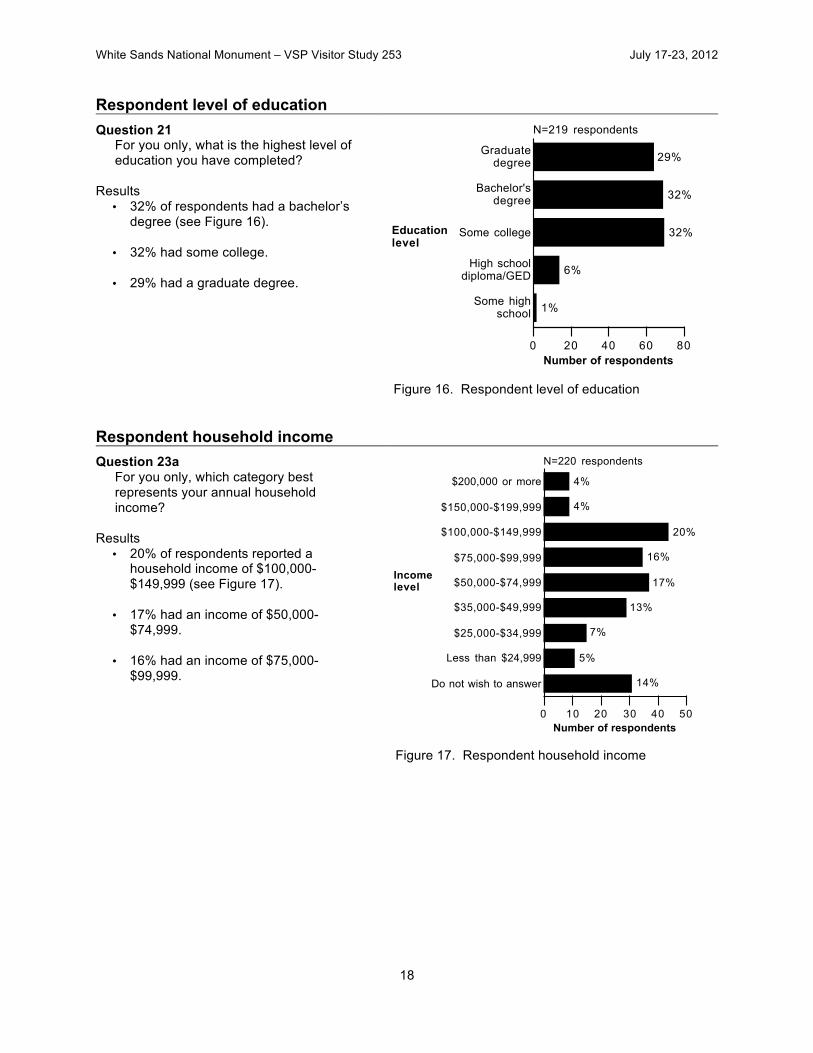
Respondent level of education Question 21
For you only, what is the highest level of education you have completed?
Results
• 32% of respondents had a bachelor’s degree (see Figure 16).
• 32% had some college.
• 29% had a graduate degree.
Figure 16. Respondent level of education
Respondent household income Question 23a
For you only, which category best represents your annual household income?
Results
• 20% of respondents reported a household income of $100,000-$149,999 (see Figure 17).
• 17% had an income of $50,000-
$74,999.
• 16% had an income of $75,000-$99,999.
Figure 17. Respondent household income
0 20 40 60 80
Number of respondents
Some highschool
High schooldiploma/GED
Some college
Bachelor'sdegree
Graduatedegree
1%
6%
32%
32%
29%
N=219 respondents
Educationlevel
0 10 20 30 40 50Number of respondents
Do not wish to answer
Less than $24,999
$25,000-$34,999
$35,000-$49,999
$50,000-$74,999
$75,000-$99,999
$100,000-$149,999
$150,000-$199,999
$200,000 or more
14%
5%
7%
13%
17%
16%
20%
4%
4%
N=220 respondents
Incomelevel
White Sands National Monument – VSP Visitor Study 253 July 17-23, 2012
19
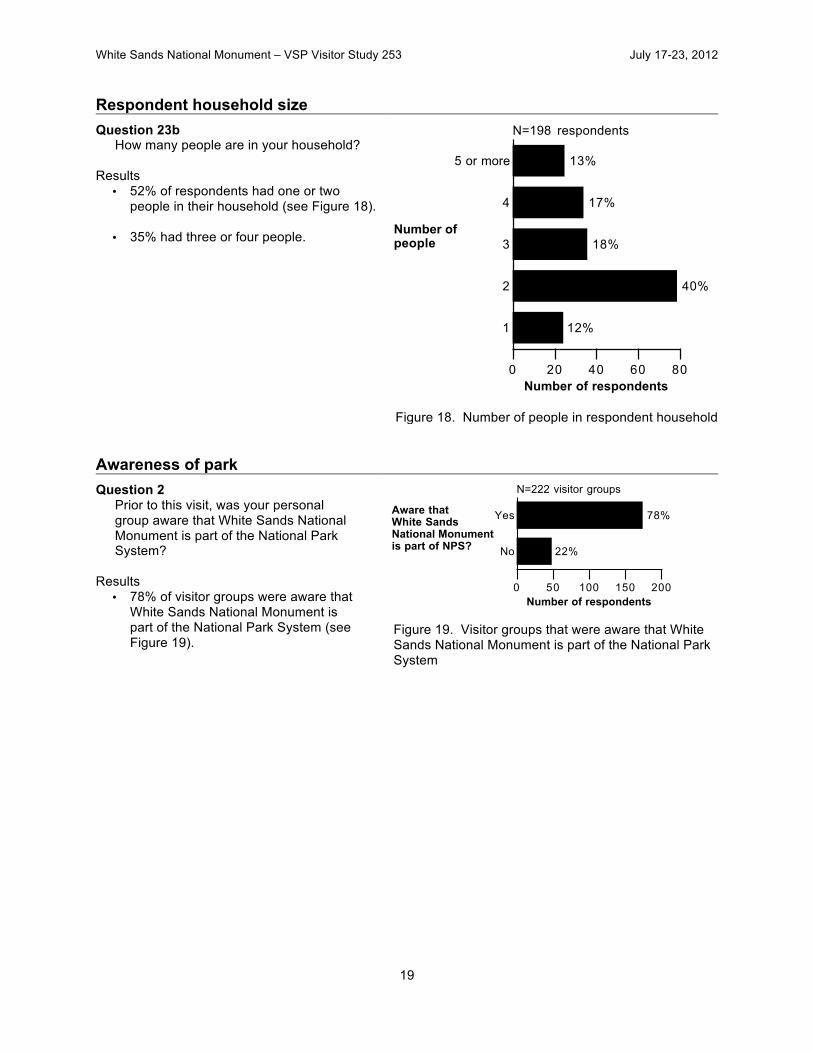
Respondent household size Question 23b
How many people are in your household? Results
• 52% of respondents had one or two people in their household (see Figure 18).
• 35% had three or four people.
Figure 18. Number of people in respondent household
Awareness of park Question 2
Prior to this visit, was your personal group aware that White Sands National Monument is part of the National Park System?
Results
• 78% of visitor groups were aware that White Sands National Monument is part of the National Park System (see Figure 19).
Figure 19. Visitor groups that were aware that White Sands National Monument is part of the National Park System
0 20 40 60 80
Number of respondents
1
2
3
4
5 or more
12%
40%
18%
17%
13%
N=198 respondents
Number ofpeople
0 50 100 150 200
Number of respondents
No
Yes
22%
78%
N=222 visitor groups
Aware thatWhite SandsNational Monumentis part of NPS?

White Sands National Monument – VSP Visitor Study 253 July 17-23, 2012
20
Trip/Visit Characteristics and Preferences Information sources prior to visit Question 1a
Prior to this visit, how did your personal group obtain information about White Sands National Monument?
Results
• 80% of visitor groups obtained information about White Sands National Monument prior to their visit (see Figure 20).
• As shown in Figure 21, among those
visitor groups that obtained information about White Sands National Monument prior to their visit, the most common sources used were:
48% Friends/relatives/word of mouth 44% Previous visits 31% Park website
(www.nps.gov/whsa) 30% Maps/brochures
• “Other” sources (5%) were:
GPS Grew up here Live in El Paso Live in local area Lived in New Mexico for 40 years Road signs
Figure 20. Visitor groups that obtained information prior to visit
Figure 21. Sources of information used by visitor groups prior to visit
0 50 100 150 200
Number of respondents
No
Yes
20%
80%
N=225 visitor groups
Obtainedinformation?
0 25 50 75 100Number of respondents
Other
Social media
School class/program
Television/radioprograms/DVDs
Local businesses
Other tourist sites(non-NPS)
Other websites
Other unitsof the NPS
Newspaper/magazine articles
Inquiry to park viaphone, mail, or email
State welcome center/visitors bureau/
chamber of commerce
Travel guides/tour books
Maps/brochures
Park website(www.nps.gov/whsa)
Previous visits
Friends/relatives/word of mouth
5%
0%
2%
2%
4%
4%
4%
7%
8%
9%
11%
14%
30%
31%
44%
48%
N=181 visitor groups**
Source ofinformation
White Sands National Monument – VSP Visitor Study 253 July 17-23, 2012
21
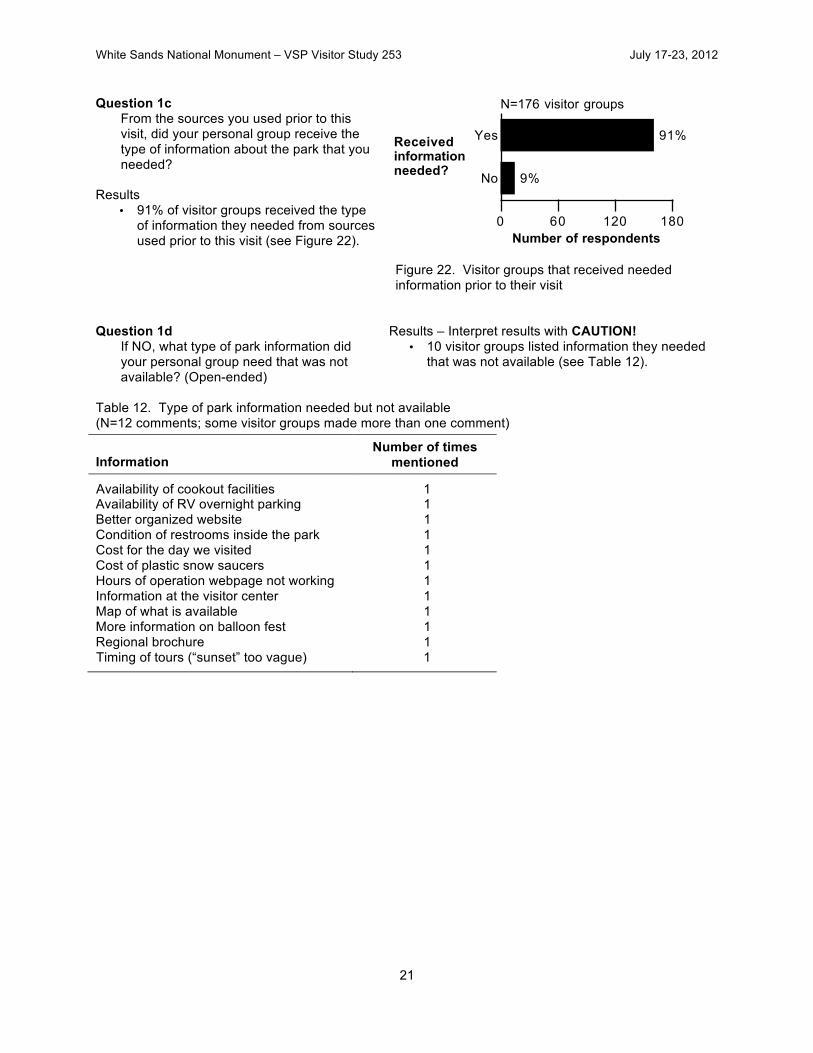
Question 1c From the sources you used prior to this visit, did your personal group receive the type of information about the park that you needed?
Results
• 91% of visitor groups received the type of information they needed from sources used prior to this visit (see Figure 22).
Figure 22. Visitor groups that received needed information prior to their visit
Question 1d If NO, what type of park information did your personal group need that was not available? (Open-ended)
Results – Interpret results with CAUTION! • 10 visitor groups listed information they needed
that was not available (see Table 12).
Table 12. Type of park information needed but not available (N=12 comments; some visitor groups made more than one comment)
Information Number of times
mentioned
Availability of cookout facilities 1 Availability of RV overnight parking 1 Better organized website 1 Condition of restrooms inside the park 1 Cost for the day we visited 1 Cost of plastic snow saucers 1 Hours of operation webpage not working 1 Information at the visitor center 1 Map of what is available 1 More information on balloon fest 1 Regional brochure 1 Timing of tours (“sunset” too vague) 1
0 60 120 180
Number of respondents
No
Yes
9%
91%
N=176 visitor groups
Receivedinformationneeded?
White Sands National Monument – VSP Visitor Study 253 July 17-23, 2012
22
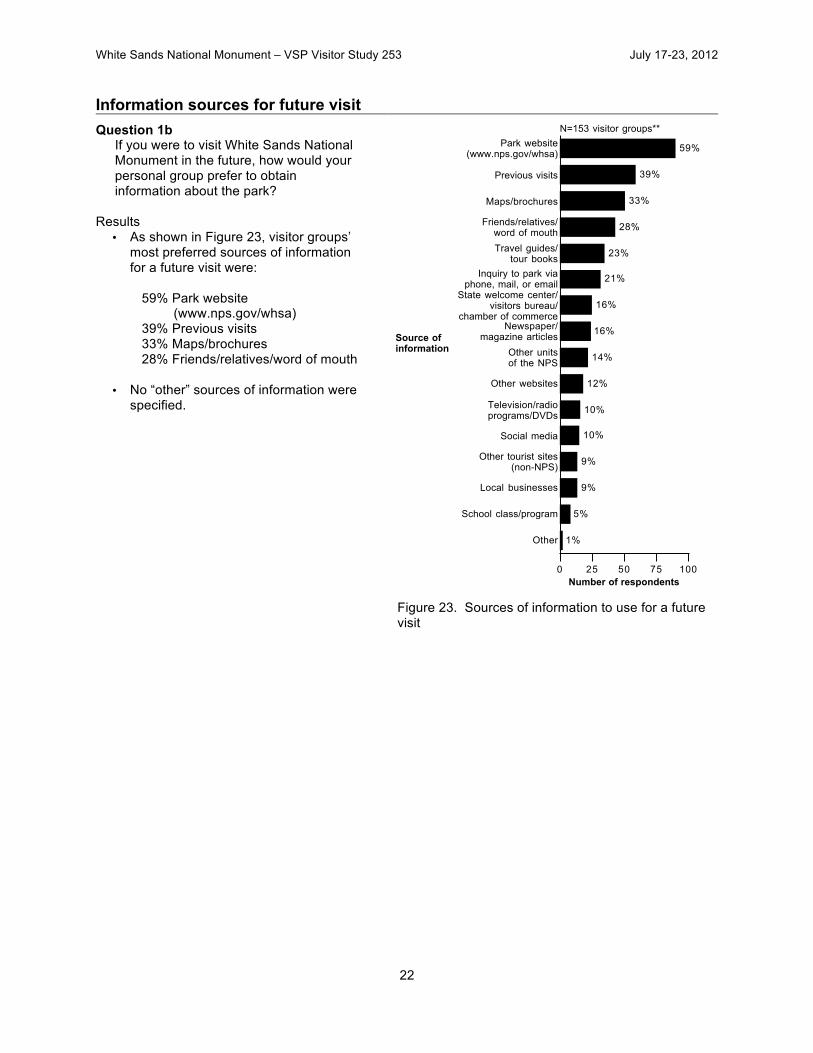
Information sources for future visit Question 1b
If you were to visit White Sands National Monument in the future, how would your personal group prefer to obtain information about the park?
Results
• As shown in Figure 23, visitor groups’ most preferred sources of information for a future visit were:
59% Park website
(www.nps.gov/whsa) 39% Previous visits 33% Maps/brochures 28% Friends/relatives/word of mouth
• No “other” sources of information were
specified.
Figure 23. Sources of information to use for a future visit
0 25 50 75 100Number of respondents
Other
School class/program
Local businesses
Other tourist sites(non-NPS)
Social media
Television/radioprograms/DVDs
Other websites
Other unitsof the NPS
Newspaper/magazine articles
State welcome center/visitors bureau/
chamber of commerce
Inquiry to park viaphone, mail, or email
Travel guides/tour books
Friends/relatives/word of mouth
Maps/brochures
Previous visits
Park website(www.nps.gov/whsa)
1%
5%
9%
9%
10%
10%
12%
14%
16%
16%
21%
23%
28%
33%
39%
59%
N=153 visitor groups**
Source ofinformation
White Sands National Monument – VSP Visitor Study 253 July 17-23, 2012
23
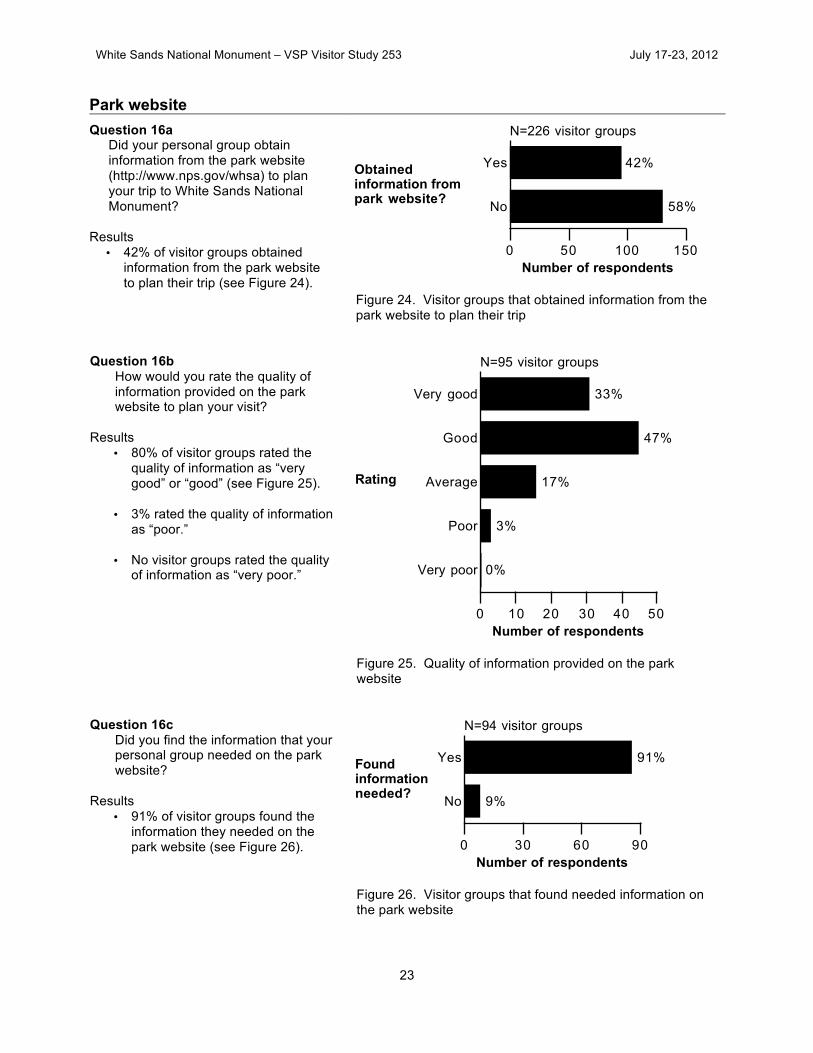
Park website Question 16a
Did your personal group obtain information from the park website (http://www.nps.gov/whsa) to plan your trip to White Sands National Monument?
Results
• 42% of visitor groups obtained information from the park website to plan their trip (see Figure 24).
Figure 24. Visitor groups that obtained information from the park website to plan their trip
Question 16b How would you rate the quality of information provided on the park website to plan your visit?
Results
• 80% of visitor groups rated the quality of information as “very good” or “good” (see Figure 25).
• 3% rated the quality of information as “poor.”
• No visitor groups rated the quality of information as “very poor.”
Figure 25. Quality of information provided on the park website
Question 16c Did you find the information that your personal group needed on the park website?
Results
• 91% of visitor groups found the information they needed on the park website (see Figure 26).
Figure 26. Visitor groups that found needed information on the park website
0 50 100 150
Number of respondents
No
Yes
58%
42%
N=226 visitor groups
Obtainedinformation from park website?
0 10 20 30 40 50
Number of respondents
Very poor
Poor
Average
Good
Very good
0%
3%
17%
47%
33%
N=95 visitor groups
Rating
0 30 60 90
Number of respondents
No
Yes
9%
91%
N=94 visitor groups
Foundinformationneeded?
White Sands National Monument – VSP Visitor Study 253 July 17-23, 2012
24
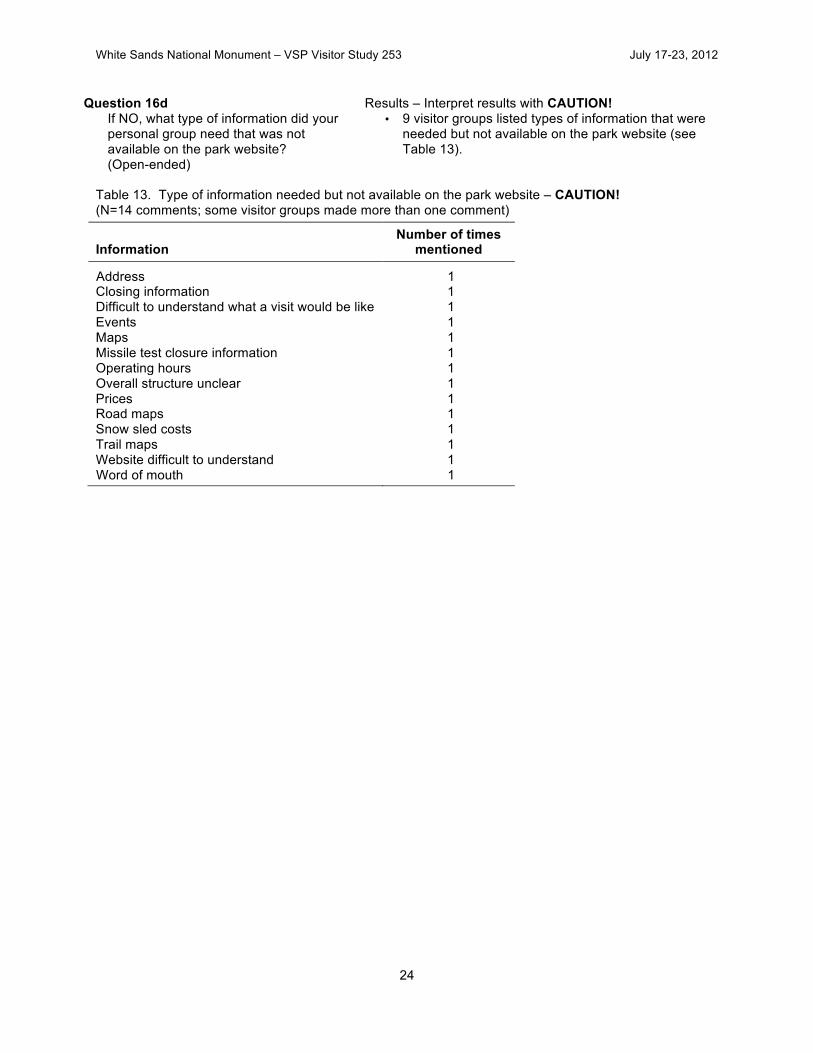
Question 16d If NO, what type of information did your personal group need that was not available on the park website? (Open-ended)
Results – Interpret results with CAUTION! • 9 visitor groups listed types of information that were
needed but not available on the park website (see Table 13).
Table 13. Type of information needed but not available on the park website – CAUTION! (N=14 comments; some visitor groups made more than one comment)
Information Number of times
mentioned
Address 1 Closing information 1 Difficult to understand what a visit would be like 1 Events 1 Maps 1 Missile test closure information 1 Operating hours 1 Overall structure unclear 1 Prices 1 Road maps 1 Snow sled costs 1 Trail maps 1 Website difficult to understand 1 Word of mouth 1
White Sands National Monument – VSP Visitor Study 253 July 17-23, 2012
25
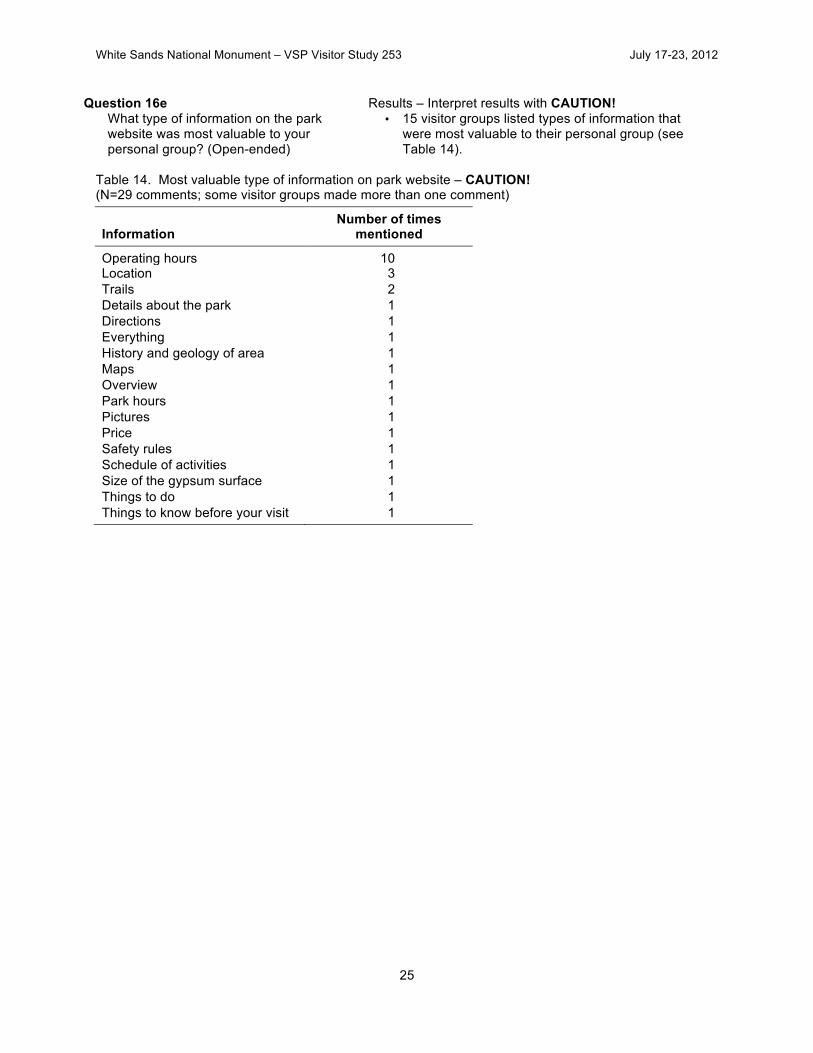
Question 16e What type of information on the park website was most valuable to your personal group? (Open-ended)
Results – Interpret results with CAUTION! • 15 visitor groups listed types of information that
were most valuable to their personal group (see Table 14).
Table 14. Most valuable type of information on park website – CAUTION! (N=29 comments; some visitor groups made more than one comment)
Information Number of times
mentioned
Operating hours 10 Location 3 Trails 2 Details about the park 1 Directions 1 Everything 1 History and geology of area 1 Maps 1 Overview 1 Park hours 1 Pictures 1 Price 1 Safety rules 1 Schedule of activities 1 Size of the gypsum surface 1 Things to do 1 Things to know before your visit 1
White Sands National Monument – VSP Visitor Study 253 July 17-23, 2012
26
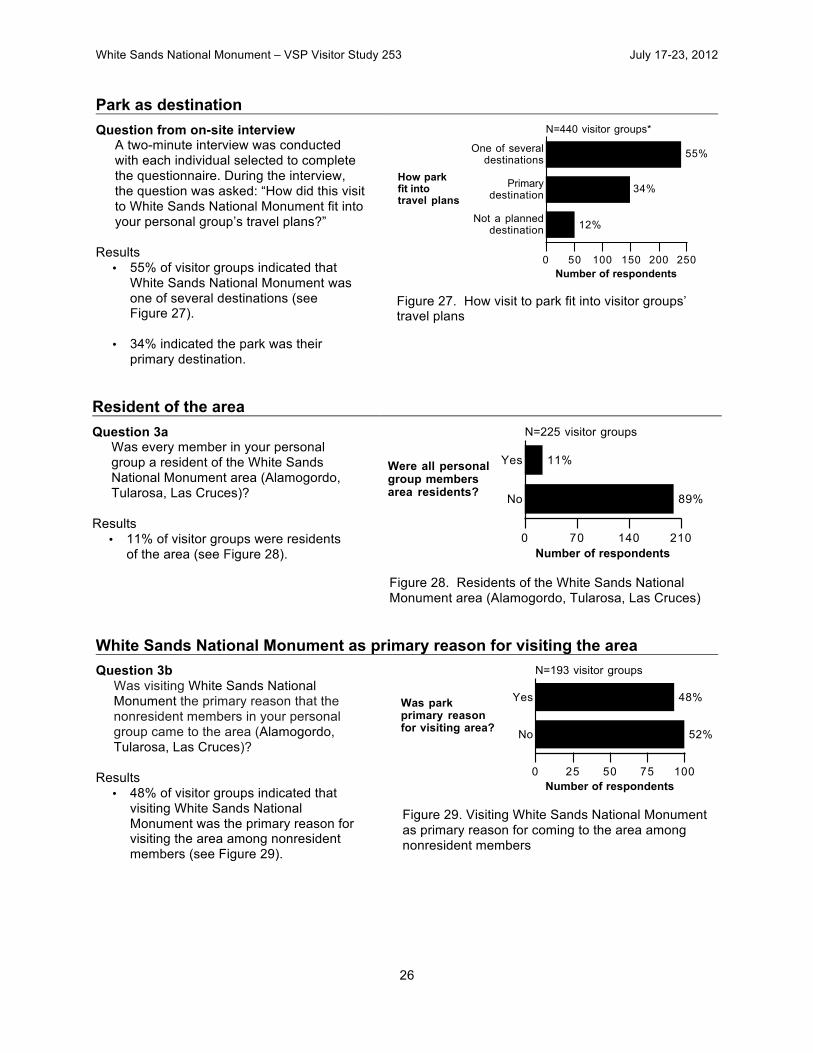
Park as destination Question from on-site interview
A two-minute interview was conducted with each individual selected to complete the questionnaire. During the interview, the question was asked: “How did this visit to White Sands National Monument fit into your personal group’s travel plans?”
Results
• 55% of visitor groups indicated that White Sands National Monument was one of several destinations (see Figure 27).
• 34% indicated the park was their
primary destination.
Figure 27. How visit to park fit into visitor groups’ travel plans
Resident of the area Question 3a
Was every member in your personal group a resident of the White Sands National Monument area (Alamogordo, Tularosa, Las Cruces)?
Results
• 11% of visitor groups were residents of the area (see Figure 28).
Figure 28. Residents of the White Sands National Monument area (Alamogordo, Tularosa, Las Cruces)
White Sands National Monument as primary reason for visiting the area Question 3b
Was visiting White Sands National Monument the primary reason that the nonresident members in your personal group came to the area (Alamogordo, Tularosa, Las Cruces)?
Results
• 48% of visitor groups indicated that visiting White Sands National Monument was the primary reason for visiting the area among nonresident members (see Figure 29).
Figure 29. Visiting White Sands National Monument as primary reason for coming to the area among nonresident members
0 50 100 150 200 250
Number of respondents
Not a planneddestination
Primarydestination
One of severaldestinations
12%
34%
55%
N=440 visitor groups*
How parkfit intotravel plans
0 70 140 210
Number of respondents
No
Yes
89%
11%
N=225 visitor groups
Were all personalgroup membersarea residents?
0 25 50 75 100
Number of respondents
No
Yes
52%
48%
N=193 visitor groups
Was parkprimary reasonfor visiting area?
White Sands National Monument – VSP Visitor Study 253 July 17-23, 2012
27
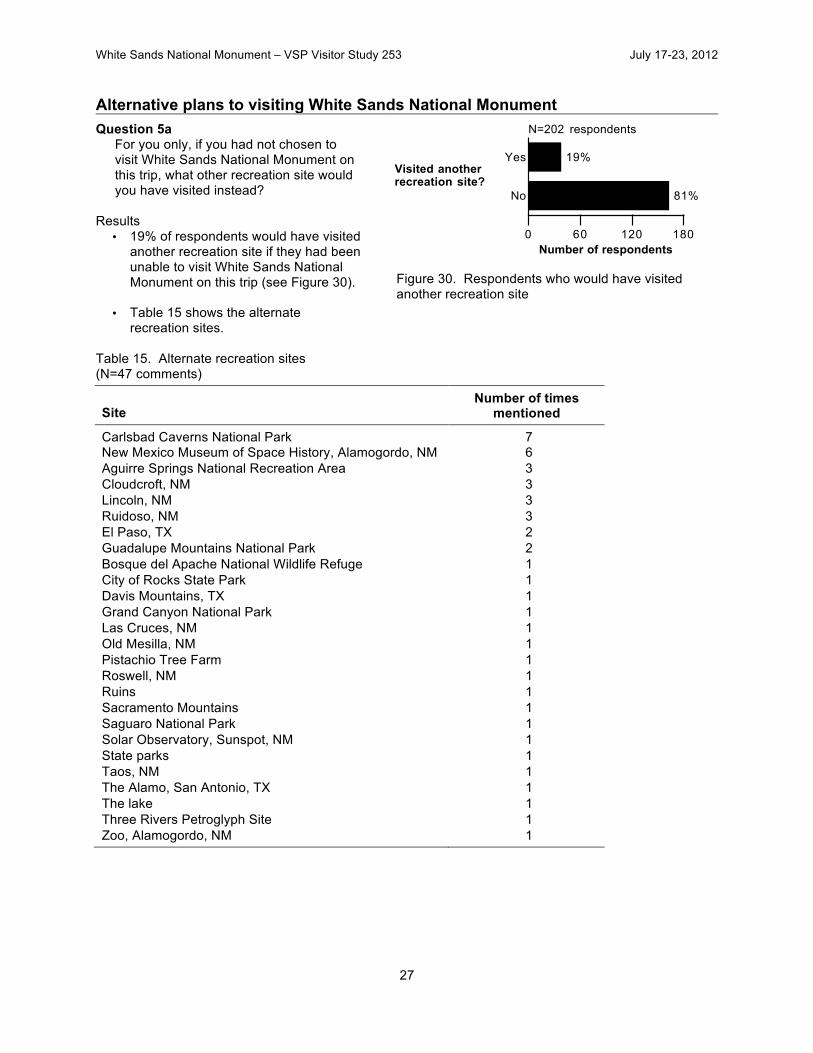
Alternative plans to visiting White Sands National Monument Question 5a
For you only, if you had not chosen to visit White Sands National Monument on this trip, what other recreation site would you have visited instead?
Results
• 19% of respondents would have visited another recreation site if they had been unable to visit White Sands National Monument on this trip (see Figure 30).
• Table 15 shows the alternate recreation sites.
Figure 30. Respondents who would have visited another recreation site
Table 15. Alternate recreation sites (N=47 comments)
Site Number of times
mentioned
Carlsbad Caverns National Park 7 New Mexico Museum of Space History, Alamogordo, NM 6 Aguirre Springs National Recreation Area 3 Cloudcroft, NM 3 Lincoln, NM 3 Ruidoso, NM 3 El Paso, TX 2 Guadalupe Mountains National Park 2 Bosque del Apache National Wildlife Refuge 1 City of Rocks State Park 1 Davis Mountains, TX 1 Grand Canyon National Park 1 Las Cruces, NM 1 Old Mesilla, NM 1 Pistachio Tree Farm 1 Roswell, NM 1 Ruins 1 Sacramento Mountains 1 Saguaro National Park 1 Solar Observatory, Sunspot, NM 1 State parks 1 Taos, NM 1 The Alamo, San Antonio, TX 1 The lake 1 Three Rivers Petroglyph Site 1 Zoo, Alamogordo, NM 1
0 60 120 180
Number of respondents
No
Yes
81%
19%
N=202 respondents
Visited anotherrecreation site?
White Sands National Monument – VSP Visitor Study 253 July 17-23, 2012
28
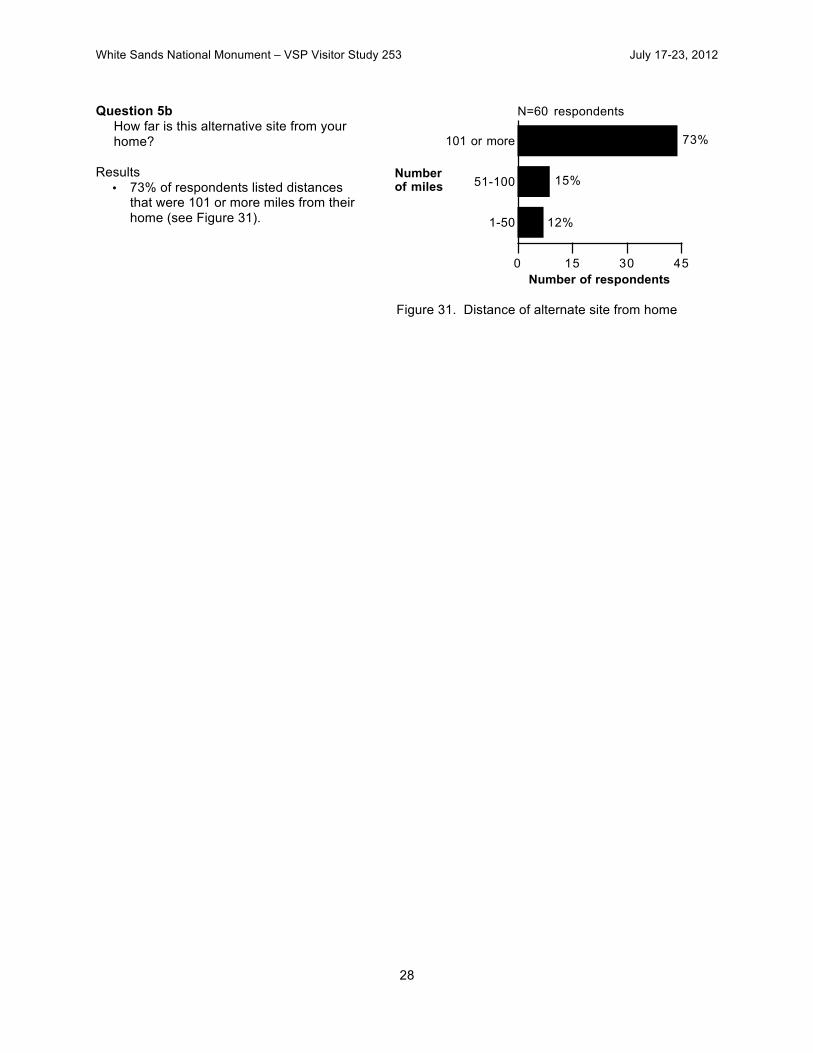
Question 5b How far is this alternative site from your home?
Results
• 73% of respondents listed distances that were 101 or more miles from their home (see Figure 31).
Figure 31. Distance of alternate site from home
0 15 30 45
Number of respondents
1-50
51-100
101 or more
12%
15%
73%
N=60 respondents
Number of miles
White Sands National Monument – VSP Visitor Study 253 July 17-23, 2012
29
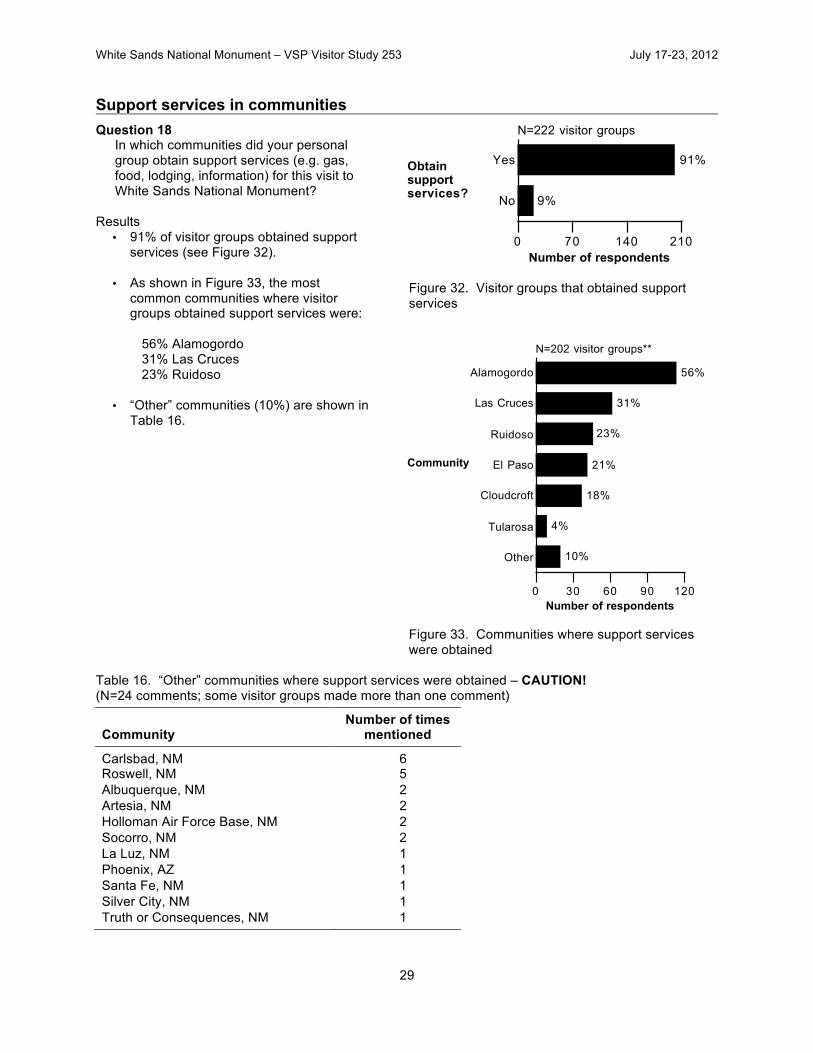
Support services in communities Question 18
In which communities did your personal group obtain support services (e.g. gas, food, lodging, information) for this visit to White Sands National Monument?
Results
• 91% of visitor groups obtained support services (see Figure 32).
• As shown in Figure 33, the most
common communities where visitor groups obtained support services were:
56% Alamogordo 31% Las Cruces 23% Ruidoso
• “Other” communities (10%) are shown in
Table 16.
Figure 32. Visitor groups that obtained support services
Figure 33. Communities where support services were obtained
Table 16. “Other” communities where support services were obtained – CAUTION! (N=24 comments; some visitor groups made more than one comment)
Community Number of times
mentioned
Carlsbad, NM 6 Roswell, NM 5 Albuquerque, NM 2 Artesia, NM 2 Holloman Air Force Base, NM 2 Socorro, NM 2 La Luz, NM 1 Phoenix, AZ 1 Santa Fe, NM 1 Silver City, NM 1 Truth or Consequences, NM 1
0 70 140 210
Number of respondents
No
Yes
9%
91%
N=222 visitor groups
Obtainsupportservices?
0 30 60 90 120
Number of respondents
Other
Tularosa
Cloudcroft
El Paso
Ruidoso
Las Cruces
Alamogordo
10%
4%
18%
21%
23%
31%
56%
N=202 visitor groups**
Community

White Sands National Monument – VSP Visitor Study 253 July 17-23, 2012
30
Form of transportation Question 3c
For the nonresident members in your personal group, what was the method of transportation used to travel most of the distance from home to the White Sands National Monument area?
Results
• 58% of nonresident visitor group members used a car to travel most of the distance from home to the White Sands National Monument area (see Figure 34).
• 26% traveled by SUV/truck/van
Figure 34. Form of transportation used to travel most of the distance from home to the White Sands National Monument area
Number of vehicles Question 7e
On this visit, how many vehicles did your personal group use to arrive at the park?
Results
• 88% of visitor groups used one vehicle to arrive at the park (see Figure 35).
• 6% used two vehicles.
Figure 35. Number of vehicles used to arrive at the park
Number of park entries Question 7d
On this trip, how many times did your personal group enter the park?
Results
• 87% of visitor groups entered the park one time (see Figure 36).
• 9% entered twice.
Figure 36. Number of park entries
0 30 60 90 120
Number of respondents
Other
Motorcycle
Motorhome
Airplane
SUV/truck/van
Car
0%
1%
2%
13%
26%
58%
N=194 visitor groups
Transportation
0 50 100 150 200
Number of respondents
1
2
3 or more
88%
6%
5%
N=222 visitor groups*
Number ofvehicles
0 50 100 150 200
Number of respondents
1
2
3 or more
87%
9%
4%
N=217 visitor groups
Number ofentries
White Sands National Monument – VSP Visitor Study 253 July 17-23, 2012
31
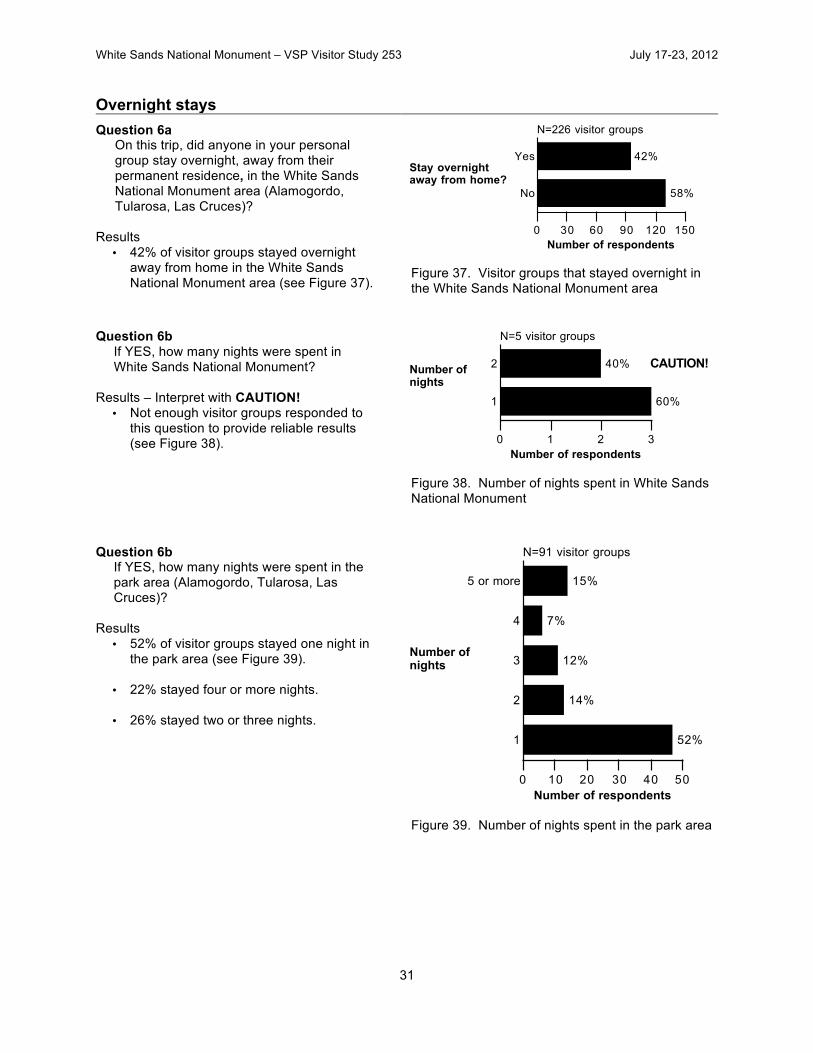
Overnight stays Question 6a
On this trip, did anyone in your personal group stay overnight, away from their permanent residence, in the White Sands National Monument area (Alamogordo, Tularosa, Las Cruces)?
Results
• 42% of visitor groups stayed overnight away from home in the White Sands National Monument area (see Figure 37).
Figure 37. Visitor groups that stayed overnight in the White Sands National Monument area
Question 6b If YES, how many nights were spent in White Sands National Monument?
Results – Interpret with CAUTION! • Not enough visitor groups responded to
this question to provide reliable results (see Figure 38).
Figure 38. Number of nights spent in White Sands National Monument
Question 6b If YES, how many nights were spent in the park area (Alamogordo, Tularosa, Las Cruces)?
Results • 52% of visitor groups stayed one night in
the park area (see Figure 39).
• 22% stayed four or more nights.
• 26% stayed two or three nights.
Figure 39. Number of nights spent in the park area
0 30 60 90 120 150
Number of respondents
No
Yes
58%
42%
N=226 visitor groups
Stay overnightaway from home?
0 1 2 3
Number of respondents
1
2
60%
40%
N=5 visitor groups
Number ofnights
CAUTION!
0 10 20 30 40 50
Number of respondents
1
2
3
4
5 or more
52%
14%
12%
7%
15%
N=91 visitor groups
Number ofnights
White Sands National Monument – VSP Visitor Study 253 July 17-23, 2012
32
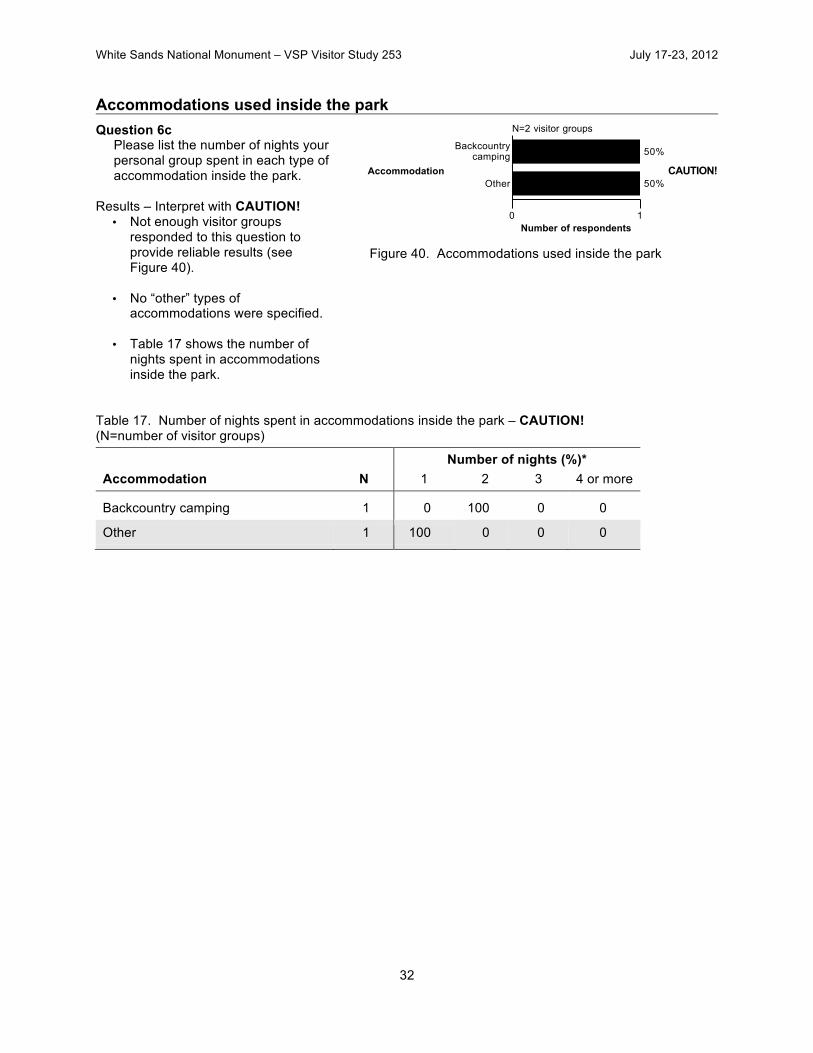
Accommodations used inside the park Question 6c
Please list the number of nights your personal group spent in each type of accommodation inside the park.
Results – Interpret with CAUTION! • Not enough visitor groups
responded to this question to provide reliable results (see Figure 40).
• No “other” types of accommodations were specified.
• Table 17 shows the number of nights spent in accommodations inside the park.
Figure 40. Accommodations used inside the park
Table 17. Number of nights spent in accommodations inside the park – CAUTION! (N=number of visitor groups)
Number of nights (%)* Accommodation N 1 2 3 4 or more
Backcountry camping 1 0 100 0 0
Other 1 100 0 0 0
0 1Number of respondents
Other
Backcountrycamping
50%
50%
N=2 visitor groups
Accommodation CAUTION!
White Sands National Monument – VSP Visitor Study 253 July 17-23, 2012
33
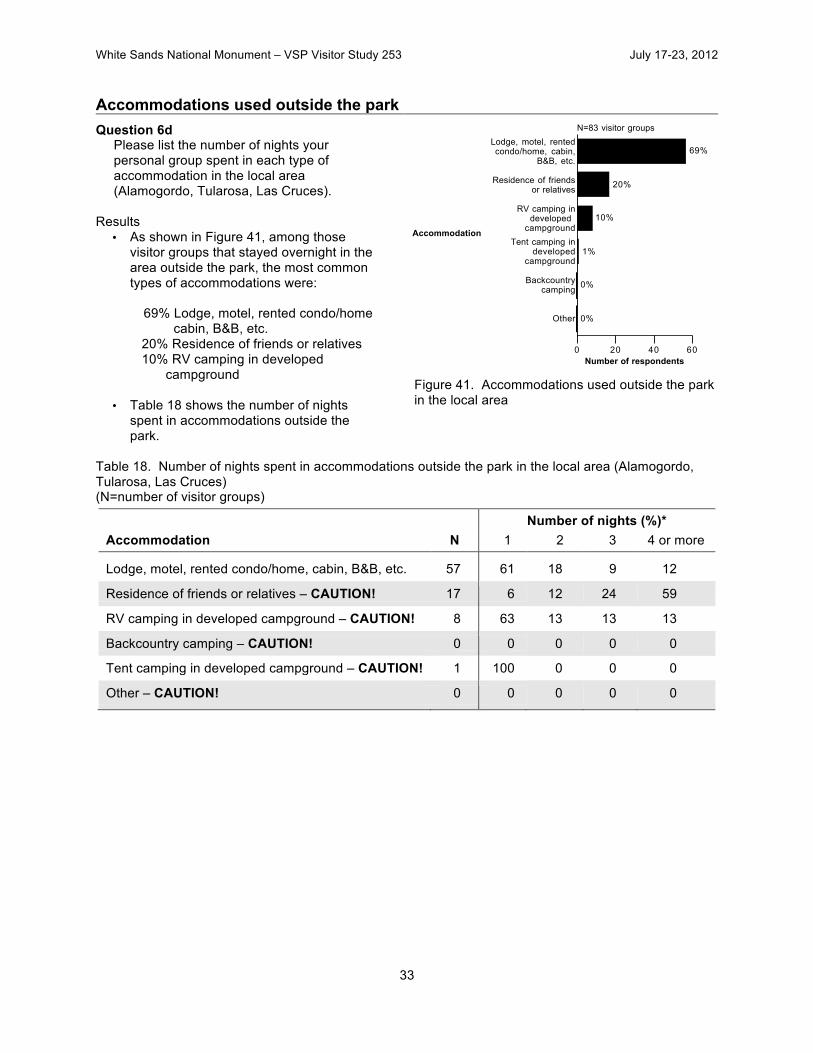
Accommodations used outside the park Question 6d
Please list the number of nights your personal group spent in each type of accommodation in the local area (Alamogordo, Tularosa, Las Cruces).
Results • As shown in Figure 41, among those
visitor groups that stayed overnight in the area outside the park, the most common types of accommodations were:
69% Lodge, motel, rented condo/home
cabin, B&B, etc. 20% Residence of friends or relatives 10% RV camping in developed
campground
• Table 18 shows the number of nights spent in accommodations outside the park.
Figure 41. Accommodations used outside the park in the local area
Table 18. Number of nights spent in accommodations outside the park in the local area (Alamogordo, Tularosa, Las Cruces) (N=number of visitor groups)
Number of nights (%)* Accommodation N 1 2 3 4 or more
Lodge, motel, rented condo/home, cabin, B&B, etc. 57 61 18 9 12
Residence of friends or relatives – CAUTION! 17 6 12 24 59
RV camping in developed campground – CAUTION! 8 63 13 13 13
Backcountry camping – CAUTION! 0 0 0 0 0
Tent camping in developed campground – CAUTION! 1 100 0 0 0
Other – CAUTION! 0 0 0 0 0
0 20 40 60Number of respondents
Other
Backcountrycamping
Tent camping indeveloped
campground
RV camping indeveloped
campground
Residence of friendsor relatives
Lodge, motel, rentedcondo/home, cabin,
B&B, etc.
0%
0%
1%
10%
20%
69%
N=83 visitor groups
Accommodation
White Sands National Monument – VSP Visitor Study 253 July 17-23, 2012
34
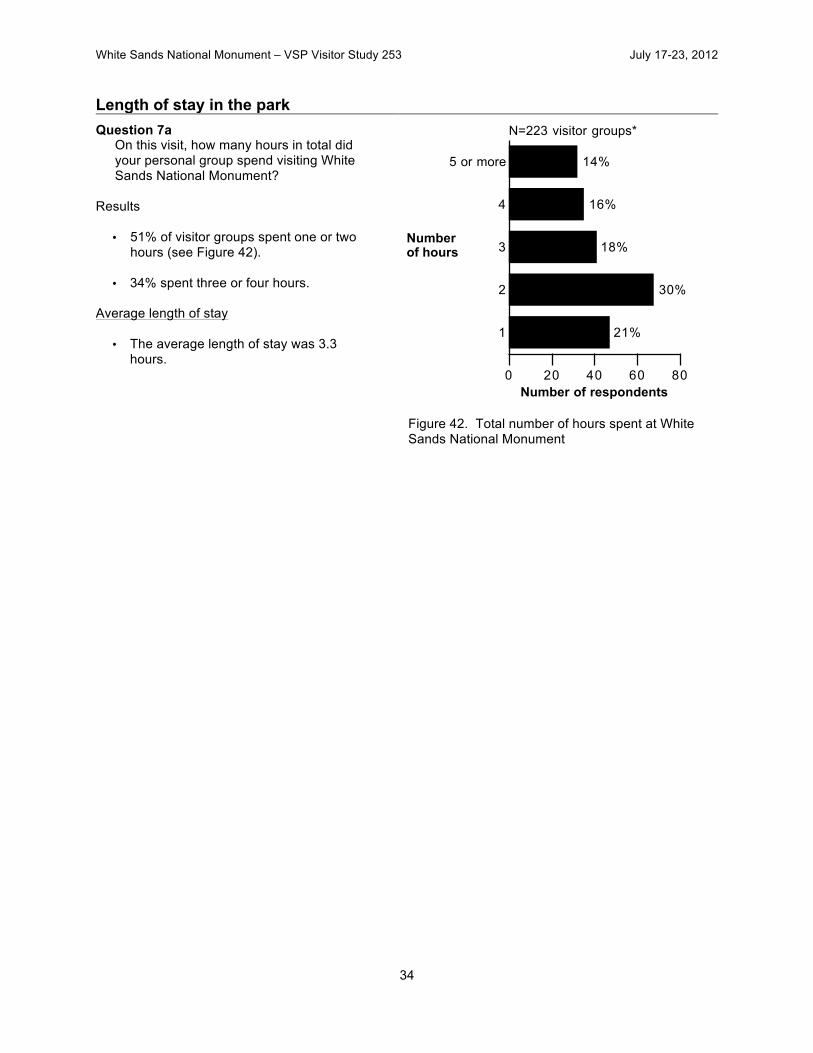
Length of stay in the park Question 7a
On this visit, how many hours in total did your personal group spend visiting White Sands National Monument?
Results
• 51% of visitor groups spent one or two hours (see Figure 42).
• 34% spent three or four hours.
Average length of stay
• The average length of stay was 3.3 hours.
Figure 42. Total number of hours spent at White Sands National Monument
0 20 40 60 80
Number of respondents
1
2
3
4
5 or more
21%
30%
18%
16%
14%
N=223 visitor groups*
Numberof hours
White Sands National Monument – VSP Visitor Study 253 July 17-23, 2012
35
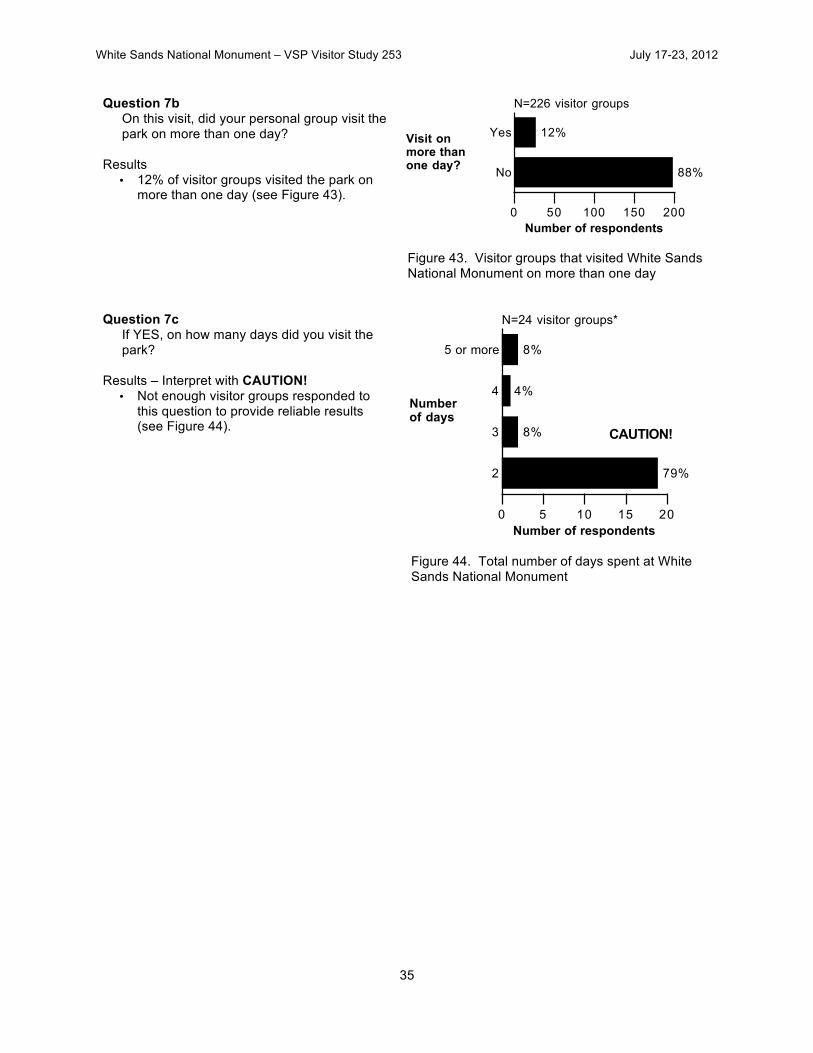
Question 7b On this visit, did your personal group visit the park on more than one day?
Results
• 12% of visitor groups visited the park on more than one day (see Figure 43).
Figure 43. Visitor groups that visited White Sands National Monument on more than one day
Question 7c
If YES, on how many days did you visit the park?
Results – Interpret with CAUTION!
• Not enough visitor groups responded to this question to provide reliable results (see Figure 44).
Figure 44. Total number of days spent at White Sands National Monument
0 50 100 150 200
Number of respondents
No
Yes
88%
12%
N=226 visitor groups
Visit onmore thanone day?
0 5 10 15 20
Number of respondents
2
3
4
5 or more
79%
8%
4%
8%
N=24 visitor groups*
Numberof days
CAUTION!
White Sands National Monument – VSP Visitor Study 253 July 17-23, 2012
36
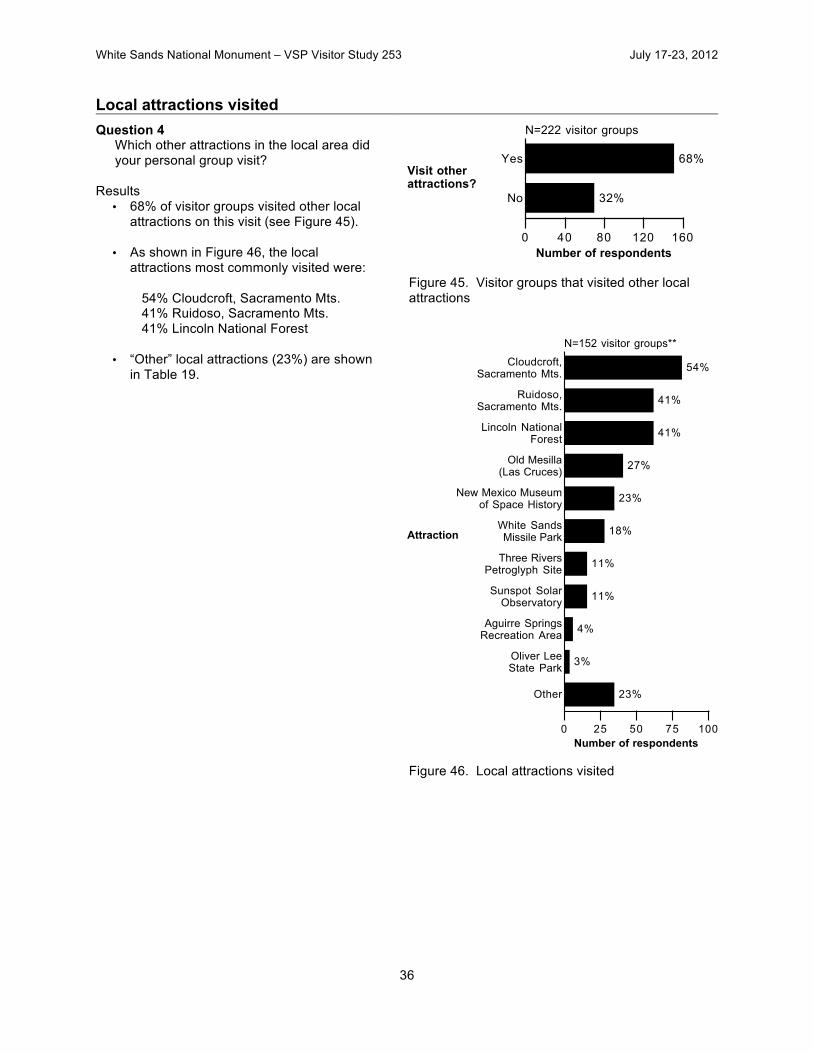
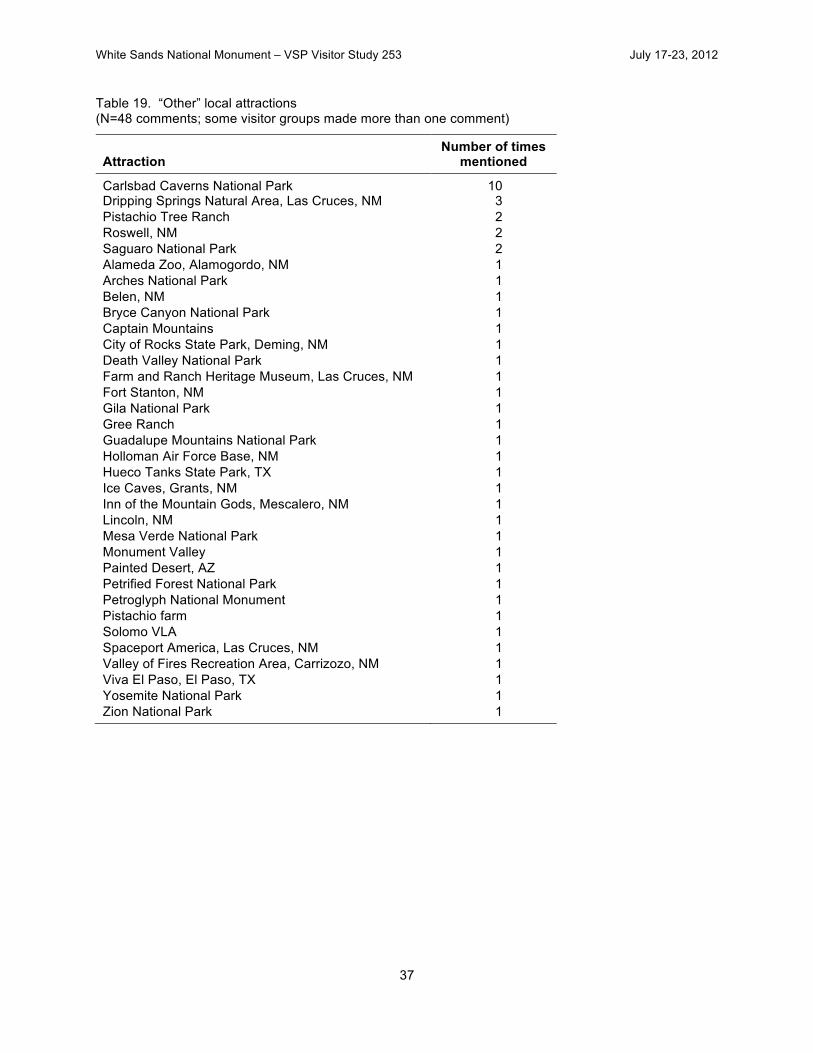
Local attractions visited Question 4
Which other attractions in the local area did your personal group visit?
Results
• 68% of visitor groups visited other local attractions on this visit (see Figure 45).
• As shown in Figure 46, the local
attractions most commonly visited were:
54% Cloudcroft, Sacramento Mts. 41% Ruidoso, Sacramento Mts. 41% Lincoln National Forest
• “Other” local attractions (23%) are shown
in Table 19.
Figure 45. Visitor groups that visited other local attractions
Figure 46. Local attractions visited
0 40 80 120 160
Number of respondents
No
Yes
32%
68%
N=222 visitor groups
Visit otherattractions?
0 25 50 75 100
Number of respondents
Other
Oliver LeeState Park
Aguirre SpringsRecreation Area
Sunspot SolarObservatory
Three RiversPetroglyph Site
White SandsMissile Park
New Mexico Museumof Space History
Old Mesilla(Las Cruces)
Lincoln NationalForest
Ruidoso,Sacramento Mts.
Cloudcroft,Sacramento Mts.
23%
3%
4%
11%
11%
18%
23%
27%
41%
41%
54%
N=152 visitor groups**
Attraction
White Sands National Monument – VSP Visitor Study 253 July 17-23, 2012
37
Table 19. “Other” local attractions (N=48 comments; some visitor groups made more than one comment)
Attraction Number of times
mentioned
Carlsbad Caverns National Park 10 Dripping Springs Natural Area, Las Cruces, NM 3 Pistachio Tree Ranch 2 Roswell, NM 2 Saguaro National Park 2 Alameda Zoo, Alamogordo, NM 1 Arches National Park 1 Belen, NM 1 Bryce Canyon National Park 1 Captain Mountains 1 City of Rocks State Park, Deming, NM 1 Death Valley National Park 1 Farm and Ranch Heritage Museum, Las Cruces, NM 1 Fort Stanton, NM 1 Gila National Park 1 Gree Ranch 1 Guadalupe Mountains National Park 1 Holloman Air Force Base, NM 1 Hueco Tanks State Park, TX 1 Ice Caves, Grants, NM 1 Inn of the Mountain Gods, Mescalero, NM 1 Lincoln, NM 1 Mesa Verde National Park 1 Monument Valley 1 Painted Desert, AZ 1 Petrified Forest National Park 1 Petroglyph National Monument 1 Pistachio farm 1 Solomo VLA 1 Spaceport America, Las Cruces, NM 1 Valley of Fires Recreation Area, Carrizozo, NM 1 Viva El Paso, El Paso, TX 1 Yosemite National Park 1 Zion National Park 1

White Sands National Monument – VSP Visitor Study 253 July 17-23, 2012
38
Places visited in the park Question 8
For this trip, which of the following places in White Sands National Monument did your personal group visit? • As shown in Figure 47, the most
commonly visited places by visitor groups at White Sands National Monument were:
73% Visitor center/bookstore 73% The Dunes Drive 59% Gift store
• The least visited place was:
4% Backcountry campsite
Figure 47. Places visited
0 60 120 180
Number of respondents
Backcountrycampsite
Alkali Flat Trail
Amphitheater
BackcountryCamping
Loop Trail
Dune LifeNature Trail
Boardwalk Trail
Picnic areas
Gift store
The DunesDrive
Visitor center/bookstore
4%
13%
14%
16%
29%
34%
48%
59%
73%
73%
N=224 visitor groups**
Place
White Sands National Monument – VSP Visitor Study 253 July 17-23, 2012
39
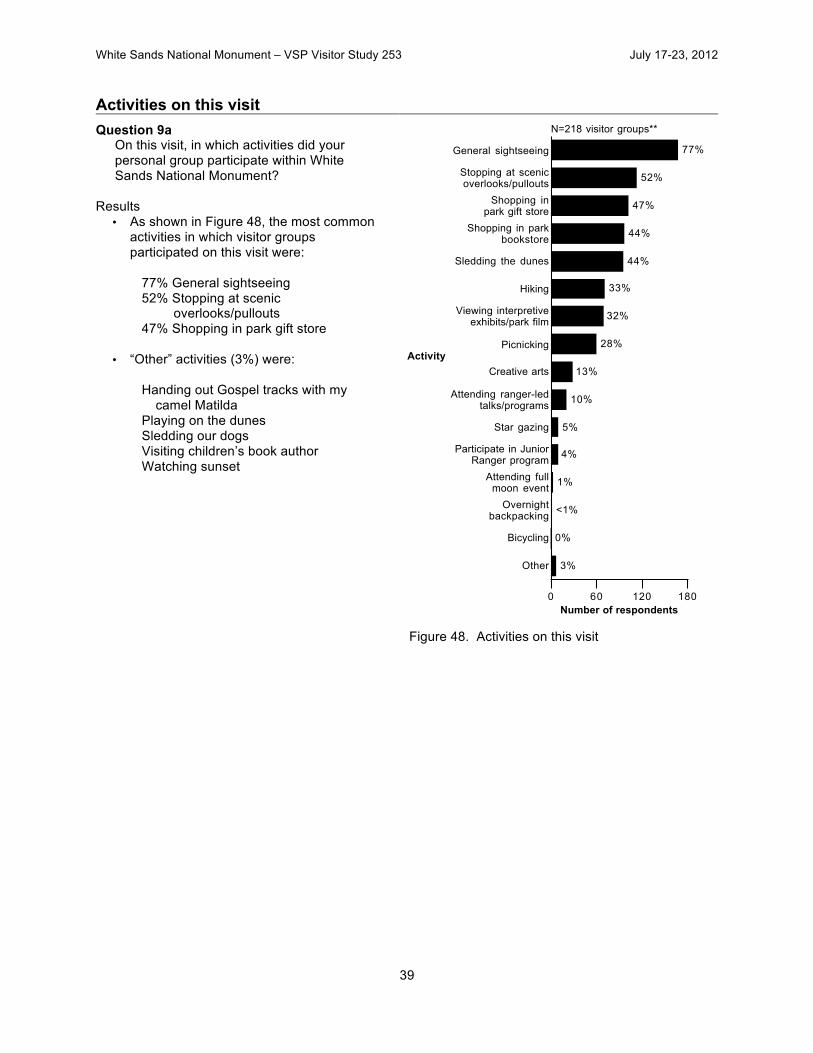
Activities on this visit Question 9a
On this visit, in which activities did your personal group participate within White Sands National Monument?
Results
• As shown in Figure 48, the most common activities in which visitor groups participated on this visit were:
77% General sightseeing 52% Stopping at scenic
overlooks/pullouts 47% Shopping in park gift store
• “Other” activities (3%) were: Handing out Gospel tracks with my
camel Matilda Playing on the dunes Sledding our dogs Visiting children’s book author Watching sunset
Figure 48. Activities on this visit
0 60 120 180Number of respondents
Other
Bicycling
Overnightbackpacking
Attending fullmoon event
Participate in JuniorRanger program
Star gazing
Attending ranger-ledtalks/programs
Creative arts
Picnicking
Viewing interpretiveexhibits/park film
Hiking
Sledding the dunes
Shopping in parkbookstore
Shopping inpark gift store
Stopping at scenicoverlooks/pullouts
General sightseeing
3%
0%
<1%
1%
4%
5%
10%
13%
28%
32%
33%
44%
44%
47%
52%
77%
N=218 visitor groups**
Activity
White Sands National Monument – VSP Visitor Study 253 July 17-23, 2012
40
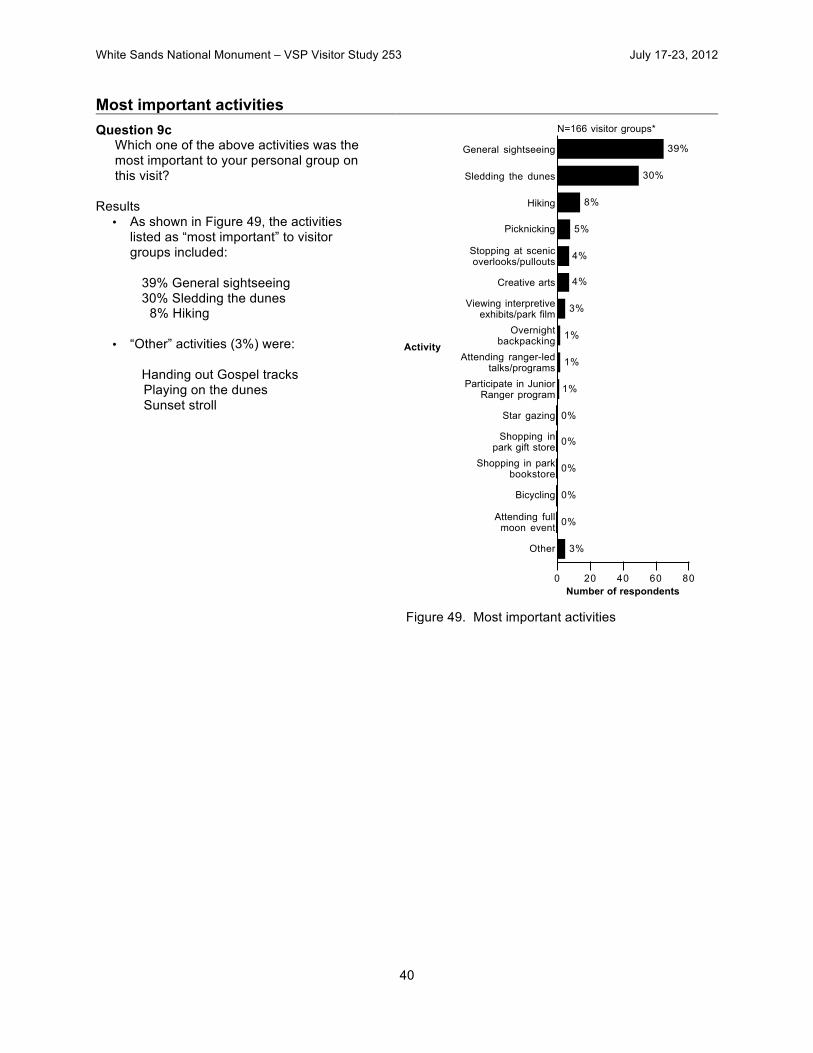
Most important activities Question 9c
Which one of the above activities was the most important to your personal group on this visit?
Results
• As shown in Figure 49, the activities listed as “most important” to visitor groups included:
39% General sightseeing 30% Sledding the dunes
8% Hiking
• “Other” activities (3%) were: Handing out Gospel tracks Playing on the dunes Sunset stroll
Figure 49. Most important activities
0 20 40 60 80Number of respondents
Other
Attending fullmoon event
Bicycling
Shopping in parkbookstore
Shopping inpark gift store
Star gazing
Participate in JuniorRanger program
Attending ranger-ledtalks/programs
Overnightbackpacking
Viewing interpretiveexhibits/park film
Creative arts
Stopping at scenicoverlooks/pullouts
Picknicking
Hiking
Sledding the dunes
General sightseeing
3%
0%
0%
0%
0%
0%
1%
1%
1%
3%
4%
4%
5%
8%
30%
39%
N=166 visitor groups*
Activity
White Sands National Monument – VSP Visitor Study 253 July 17-23, 2012
41
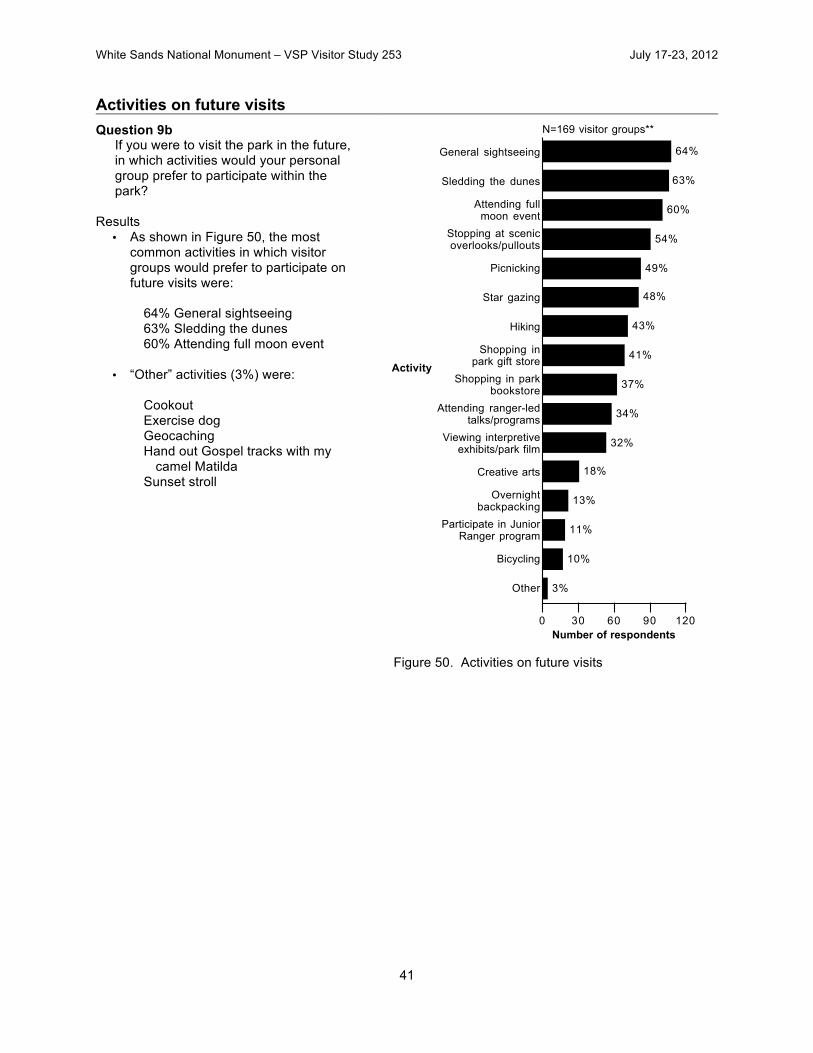
Activities on future visits Question 9b
If you were to visit the park in the future, in which activities would your personal group prefer to participate within the park?
Results
• As shown in Figure 50, the most common activities in which visitor groups would prefer to participate on future visits were:
64% General sightseeing 63% Sledding the dunes 60% Attending full moon event
• “Other” activities (3%) were:
Cookout Exercise dog Geocaching Hand out Gospel tracks with my
camel Matilda Sunset stroll
Figure 50. Activities on future visits
0 30 60 90 120Number of respondents
Other
Bicycling
Participate in JuniorRanger program
Overnightbackpacking
Creative arts
Viewing interpretiveexhibits/park film
Attending ranger-ledtalks/programs
Shopping in parkbookstore
Shopping inpark gift store
Hiking
Star gazing
Picnicking
Stopping at scenicoverlooks/pullouts
Attending fullmoon event
Sledding the dunes
General sightseeing
3%
10%
11%
13%
18%
32%
34%
37%
41%
43%
48%
49%
54%
60%
63%
64%
N=169 visitor groups**
Activity
White Sands National Monument – VSP Visitor Study 253 July 17-23, 2012
42
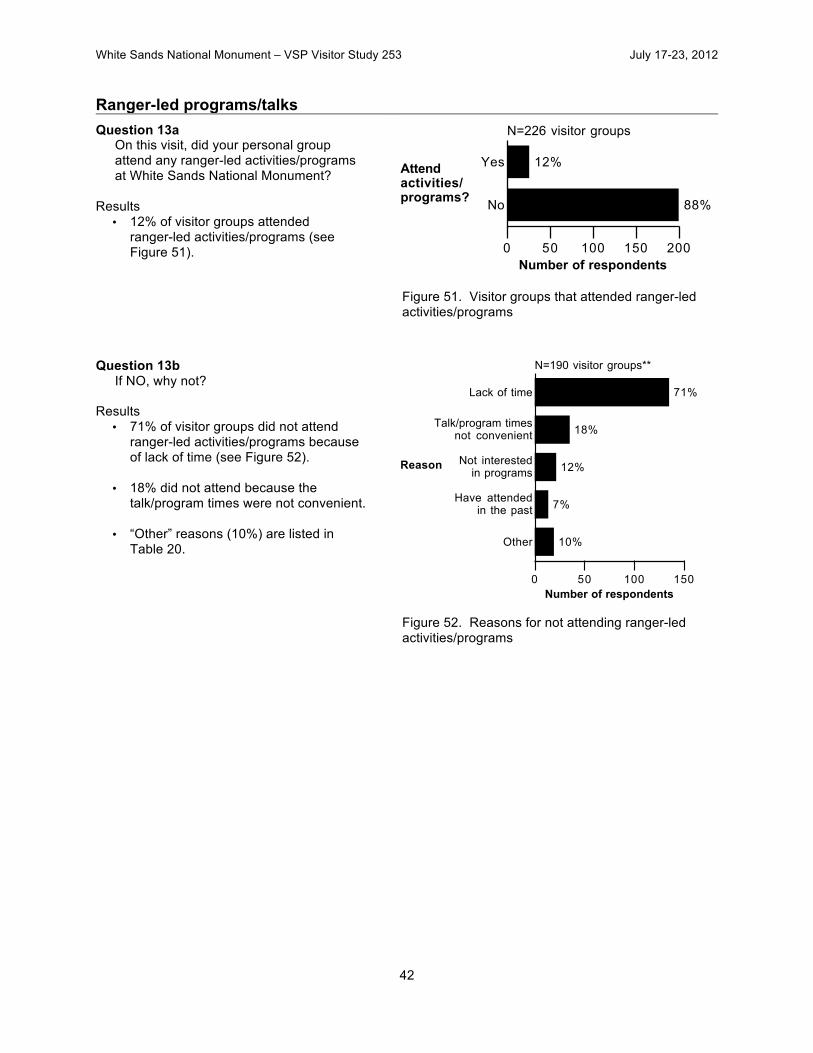
Ranger-led programs/talks Question 13a
On this visit, did your personal group attend any ranger-led activities/programs at White Sands National Monument?
Results • 12% of visitor groups attended
ranger-led activities/programs (see Figure 51).
Figure 51. Visitor groups that attended ranger-led activities/programs
Question 13b If NO, why not?
Results
• 71% of visitor groups did not attend ranger-led activities/programs because of lack of time (see Figure 52).
• 18% did not attend because the talk/program times were not convenient.
• “Other” reasons (10%) are listed in Table 20.
Figure 52. Reasons for not attending ranger-led activities/programs
0 50 100 150 200
Number of respondents
No
Yes
88%
12%
N=226 visitor groups
Attendactivities/programs?
0 50 100 150
Number of respondents
Other
Have attendedin the past
Not interestedin programs
Talk/program timesnot convenient
Lack of time
10%
7%
12%
18%
71%
N=190 visitor groups**
Reason

White Sands National Monument – VSP Visitor Study 253 July 17-23, 2012
43
Table 20. “Other” reasons for not attending ranger-led activities/programs – CAUTION! (N=19 comments)
Reason Number of times
mentioned
Too hot 4 Children too young 3 Unaware of programs 2 Appointment to keep in Arizona 1 Had planned family activity 1 Language 1 Not available 1 Not easy to plan in advance 1 Teenagers 1 Unable to locate 1 Visited just to play 1 Wanted family time 1 Wanted to view the sands 1
White Sands National Monument – VSP Visitor Study 253 July 17-23, 2012
44
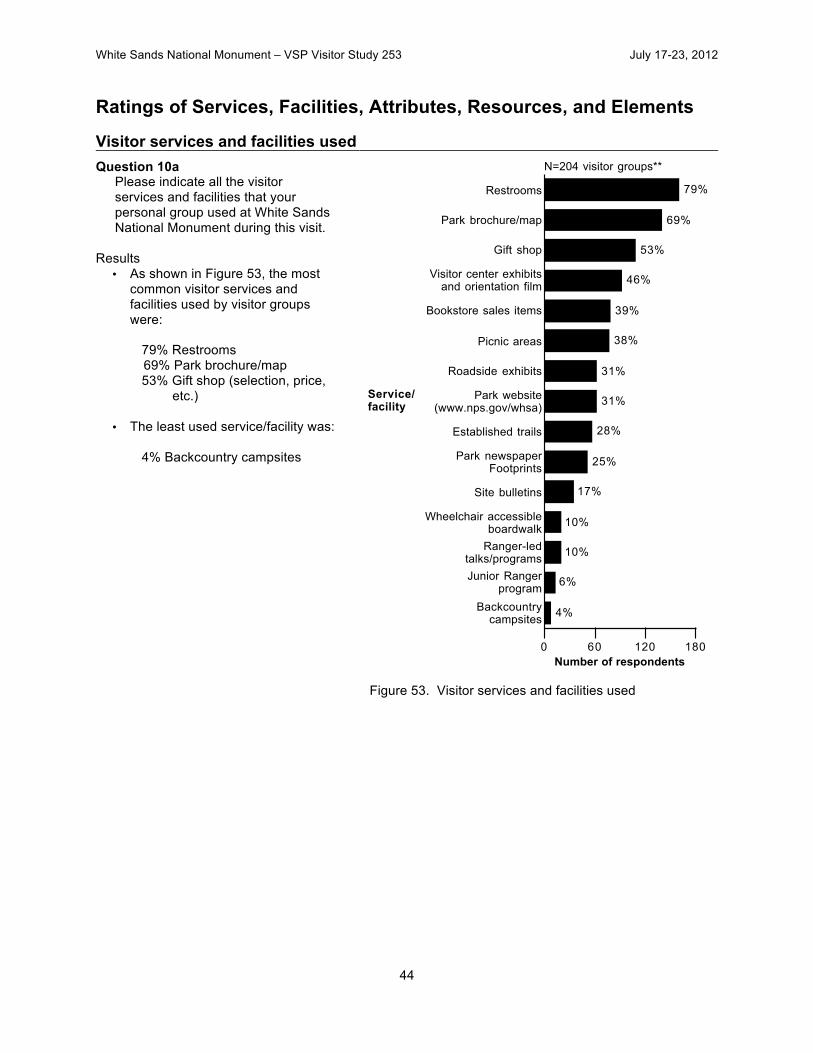
Ratings of Services, Facilities, Attributes, Resources, and Elements Visitor services and facilities used Question 10a
Please indicate all the visitor services and facilities that your personal group used at White Sands National Monument during this visit.
Results
• As shown in Figure 53, the most common visitor services and facilities used by visitor groups were:
79% Restrooms 69% Park brochure/map 53% Gift shop (selection, price,
etc.)
• The least used service/facility was: 4% Backcountry campsites
Figure 53. Visitor services and facilities used
0 60 120 180Number of respondents
Backcountrycampsites
Junior Rangerprogram
Ranger-ledtalks/programs
Wheelchair accessibleboardwalk
Site bulletins
Park newspaperFootprints
Established trails
Park website(www.nps.gov/whsa)
Roadside exhibits
Picnic areas
Bookstore sales items
Visitor center exhibitsand orientation film
Gift shop
Park brochure/map
Restrooms
4%
6%
10%
10%
17%
25%
28%
31%
31%
38%
39%
46%
53%
69%
79%
N=204 visitor groups**
Service/facility

White Sands National Monument – VSP Visitor Study 253 July 17-23, 2012
45
Importance ratings of visitor services and facilities Question 10b
For only those services and facilities that your personal group used, please rate their importance to your visit from 1-5.
1=Not at all important 2=Slightly important 3=Moderately important 4=Very important 5=Extremely important
Results • Figure 54 shows the combined
proportions of “extremely important” and “very important” ratings of visitor services and facilities that were rated by 30 or more visitor groups.
• The visitor services and facilities
receiving the highest combined proportions of “extremely important” and “very important” ratings were:
94% Restrooms 88% Established trails 85% Park website
(www.nps.gov/whsa) 81% Park brochure/map
• Table 21 shows the importance ratings of each service and facility.
• The services/facilities receiving the
highest “not at all important” rating that were rated by 30 or more visitor groups was:
7% Bookstore sales items
(selection, price, etc.)
Figure 54. Combined proportions of “extremely important” and “very important” ratings of visitor services and facilities
0 20 40 60 80 100Proportion of respondents
Bookstore sales items
Gift shop
Park newspaperFootprints
Roadside exhibits
Visitor center exhibitsand orientation film
Picnic areas
Site bulletins
Park brochure/map
Park website(www.nps.gov/whsa)
Established trails
Restrooms
32%, N=73
37%, N=103
58%, N=51
68%, N=56
72%, N=89
78%, N=72
78%, N=33
81%, N=136
85%, N=61
88%, N=55
94%, N=150
N=number of visitor groups
Service/facility
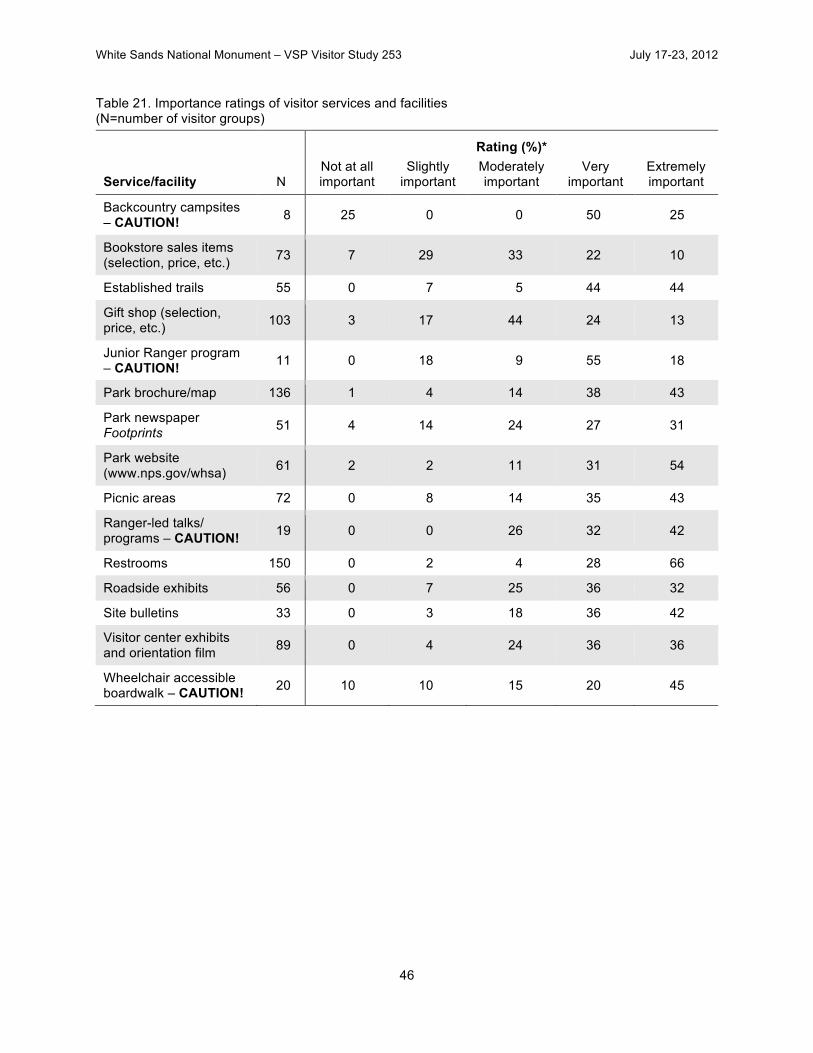
White Sands National Monument – VSP Visitor Study 253 July 17-23, 2012
46
Table 21. Importance ratings of visitor services and facilities (N=number of visitor groups)
Rating (%)*
Service/facility N Not at all important
Slightly important
Moderately important
Very important
Extremely important
Backcountry campsites – CAUTION! 8 25 0 0 50 25
Bookstore sales items (selection, price, etc.) 73 7 29 33 22 10
Established trails 55 0 7 5 44 44
Gift shop (selection, price, etc.) 103 3 17 44 24 13
Junior Ranger program – CAUTION! 11 0 18 9 55 18
Park brochure/map 136 1 4 14 38 43
Park newspaper Footprints 51 4 14 24 27 31
Park website (www.nps.gov/whsa) 61 2 2 11 31 54
Picnic areas 72 0 8 14 35 43
Ranger-led talks/ programs – CAUTION! 19 0 0 26 32 42
Restrooms 150 0 2 4 28 66
Roadside exhibits 56 0 7 25 36 32
Site bulletins 33 0 3 18 36 42
Visitor center exhibits and orientation film 89 0 4 24 36 36
Wheelchair accessible boardwalk – CAUTION! 20 10 10 15 20 45
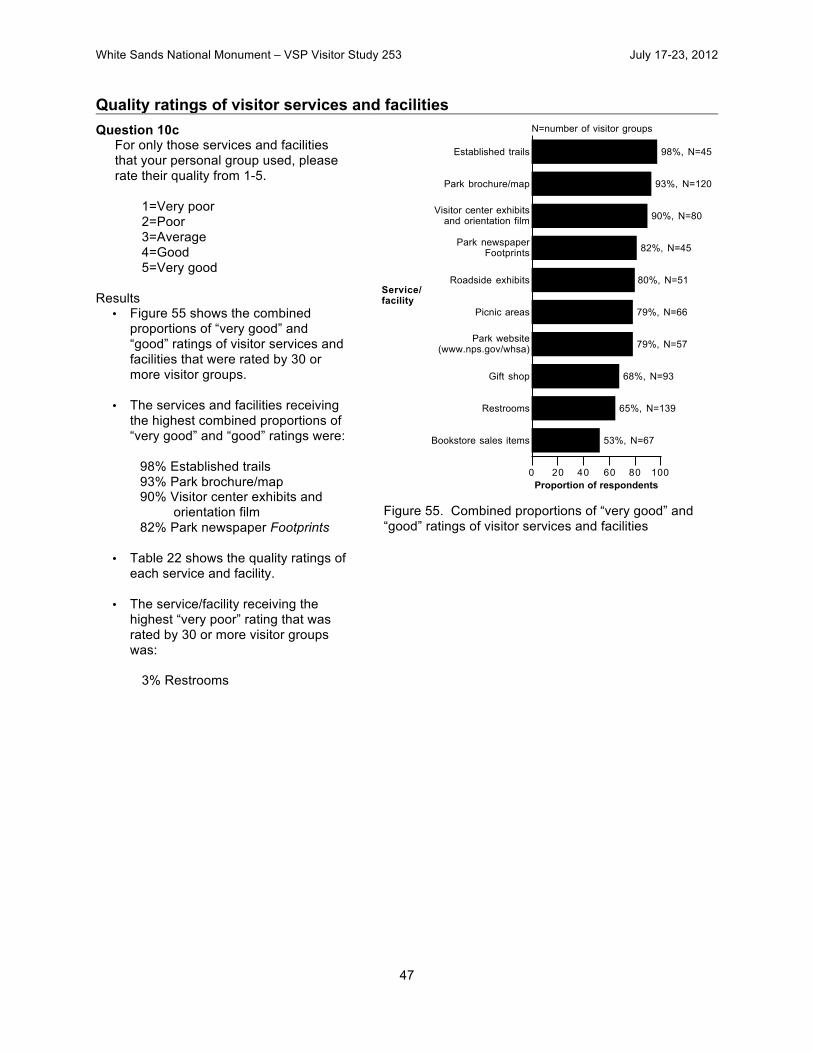
White Sands National Monument – VSP Visitor Study 253 July 17-23, 2012
47
Quality ratings of visitor services and facilities Question 10c
For only those services and facilities that your personal group used, please rate their quality from 1-5.
1=Very poor 2=Poor 3=Average 4=Good 5=Very good
Results
• Figure 55 shows the combined proportions of “very good” and “good” ratings of visitor services and facilities that were rated by 30 or more visitor groups.
• The services and facilities receiving
the highest combined proportions of “very good” and “good” ratings were:
98% Established trails 93% Park brochure/map 90% Visitor center exhibits and
orientation film 82% Park newspaper Footprints
• Table 22 shows the quality ratings of each service and facility.
• The service/facility receiving the
highest “very poor” rating that was rated by 30 or more visitor groups was:
3% Restrooms
Figure 55. Combined proportions of “very good” and “good” ratings of visitor services and facilities
0 20 40 60 80 100Proportion of respondents
Bookstore sales items
Restrooms
Gift shop
Park website(www.nps.gov/whsa)
Picnic areas
Roadside exhibits
Park newspaperFootprints
Visitor center exhibitsand orientation film
Park brochure/map
Established trails
53%, N=67
65%, N=139
68%, N=93
79%, N=57
79%, N=66
80%, N=51
82%, N=45
90%, N=80
93%, N=120
98%, N=45
N=number of visitor groups
Service/facility
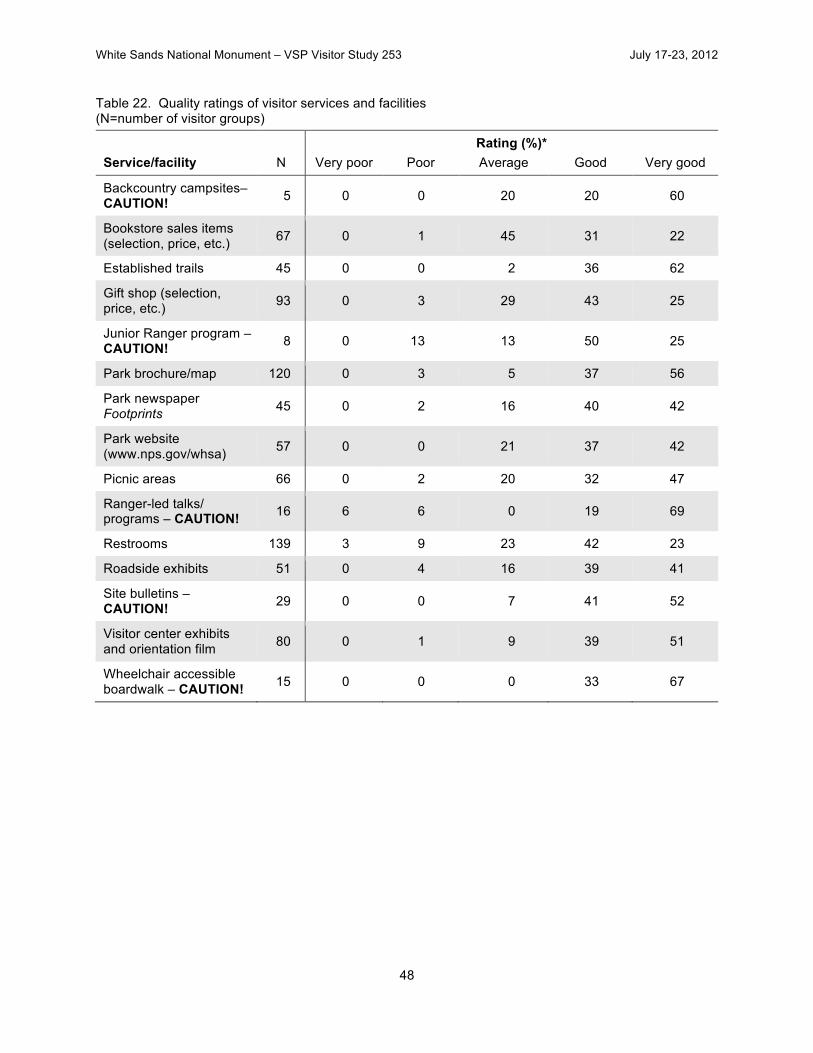
White Sands National Monument – VSP Visitor Study 253 July 17-23, 2012
48
Table 22. Quality ratings of visitor services and facilities (N=number of visitor groups)
Rating (%)* Service/facility N Very poor Poor Average Good Very good
Backcountry campsites– CAUTION! 5 0 0 20 20 60
Bookstore sales items (selection, price, etc.) 67 0 1 45 31 22
Established trails 45 0 0 2 36 62
Gift shop (selection, price, etc.) 93 0 3 29 43 25
Junior Ranger program – CAUTION! 8 0 13 13 50 25
Park brochure/map 120 0 3 5 37 56
Park newspaper Footprints 45 0 2 16 40 42
Park website (www.nps.gov/whsa) 57 0 0 21 37 42
Picnic areas 66 0 2 20 32 47
Ranger-led talks/ programs – CAUTION! 16 6 6 0 19 69
Restrooms 139 3 9 23 42 23
Roadside exhibits 51 0 4 16 39 41
Site bulletins – CAUTION! 29 0 0 7 41 52
Visitor center exhibits and orientation film 80 0 1 9 39 51
Wheelchair accessible boardwalk – CAUTION! 15 0 0 0 33 67
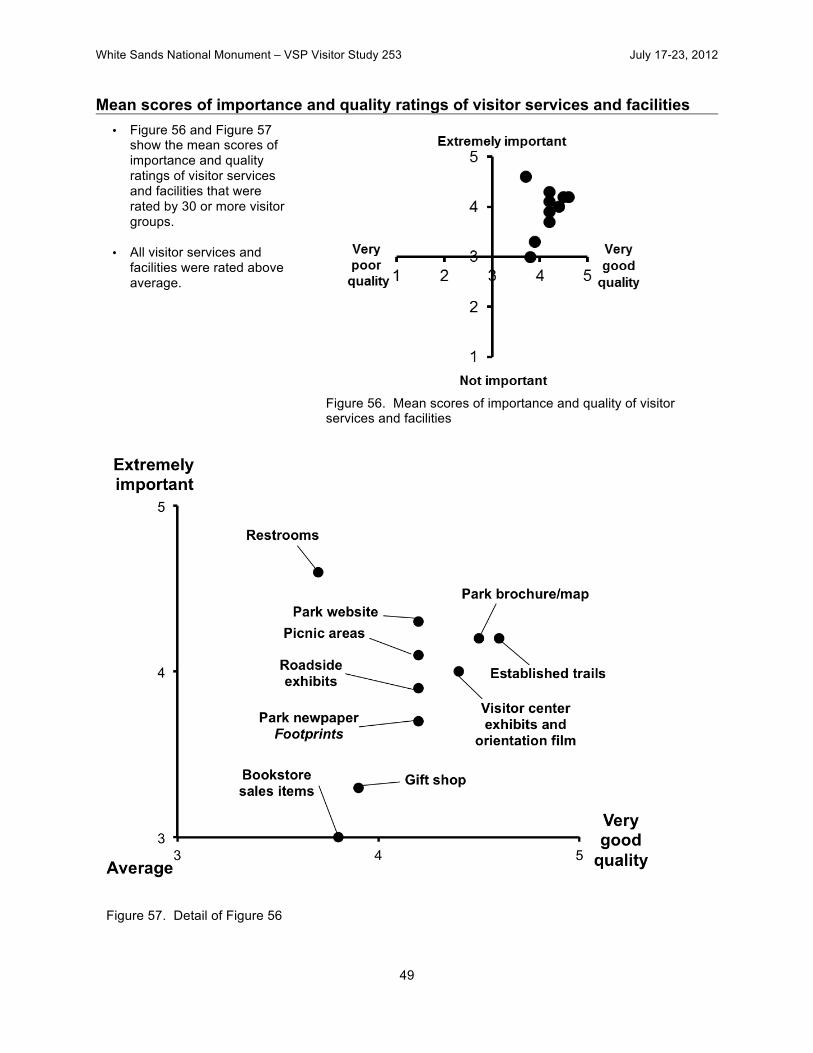
White Sands National Monument – VSP Visitor Study 253 July 17-23, 2012
49
Mean scores of importance and quality ratings of visitor services and facilities • Figure 56 and Figure 57
show the mean scores of importance and quality ratings of visitor services and facilities that were rated by 30 or more visitor groups.
• All visitor services and
facilities were rated above average.
Figure 56. Mean scores of importance and quality of visitor services and facilities
Figure 57. Detail of Figure 56

White Sands National Monument – VSP Visitor Study 253 July 17-23, 2012
50
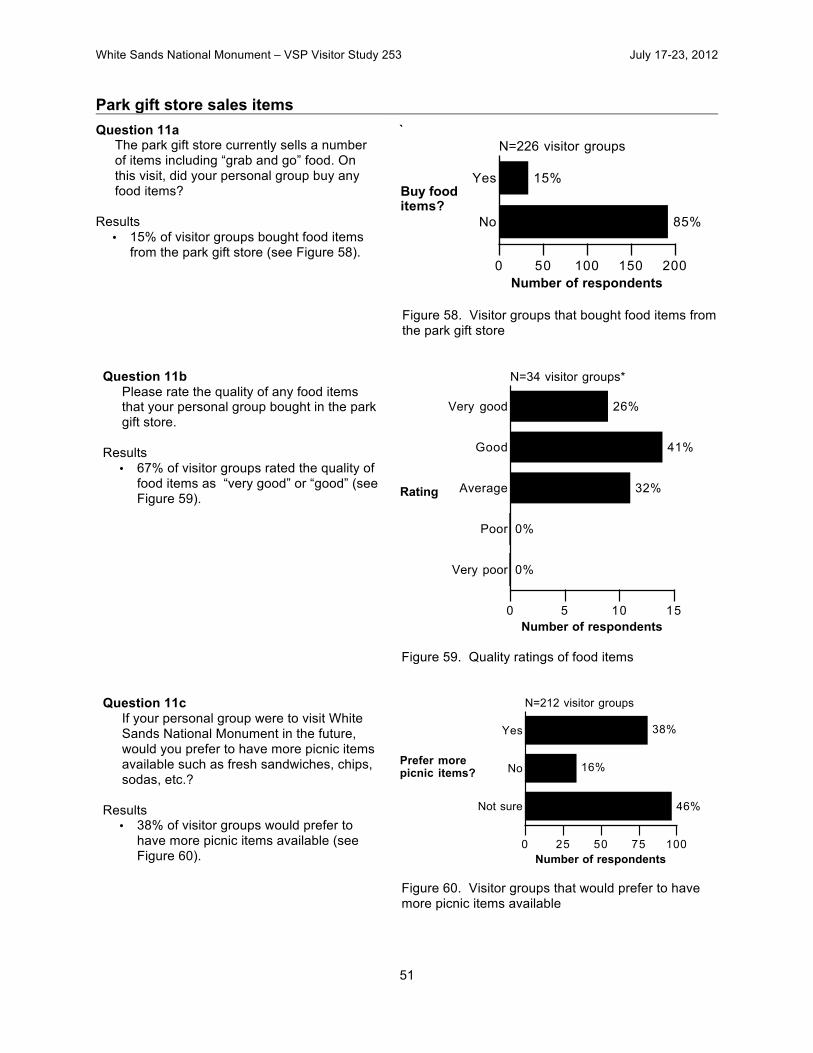
White Sands National Monument – VSP Visitor Study 253 July 17-23, 2012
51
Park gift store sales items Question 11a
The park gift store currently sells a number of items including “grab and go” food. On this visit, did your personal group buy any food items?
Results • 15% of visitor groups bought food items
from the park gift store (see Figure 58).
`
Figure 58. Visitor groups that bought food items from the park gift store
Question 11b Please rate the quality of any food items that your personal group bought in the park gift store.
Results • 67% of visitor groups rated the quality of
food items as “very good” or “good” (see Figure 59).
Figure 59. Quality ratings of food items
Question 11c If your personal group were to visit White Sands National Monument in the future, would you prefer to have more picnic items available such as fresh sandwiches, chips, sodas, etc.?
Results • 38% of visitor groups would prefer to
have more picnic items available (see Figure 60).
Figure 60. Visitor groups that would prefer to have more picnic items available
0 50 100 150 200
Number of respondents
No
Yes
85%
15%
N=226 visitor groups
Buy fooditems?
0 5 10 15Number of respondents
Very poor
Poor
Average
Good
Very good
0%
0%
32%
41%
26%
N=34 visitor groups*
Rating
0 25 50 75 100
Number of respondents
Not sure
No
Yes
46%
16%
38%
N=212 visitor groups
Prefer morepicnic items?
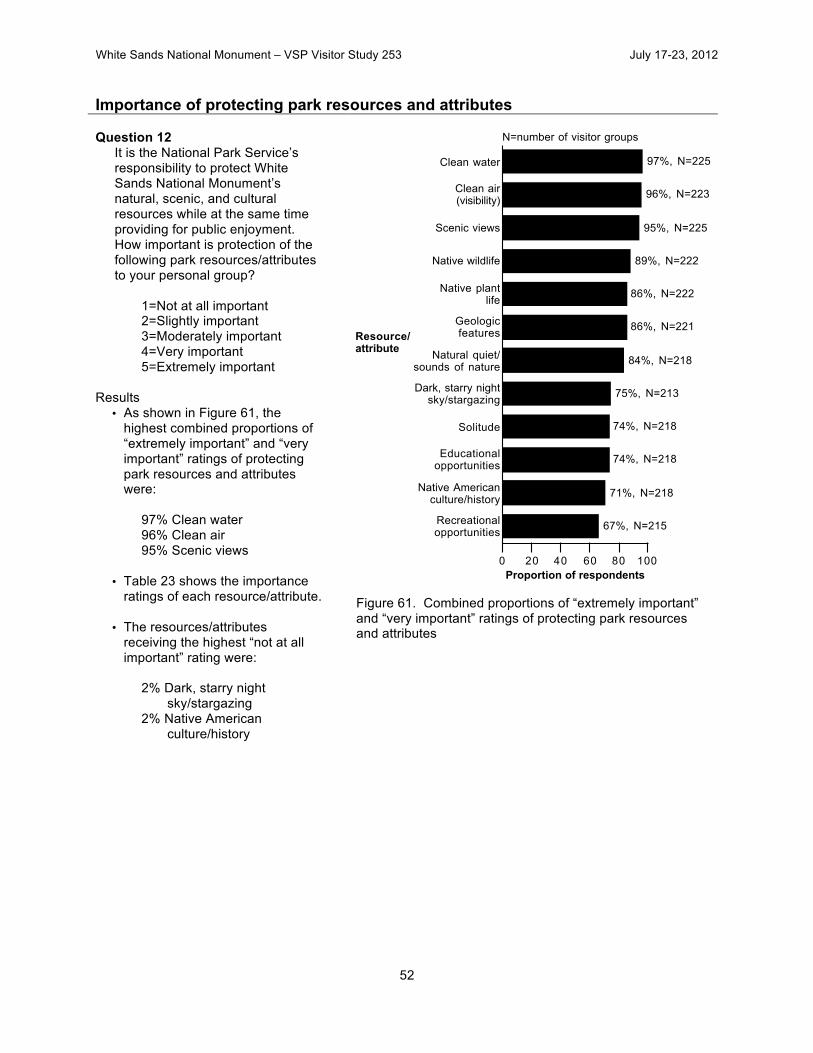
White Sands National Monument – VSP Visitor Study 253 July 17-23, 2012
52
Importance of protecting park resources and attributes Question 12
It is the National Park Service’s responsibility to protect White Sands National Monument’s natural, scenic, and cultural resources while at the same time providing for public enjoyment. How important is protection of the following park resources/attributes to your personal group?
1=Not at all important 2=Slightly important 3=Moderately important 4=Very important 5=Extremely important
Results
• As shown in Figure 61, the highest combined proportions of “extremely important” and “very important” ratings of protecting park resources and attributes were:
97% Clean water 96% Clean air 95% Scenic views
• Table 23 shows the importance ratings of each resource/attribute.
• The resources/attributes receiving the highest “not at all important” rating were:
2% Dark, starry night
sky/stargazing 2% Native American
culture/history
Figure 61. Combined proportions of “extremely important” and “very important” ratings of protecting park resources and attributes
0 20 40 60 80 100
Proportion of respondents
Recreationalopportunities
Native Americanculture/history
Educationalopportunities
Solitude
Dark, starry nightsky/stargazing
Natural quiet/sounds of nature
Geologicfeatures
Native plantlife
Native wildlife
Scenic views
Clean air(visibility)
Clean water
67%, N=215
71%, N=218
74%, N=218
74%, N=218
75%, N=213
84%, N=218
86%, N=221
86%, N=222
89%, N=222
95%, N=225
96%, N=223
97%, N=225
N=number of visitor groups
Resource/attribute
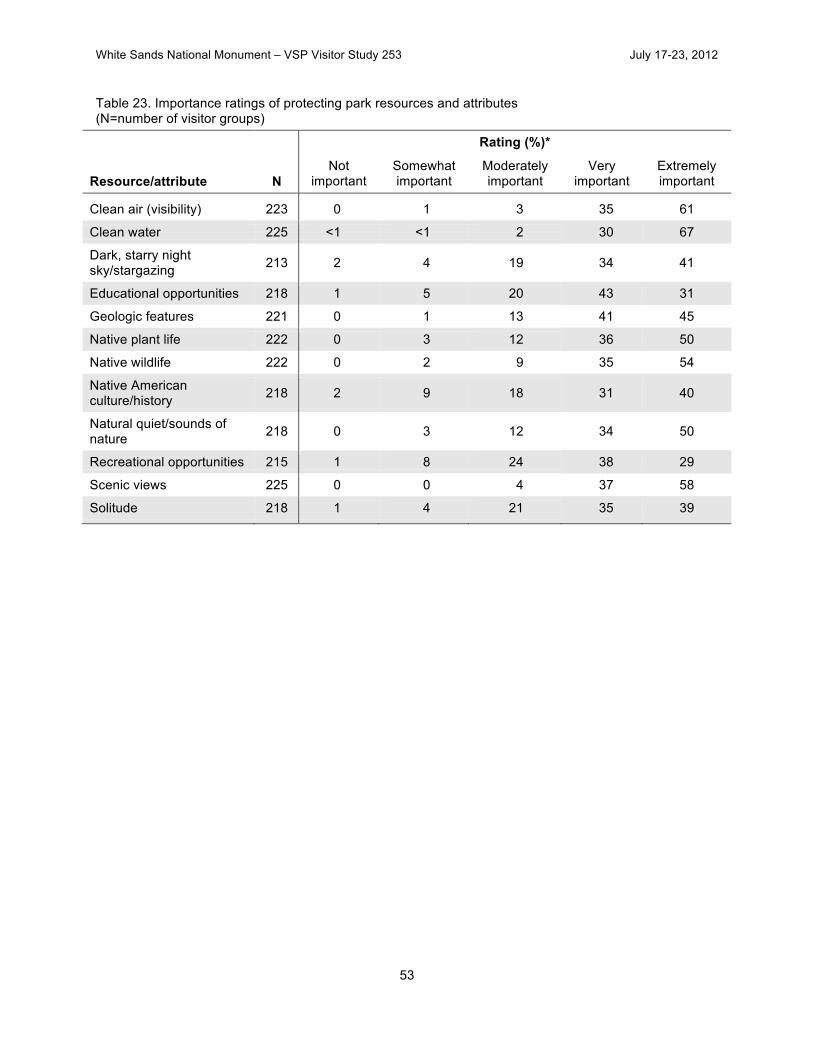
White Sands National Monument – VSP Visitor Study 253 July 17-23, 2012
53
Table 23. Importance ratings of protecting park resources and attributes (N=number of visitor groups)
Rating (%)*
Resource/attribute N Not
important Somewhat important
Moderately important
Very important
Extremely important
Clean air (visibility) 223 0 1 3 35 61
Clean water 225 <1 <1 2 30 67
Dark, starry night sky/stargazing 213 2 4 19 34 41
Educational opportunities 218 1 5 20 43 31
Geologic features 221 0 1 13 41 45
Native plant life 222 0 3 12 36 50
Native wildlife 222 0 2 9 35 54
Native American culture/history 218 2 9 18 31 40
Natural quiet/sounds of nature 218 0 3 12 34 50
Recreational opportunities 215 1 8 24 38 29
Scenic views 225 0 0 4 37 58
Solitude 218 1 4 21 35 39
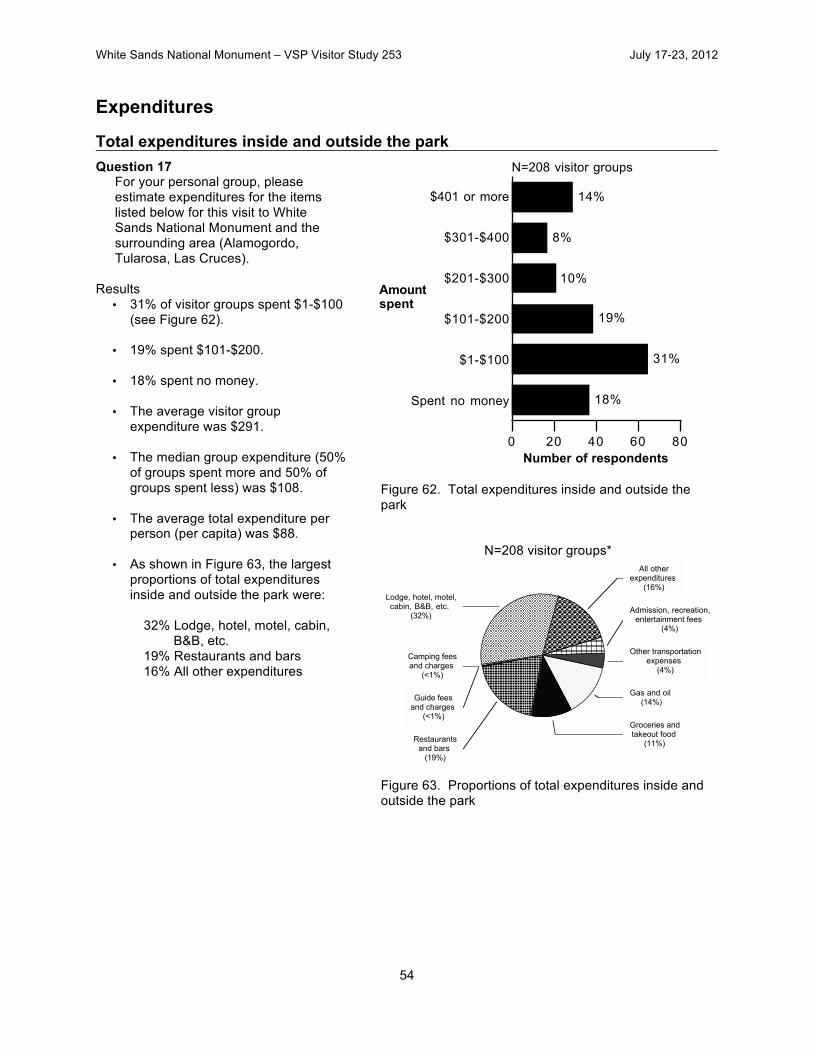
White Sands National Monument – VSP Visitor Study 253 July 17-23, 2012
54
Expenditures Total expenditures inside and outside the park Question 17
For your personal group, please estimate expenditures for the items listed below for this visit to White Sands National Monument and the surrounding area (Alamogordo, Tularosa, Las Cruces).
Results
• 31% of visitor groups spent $1-$100 (see Figure 62).
• 19% spent $101-$200.
• 18% spent no money.
• The average visitor group
expenditure was $291.
• The median group expenditure (50% of groups spent more and 50% of groups spent less) was $108.
• The average total expenditure per
person (per capita) was $88.
• As shown in Figure 63, the largest proportions of total expenditures inside and outside the park were:
32% Lodge, hotel, motel, cabin,
B&B, etc. 19% Restaurants and bars 16% All other expenditures
Figure 62. Total expenditures inside and outside the park
N=208 visitor groups*
Figure 63. Proportions of total expenditures inside and outside the park
0 20 40 60 80
Number of respondents
Spent no money
$1-$100
$101-$200
$201-$300
$301-$400
$401 or more
18%
31%
19%
10%
8%
14%
N=208 visitor groups
Amountspent
All otherexpenditures
(16%)
Admission, recreation,entertainment fees
(4%)
Other transportationexpenses
(4%)
Gas and oil (14%)
Groceries andtakeout food
(11%)Restaurants
and bars (19%)
Guide feesand charges
(<1%)
Camping feesand charges
(<1%)
Lodge, hotel, motel,cabin, B&B, etc.
(32%)
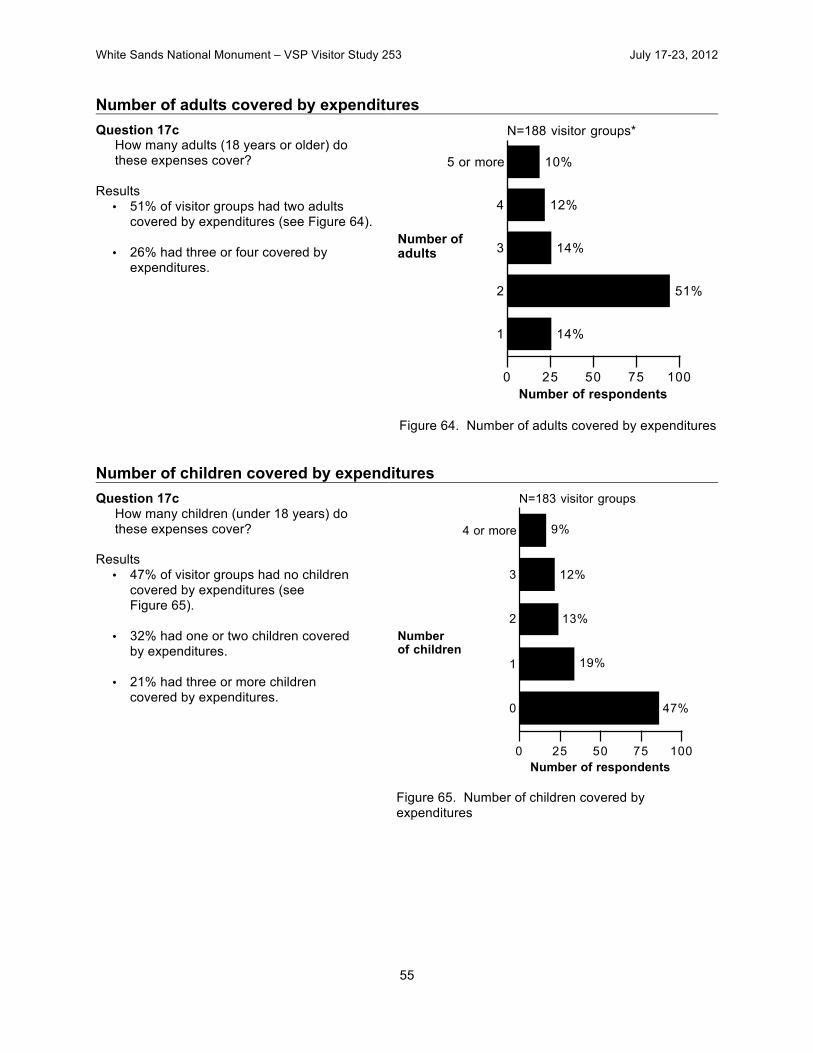
White Sands National Monument – VSP Visitor Study 253 July 17-23, 2012
55
Number of adults covered by expenditures Question 17c
How many adults (18 years or older) do these expenses cover?
Results
• 51% of visitor groups had two adults covered by expenditures (see Figure 64).
• 26% had three or four covered by
expenditures.
Figure 64. Number of adults covered by expenditures
Number of children covered by expenditures Question 17c
How many children (under 18 years) do these expenses cover?
Results
• 47% of visitor groups had no children covered by expenditures (see Figure 65).
• 32% had one or two children covered
by expenditures.
• 21% had three or more children covered by expenditures.
Figure 65. Number of children covered by expenditures
0 25 50 75 100
Number of respondents
1
2
3
4
5 or more
14%
51%
14%
12%
10%
N=188 visitor groups*
Number ofadults
0 25 50 75 100
Number of respondents
0
1
2
3
4 or more
47%
19%
13%
12%
9%
N=183 visitor groups
Numberof children

White Sands National Monument – VSP Visitor Study 253 July 17-23, 2012
56
Expenditures inside the park Question 17a
Please list your personal group’s total expenditures inside the park.
Results
• 52% of visitor groups spent $1-$50 (see Figure 66).
• 34% spent no money.
• The average visitor group
expenditure inside the park was $27.
• The median group expenditure (50% of groups spent more and 50% of groups spent less) was $10.
• The average total expenditure per
person (per capita) was $12.
• As shown in Figure 67, the largest proportion of total expenditures inside the park was:
68% All other expenditures
Figure 66. Total expenditures inside the park
N=155 visitor groups*
Figure 67. Proportions of total expenditures inside the park
0 30 60 90
Number of respondents
Spent no money
$1-$50
$51-$100
$101 or more
34%
52%
11%
3%
N=155 visitor groups
Amountspent
All otherexpenditures
(68%)
Admission,entertainment,recreation fees
(23%)
Groceries andtakeout food
(8%)

White Sands National Monument – VSP Visitor Study 253 July 17-23, 2012
57
Groceries and takeout food
• 77% of visitor groups spent no money on groceries and takeout food inside the park (see Figure 68).
• 13% spent $1-$10.
Figure 68. Expenditures for groceries and takeout food inside the park
Admission, recreation, entertainment fees
• 48% of visitor groups spent no money on admission, recreation, and entertainment fees inside the park (see Figure 69).
• 33% spent $1-$10.
Figure 69. Expenditures for admission, recreation, entertainment fees inside the park
0 25 50 75
Number of respondents
Spent no money
$1-$10
$11 or more
77%
13%
11%
N=95 visitor groups*
Amountspent
0 25 50 75
Number of respondents
Spent no money
$1-$10
$11-$20
$21 or more
48%
33%
10%
9%
N=131 visitor groups
Amountspent
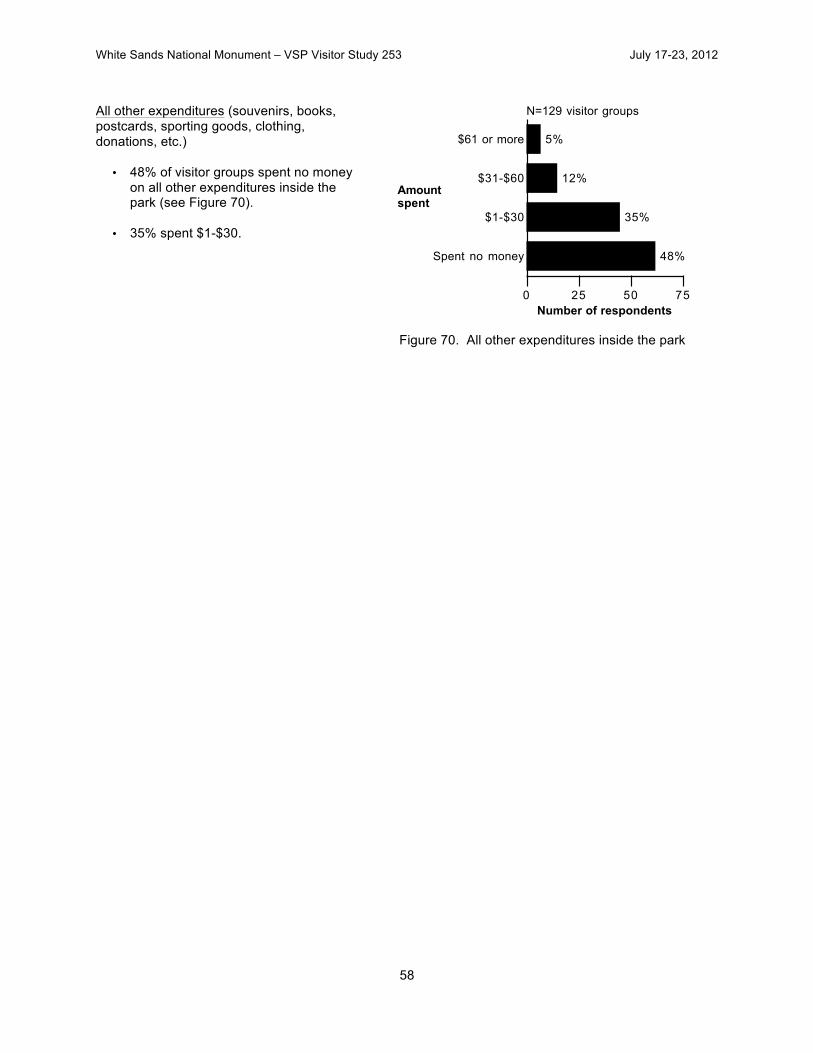
White Sands National Monument – VSP Visitor Study 253 July 17-23, 2012
58
All other expenditures (souvenirs, books, postcards, sporting goods, clothing, donations, etc.)
• 48% of visitor groups spent no money on all other expenditures inside the park (see Figure 70).
• 35% spent $1-$30.
Figure 70. All other expenditures inside the park
0 25 50 75
Number of respondents
Spent no money
$1-$30
$31-$60
$61 or more
48%
35%
12%
5%
N=129 visitor groups
Amountspent
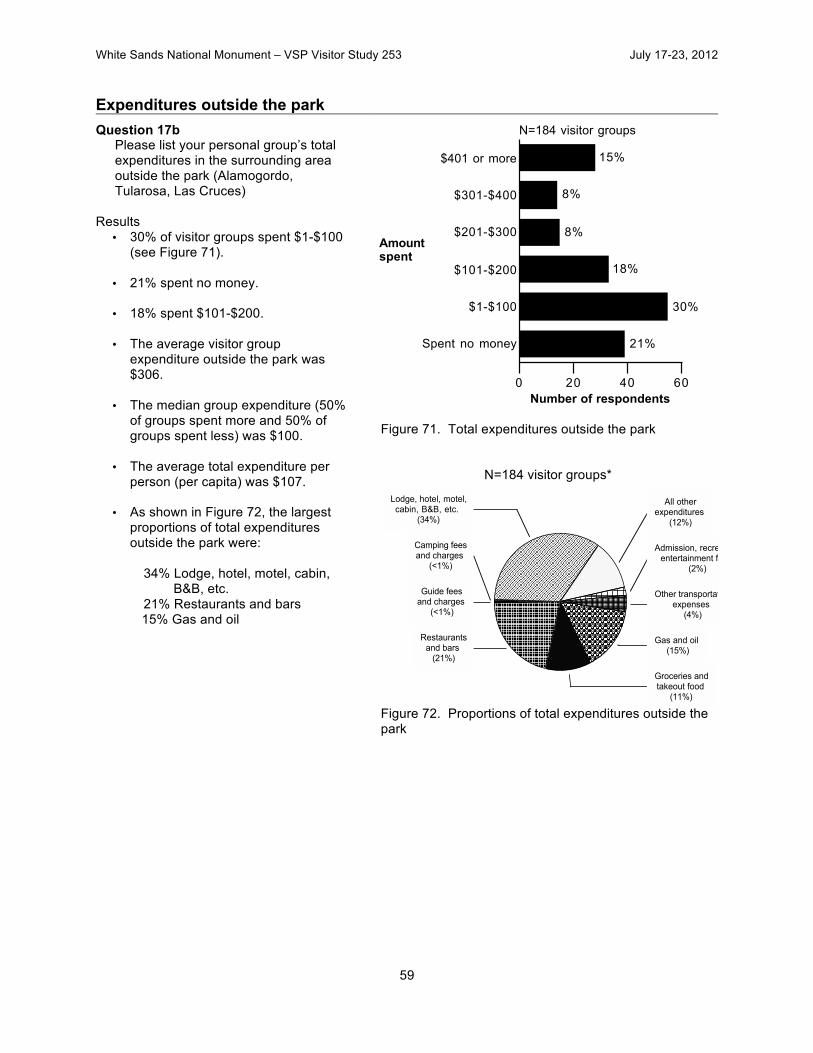
White Sands National Monument – VSP Visitor Study 253 July 17-23, 2012
59
Expenditures outside the park Question 17b
Please list your personal group’s total expenditures in the surrounding area outside the park (Alamogordo, Tularosa, Las Cruces)
Results
• 30% of visitor groups spent $1-$100 (see Figure 71).
• 21% spent no money.
• 18% spent $101-$200.
• The average visitor group
expenditure outside the park was $306.
• The median group expenditure (50%
of groups spent more and 50% of groups spent less) was $100.
• The average total expenditure per
person (per capita) was $107.
• As shown in Figure 72, the largest proportions of total expenditures outside the park were:
34% Lodge, hotel, motel, cabin,
B&B, etc. 21% Restaurants and bars 15% Gas and oil
Figure 71. Total expenditures outside the park
N=184 visitor groups*
Figure 72. Proportions of total expenditures outside the park
0 20 40 60
Number of respondents
Spent no money
$1-$100
$101-$200
$201-$300
$301-$400
$401 or more
21%
30%
18%
8%
8%
15%
N=184 visitor groups
Amountspent
All otherexpenditures
(12%)
Admission, recreation,entertainment fees
(2%)
Other transportationexpenses
(4%)
Gas and oil (15%)
Groceries andtakeout food
(11%)
Restaurantsand bars
(21%)
Guide feesand charges
(<1%)
Camping feesand charges
(<1%)
Lodge, hotel, motel,cabin, B&B, etc.
(34%)

White Sands National Monument – VSP Visitor Study 253 July 17-23, 2012
60
Lodge, hotel, motel, cabin, B&B, etc.
• 50% of visitor groups spent no money on lodging outside the park (see Figure 73).
• 24% spent $1-$100 or more.
Figure 73. Expenditures for lodging outside the park
Camping fees and charges
• 88% of visitor groups spent no money on camping fees and charges outside the park (see Figure 74).
• 7% spent $1-$10.
Figure 74. Expenditures for camping fees and charges outside the park
0 25 50 75
Number of respondents
Spent no money
$1-$100
$101-$200
$201 or more
50%
24%
13%
13%
N=127 visitor groups
Amountspent
0 20 40 60 80
Number of respondents
Spent no money
$1-$10
$11 or more
88%
7%
6%
N=89 visitor groups*
Amountspent
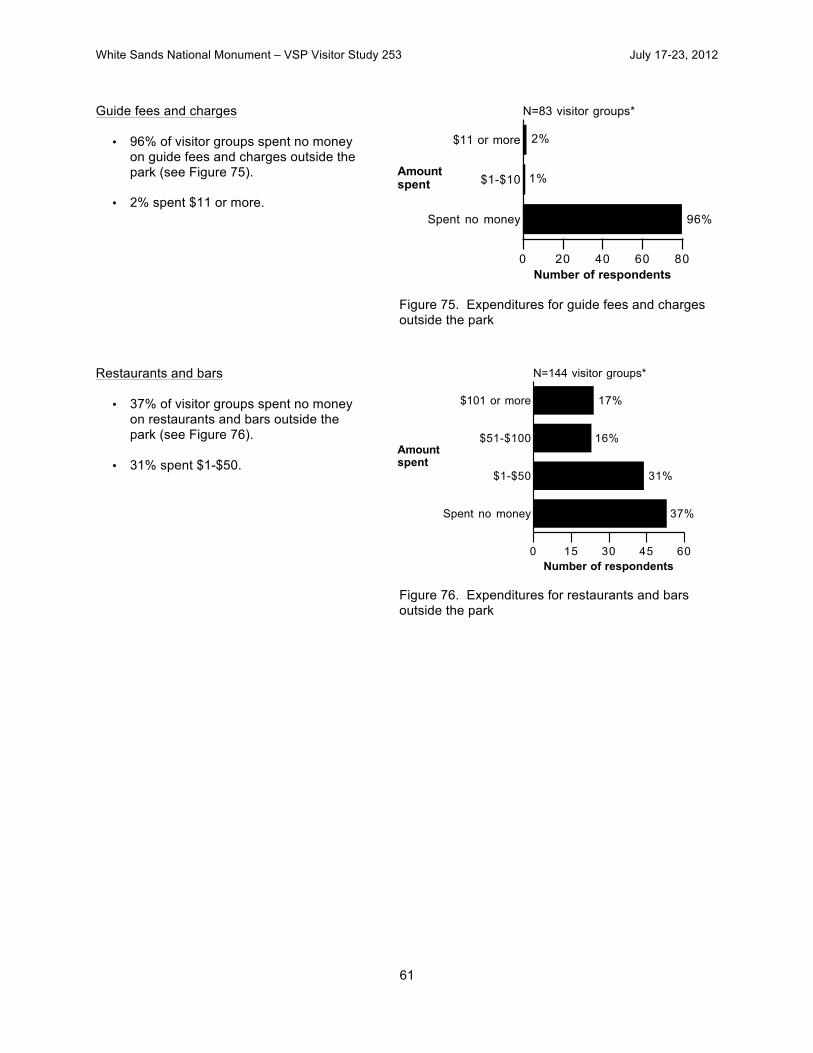
White Sands National Monument – VSP Visitor Study 253 July 17-23, 2012
61
Guide fees and charges
• 96% of visitor groups spent no money on guide fees and charges outside the park (see Figure 75).
• 2% spent $11 or more.
Figure 75. Expenditures for guide fees and charges outside the park
Restaurants and bars
• 37% of visitor groups spent no money on restaurants and bars outside the park (see Figure 76).
• 31% spent $1-$50.
Figure 76. Expenditures for restaurants and bars outside the park
0 20 40 60 80Number of respondents
Spent no money
$1-$10
$11 or more
96%
1%
2%
N=83 visitor groups*
Amountspent
0 15 30 45 60
Number of respondents
Spent no money
$1-$50
$51-$100
$101 or more
37%
31%
16%
17%
N=144 visitor groups*
Amountspent
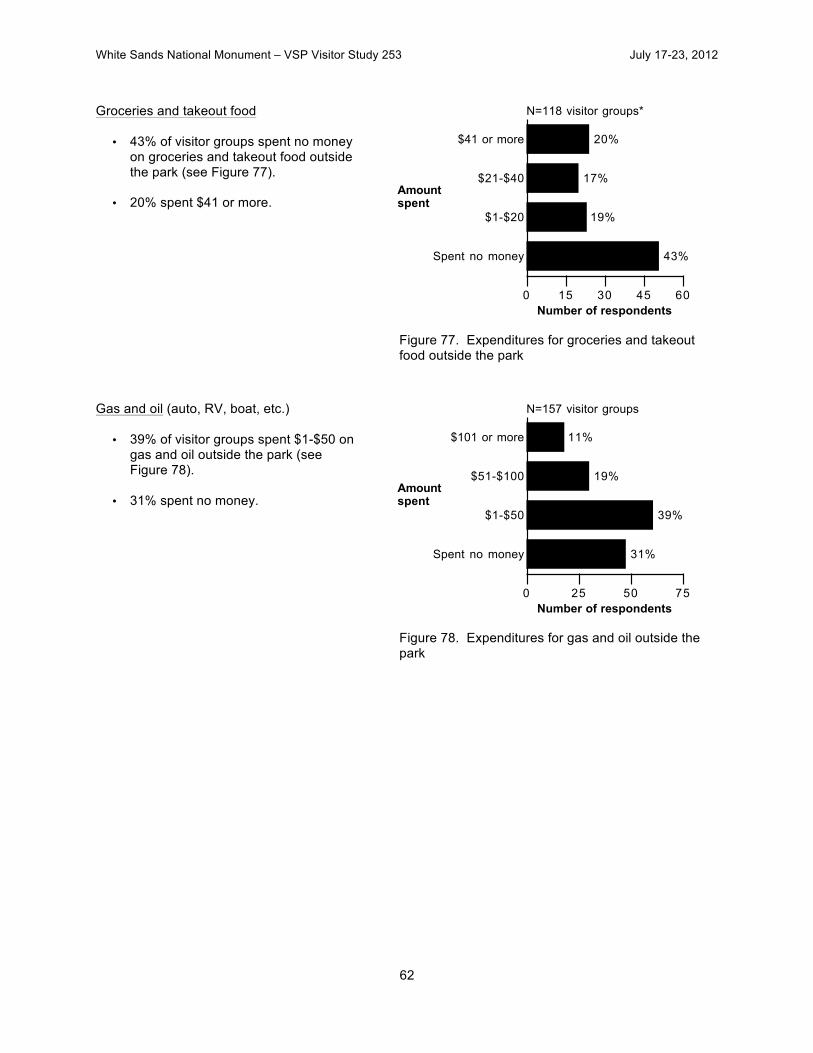
White Sands National Monument – VSP Visitor Study 253 July 17-23, 2012
62
Groceries and takeout food
• 43% of visitor groups spent no money on groceries and takeout food outside the park (see Figure 77).
• 20% spent $41 or more.
Figure 77. Expenditures for groceries and takeout food outside the park
Gas and oil (auto, RV, boat, etc.)
• 39% of visitor groups spent $1-$50 on gas and oil outside the park (see Figure 78).
• 31% spent no money.
Figure 78. Expenditures for gas and oil outside the park
0 15 30 45 60
Number of respondents
Spent no money
$1-$20
$21-$40
$41 or more
43%
19%
17%
20%
N=118 visitor groups*
Amountspent
0 25 50 75
Number of respondents
Spent no money
$1-$50
$51-$100
$101 or more
31%
39%
19%
11%
N=157 visitor groups
Amountspent
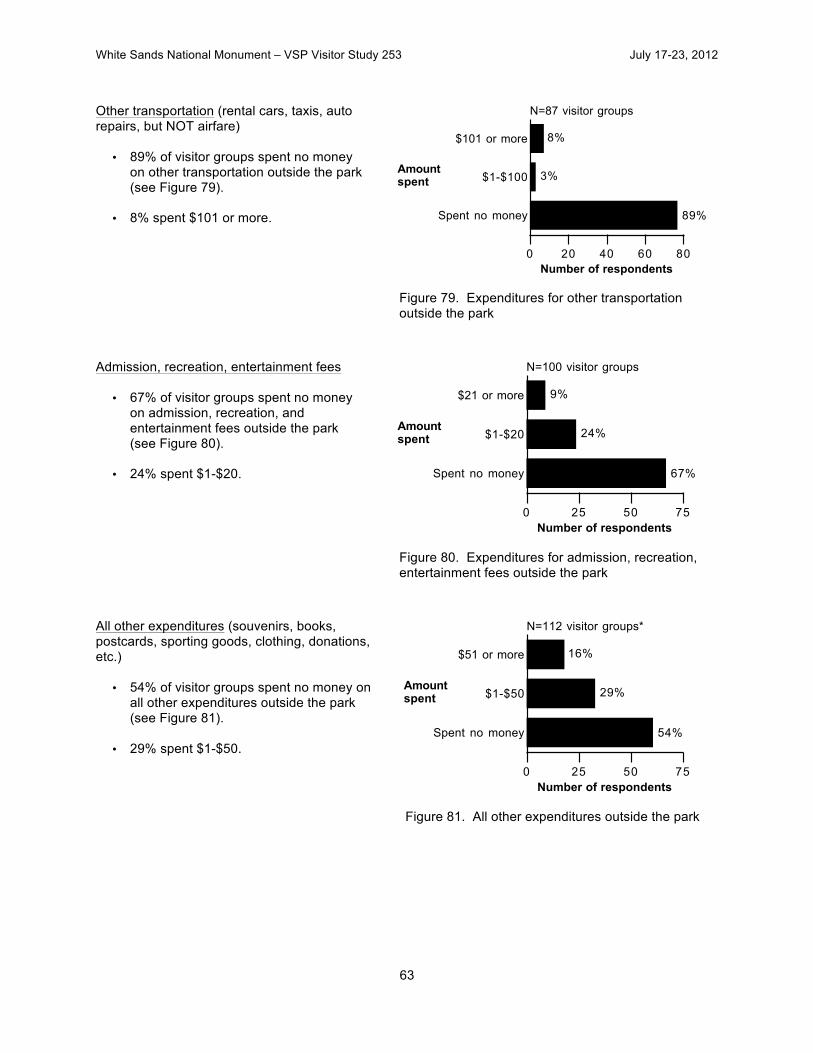
White Sands National Monument – VSP Visitor Study 253 July 17-23, 2012
63
Other transportation (rental cars, taxis, auto repairs, but NOT airfare)
• 89% of visitor groups spent no money on other transportation outside the park (see Figure 79).
• 8% spent $101 or more.
Figure 79. Expenditures for other transportation outside the park
Admission, recreation, entertainment fees
• 67% of visitor groups spent no money on admission, recreation, and entertainment fees outside the park (see Figure 80).
• 24% spent $1-$20.
Figure 80. Expenditures for admission, recreation, entertainment fees outside the park
All other expenditures (souvenirs, books, postcards, sporting goods, clothing, donations, etc.)
• 54% of visitor groups spent no money on all other expenditures outside the park (see Figure 81).
• 29% spent $1-$50.
Figure 81. All other expenditures outside the park
0 20 40 60 80
Number of respondents
Spent no money
$1-$100
$101 or more
89%
3%
8%
N=87 visitor groups
Amountspent
0 25 50 75
Number of respondents
Spent no money
$1-$20
$21 or more
67%
24%
9%
N=100 visitor groups
Amountspent
0 25 50 75
Number of respondents
Spent no money
$1-$50
$51 or more
54%
29%
16%
N=112 visitor groups*
Amountspent
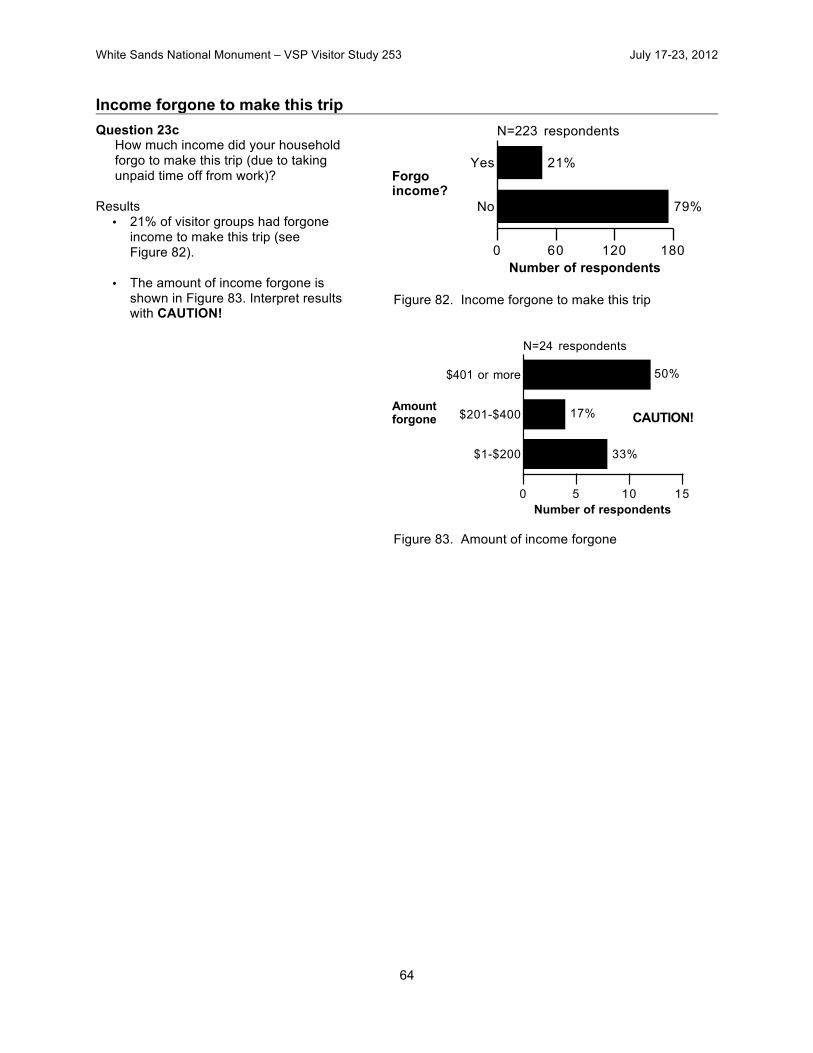
White Sands National Monument – VSP Visitor Study 253 July 17-23, 2012
64
Income forgone to make this trip Question 23c
How much income did your household forgo to make this trip (due to taking unpaid time off from work)?
Results
• 21% of visitor groups had forgone income to make this trip (see Figure 82).
• The amount of income forgone is shown in Figure 83. Interpret results with CAUTION!
Figure 82. Income forgone to make this trip
Figure 83. Amount of income forgone
0 60 120 180Number of respondents
No
Yes
79%
21%
N=223 respondents
Forgoincome?
0 5 10 15Number of respondents
$1-$200
$201-$400
$401 or more
33%
17%
50%
N=24 respondents
Amountforgone CAUTION!
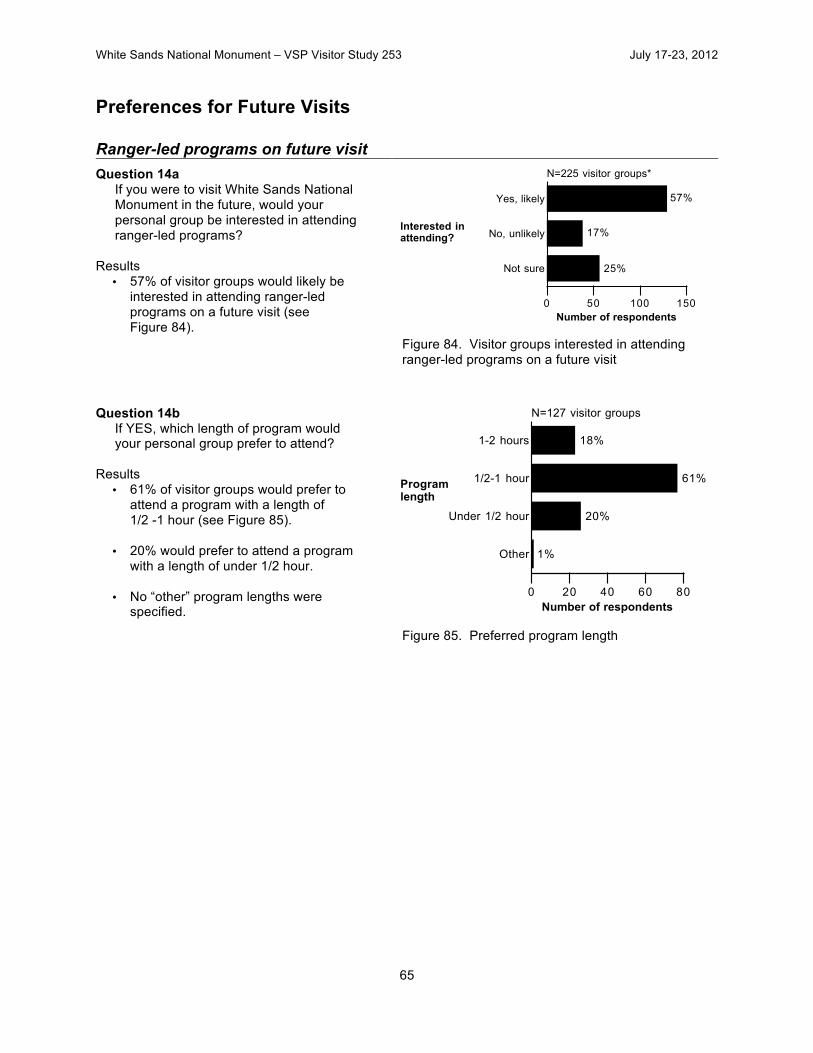
White Sands National Monument – VSP Visitor Study 253 July 17-23, 2012
65
Preferences for Future Visits
Ranger-led programs on future visit Question 14a
If you were to visit White Sands National Monument in the future, would your personal group be interested in attending ranger-led programs?
Results
• 57% of visitor groups would likely be interested in attending ranger-led programs on a future visit (see Figure 84).
Figure 84. Visitor groups interested in attending ranger-led programs on a future visit
Question 14b If YES, which length of program would your personal group prefer to attend?
Results
• 61% of visitor groups would prefer to attend a program with a length of 1/2 -1 hour (see Figure 85).
• 20% would prefer to attend a program with a length of under 1/2 hour.
• No “other” program lengths were
specified.
Figure 85. Preferred program length
0 50 100 150
Number of respondents
Not sure
No, unlikely
Yes, likely
25%
17%
57%
N=225 visitor groups*
Interested inattending?
0 20 40 60 80
Number of respondents
Other
Under 1/2 hour
1/2-1 hour
1-2 hours
1%
20%
61%
18%
N=127 visitor groups
Programlength
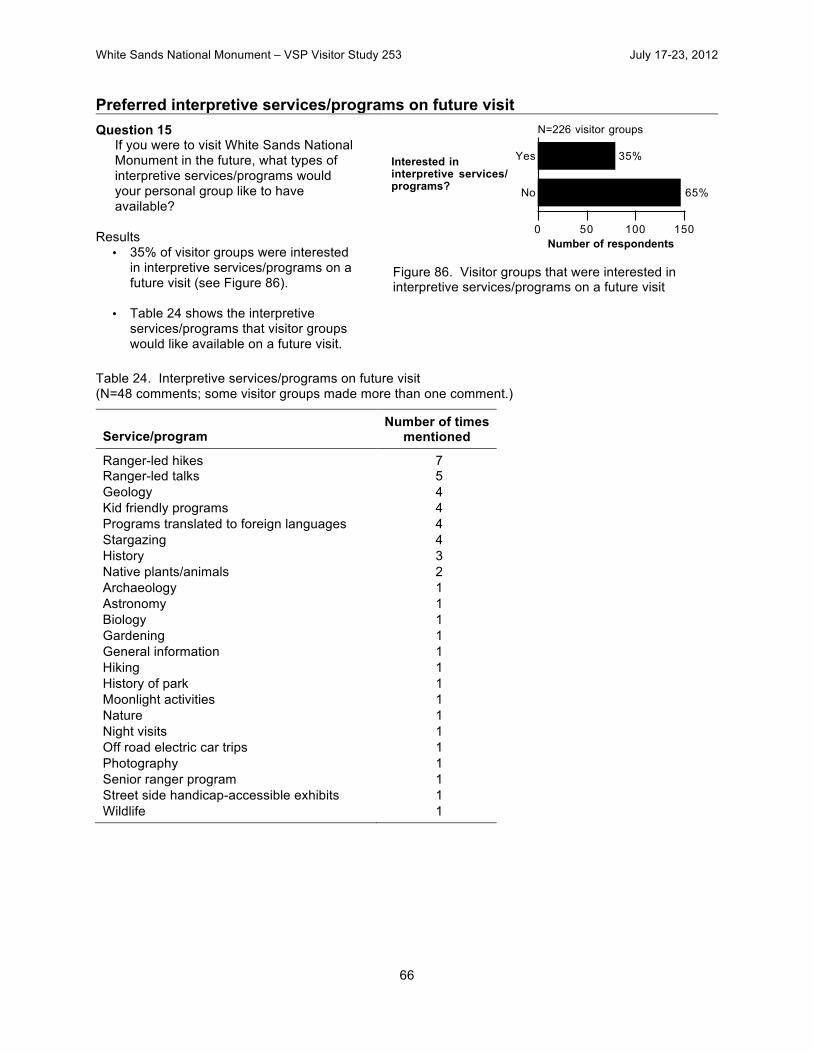
White Sands National Monument – VSP Visitor Study 253 July 17-23, 2012
66
Preferred interpretive services/programs on future visit Question 15
If you were to visit White Sands National Monument in the future, what types of interpretive services/programs would your personal group like to have available?
Results
• 35% of visitor groups were interested in interpretive services/programs on a future visit (see Figure 86).
• Table 24 shows the interpretive services/programs that visitor groups would like available on a future visit.
Figure 86. Visitor groups that were interested in interpretive services/programs on a future visit
Table 24. Interpretive services/programs on future visit (N=48 comments; some visitor groups made more than one comment.)
Service/program Number of times
mentioned
Ranger-led hikes 7 Ranger-led talks 5 Geology 4 Kid friendly programs 4 Programs translated to foreign languages 4 Stargazing 4 History 3 Native plants/animals 2 Archaeology 1 Astronomy 1 Biology 1 Gardening 1 General information 1 Hiking 1 History of park 1 Moonlight activities 1 Nature 1 Night visits 1 Off road electric car trips 1 Photography 1 Senior ranger program 1 Street side handicap-accessible exhibits 1 Wildlife 1
0 50 100 150Number of respondents
No
Yes
65%
35%
N=226 visitor groups
Interested ininterpretive services/programs?
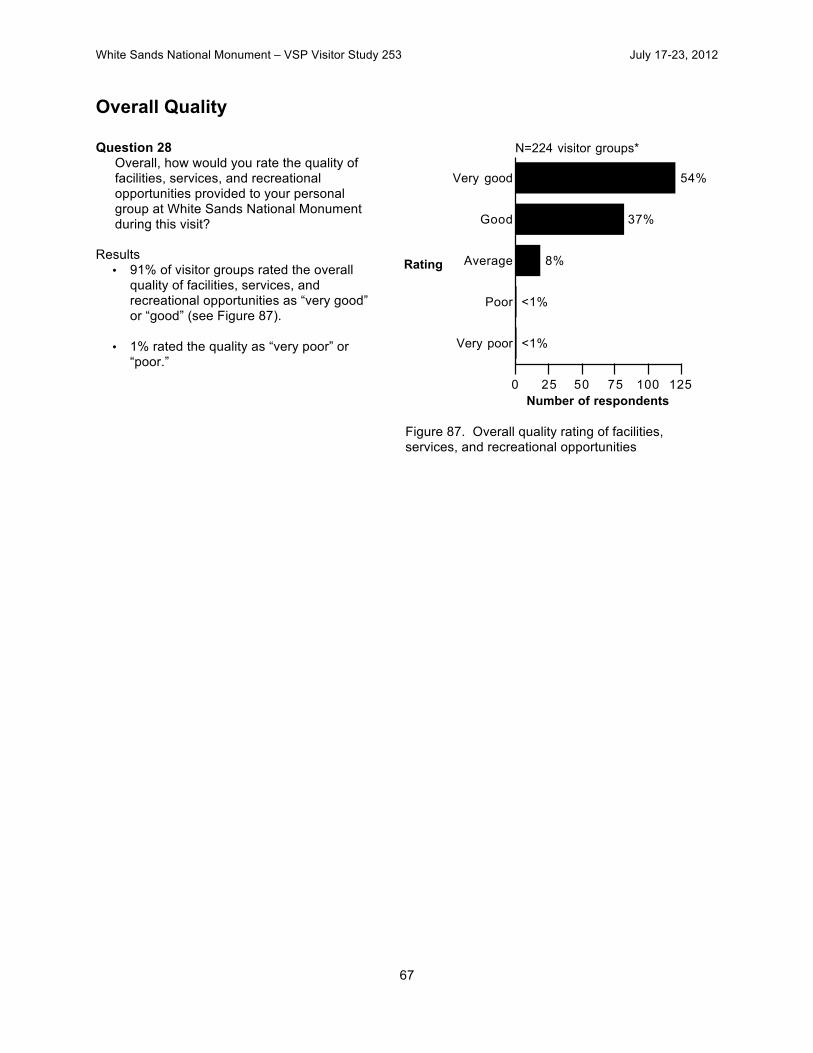
White Sands National Monument – VSP Visitor Study 253 July 17-23, 2012
67
Overall Quality
Question 28 Overall, how would you rate the quality of facilities, services, and recreational opportunities provided to your personal group at White Sands National Monument during this visit?
Results
• 91% of visitor groups rated the overall quality of facilities, services, and recreational opportunities as “very good” or “good” (see Figure 87).
• 1% rated the quality as “very poor” or
“poor.”
Figure 87. Overall quality rating of facilities, services, and recreational opportunities
0 25 50 75 100 125
Number of respondents
Very poor
Poor
Average
Good
Very good
<1%
<1%
8%
37%
54%
N=224 visitor groups*
Rating

White Sands National Monument – VSP Visitor Study 253 July 17-23, 2012
68
Visitor Comment Summaries Planning for the future Question 26
If you were a manager planning for the future of White Sands National Monument, what would your personal group propose? (Open-ended)
Results • 48% of visitor groups (N=108) responded to this
question.
• Table 25 shows a summary of visitor comments. The transcribed open-ended comments can be found in the Visitor Comments section.
Table 25. Planning for the future (N=129 comments; some visitor groups made more than one comment.)
Comment Number of times
mentioned
PERSONNEL (2%) Increased ranger presence 3 INTERPRETIVE SERVICES (13%) Night programs 3 Interpretive services in Spanish 2 More family programs 2 Other comments 10 FACILITIES/MAINTENANCE (22%) Cleaner restrooms 5 Expanded hiking trails 3 More shaded areas in park 3 Improved signage 2 RV campsites 2 Other comments 13 POLICY/MANAGEMENT (22%) Continued preservation of park 4 Increased advertising 4 Conservation 2 Expanded hours 2 Other comments 16 RESOURCE MANAGEMENT (2%) Comments 2 CONCESSIONS (2%) Comments 2

White Sands National Monument – VSP Visitor Study 253 July 17-23, 2012
69
Table 25. Planning for the future (continued)
Comment Number of times
mentioned
GENERAL (38%) Continue as is 21 Not sure 3 Spend more time 3 Education 2 More social events 2 Other comments 18
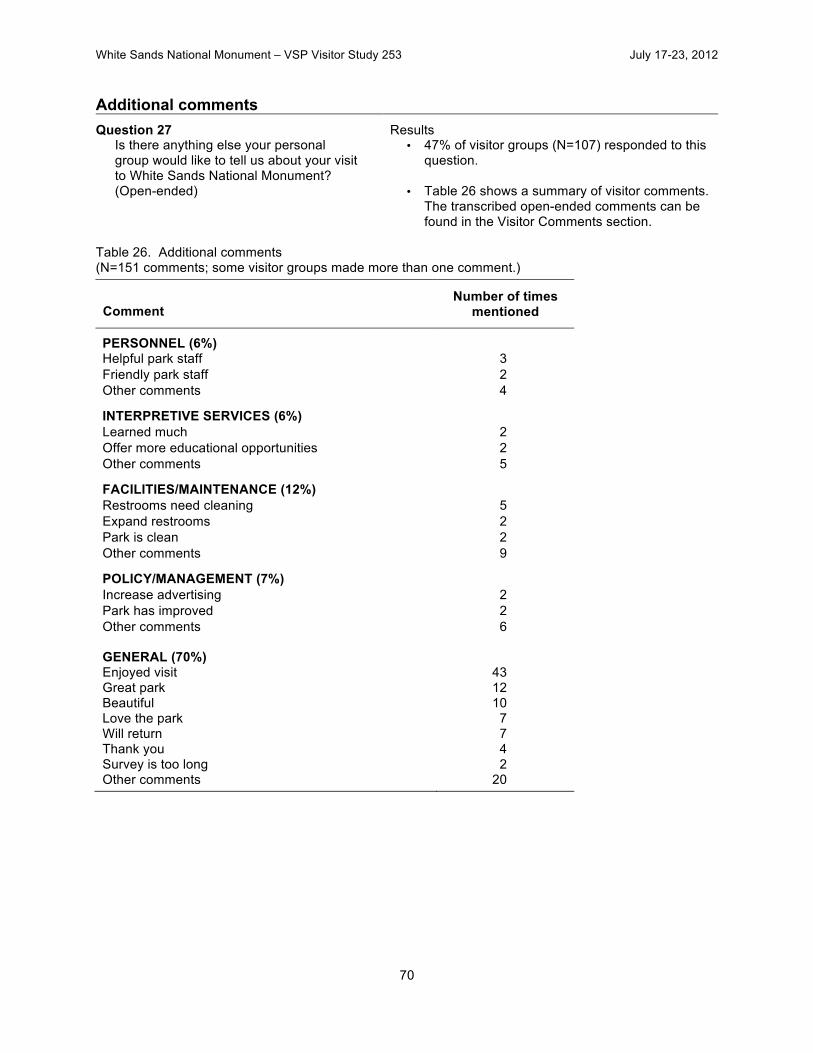
White Sands National Monument – VSP Visitor Study 253 July 17-23, 2012
70
Additional comments Question 27
Is there anything else your personal group would like to tell us about your visit to White Sands National Monument? (Open-ended)
Results • 47% of visitor groups (N=107) responded to this
question.
• Table 26 shows a summary of visitor comments. The transcribed open-ended comments can be found in the Visitor Comments section.
Table 26. Additional comments (N=151 comments; some visitor groups made more than one comment.)
Comment Number of times
mentioned
PERSONNEL (6%) Helpful park staff 3 Friendly park staff 2 Other comments 4 INTERPRETIVE SERVICES (6%) Learned much 2 Offer more educational opportunities 2 Other comments 5 FACILITIES/MAINTENANCE (12%) Restrooms need cleaning 5 Expand restrooms 2 Park is clean 2 Other comments 9 POLICY/MANAGEMENT (7%) Increase advertising 2 Park has improved 2 Other comments 6 GENERAL (70%) Enjoyed visit 43 Great park 12 Beautiful 10 Love the park 7 Will return 7 Thank you 4 Survey is too long 2 Other comments 20
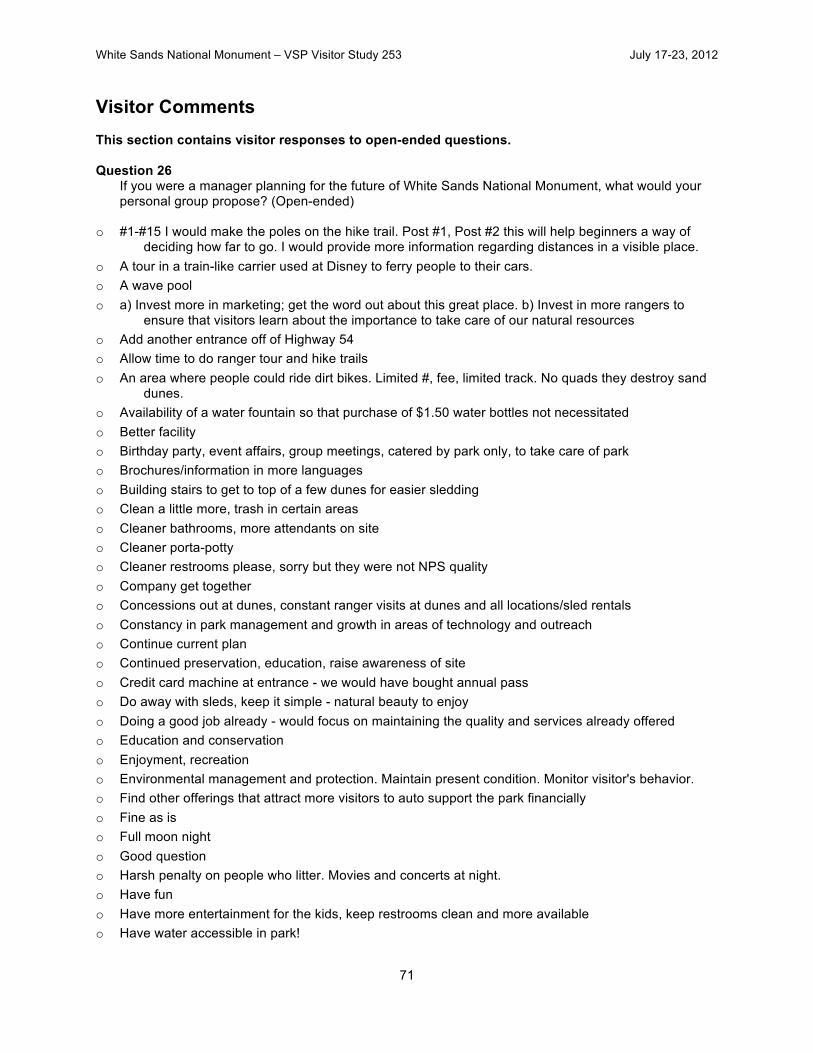
White Sands National Monument – VSP Visitor Study 253 July 17-23, 2012
71
Visitor Comments This section contains visitor responses to open-ended questions. Question 26
If you were a manager planning for the future of White Sands National Monument, what would your personal group propose? (Open-ended)
o #1-#15 I would make the poles on the hike trail. Post #1, Post #2 this will help beginners a way of deciding how far to go. I would provide more information regarding distances in a visible place.
o A tour in a train-like carrier used at Disney to ferry people to their cars. o A wave pool o a) Invest more in marketing; get the word out about this great place. b) Invest in more rangers to
ensure that visitors learn about the importance to take care of our natural resources o Add another entrance off of Highway 54 o Allow time to do ranger tour and hike trails o An area where people could ride dirt bikes. Limited #, fee, limited track. No quads they destroy sand
dunes. o Availability of a water fountain so that purchase of $1.50 water bottles not necessitated o Better facility o Birthday party, event affairs, group meetings, catered by park only, to take care of park o Brochures/information in more languages o Building stairs to get to top of a few dunes for easier sledding o Clean a little more, trash in certain areas o Cleaner bathrooms, more attendants on site o Cleaner porta-potty o Cleaner restrooms please, sorry but they were not NPS quality o Company get together o Concessions out at dunes, constant ranger visits at dunes and all locations/sled rentals o Constancy in park management and growth in areas of technology and outreach o Continue current plan o Continued preservation, education, raise awareness of site o Credit card machine at entrance - we would have bought annual pass o Do away with sleds, keep it simple - natural beauty to enjoy o Doing a good job already - would focus on maintaining the quality and services already offered o Education and conservation o Enjoyment, recreation o Environmental management and protection. Maintain present condition. Monitor visitor's behavior. o Find other offerings that attract more visitors to auto support the park financially o Fine as is o Full moon night o Good question o Harsh penalty on people who litter. Movies and concerts at night. o Have fun o Have more entertainment for the kids, keep restrooms clean and more available o Have water accessible in park!

White Sands National Monument – VSP Visitor Study 253 July 17-23, 2012
72
o Heard of Grand Canyon on back of East Coast but not White Sands National Park - promote/advertise more
o Hotel accommodation at park entrance o I would plan to keep the national monument as it is now o I would propose doing some background research on the park in regards to why the white sands and
its proximity to the missile site and the wildlife present at the park o Improvement in cleaning restrooms o Increased monitoring of speed limits. Continued preservation of plants & wildlife. o Keep it as is. Clean and patrolled. o Keep it clean and safe o Keep it like it is o Keep it like it is - not too much touristic o Keep it wonderful as is. I love the late summer hours. o Keep managing the park, we love it o Keep open to public o Keep weed or vegetation growth off sand dunes o Later park hours o Let more people know the history of the group who built the monument buildings! o Lodging other than tents o Longer hours o Lunch stop/picnic/fun o Maintain current services - it's a great attraction and seems well-managed o Maintain the cultural and natural reserves o Mark, more clearly, and further away, missile test closures o Maybe a shaded area of some kind out in the park o Maybe make another loop or two like Alkali flat trail. Keep information on native species. Very
informative. o More camping and acreage open to the public o More chemistry for exhibition - sand is quartz, other "sands" may be other compounds like gypsum
CaSO4 x 2H20 - it's possible to demonstrate crystal growth. And maybe to show experiment CaSO4 x 1/2 H2O --> CaSO4 x 2H2O known from every day life for more advanced students. It is possible easy to show chemical difference between gypsum and other "sands" ex. silica etc. That is an opportunity to show different levels of white. It is amazing how many different "white" colors are in our environment. It would be fine to organize small zoo with species typical for this area (white lizard, birds). It is not possible (or very difficult) to see them in habitat.
o More fun activities o More hiking trails and possibilities to enter deeper into the park o More info on sledding - continued preserving of park, geological/geographical features o More info on things to do or rentals available such as sledding the dunes o More programs for families and kids o More shaded areas or lights would be nice o More signage throughout the park telling people not to step on vegetation and do not take anything
from the park o More social functions i.e. "Day at the Sands" (many years ago, WSI Balloon Festival) o More trails like Alkali Flats o Natural sights

White Sands National Monument – VSP Visitor Study 253 July 17-23, 2012
73
o Night programs. Shade shelter at Alkali Flats, consistent mile markers. o None o None o None at this time. We like what is offered. o Not sure o Not sure o Nothing - it's perfect o Ok as is o Orientation film be available for viewing on automatic on-going basis o Plan for more outdoor activities (music, stargazing, hiking, etc.) early mornings or late afternoons o Preserve what's there o Rent sleds for free o RV camping in the park with electric and water and showers o RV campsites o Sell goggles - sunglasses and sand souvenirs o Showers. Everything else was enjoyable. o Sightseeing and education o Sites to camp overnight and set up small telescopes for star observing o Sorry no ideas o Spend at least 2 days, stay overnight o Spend more time sledding the dune o Stargazing - didn't see anything on it o Stay longer than three hours o Stay overnight to be able to enjoy more during the night o TV commercials within 300 miles emphasizing sledding the dunes and picnicking o To bring our own sleds and campout to watch the sunset and stars o To continue as doing now o To keep it positive o To keep negative growth at a minimum o Tours in Spanish o We all thought it was fabulous! Perhaps larger restroom facilities. o We enjoyed it as it is - we appreciated getting access to and walking on the dunes - we will take
greater opportunities to walk the trails next time. o We really liked the park and the caliber of protection and customer use, e.g. children sledding. So
more of the same. o When we walked the Boardwalk Trail a family was walking outside the boardwalk. The sign posted is
only in English and they were Hispanic. I know they didn't realize that they were not supposed to be off the boardwalk.
o Would stress the beauty of nature and promote conservation o You are doing a great job - just keep it that way - thank you! o You're doing just fine. Keep preserving a spectacular area. Next time I'll bring friends.

White Sands National Monument – VSP Visitor Study 253 July 17-23, 2012
74
Question 27 Is there anything else your personal group would like to tell us about your visit to White Sands National Monument? (Open-ended)
o A guided tour in a bus with a ranger would be great and worth a fee o A warning that the sleds really don't work unless you are a little kid o Alkali Flat Trail and backcountry camping was amazing. Very beautiful. Fun place to photograph.
Very unique. o Always a must-see experience for our college groups o Amazing experience o Amazing place o Amazing, beautiful, tranquil place! Don't change anything! Thank you for supporting. o Amazingly preserved, breathtaking park o An unforgettable experience, a huge natural playground for kids, a wonderful experience thanks to
NPS o Awesome o Beautiful park o Beautiful, would love to come back with my children and grandchildren o By far the best park! From the highway I have to tell my friends, "Trust me it's amazing inside" and it
always is! They are always surprised. o Came from Tulsa, OK to LA. We were just passing through and thought it was a pretty spectacular
place. We were glad we stopped. o Cost of sleds is outrageous o Enchanting place, helpful staff at visitor center o Enjoyed doing Junior Ranger program as an adult. Thank you. o Enjoyed every minute o Enjoyed it a great deal. Last time through was probably around 1990-92. Considerable positive
developments. Will stop by in the future if passing through. o Enjoyed it. Much more than expected! Poor restroom at visitor center. o Enjoyed very much o Every morning the picnic tables should be power washed before opening. A little dirty. o Excellent o Friendly park rangers and exceptional bathroom facilities made our trip very enjoyable o Good times, great sunsets o Great as it is now! o Great time! First time for most to ride Harley Davidson motorcycles over sand. o Great visit o Great visit, especially nice around sunset. Kids enjoyed sledding dunes. o Great! o Had a wonderful experience thank you for having the monument available for all to see o Had quite a few "first-timers" on this trip who had a great time. Keep up your excellent work. o I came as a teenager with my family and was super exciting to share this with my children. They
loved it! My in laws had never heard of it and really enjoyed it too. o I love White Sands o I most enjoyed the hiking o I would like to learn more about the weather (ex. how windy is it usually). The rangers were very
helpful and informative.

White Sands National Monument – VSP Visitor Study 253 July 17-23, 2012
75
o I would provide more information regarding distances in a visible place o Is it possible to lower the temperature a bit? We liked it very much! o It is a great monument. Great job. o It is a wonderful privilege to be able to visit such a natural wonder of God's making o It is amazing how we were able to enjoy all that nature o It is an interesting place. We will better plan our visit next time and will attend ranger-led activities. o It was a great place and perfect time o It was beautiful o It was beautiful and clean. Would have camped but there was a missile test. o It was fun to go back o It was great o It was great. It would be nice to have neon lights to guide back to path every 150 yards. o It was nice o It was very beautiful. We had never seen anything like it before. o It was very nice o It's the first place I have felt alive since I moved back to the USA o Just great o Kids loved it! o Love it o Mark water faucet as potable. Rangers and concessionaire very pleasant. o More promotion of White Sands o More trash receptacles and more bathrooms throughout the park o Much bigger/more than we expected - we sincerely wish we had devoted more time to White Sands. o Need picnic benches and more bathrooms, clean bathrooms!!! They were filthy. o Nice visit. Not good to eat - sand blowing all over the place. o Nice, quiet visit. Just like I like it! Bathrooms really smell BAD. o No, just that we look forward to our weekly visit. The park personnel are wonderful. o People love it! o Perhaps all day courses on nature geology (paid for by participants) o Possibility to stay later in the park for stargazing activities, etc. o Provide tips for the best sledding; hard sand is best o Rental equipment for sledding o Restrooms at visitor center poorly maintained o Restrooms unclean, need to keep restrooms clean! o Tell the park rangers to be more courteous and friendly! o Thank you o Thanks o The information pull-off areas with signs should be a little more off the road and the signs larger. o The new video is excellent and quite inspirational o The weather was ideal, breezy summer o There have been tremendous improvements over the last 40 years! o This survey takes to much time!! o This survey was too long
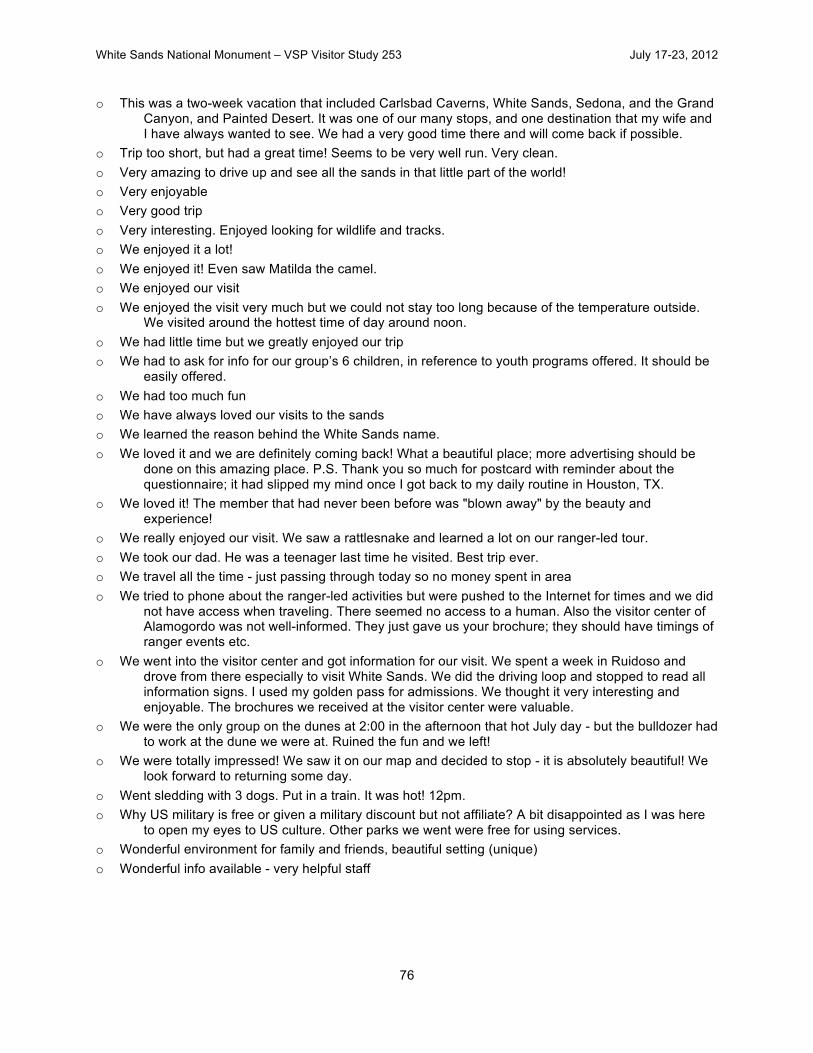
White Sands National Monument – VSP Visitor Study 253 July 17-23, 2012
76
o This was a two-week vacation that included Carlsbad Caverns, White Sands, Sedona, and the Grand Canyon, and Painted Desert. It was one of our many stops, and one destination that my wife and I have always wanted to see. We had a very good time there and will come back if possible.
o Trip too short, but had a great time! Seems to be very well run. Very clean. o Very amazing to drive up and see all the sands in that little part of the world! o Very enjoyable o Very good trip o Very interesting. Enjoyed looking for wildlife and tracks. o We enjoyed it a lot! o We enjoyed it! Even saw Matilda the camel. o We enjoyed our visit o We enjoyed the visit very much but we could not stay too long because of the temperature outside.
We visited around the hottest time of day around noon. o We had little time but we greatly enjoyed our trip o We had to ask for info for our group’s 6 children, in reference to youth programs offered. It should be
easily offered. o We had too much fun o We have always loved our visits to the sands o We learned the reason behind the White Sands name. o We loved it and we are definitely coming back! What a beautiful place; more advertising should be
done on this amazing place. P.S. Thank you so much for postcard with reminder about the questionnaire; it had slipped my mind once I got back to my daily routine in Houston, TX.
o We loved it! The member that had never been before was "blown away" by the beauty and experience!
o We really enjoyed our visit. We saw a rattlesnake and learned a lot on our ranger-led tour. o We took our dad. He was a teenager last time he visited. Best trip ever. o We travel all the time - just passing through today so no money spent in area o We tried to phone about the ranger-led activities but were pushed to the Internet for times and we did
not have access when traveling. There seemed no access to a human. Also the visitor center of Alamogordo was not well-informed. They just gave us your brochure; they should have timings of ranger events etc.
o We went into the visitor center and got information for our visit. We spent a week in Ruidoso and drove from there especially to visit White Sands. We did the driving loop and stopped to read all information signs. I used my golden pass for admissions. We thought it very interesting and enjoyable. The brochures we received at the visitor center were valuable.
o We were the only group on the dunes at 2:00 in the afternoon that hot July day - but the bulldozer had to work at the dune we were at. Ruined the fun and we left!
o We were totally impressed! We saw it on our map and decided to stop - it is absolutely beautiful! We look forward to returning some day.
o Went sledding with 3 dogs. Put in a train. It was hot! 12pm. o Why US military is free or given a military discount but not affiliate? A bit disappointed as I was here
to open my eyes to US culture. Other parks we went were free for using services. o Wonderful environment for family and friends, beautiful setting (unique) o Wonderful info available - very helpful staff


White Sands National Monument – VSP Visitor Study 253 July 17-23, 2012
78
Appendix 1: The Questionnaire


White Sands National Monument – VSP Visitor Study 253 July 17-23, 2012
80
Appendix 2: Additional Analysis The Visitor Services Project (VSP) offers the opportunity to learn from VSP visitor study data through additional analysis. Two-way and three-way cross tabulations can be made with any questions. Below are some examples of the types of cross tabulations that can be requested. To make a request, please use the contact information below, and include your name, address and phone number in the request. 1. What proportion of family groups with children attend interpretive programs? 2. Is there a correlation between visitors’ ages and their preferred sources of information about the park? 3. Are highly satisfied visitors more likely to return for a future visit? 4. How many international visitors participate in hiking? 5. What ages of visitors would use the park website as a source of information on a future visit? 6. Is there a correlation between visitor groups’ rating of the overall quality of their park experience and
their ratings of individual services and facilities? 7. Do larger visitor groups (e.g., four or more) participate in different activities than smaller groups? 8. Do frequent visitors rate the overall quality of their park experiences differently than less frequent
visitors? The VSP database website (http://vsp.uidaho.edu) allows data searches for comparisons of data from one or more parks. For more information please contact: Visitor Services Project Park Studies Unit College of Natural Resources University of Idaho 875 Perimeter Drive MS 1139 Moscow, ID 83843-1139 Phone: 208-885-2585 Fax: 208-885-4261 Email: [email protected] Website: http://www.psu.uidaho.edu


White Sands National Monument – VSP Visitor Study 253 July 17-23, 2012
82
Appendix 3: Decision Rules for Checking Non-response Bias There are several methods for checking non-response bias. However, the most common way is to use some demographic indicators to compare between respondents and non-respondents (Dey 1997; Salant and Dillman 1994; Dillman and Carley-Baxter 2000; Dillman, 2007; Stoop 2004). In this study, we used five variable group type, group size, age of the group member (at least 16 years old) completing the survey, whether the park was the primary destination for the visit, and visitor’s place of residence proximity to the park to check for non-response bias. A Chi-square tests were used to detect the difference in the response rates among different group types, whether the park was the primary destination for this visit, and visitor’s place of residence and proximity to the park. The hypothesis was that there is no significant difference across different categories (or groups) between respondents and non-respondents. If the p-value is greater than 0.05, the difference between respondents and non-respondents is judged to be insignificant.
Two independent-sample T-tests were used to test the differences between respondent’s and non-respondent’s average age and group size. The p-values represent the significance levels of these tests. If p-value is greater than 0.05, the two groups are judged to be insignificantly different. Therefore, the hypotheses for checking non-response bias are:
1. Respondents from different group types are equally represented;
2. Respondents and non-respondents are not significantly different in terms of proximity from their home to the park;
3. Respondents and non-respondents are not significantly different in terms of reason for visiting the
park;
4. Average age of respondents – average age of non-respondents = 0; and
5. Average group size of respondents – average group size of non-respondents = 0
As shown in Tables 2 to 5, the p-value for respondent/non-respondent comparisons for age is less than 0.05, indicating significant differences between respondents and non-respondents. The results indicate that visitors at younger age ranges (especially 40 years old and younger) may be underrepresented in the survey results, and visitors traveling with friends were underrepresented in the survey results. The differences, however, were not found in other variables. Results of the study in this report only reflect the simple frequencies. Inferences of the survey results should be weighted to counterbalance the effects of non-response bias.
White Sands National Monument – VSP Visitor Study 253 July 17-23, 2012
83
References Dey, E. L. (1997). Working with Low Survey Response Rates: The Efficacy of Weighting Adjustment.
Research in Higher Education, 38(2): 215-227. Dillman, D. A. (2007). Mail and Internet Surveys: The Tailored Design Method, Updated version with New
Internet, Visual, and Mixed-Mode Guide, 2nd Edition, New York: John Wiley and Sons, Inc. Dillman, D. A. and Carley-Baxter, L. R. (2000). Structural determinants of survey response rate over a 12-
year period, 1988-1999, Proceedings of the section on survey research methods, 394-399, American Statistical Association, Washington, D.C.
Filion, F. L. (Winter 1975-Winter 1976). Estimating Bias due to Non-response in Mail Surveys. Public Opinion Quarterly, Vol 39 (4): 482-492.
Goudy, W. J. (1976). Non-response Effect on Relationships Between Variables. Public Opinion Quarterly. Vol 40 (3): 360-369.
Mayer, C. S. and Pratt Jr. R. W. (Winter 1966-Winter 1967). A Note on Non-response in a Mail Survey. Public Opinion Quarterly. Vol 30 (4): 637-646.
Salant, P. and Dillman, D. A. (1994). How to Conduct Your Own Survey. U.S.: John Wiley and Sons, Inc. Stoop, I. A. L. (2004). Surveying Non-respondents. Field Methods, 16 (1): 23.

The Department of the Interior protects and manages the nation’s natural resources and cultural heritage; provides scientific and other information about those resources; and honors its special responsibilities to American Indians, Alaska Natives, and affiliated Island Communities. NPS 142/120274, March 2013

National Park Service U.S. Department of the Interior
Natural Resource Stewardship and Science 1201 Oakridge Drive, Suite 150 Fort Collins, CO 80525 www.nature.nps.gov
EXPERIENCE YOUR AMERICA TM


![TAR-SANDS (ARENAS BITUMINOSAS) [OIL-SANDS]](https://img.dokumen.tips/doc/110x75/546e6d60b4af9faa268b468b/tar-sands-arenas-bituminosas-oil-sands.jpg)