Embed Size (px)
Citation preview

Wheels When Who Wants Them:Assessing Social Equity and Access Implications of Carsharing in NYC
A Thesis Presented to the Faculty of Architecture and PlanningCOLUMBIA UNIVERSITY
In Partial Fulfillment of the Requirements for the Degree Master of Science in Urban Planning
Stephanie ShellooeMay 2013

2 | Shellooe| ShELLOOE

3 |
AbSTrACT
Carsharing operations such as Zipcar have grown in popularity in the last two decades, and provide a case study for examining transportation equity. These programs provide a vehicle to rent by the hour or day usually based on an hourly fee and an annual membership fee. The service provides a transportation alternative that could reduce economic and environmental costs of car use, and increase access -- ultimately creating a more sustainable transportation network. however, as with many transportation investments, it is unclear whether these benefits are actually accruing to those with the most limited transport options. Governments subsidize carsharing operations through free parking for shared vehicles; New York City has even altered its zoning code to promote carsharing and encourages the system through PlaNYC 2030. Public subsidization provides the impetus for analyzing private carshare providers through a social justice framework. This thesis will examine whether the distribution of Zipcars (the largest carsharing operator in NYC) is socially equitable, and whether carsharing could potentially increase transport equity through alternative carshare models. The study uses mixed methods including spatial and statistical analysis of carshare density to determine if shared vehicles are correlated with equity variables, controlling for feasibility indicators. This research also includes an intercept survey to determine the barriers and potential of carsharing for non-work trips. The results indicate that shared vehicle density is most closely related to low car ownership, high level of alternative commuters, and high level of education; and that both spatial and corporate barriers exclude segments of the public from participating in the service. Expanding the opportunity to access carsharing through community-based innovations and government intervention could create a more equitable and sustainable transportation system.
Key Words: Carsharing, transportation planning, social equity, access
Advisor: Professor David King

4 | Shellooe
ACkNoWlEdgEmENTS
I would like the thank several people that made this research possible. I would first like to acknowledge my advisor, Professor David King for his guidance and feedback throughout the process of the thesis. I would also like to thank my reader, Professor Elliott Sclar for his feedback during the jury process, and for sage advice about thesis writing in general. I would also like to acknowledge Jen Mathews at Zipcar Public Relations for providing key research materials. Many thanks to Kevin Gonyo in his capacity as research assistant, editor and moral support, and my peers in GSAPP for their feedback thoughout the process.

5 |
TAblE of CoNTENTS
Introduction 7 Research Question & hypothesis Background 9 Terminology Overview of Carsharing Carsharing in NYC Literature Review 18 Benefits Disadvantages Government Intervention Transportation Equity Data & Methodology 25 Variables Secondary Data Methodology Primary Data: Surveys Analysis 31 Carsharing Density Index Location Analysis Survey Analysis Discussion 48 Findings & Implications Policy Recommendations Further Research Conclusion 52References 54Appendix 57

6 | Shellooe

7 |
The increase in collaborative consumption has been cited as the future of sustainable urban life. The “access economy” as it has been termed, involves a more efficient use of resources because many people are sharing a common good. The system provides the benefits of ownership, while reducing costs to individuals and reducing the environmental impact of producing and storing goods. Transportation is a prime candidate for shifting to a model of collaborative consumption. Most privately owned vehicles in the United States are only used for one hour per day. The amount of land devoted to accommodating and storing vehicles that are used so infrequently is an enormously inefficient use of scarce land in metropolitan areas. Carsharing is a key innovation in transportation that incorporates the access economy. These programs provide access for members to a shared vehicle to reserve by the hour or day for an hourly user fee and an annual membership fee. Carsharing organizations such as Zipcar have grown in popularity since the modern iteration of the model in Switzerland in the 1980s and introduction in the United States in the 1990s. The system provides a transportation alternative that could reduce economic and environmental costs of car use, and increase access -- ultimately creating a more sustainable transportation network. however, as with many transportation investments, it is unclear whether these benefits are actually accruing to those with the most limited transport options. The distribution of benefits and costs may be increasing instead of reducing the inequality in current transportation systems. And while private firms are not required to mitigate equity issues in the provision of their service, government intervention in private carsharing organizations can bring equity issues into consideration. City governments subsidize carsharing operations through free or reduced cost parking for shared vehicles; New York City has even altered its zoning code to promote carsharing and encourages the system through PlaNYC 2030. If shared vehicles do not provide equal access to participate in the service, this could lead to exacerbated lack of access and economic opportunity for those who need it most. Since increasing access to basic goods and services is one of the goals of sustainable transportation investments the social justice implications of carsharing should be examined. Carsharing has the potential to remove barriers to car ownership such as purchase cost, insurance, fuel, and parking costs while still retaining the freedom and flexibility of using a private automobile. Studies report that the system enhances mobility, allowing users to reach more destinations more quickly, while
INTroduCTIoN
INTRODUCTION

8 | Shellooe
also promoting “judicious automobility” (Cervero and Tsai 2004). In addition, the image that Zipcar portrays promotes awareness of environmental effects of driving, collaborative consumption and ideals of an access economy that are becoming more and more relevant. With all of these proven benefits, cities devoting strategies to reduce congestion and pollution and promote more sustainable forms of transportation would naturally seek to promote and encourage carsharing. however, as with much public transportation investment, the question of equity has not been addressed to truly justify public subsidization of this system.
This thesis will examine if carsharing – and Zipcar in particular – has increased access in New York City in a socially just way. The research question to investigate this issue is two-fold. Are Zipcars located according to feasibility patterns (such as density and proximity to transit) or patterns that exclude low-income and minority residents? And does Zipcar have the potential to increase accessibility for disadvantaged populations in New York City? The thesis will utilize mixed methods to study these questions. Secondary data and regression analysis will be used to determine the differences between areas that do and do not have access to shared vehicles in terms of feasibility and equity variables. A customer intercept survey at several shopping centers will provide more qualitative data to determine the potential barriers to carsharing. I anticipate that Zipcar, as a profit-motivated firm, will locate their service according to where it will be the most economically successful, based on existing studies of carsharing members. Therefore, I hypothesize that the distribution of Zipcars will be correlated with the feasibility variables such as population density and zero-car households. however, the typical carshare member represents an already privileged segment of the population – white, well-educated and high income. Therefore, I also expect Zipcars to be distributed where these populations are most concentrated and will be highly correlated to these variables. For the second part of the analysis, I anticipate that the intercept survey will provide a representative sample of patrons at the shopping centers. I expect this sample to illuminate the transport considerations for non-work trips to determine differences in travel behavior and choices for a variety of demographic groups.
rESEArCh QuESTIoN & hYpoThESIS

9 |
bACkgrouNd
TErmINologY The term carsharing in the United States refers to the type of system described here: access to shared vehicles to rent for short periods of time, for an hourly fee. This differs from the term used for this type of operation in Europe and other parts of the world, which is car club. In those locations, carsharing refers to the phenomenon known in the U.S. as car-pooling or ride sharing, where two or more people share a vehicle to a common destination. The term carsharing will be used throughout the remainder of this thesis to refer to the accepted U.S. definition below. Since this is a relatively new phenomenon, there has not been a consensus on a single definition. However, the State of Washington provides a definition that captures the main characteristics of carsharing (Millard-Ball, Murray et al. 2005):
ovErvIEW of CArShArINg The first iteration of carsharing was initiated in Zurich, Switzerland in 1948 as a way to provide individuals who could not afford a car with a access to a shared vehicle (Shaheen 1998). Carsharing began to gain more widespread attraction and success in Europe in the 1980s. This included efforts by grassroots neighborhood coalitions, as well as for-profit business ventures. In the United States, carshare demonstration programs were piloted in the mid-1980s in Indiana and San Francisco, California. These initial ventures ultimately failed, but as the idea of shared vehicles gained traction, several more carsharing organizations were created in the 1990s. Although the first attempts at carsharing were very small-scale, technological innovations have allowed larger-scale systems to become more viable. Carsharing implementation in the US has taken many forms, from community garages to station cars, but there are certain aspects that unite the divergent systems (Shaheen, Cohen et al. 2005). According to a meta-study by the Transit Cooperative Research Program, the shared characteristics among all of the carsharing iterations are: an organized group of participants; one or more shared vehicles; a decentralized network of parking locations; usage booked in advance; rentals for short time periods;
A membership program intended to offer an alternative to car ownership under which persons or entities that become members are permitted to use vehicles from a fleet on an hourly basis.
BACKGROUND

10 | Shellooe
and self-accessing vehicles (Millard-Ball, Murray et al. 2005). The organizations that have pioneered carsharing programs range from non-profit, community organized systems to large-scale corporate operations. A study of North American carsharing organizations also discovered common goals amongst the organizations including: reducing congestion and auto ownership, providing cost savings to customers, reducing emissions, facilitating more efficient land use, and increasing mobility options (Shaheen, Cohen et al. 2005).
Figure 1: Carsharing Growth
Source: Shaheen and Cohen 2012

11 |
Carsharing has already gained a significant user base and is anticipated to continue growing. A study at Transportation Sustainability Research Center and UC Berkeley demonstrates the rapid growth of carsharing since its inception. In 2012, membership had increased to approximately 1.7 million and over 43,000 shared vehicles worldwide. In the United States, membership has grown to 806,332 members and a vehicle fleet of 12,634, provided by 26 carsharing operators shown in Figure 1 (Shaheen 2012). Between July 2011-2012, membership grew 43.8% and fleets grew 26.1% in the United States. Frost and Sullivan project that the industry will grow 20-30% per year through 2018 and that it will reach 8.4 million members and 160,000 vehicles by 2020 (Sullivan 2010). A study by Shaheen estimates that between 2010 and 2015, membership will increase in major metropolitan areas by 10% of individuals over the age of 21 (Shaheen and Cohen 2012). North American carsharing systems have relatively high member-vehicle ratios, estimated at 60:1 in 2010 (Shaheen and Cohen 2012). This implies that the vehicles are used fairly intensively, and that density is important to the success of carsharing in the United States. The dominant market segments include: neighborhood residential, business, and college/university. however, Shaheen and Cohen’s forecast includes an increase in lower-density locations through innovations in the system such as personal vehicle sharing. Carsharing has been shown to attract a certain demographic user-base. A preliminary study of users in European carsharing organizations found most members were between 25 and 40 years old, well-educated and had modest incomes (Shaheen 1998). In Cervero’s analysis of the first year of San Francisco’s City CarShare users, over 50% were in their 30’s, over 62% were female and 88% were white (Cervero 2003). Cervero’s study also showed that income, age, education and private car ownership were all predictors of the likelihood to participate in carsharing. Through surveys and focus groups, carsharing users also identify as “social activists, environmental protectors, innovators, economizers or political travelers”(Burkhardt and Millard-Ball 2006). Carsharing works well in densely built-up areas with good public transport and a shortage of parking (Bonsall, Jopson et al. 2002). Due to the relatively high user costs of the model – compared to the nominal user fee of car ownership – carsharing is not generally used for commuting. As shown in the diagram below (Figure 2), it is often seen as a supplement to multi-modal transportation. Biking and walking are feasible for short, trips that don’t demand much flexibility; public transportation is
BACKGROUND

12 | Shellooe
Source: Schwartz, Joachim 1999
As seen in the Figure 3, carsharing is used for trips like personal business, grocery shopping and other shopping trips. Since it doesn’t function as a mode for commuting, it should be seen as a complement to an existing multi-modal strategy, rather than a true replacement for car ownership. In its relationship to other modes, carsharing is preferred for moderate-distance trips where flexibility is required for example “carrying packages, reaching destinations that may not be accessibly by public transportation” (Millard-Ball, Murray et al. 2005).
Members use car-sharing for a range of trips, but rarely for the daily commute to work. Car-sharing is used judiciously; the service is most often used when members have things to carry, need a car to get to their destination, or have multiple stops to make. The median number of trips per month is just two.
useful for longer trips that need less flexibility; taxis are viable for short trips that demand a high degree of flexibility; and car rentals are generally used for long-term trips. Car-sharing supplements these modes by offering an alternative that allows a high degree of flexibility by the user – the ability to make many stops and transport goods for example – and is cost effective for shorter trips and rental periods.
Figure 2: Mode Choice Determinants
flexi
bilit
y ne
eded
Car Sharing
distance of travel
Car Rental
BikePublic Transportation
Taxi

13 |
In terms of where the system succeeds, carsharing works well where a modest proportion (35-40%) drive alone to work, 15-20% walks to work, 35-40% of households have no vehicle, and there is a moderate housing density (as seen in Table 1). New York City meets or exceeds the requirements for all of the variables that were shown to influence the success of carsharing. The city has a high population of 1-person households and a low population of commuters driving alone. The proportion of people who walk to work is lower than expected, but this still exceeds the low growth threshold estimate. Vehicle ownership rates and housing density are also sufficiently high to expect high carsharing growth and success in the city. Given this information, New York City is a prime metropolitan area for implementing carsharing successfully and studying how the program works.
Figure 3: Carsharing Trip Purpose
BACKGROUND
Source: Millard-Ball, Murray et. al 2005
Commute2%
Personal Business
25%
OtherShopping
17%
Grocery Shopping
16%
Recreation16%
Work-related12%
Other12%

14 | Shellooe
For most variables, the values are the suggested
minimums that are needed for a viable car-
sharing service in a given neighborhood. For the
‘% drive alone to work’ variable, the values are the
suggested maximums.
Founded in 2000, Zipcar is currently the largest carsharing operator in the United States with over 10,000 vehicles in 20 major metropolitan areas and college campuses across the country. Zipcar has recently expanded to Canada, the UK, Spain and Austria and is the largest carsharing organization in the world. Traditional rental car systems have entered the market as well, seeing their long-term car rental model becoming obsolete. U-Haul established U Car Share in 2007 with a fleet of PT Cruisers. Enterprise’s WeCar was established in 2008 and acquired PhillyCarShare in 2011 and Mint Cars On Demand in 2012. hertz On Demand launched in 2009, acquired the Austrailian service Flexicar in 2010, and the Paris-based system Okigo in 2010. Avis also established a carsharing service, and acquired Zipcar in 2013 for $500 million.
VariableLow
GrowthHigh
GrowthNew York
City
% 1-person households 30% 40%-50% 47%
% drive alone to work 55% 35%-40% 23%% walk to work 5% 15%-20% 10%
% households with no vehicle
10%-15% 35%-40% 46%
% households with 0 or 1 vehicle
60% 70%-80% 79%
Housing units per acre 5 5 19
Demographics
Commute Mode Share
Vehicle Ownership
Neighborhood Characteristics
Table 1: Where Carsharing Succeeds
Source: Millard-Ball, Murray et al. 2005, U.S. Decennial Census, ACS

15 |
Zipcar was introduced in New York City in February 2002, the third city in which Zipcar launched. Zipcar currently has around 2,000 vehicles in almost 400 locations in the greater NYC area (Mathews 2012). Reservations range from $9-$14 per hour, and start at $83 for a full day rental including gas, insurance and 180 miles of driving per day. Other carsharing operations in NYC such as Enterprise CarShare have vehicles located in Manhattan and downtown Brooklyn, with a density distribution similar to that of Zipcar. Because Zipcar is the largest carsharing operator in the city and was the first to provide shared vehicles to New York, their system will act as a proxy for carsharing in New York City overall for this research. The map on the following pages shows the locations of Zipcars in the five boroughs of New York City. There is a fairly clear distribution of shared vehicles with high concentration in the Manhattan central business district (below 96th Street) and the inner-ring, which includes upper Manhattan, the south Bronx and neighborhoods along the East River waterfront in Brooklyn and Queens. There is a clear dearth of shared vehicles in Staten Island and the outlying areas of the outer boroughs. This data was mapped using information from the Zipcar website and PLUTO data from the Department of City Planning (full methodology in the Data and Methods section).
CArShArINg IN NYC
BACKGROUND

16 | Shellooe
¯ 0 2.5 51.25 Miles
Car Share DensityLocations of Shared Vehicles
nycd
1 Dot = 1
Zipcar
Parks
Source: NYC Department of City Planning, NYC Department of Parks and Recreation, Zipcar, PLUTO

17 |
¯ 0 2.5 51.25 Miles
Car Share DensityLocations of Shared Vehicles
nycd
1 Dot = 1
Zipcar
Parks
Source: NYC Department of City Planning, NYC Department of Parks and Recreation, Zipcar, PLUTO
Figure 4: Carsharing Density
BACKGROUND
Shared vehicles are concentrated in Manhattan and along transit routes in the outer boroughs. Trends also follow along transit lines throughout Queens and Brooklyn

18 | Shellooe
lITErATurE rEvIEW
bENEfITS Zipcar’s website and press releases claim that the carsharing service achieves many benefits, and contributes to a more sustainable urban transport system (Zipcar 2012). Many scholarly articles have supported these claims. These benefits are often categorized in the literature into transportation, land use, environmental, and social effects (Shaheen, Cohen et al. 2005). Benefits of carsharing in the literature include reduced car ownership, reduced vehicular travel, lower vehicular emissions, increased trips by alternative modes, cost savings and greater mobility (Millard-Ball, Murray et al. 2005). This section will provide an overview of the main literature in the field that has examined the impacts of carsharing in metropolitan areas.
Transportation Studies have shown that carshare users reduce vehicular travel, increase alternative modes, reduce car ownership, and are more likely to link trips (Cervero 2003; Cervero and Tsai 2004; Cervero, Golub et al. 2007; Martin 2010). Richard Cervero has been the leading scholar evaluating the effects of City CarShare in San Francisco. The first study, conducted one year after the non-profit program was implemented, surveyed members to determine effects on car ownership, vehicular travel and other travel behavior. In the first year, members actually increased automobile travel and reduced trips by walking and biking (Cervero 2003). Since most users were previously carless households, carsharing was found to have induced some automobile travel. however, overall daily travel times of carshare users were lower compared to non-members. In the second year study, participants had slightly lower vehicle miles traveled (VMT) than non-members, and members were more likely to use public transit or non-motorized modes (Cervero and Tsai 2004). In later evaluations of City CarShare, there was a significant reduction in vehicle miles traveled by 67% for members, compared to a 24% reduction for non-members (Cervero, Golub et al. 2007). According to Cervero, paying market-rate prices for the use of cars led to a more “judicious automobility.” Members were able to meet their travel needs, often with travel time savings and expressed a willingness to pay for this advantage. Evaluations of the earliest iterations of carsharing found a 26% increase in walking, 10% increase in biking and 14% increase in public transit (Martin and Shaheen 2011). Martin and Shaheen also studied the effects of carsharing on usage of

19 |
public transit and non-motorized modes. The overall impact of carsharing on public transit usage was ambiguous, but there were positive effects on walking, bicycling and carpooling/ridesharing. Zipcar itself and many scholarly articles have estimated that a number of cars are replaced – through forestalling buying a car, or getting rid of a car – by carsharing members. Studies have estimated between 9 and 20 cars are replaced for each shared car in the system (Millard-Ball, Murray et al. 2006; Martin 2010). Zipcar often cites a study by Frost and Sullivan, which finds that in North America, each shared vehicle replaces at least 15 cars on the road (Mathews 2012). A study by Martin and Shaheen found that each shared vehicle was associated with 9 to 13 fewer vehicles (Martin, Shaheen et al. 2010). 11 to 29% of members sold their vehicle after as a result of participating in carsharing and 12 to 68% had stalled or forgone buying a car. Much of this reduction can be attributed to households moving from one-car households to zero-car households. Lane’s research of Philly CarShare estimated that each shared vehicle was responsible for 23 fewer cars on the road, either through shedding a vehicle or forgoing purchasing one (Lane 2005).
Land Use This shift in preferences and the reduction in vehicle ownership manifests as a reduced demand for parking and related land use effects. Much scholarly work has indicated that parking demand is an elastic measure and can be influenced by a range of transportation demand management (TDM) interventions (Millard-Ball, Siegman et al. 2004). By implementing carsharing as an alternative to car ownership, demand for parking is reduced and land can be put to its highest and best use. Fewer cars can lead to reduced demand, but shared vehicles still require parking. Susan Shaheen has studied the various mechanisms that carsharing organizations (CSOs) use to secure parking for shared vehicles. Some cities have established “options zones” for designated shared vehicle parking, or designated parking stalls for a “vehicle class” (i.e. “shared”) instead of a specific carsharing operator (i.e. Zipcar). For on-street parking, CSOs are usually charged for forgone meter fees, and for off-street lots are provided market-rate, discounted or free parking (Shaheen 2010). Millard-Ball’s research emphasizes the role that city agencies can play in parking policies for shared vehicles and therefore affecting parking demand. his recommendations include: providing parking for car-sharing vehicles; adjusting parking requirements for developers that incorporate car-sharing; and replacing
LITERATURE REVIEW
20 | Shellooe
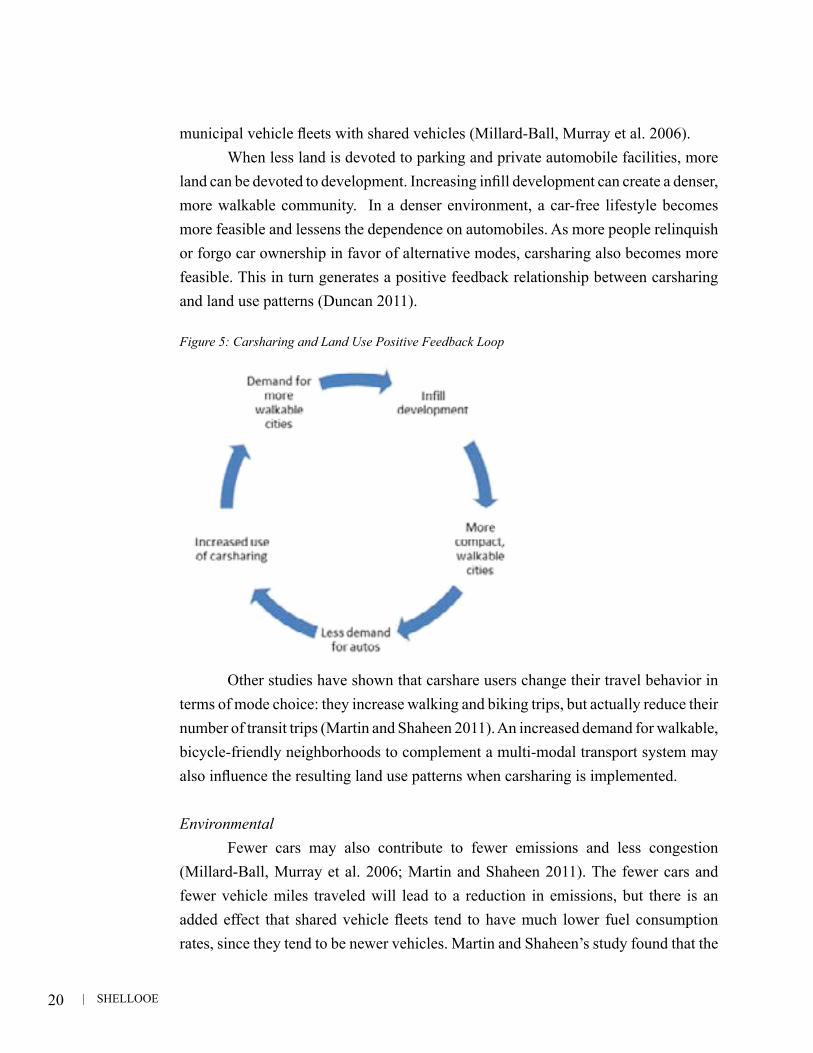
municipal vehicle fleets with shared vehicles (Millard-Ball, Murray et al. 2006). When less land is devoted to parking and private automobile facilities, more land can be devoted to development. Increasing infill development can create a denser, more walkable community. In a denser environment, a car-free lifestyle becomes more feasible and lessens the dependence on automobiles. As more people relinquish or forgo car ownership in favor of alternative modes, carsharing also becomes more feasible. This in turn generates a positive feedback relationship between carsharing and land use patterns (Duncan 2011).
Figure 5: Carsharing and Land Use Positive Feedback Loop
Other studies have shown that carshare users change their travel behavior in terms of mode choice: they increase walking and biking trips, but actually reduce their number of transit trips (Martin and Shaheen 2011). An increased demand for walkable, bicycle-friendly neighborhoods to complement a multi-modal transport system may also influence the resulting land use patterns when carsharing is implemented.
Environmental Fewer cars may also contribute to fewer emissions and less congestion (Millard-Ball, Murray et al. 2006; Martin and Shaheen 2011). The fewer cars and fewer vehicle miles traveled will lead to a reduction in emissions, but there is an added effect that shared vehicle fleets tend to have much lower fuel consumption rates, since they tend to be newer vehicles. Martin and Shaheen’s study found that the

21 |
average carsharing fleet vehicle is 10 miles per gallon more efficient than the average vehicle that members sold after joining a carsharing organization (Martin 2010). The Zipcar fleet also includes a high proportion of gasoline-electric hybrid and electric vehicles that further reduce emissions per mile. A study by Martin and Shaheen surveyed 2,088 carsharing members in North America and found a reduction of 0.58 tons of GhG emissions per household per year, or a 27% reduction in emissions. Zipcar posits that 90% of members drive 5,500 miles or less per year, which they estimate as a reduction of 32 million gallons of oil (Zipcar 2013). Because of the additional environmental awareness component of many carsharing organizations marketing campaigns, members often reported an increase in overall environmental awareness as well (Shaheen and Cohen 2012).
Social Effects Carsharing has the potential to remove barriers to car ownership such as purchase cost, insurance, fuel, maintenance and parking costs while still retaining the freedom and flexibility of a private automobile. For individuals and households that only require occasional auto use, carsharing allows for short term vehicle use without bearing the full cost of car ownership (Shaheen and Cohen 2012). Those who do not own a vehicle can benefit tremendously from access to a private automobile as a supplement to public transportation, without needing to incur the full fixed cost of buying a car (Duncan 2011). Those that drive on a limited basis can also benefit by shifting to carsharing and saving on the costs of owning a car. Some studies report that the average cost of owning a car is approximately $12,000 per year. The potential savings incurred from carsharing is especially significant for low-income populations that may have more limited transportation options. In the search for housing and employment, automobility can generate a significant advantage. Studies report that the system enhances mobility, allowing users to reach more destinations more quickly, while also promoting “judicious automobility” (Cervero and Tsai 2004). While public transportation operates on a fixed route, carsharing allows users similar freedom to car ownership. Even in areas well-served by transit and walking facilities, the flexibility, speed and convenience of a private auto can increase the travel options available to a household (Duncan 2011). In addition, the image that Zipcar portrays promotes awareness of environmental effects of driving, collaborative consumption and ideals of an access economy that are becoming more and more relevant.
LITERATURE REVIEW

22 | Shellooe
dISAdvANTAgES While the studies highlighted so far have focused on benefits of carsharing, the net impacts may be difficult to measure because of the competing forces of reduced and induced travel. Bonsall’s research notes that while much of the carsharing literature has been centered on the benefits, there are some disadvantages. Carsharing can open up the possibility of automobility to historically disadvantaged groups. However he cites the difficulty of serving these groups as a continuing avenue for exclusion. “Sparse population, culture and inability to raise the required deposit” are all potential barriers to the benefit of carsharing (Bonsall, Jopson et al. 2002). The research identified additional barriers to serving disadvantaged populations including lack of understanding of the concept and the fact that some users would require specially adapted vehicles or special pick-up arrangements. In urban areas well-served by transit, carsharing could also have inverse effects on assumed environmental benefits. If carshare users were formerly non-car owners then the trips, emissions and congestion they contribute to by driving shared vehicles could actually result in a net increase in these measures (Bonsall, Jopson et al. 2002). Carsharing may also serve as a “stepping-stone towards car ownership” for previous non-car owners. Access to an automobile could also incentivize users to leave their communities for goods and services, eventually reducing patronage at local stores. These disadvantages must be considered when encouraging or planning for new transportation systems. Often the unintended consequences of transportation investment can offset the potential gains of the system.
govErNmENT INTErvENTIoN With one-third of all car-share members in the United States, New York City provides an opportunity to explore where and how carsharing has been implemented. The New York City government, through PlaNYC 2030, has prioritized reducing congestion and encouraging non-motorized modes of transportation to create a more livable and sustainable city for all New Yorkers (City of New York 2011). One of the transportation goals is to improve and expand sustainable transportation infrastructure and options, especially for those “in neighborhoods with limited access to transit.” The fourth initiative to achieve this goal includes “promoting car-sharing” as a transportation goal, in order to meet the needs of households who want an economically and environmentally efficient alternative to car ownership. The plan also cites the potential of replacing the city’s car fleet with shared vehicles

23 |
as an opportunity to reduce city expenditures, free up parking spaces, and promote carsharing to the public. An amendment to the city’s zoning code approved in 2010 has helped facilitate carsharing’s expansion by enabling shared vehicles to be parked in off-street garages and lots (Planning 2010). The text amendment provides definitions of carsharing vehicles and specifications for their size. In public parking garages or lots, carsharing vehicles may occupy up to 40% of all parking spaces. For off-street parking facilities in Manhattan Community Districts 1-8 and Queens CDs 1 and 2 established before 1982 and 1995 respectively, carshare vehicles may not exceed 5 spaces or 20% of total spaces. As mentioned previously, the city is often also involved in the pricing of these parking spaces. If the city seeks to foster an increased base of car sharers, and more pervasive use of the service, the city has determined that carsharing is a public good, and therefore justifies government subsidization. And while Zipcar is not obliged to provide its service equitably, when the government explicitly supports the company, then the firm should be evaluated according to principles of equity. When the city uses public resources to promote a private service provider, that firm is entering into a social contract. As this thesis will demonstrate, the existing system violates that contract, and is not truly serving the public good.
TrANSporTATIoN EQuITY Much of transportation planning and engineering is based on efficiency criteria, without consideration for the impacts on equity. Even public sector decision making is determined through benefit/cost analysis that misrepresents the concept of equity. B/C analysis uses the economics principle of Pareto Efficiency, in which the best decision is the one which “one cannot improve person Y without worsening person Z” (Garrett and Taylor 1999). however as Levinson explains, theoretical exchanges -- which Pareto Efficiency is based upon -- do not actually occur, which leaves empirical equity largely out of the equation. historically, much of transportation investment has focused on attracting discretionary users to mass transit systems. Capital expenditures have traditionally focused on suburban commuter lines that serve high-income users, supported by the notion that attracting “choice users” is the top priority. however, these investments often come at the expense of inner-city bus lines, which are more likely to be used by low-income, minority populations (Garrett and Taylor 1999). Since the poor
LITERATURE REVIEW

24 | Shellooe
spend a larger portion of their income on transportation compared to the wealthy, imposing higher transportation costs is regressive in nature. The low-income, transit-dependent populations are often denied access to housing, education and employment opportunities, as well as affordable goods and services (Garrett and Taylor 1999; Litman 2002). Litman argues for increased evaluation of transport investments and subsidies according to vertical equity principles, to better provide for those with truly limited access. The determinants of equity can take many forms: horizontal, vertical, process-, and results-oriented (Levinson 2002). horizontal equity ensures that costs are distributed evenly among all members of society -- similar to the idea of a flat tax -- while vertical aims to create equity with respect to income -- like a progressive tax. Many scholars have called for increased attention to vertical equity in the transportation planning field. Some researchers even promote an “equity impact statement” in the benefit/cost analysis of transportation projects to create a systemic approach to identifying the inherent inequity of these projects (Levinson 2002). The literature also presents the viability of transportation planning to address welfare issues (Wachs 1998). Improving public transportation could be a strategy to provide better connections for low-income populations to jobs. And while reduced fares for low-income transit riders are not usually used, integrating transportation strategies into welfare reform could reduce the persistent segregation effects of historically inequitable transportation investment.

25 |
dATA & mEThodologY
vArIAblES This thesis will examine if the spatial distribution of carsharing services in New York City has been placed according to variables that contribute to its economic success, and if this distribution meets goals of equity and inclusion as well. Certainly, private operating services such as Zipcar conduct research to determine where the service would be most successful, but this study reverses the location logic. Despite the motives of private firms, government subsidy presents a catalyst to evaluate the equity of the distribution as well as to examine the potential exclusionary effects of the service.
Dependent variables The variable to which all of the independent variables are measured is the location of the shared vehicles, using the first and largest carsharing organization in New York City -- Zipcar. The number of shared Zipcar vehicles per square mile in each Community District will be considered “carsharing density.” The Community Districts will be divided into three categories – low, medium, and high carsharing density – based on the average of these densities (median), and approximately one tertile away from the median (low and high) to provide preliminary analysis. The relationship of each independent variable to this carshare density index (CDI) will determine if there is significant difference between places that Zipcars are and aren’t located.
Independent variables In an attempt to determine if the location of Zipcars has an equitable distribution, it must be determined along what lines should this be “equitable.” Much of the social equity literature focuses on income, race/ethnicity and education (Litman 2002). Since many of the studies of Zipcar and other carsharing operations have shown that carsharing users tend to be middle- to upper-income, Caucasian, and well-educated, these provide precedent for variables by which to measure equity (Millard-Ball, Murray et al. 2005). Marginalized groups such as low-income, racial minorities, and those with low levels of education are considered disadvantaged groups. Median household income, percent below the poverty line, percent non-white population, and percent with a Bachelor’s degree provide proxies similar to those that Litman suggests as determinants of vertical equity.
DATA & METhODS

26 | Shellooe
There are many variables that contribute to the feasibility of carsharing that also need to be examined, many of which are shown in the table in the Overview of Carsharing section. Theoretically, carsharing is most successful in cities and neighborhoods that are densely populated and have a mix of uses. Population density is integral to feasibility because more users can access the same car, therefore lowering the overhead costs for the carsharing organization. Density of uses ensures that drivers can access a variety of goods, services and destinations within a short driving distance. The combined density of both members and destinations contribute to its economic viability as this will generate demand for the service. These locations must also be well served by public transportation or alternative modes to meet demand for more regular commute trips. The relatively high, prorated fee of carsharing limits its use to primarily non-work travel, so other modes must be available to complete those types of trips. Access to rail, low car ownership and a population that commutes by alternative modes suggest locations where carsharing would be in high demand. These variables all ensure that the population has sufficient alternatives for regular travel such as commuting. Surely, New York City meets all of these criteria as demonstrated previously, and is a prime location for carsharing. Indeed, Zipcar has located thousands of cars in the New York/New Jersey metro area (Zipcar 2012). The following variables will provide another set of independent factors to determine their relationship to Zipcar vehicle locations: population density, number of rail stops, percentage of zero car households, and percentage of the population that commutes by transit or walking. Controlling for these feasibility variables in the analysis will help isolate the effects of equity variables of carsharing density.
SECoNdArY dATA The Zipcar website provides mapped locations of all available shared vehicles in New York City. Although the company could not provide the spatial data of vehicle locations, I used this map to georeference the car locations using ArcGIS software. Since the website provides only the cross-streets of car locations instead of addresses, I used PLUTO data to associate each shared vehicle location to the nearest parcel. I created a field in the PLUTO shapefile and input the number of Zipcars at each location by referencing the Zipcar website. The number of cars in each Community District was determined by selecting features (i.e. shared vehicle locations) according to the Community District layer, from the NYC Department of City Planning. I also

27 |
included a 500 foot buffer, about 1/8 mile, around each district. Although this double counts some of the cars, it provides a more comprehensive view of the cars that individuals in each district actually have access to. People are generally willing to walk up to ¼ mile to transit, so the 1/8 mile buffer is a conservative estimate of accessible vehicles. I divided the number of shared vehicles in each district by the area, in square miles to determine the carshare density (car/sq mi). The independent variables were collected through the 2010 United States Census and the 2006-2010 American Community Survey at the 2010 Census tract level for all tracts in New York City. The data was aggregated to the Community District level to avoid any significant margin of error. Since the Community Districts are not comprised of discrete Census tracts, there are some tracts that fall in more than one CD. To avoid double counting the data for these Census tracts, the data was aggregated only from the Census tracts whose centroid fell within the CD. This was done through GIS software using selection and statistic tools. This method counted each tract’s data only once, without significantly changing the area of each district. Many variables required manipulation to account for area of the CD and the specifics of the data I was trying to analyze. Population density (people/acre) was calculated by aggregating the total population of the CD and dividing by the acreage of the district from DCP’s district profiles. The number of rail stops was determined through ArcGIS using a shapefile of subway stations. This figure over-represents the total number of stations because those along the border of multiple districts were counted for all adjacent CDs. The percent of zero car households was calculated by dividing the zero vehicle households by total households in the district. I calculated percent commuting by alternative modes by aggregating the number of workers who commute by public transportation or walking, and dividing by the population of workers over 16 years old. Determining median household income for an aggregated data set requires interpolating from the number of households in each income category in the district. I determined the cumulative percent of households in each category; then using two sets of points (x=income, y=cumulative percent), I determined the slope of the income relationship (assuming there is a relatively linear relationship between two points near the median). Plugging in y=0.5, I was able to approximate the median household income of each district. This method treats income as a continuous variable, even though the data is collected as a categorical variable. The variable median household income, is therefore based on assumptions of normally distributed income ranges,
DATA & METhODS

28 | Shellooe
which may not be the case. For the remaining variables, I calculated the percent non-white population by subtracting the non-hispanic white population from the total population and dividing by the total population. Percent with a Bachelor’s degree was calculated by dividing the percent of population with a Bachelor’s degree by the total population over 25 in each district. Since poverty data is represented as a percentage of each census tract, I first multiplied the percentage of people in poverty by the total population to determine number of people in poverty, then aggregated for each district and divided by the total population.
The second part of the study uses primary, qualitative data to examine mode share and determinants of non-work trips. This will suggest the potential of carsharing to increase access for disadvantaged groups to affordable goods and services. Many of the large big-box complexes in New York City provide the opportunity to buy in bulk and buy cheap or discounted goods. however, many of these large shopping centers are not well served by transit. Shopping trips for affordable goods, in a location relatively inaccessible by transit, provide a potential opportunity for carsharing use.
Strategy Since shopping trips constitute a considerable portion of carsharing trips, conducting a consumer intercept survey at a big-box shopping center provides a good proxy for potential carshare users. The goal of the survey is to collect a diverse,
mEThodologY
prImArY dATA: SurvEYS
The analysis will be conducted using STATA statistical software. All eight independent variables -- the four feasibility and four equity variables -- will be entered into a spreadsheet, along with the carsharing density at the Community District level. First I will conduct diagnostics to test if the data are norally distributed. Then I will use regression between the independent variables to identify any spurious relationships. Finally I will conduct regression analysis between the independent variables and the carsharing density to create a robust model. Building upon the variables with the strongest relationship, I will identify the strongest predictors of districts with dense shared vehicle locations.
29 |
representative sample of shoppers at the East River Plaza and the Bronx Gateway shopping centers to determine the potential of carsharing for these trips. The survey was conducted by stopping patrons while entering or exiting the Target shopping centers at each of the two shopping centers. Conducting these surveys on both weekends and weekdays provides a variety of patrons, with the aim of collecting about 100 surveys. To collect a strategic sample, I asked every tenth person who exited the center if they would like to participate in a short, voluntary survey about their travel behavior (e.g.: Would you like to take a short survey about your travel choices?). I will identify myself as an affiliate of Columbia University, provide a short explanation of carsharing and explain the purpose of the survey (e.g.: I am a Columbia student working on a thesis project. This research will examine if carsharing could increase travel options, and what the barriers are to participating.) If they provide verbal consent, I will provide them with a clipboard, a pen and a confidential survey and ask them to complete it to the best of their ability.
Questions This qualitative data was collected by the researcher through surveys of discretionary travelers to determine differences between Zipcar users, and those who use other modes of transportation to reach the destination, and influences on their mode of choice. The survey also includes questions about assumed barriers to participating in carsharing such as internet access, credit access, possession of a Driver’s license and awareness of the service. Questions will include (the full survey can be found in Appendix A):• What is the main purpose of your travel today?• How did you get to the shopping center today? • How will you travel home from the shopping center today?• How much do you expect travel for the trip to cost? • What is the main reason that you chose this way to travel?• Do you have access to the internet? • Do you have a credit card? • Do you have a driver’s license? • Are you aware of shared vehicles in your neighborhood? • Would you use this service if it were near your home? If no, why not? Too expensive, environmental concerns, parking issues
DATA & METhODS

30 | Shellooe
• Which zip code do you live in? • What is your household income?• What is your race/ethnicity?• What is your highest level of education To maintain confidentiality, I will place the completed surveys in a manila envelope once the participant has completed it, without reading their responses. The envelope will be sealed and in the possession of the researcher for the duration of the research. After collecting data on two weekday and two weekend time periods, I will aggregate all of the data and enter the responses into an Excel spreadsheet in order to conduct the analysis. The document will be password-protected to protect any sensitive information, and no identifiable information will be used in the final thesis. I will aim to complete 100 surveys during 4 time periods: one weekday and one weekend at each site -- East River Plaza and Bronx Gateway Shopping Centers. If I am unable to collect 100 surveys after the allotted survey periods, I will conduct another weekday and weekend visit aiming to reach the target number of respondents.
Limitations There are of course limitations associated with this methodology. There will be a relatively small sample size from which to draw conclusions. The instrument itself might present certain biases. There are also limitations in administering the intercept survey. Researcher time and budget set limits to the amount of resources that can be devoted to data collection. Intercept surveys generally attract a certain demographic, that tends to be higher educated. The survey was only administered in English, which might have excluded certain segments of the population from participating. These biases are acknowledged in the analysis, however, the survey results may still serve as a proxy for potential carshare users and the barriers to access.

31 |
ANAlYSIS
CArShArINg dENSITY INdEx In order to analyze data by community districts, I consolidated the 59 districts into three categories determined by their carsharing densities: low, median and high. The “low” category includes 20 districts from 0 cars/sq. mile up to 0.88 cars/sq. mile. These are mostly located in Queens, Staten Island, and a few in the Bronx and Brooklyn. “Median” included 18 districts centered on the median shared vehicle density, which is 1.88. These districts are in the inner-ring of the outer boroughs in the Bronx, Brooklyn and Queens. The “high” category ranged from 5.39 to the maximum at 66.37 cars/sq. mile. All of the districts in Manhattan fell into this category, as well as several districts in northwestern Brooklyn and two in the Bronx. The following map shows the carsharing density of each community district, creating the Carshare Density Index. A clear pattern has emerged that the most dense carsharing districts are in Manhattan and the inner ring of the outer boroughs. Because these areas are the most dense and well-served by transit, it seems that these would be prime locations for carsharing to locate its service. This provides preliminary evidence that the feasibility variables will have some effect on the density of shared vehicles.
ANALYSIS

32 | Shellooe
¯ 0 2.5 51.25 Miles
Car Share DensityShared Vehicles per Square Mile
0 - 0.89
0.90 - 3.8
3.9 - 66
1 Dot = 1
Zipcar
Parks
Source: NYC Department of City Planning, NYC Department of Parks and Recreation, Zipcar, PLUTO

33 |
¯ 0 2.5 51.25 Miles
Car Share DensityShared Vehicles per Square Mile
0 - 0.89
0.90 - 3.8
3.9 - 66
1 Dot = 1
Zipcar
Parks
Source: NYC Department of City Planning, NYC Department of Parks and Recreation, Zipcar, PLUTO
Figure 6: Carsharing Density Index
ANALYSIS
By Community District, shared vehicle density is concentrated in Manhattan and the inner ring of the outer boroughs -- dense neighborhoods with dense transit networks

34 | Shellooe
Descriptive Statistics
loCATIoN ANAlYSIS
From table 3 above, it is clear that a higher carshare density index is associated with an increase in many of these feasibility variables. Low-density districts average 39 people per acre, around 7 subway stations, 26% zero car households, and 52% that commute by walking or transit. Median-density districts have higher values across
Table 2: Carsharing Density
There is an enormous amount of variation between and among the districts in each category. The average number of shared vehicles ranges from 4 to 103 cars per district category, with large standard deviations. The density of shared vehicles ranges from 0.3 to 21 with large standard deviations as well. The mean density is around 8 cars/sq. mile, and the average for the median group is 2, which is similar to the median value of 1.88 for all of the districts. Tables of variables for all 59 districts can be found in Appendix B.
Table 3: Location Descriptive Statistics
# of CDs # of Shared Cars Car Density (per sq.m)Mean St.Dev. Mean St.Dev.
Low 20 4.1 5.0 0.3 0.3Median 18 18.3 12.0 2.0 0.9High 21 102.8 64.8 20.7 15.5Total 59 43.6 59.3 8.1 13.2
# of CDsMean St.Dev. Mean St.Dev. Mean St.Dev.
Low 20 39.1 20.4 7.4 4.9 26% 14%Median 18 68.6 29.0 8.6 3.9 45% 16%High 21 99.4 34.5 14.8 10.5 68% 8%Total 59 69.6 38.1 10.4 7.9 57% 79%
# of CDs Median Income % Non-white Pop. % with Bachelor's deg.Mean St.Dev. Mean St.Dev. Mean St.Dev.
Low 20 54,900$ 14,268$ 64% 24% 17% 5%Median 18 43,019$ 14,705$ 77% 22% 15% 7%High 21 61,847$ 31,504$ 61% 27% 25% 11%Total 59 53,748$ 23,391$ 67% 25% 19% 9%
Feasibility Variables
Equity Variables
Pop. Density (per acre) # of Subway Stations % Zero car Households

35 |
all categories: 69 people per acre, 8 subway stations, 45% zero car households and 70% commute by alternative modes. The trend continues with high-density districts, showing average values of 99 people per acre, 14 subway stations, 68% zero car households and 79% commuting by alternative modes. This shows some preliminary findings that Zipcar locations are distributed according to variables that contribute to the feasibility of the service. This may seem obvious, but it also lends credence to the methodology that these feasibility variables are associated with the distribution of shared vehicles. The equity variables show less explicit trends between the carsharing density indices. In the low-density districts, the median income is $54,900, 64% is non-white, 17% have a Bachelor’s degree and 16% of the population is under the poverty line. For median-density districts, the table shows a positive trend from the social justice framework: this group of districts serves a population with a lower median income of $43,000, a higher (77%) non-white population, lower (15%) population with a Bachelor’s degree and more of the population in poverty (24%). This seems to show that some districts with median carsharing density are serving some disadvantaged populations. however, the highest carsharing density districts have the highest median income of nearly $62,000, the lowest non-white population (61%), a quarter of the population has a Bachelor’s degree and around 20% of the population is in poverty.
Regression Analysis The analysis of the quantitative data is comprised of a least squares regression model that includes both the feasibility and equity independent variables to determine their explanatory effect on the level of carsharing density in a Community District. Because of the large variation within the carshare density indices, the universe of districts was used instead. Since the feasibility variables have been shown to relate to the success of carsharing, it makes sense that Zipcar would locate vehicles where these feasibility measures are most concentrated. The relationship between population density, number of subway stops, percentage of zero car households, and percentage that commute by transit or walking should be strongly positively correlated with Zipcar density. Therefore, I expect that low carsharing density districts will have very low positive relationships to the feasibility variables, medium districts will have a slight positive correlation, and high districts will have a strong, positive correlation. however, it is the equity variables that will shed more light on the question: is
ANALYSIS

36 | Shellooe
the distribution of Zipcars equitable? I expect to find that median household income, and % of the population with a Bachelor’s degree will be mildly positively correlated and % below the poverty line and % non-white population will be mildly negatively correlated with Zipcar density, informed by studies of Zipcar users.
Table 4: Expected Effects on Carsharing Density
Many of these initial hypotheses were supported by the regression analysis. Table 5 shows the regression coefficients, standard error and adjusted R2 values for each of the independent variables on carsharing density. Due to the large variation within the carshare density groups, the universe of districts was used instead of the three density categories to gain more robust results. The command “regress” in STATA was used to conduct this preliminary univariate regression analysis between each independent variable and carsharing density. The coefficient describes the slope of the relationship; a positive indicates a positive relationship, whereas a negative coefficient indicates a negative relationship. Significance at two confidence intervals are indicated with one asterisk for significance at 90% confidence interval, and two indicating significance at the 95% level. The R2 values demonstrate the percent of the variation within the data that can be explained by the given relationship.
Feasibility Pop. Density Transit Stops Zero car HHs Alt. CommuteLow + + + +Median + + + +High ++ ++ ++ ++Equity Income Non-white Education level PovertyLow -- + + --Median + + + +High ++ -- ++ --

37 |
All four of the feasibility variables did have the anticipated effect on carsharing density, significant at a 95% confidence interval, but not all of them had as strong of a relationship as expected. An increase of one person per acre for population density was correlated to an increase of only 0.17 in carshare density. For each additional subway station in a district, the carshare density increased 0.85 cars per square mile. I expected that these two variables would have strong positive relationships, but these are relatively weak, and have low adjusted R2 values. Each additional percentage of households with zero vehicle is correlated with an increase of 38 shared-cars per square mile, a strong significant relationship with a high R2 value that provides evidence to support the hypothesis. For each percent increase of the population commuting by transit or walking, carsharing density increased almost 46 shared vehicles per square mile, also supporting the initial hypothesis. All four equity variables had significant relationships to carsharing density at least at the 90% confidence level. For median household income, a $1,000 increase is associated with an increase of 3 cars per square mile. This is not as strong of a relationship as I had expected to find. A one percent increase in the non-white population is related to a decrease of 22 cars per square mile for all districts; there is a significant negative relationship between minority population and shared vehicles, as expected. Increasing the population with a Bachelor’s degree by one percent is related to an increase of 106 cars per square mile, with the highest adjusted R2 value.
Table 5: Univariate Regression Analysis
Standard Error Adj.R^2 Hypothesis Accept
Population density 0.17 ** 0.04 0.22 ++# of subway stations 0.85 ** 0.19 0.26 ++
% Zero car households 38.42 ** 6.19 0.39 ++ Y% commute by walking or transit 45.89 ** 10.45 0.24 ++ Y
Median household income (per $1,000) 0.33 ** 0.06 0.33 ++
% non-white population -22.80 ** 6.22 0.18 -- Y% Bachelor's degree 106.83 ** 12.43 0.56 ++ Y
% population in poverty -29.47 * 16.94 0.03 -- Y
CoefficientFeasibility
Equity
ANALYSIS

38 | Shellooe
This is the strongest and certainly provides evidence that Zipcars are not distributed equitably throughout the city. Finally, if the percent of the population in poverty increases by one percent, the carshare density is expected to decreased by almost 30 cars per square mile, but this relationship is significant only at 90% confidence interval and has a relatively low R2 value. All of the feasibility and equity variables have significant correlations to carsharing density, which provides initial evidence to support the hypothesis. Next, I conducted a regression analysis that included two variables in order to create a more robust model to explain the variation in carshare density between Community Districts. The strongest single variable correlations included population density, zero car households, alternative mode commuters, highly educated populations and high median income. These variables will be used in the bivariate regression to increase the predictive power of the model. Number of subway stations and percent of the population in poverty were not further analyzed due to their low coefficients and low adjusted R2 values.
Table 6: Population Density and Education
_cons -19.17324 2.716486 -7.06 0.000 -24.61501 -13.73146 bacdegree 96.98609 10.94132 8.86 0.000 75.06799 118.9042 popdensity .1210455 .0266763 4.54 0.000 .0676065 .1744845 cardensity Coef. Std. Err. t P>|t| [95% Conf. Interval]
Total 10284.6611 58 177.321744 Root MSE = 7.6483 Adj R-squared = 0.6701 Residual 3275.84203 56 58.4971791 R-squared = 0.6815 Model 7008.8191 2 3504.40955 Prob > F = 0.0000 F( 2, 56) = 59.91 Source SS df MS Number of obs = 59

39 |
The first model (shown in Table 6), which includes population density and highly educated population has a relatively high R2 value and is significant at the 95% confidence level. A regression analysis of the effect of percent with Bachelor’s degree on population density in a district also shows that there is no spurious relationship between the two independent variables. Carsharing is significantly correlated with higher population densities and more educated population. The equation below shows the relationship:
Table 7: Commute Mode and Education
The second multivariate analysis in Table 7 combines the share of alternative commuters and those with Bachelor’s degrees as the explanatory variables for carsharing density. This model has an R2 of 0.70 which means that these two independent variables explain 70% of the variation in carsharing density between districts, with relatively high coefficients and the following relationship:
_cons -33.87803 4.703923 -7.20 0.000 -43.30112 -24.45494 bacdegree 97.05956 10.52514 9.22 0.000 75.97516 118.144 altmode 34.59653 6.757039 5.12 0.000 21.06056 48.13251 cardensity Coef. Std. Err. t P>|t| [95% Conf. Interval]
Total 10284.6611 58 177.321744 Root MSE = 7.382 Adj R-squared = 0.6927 Residual 3051.69007 56 54.4944655 R-squared = 0.7033 Model 7232.97106 2 3616.48553 Prob > F = 0.0000 F( 2, 56) = 66.36 Source SS df MS Number of obs = 59
[carshare density] = .12 [population density] + 96.9 [% with Bachelor’s degree] – 19.2
[carshare density] = 34.6 [alternative commuters] + 97.1 [% with Bachelor’s degree] – 33.9
ANALYSIS

40 | Shellooe
The model in Table 8 includes zero car households and income as the independent variables, which demonstrates the strongest relationship with an R2 of 0.78 and the following equation:
Table 8: Car Ownership and Income
Table 9: Car Ownership and Race
_cons -29.79743 2.725962 -10.93 0.000 -35.25819 -24.33667 income .0003523 .0000345 10.21 0.000 .0002831 .0004214 zerocar 40.63193 3.69884 10.99 0.000 33.22226 48.0416 cardensity Coef. Std. Err. t P>|t| [95% Conf. Interval]
Total 10284.6611 58 177.321744 Root MSE = 6.189 Adj R-squared = 0.7840 Residual 2144.98492 56 38.3033022 R-squared = 0.7914 Model 8139.67621 2 4069.83811 Prob > F = 0.0000 F( 2, 56) = 106.25 Source SS df MS Number of obs = 59
_cons 6.205486 3.601961 1.72 0.090 -1.010109 13.42108 nonwhite -25.65525 4.173958 -6.15 0.000 -34.01669 -17.29381 zerocar 40.83419 4.842458 8.43 0.000 31.13358 50.5348 cardensity Coef. Std. Err. t P>|t| [95% Conf. Interval]
Total 10284.6611 58 177.321744 Root MSE = 8.0897 Adj R-squared = 0.6309 Residual 3664.83179 56 65.4434249 R-squared = 0.6437 Model 6619.82934 2 3309.91467 Prob > F = 0.0000 F( 2, 56) = 50.58 Source SS df MS Number of obs = 59
[carshare density] = 40.6 [zero car households] + 0.35[income (per $1,000)] – 29.7

41 |
The final two-variable regression includes zero car households and non-white population as independent variables predicting carshare density. This relationship is significant at 95% confidence interval and has an R2 value of 0.63. Both have high coefficients, with the following relationship:
Table 10: Adjusted R2 for Bivariate Regression
Median household income (per $1,000) 0.58 ** 0.41 ** 0.78 ** 0.69 **% non-white population 0.43 ** 0.33 ** 0.63 ** 0.51 **% Bachelor's degree 0.67 ** 0.60 ** 0.77 ** 0.69 **% population in poverty 0.35 ** 0.27 0.72 ** 0.48 **
** significant at 95% confidence interval* significant at 90% confidence interval
Population Density # subway stations
% zero car households
% alt. commuters
[carshare density] = 40.8 [zero car households] – 25.6 [non-white population] + 6.2
The table below shows R2 values in a two-way table between each feasibility variable (across the top) with each equity variable (along the side) and their combined effect on carsharing density. All of these results were significant at a 95% confidence interval, except the correlation including subway stations and percent in poverty. Clearly, highly educated populations, households with no vehicle and those commuting by transit or walking are the strongest predictors of access to carsharing. Minority population and population in poverty have weaker results, but still significant for the analysis.
ANALYSIS

42 | Shellooe
Finally, the most robust variables were included to provide a strong model explaining variation in carsharing density. Since many of the independent variables are highly correlated, spurious relationships increased some of the R^2 values, but without significance. The following two tables show the regression analysis of three independent variables on carsharing density.
Including population density, alternative commuters and Bachelor’s degree populations resulted in a model in which the coefficients were all significant at least at the 90% confidence interval. Density has a relatively weak relationship, but alternative commuters and highly educated populations are strongly correlated to carsharing density, and together form a model that explains 70% of the variation between districts, with the following relationship:
Table 11: Density, Commute Mode and Education
_cons -30.61505 5.023793 -6.09 0.000 -40.68296 -20.54715 bacdegree 95.27783 10.41442 9.15 0.000 74.40686 116.1488 altmode 24.18 9.108875 2.65 0.010 5.925407 42.43459 popdensity .0580904 .034709 1.67 0.100 -.0114681 .1276489 cardensity Coef. Std. Err. t P>|t| [95% Conf. Interval]
Total 10284.6611 58 177.321744 Root MSE = 7.2661 Adj R-squared = 0.7023 Residual 2903.80371 55 52.7964311 R-squared = 0.7177 Model 7380.85742 3 2460.28581 Prob > F = 0.0000 F( 3, 55) = 46.60 Source SS df MS Number of obs = 59
[carshare density] = .06 [population density] + 24.2 [alternative commuters] + 95.3 [bachelor’s degree] - 30.6

43 |
The final model has the highest predictive power and includes the variables identified in table 10 as the strongest predictors: zero car households, alternative commuters, and Bachelor’s degree populations. All of the coefficients in this model are significant at a 95% confidence interval, and all have strong correlations to the dependent variable. This model explains 79% of the variation in carshare density between districts; the following equation represents the relationship:
Table 12: Car Ownership, Commute Mode and Education
_cons -9.170962 6.044595 -1.52 0.135 -21.2846 2.942678 bacdegree 87.74279 8.811227 9.96 0.000 70.0847 105.4009 altmode -35.15176 14.25565 -2.47 0.017 -63.72072 -6.582789 zerocar 50.86671 9.578261 5.31 0.000 31.67145 70.06198 cardensity Coef. Std. Err. t P>|t| [95% Conf. Interval]
Total 10284.6611 58 177.321744 Root MSE = 6.0562 Adj R-squared = 0.7932 Residual 2017.27254 55 36.6776825 R-squared = 0.8039 Model 8267.38859 3 2755.7962 Prob > F = 0.0000 F( 3, 55) = 75.14 Source SS df MS Number of obs = 59
[carshare density] = 50.8 [zero car households] -35.1 [alternative commuters] + 87.7 [bachelor’s degree] - 9.2
This model provides significant evidence that both feasibility and equity can explain the variation in carsharing density between districts. Car ownership and commute mode are strong predictors of carsharing density, to be expected, but higher educated populations are also correlated with higher density of shared vehicles.
ANALYSIS

44 | Shellooe
Notes on Regression Analysis The preceding bivariate regressions used a combination of one feasibility variable and one equity variable. Most of the variables within each of the two categories are too highly correlated to use them in the same model. For example: using percent with a Bachelor’s degree and percent non-white population as the independent variables to predict carsharing density produced a high correlation of R2=0.61. however, performing a regression on the two independent variables alone reveals a significant relationship with an R2 value of 0.57. In this case, the high correlation could be attributed to the relationship between the two independent variables, rather than their effect on the dependent variable – carsharing density. Regression analysis operates on the assumption that the data are normally distributed. however, diagnostics of this dataset show that there are some outliers that could be exerting an influence on the regression. Manhattan Community Districts 4 and 5 were identified in the diagnostics to be outliers and excluded from the regression to determine the effect on the relationship to carsharing density. Excluding these two observations from the regression analysis did increase the overall predictive power of the model. The multivariate model including population density, alternative commuters and percent with a Bachelor’s degree resulted in an adjusted R2 of 0.81, with all three variables’ coefficients significant at the 0.95 level. See Appendix C for a more detailed description of the relevant diagnostic tests used to analyze the influence of the observations.
SurvEY ANAlYSIS 25 customer intercept surveys were collected over 4 time periods: 2 weekday and 2 weekend – one of each time period at the East River Plaza and Bronx Gateway Center. Approximately 1 out of every 5 potential respondents that were asked to participate in the survey agreed to take the questionnaire, so the overall response rate was about 20%. As discussed earlier there are many limitations to this methodology such as response bias and issues with the survey instrument. During the data collection time periods, several other types of response bias became clear. Customers who were shopping with small children were much less likely to respond to the survey, as were those carrying multiple bags. People with shopping carts were more likely to respond

45 |
positively, so there may be some bias in the mode share. Shoppers with enough purchases to warrant a shopping cart are more likely to drive, so this mode may be overrepresented in the sample. For the Bronx Gateway Center, the methodology was modified to intercept customers on the way into the Target shopping center instead of on the way out. This may have also had response bias implications, since shoppers may have changed their expected mode used to leave the shopping center depending on their purchases. The survey results will provide data to analyze the barriers for certain populations from using Zipcar. Linking mode choice decision factors and potential barriers to demographic data will bolster my initial hypothesis that disadvantaged groups do not have the same access to carsharing. Analyzing why people are choosing other modes, when Zipcar may be faster, more convenient, and provide more mobility, will inform the recommendations of this thesis.
Demographics During the data collection period, 16 responses were collected at the East River Plaza and 9 were collected at the Bronx Gateway Center. Table 13 shows the demographic variables from the survey. The table of demographic variables shows that the sample collected was relatively diverse. 44% of respondents had incomes over $100,000. While this is not representative of the city on the whole, it likely represents the response bias described earlier. however, there were also 40% of respondents with incomes under $35,000; 16% had incomes less than $20,000 and 24% had incomes between $20,000 and $35,000. The sample represented an ethnic diversity as well; 32% identified as Black or African American and 36%
Table 13: Survey Demographics
Count PercentIncomeLess than $20,000 4 16%$20,000-35,000 6 24%$35,000-50,000 2 8%$50,000-75,000 2 8%$75,000-100,000 3 12%Over $100,000 11 44%Race/EthnicityBlack or African American 8 32%Caucasian 6 24%Hispanic or Latino 9 36%Other 2 8%EducationLess than high school 0 0%High school graduate 4 16%Some college 4 16%Associate's degree 3 12%Bachelor's degree 8 32%Advanced degree 10 40%
ANALYSIS

46 | Shellooe
identified as Hispanic or Latino. While this is not representative of the city overall, it does reflect the communities of harlem and the Bronx where the shopping centers are located. The final demographic variable, level of education, most clearly demonstrated the response bias of the survey: 32% of respondents have a Bachelor’s degree, and 40% have an advanced or professional degree. While New York City does have disproportionately high levels of education, this sample was more educated than the average population. Shown in Table 14, most of the respondents’ primary trip purpose was shopping, with 64% of total. Work and personal travel were each 12% of respondent’s travel purpose. 28% of the total sample walked to the shopping center and 24% drove alone. The dominant mode used to travel to the shopping center varied between the two locations. 56% of respondents drove alone to the Bronx Gateway Center whereas 38% walked to the East River Plaza. The East River Plaza also had high proportions of respondents driving with others and taking the bus.
Table 14: Mode Choice
Count PercentResponses 25 100%Purpose of travelShop 16 64%Work 3 12%Personal 3 12%All other 3 12%Mode to centerDrove alone 6 24%Drove with others 4 16%Subway 3 12%Bus 4 16%Walk 7 28%Taxi 1 4%Mode from centerDrove alone 6 24%Drove with others 4 16%Subway 4 16%Bus 3 12%Walk 5 20%Taxi/Car service 3 12%Cost of TravelFree 3 12%Under $5 9 36%$5-10 7 28%$10-15 3 12%Over $15 3 12%Reason for mode choiceLocation 7 28%Comfort 5 20%Cost 6 24%Ease 5 20%Other 2 8%
Proportions were similar for the trip from the center, indicating most people used the same mode for both legs of their travel. 12% of the total sample used a taxi or car service to travel from the shopping center. Most respondents (76%) expected to pay less than $10 for the travel portion of their shopping trip; only 12% expected to pay over $15 for the trip. The most common reason for selecting the respondent’s mode

47 |
of choice was location, with 28%, and cost with 24%. Shoppers at the East River Plaza cited location the most frequently (38%), while 44% of Bronx Gateway Center respondents selected ease as the reason for selecting their preferred mode.
Table 15: Barriers to Participation
This section of the survey attempted to determine whether any of the commonly assumed barriers to carsharing held true for this potential user population. 100% of the survey sample has access to the internet, so this would not be a barrier to serving this population. 76% of the total sample has a credit card, so that presents more of a barrier to being able to participate in a carsharing program. The largest barriers were possession of a driver’s license and awareness of local shared vehicles. 72% of respondents do not have a driver’s license, and 72% were unaware of shared vehicles in their neighborhood. 56% of those surveyed said that they would use carsharing if they could access vehicles close to their home. Of those who responded that they would not, the most common reason was that they already owned a car. Other responses were preference of public transit or walking, and a general avoidance of driving for safety or environmental reasons.
Count PercentInternet Access 25 100%Credit Card Access 19 76%Ability to Drive (license) 18 72%Awareness of Carsharing 18 72%Would you use it? 14 56%If no, whyOwn a car 5 20%Other 5 20%
ANALYSIS

48 | Shellooe
dISCuSSIoN
This analysis has shown that Zipcars are largely distributed according to feasibility variables such as population density, commute mode and car ownership as predicted. however, the distribution is also associated with equity variables including income, race and education. Through secondary and primary data analysis, this thesis has demonstrated both spatial and institutional barriers to participating in the service. These findings have serious implications for how carsharing should be evaluated and promoted in the future, as well as larger implications about assessing transportation investments from a social equity perspective. The highest correlation between shared vehicles to both alternative commuters and zero car households implies that car sharing does act as a transportation supplement to households that already travel by public transit or walking. Adding access to a private vehicle can increase mobility options for large populations that are living without a car. As much of the existing research demonstrates, these populations are essential to the success of carsharing organizations. This in itself has both positive and negative implications. On one hand, increased automobility can increase access to goods and services. But in a dense metropolis such as New York City, many of our daily needs are accessible through transit and non-motorized modes. The option to travel further, and faster, provides incentives to drive a private automobile, which most residents of the city don’t need to do. Carsharing also provides incentives to leave one’s immediate community for those goods and services, which may prove detrimental to the local economy. In addition, this analysis shows that shared vehicle density is correlated to many of the equity variables which implies that, intentionally or not, shared cars are not distributed equitably throughout the city. Carsharing density increases along with high income and highly education populations, and decreases with high minority populations. Already disadvantaged groups are further denied access to automobility due to the spatial distribution of this service. The survey results also provide qualitative evidence that additional groups are being excluded through the service due to the existing barriers. The prevailing corporate model requires a driver’s license with a clean driving record, a credit card and internet access to make vehicle reservations. Not all members of the public have the same opportunity to access this service and the benefits that it may provide. Significant populations in New York do not have driver’s licenses or credit cards, particularly groups such as immigrants
fINdINgS & ImplICATIoNS

49 |
and low-income populations. A service that assumes customers have access to these tools presupposes a privileged population and excludes the remainder of the public. Language and cultural barriers are also solidified through Zipcar’s corporate preference, which markets to groups with larger disposable incomes such as young, urban professionals, who tend to be whiter and wealthier than the general population. The high vehicle ownership rates presented in the survey also represents the fact that for some, auto ownership is still a legitimate alternative to public transit and walking. The fact that many households still own vehicles and commute by private automobile, especially in low-income neighborhoods, implies that even in a transit-rich setting like New York City, living car-free may not be an option for some segments of the population. If a larger proportion of commute trips were served by transit, biking and walking, especially in low-income neighborhoods with limited transport options, then fewer households would need to own private vehicles allowing carsharing to supplement multi-modalism with automobility for some non-work trips. Since carsharing has primarily been provided by a private carsharing organization in New York City, namely Zipcar, the service is ultimately a response to free market pressures. In this sense, it is logical that this private firm would locate in markets that match their existing demographic user base, which has the means to supplement their mobility through additional services. however, the government has determined that the company is justified in receiving public subsidies in the form of parking and zoning allowances from the city. Therefore Zipcar (and all carsharing organizations) becomes accountable to the public and should be evaluated according to measures of equity if the city is to make concessions to private entities providing the service. The literature has reflected the benefits of carsharing for transportation, land use and environmental goals (which in themselves should be critiqued). Perhaps the most salient benefit is the ability to provide a cost-competitive option to increase automobility for a segment of non-work trips. In a city as well-served by transit as New York City, most residents can make regular trips by transit and live without owning a car. Supplementing a multi-modal lifestyle with carsharing for non-work trips can generate cost savings compared to car ownership, while also providing flexible, convenient access to a greater range of goods and services than many public transportation options. however, this thesis has provided evidence that the service is not a feasible alternative for all populations either due to spatial inequity
DISCUSSION

50 | Shellooe
or institutional barriers. Government involvement justifies assessing this service according to a social justice framework, and mitigating some of the inequitable effects through government involvement in provision of carsharing in New York City. The next section outlines some potential government action to remedy the unequal distribution of this service, as well as further research to better evaluate the system in practice.
polICY rECommENdATIoNS Carsharing has provided an interesting case study in examining how public goods are provided, and to what standards the public holds the entities that provide them. This research has identified that the system, which is supported by the government, is not serving the most vulnerable populations in the city. It is thereby violating the social contract that government is assumed to uphold. The major recommendation from this research is that transportation investment in the city should explicitly attempt to increase mobility options for those populations with the most limited options. To mitigate the unequtable distribution of carsharing, the government must either continue to support the service and require a more equitable distribution, discontinue their support of the private operators. First, cities must decide if carsharing is a public good and whether it justifies government subsidization. Continued examinations into the net benefits and costs of the system will inform these decisions. If the city has sufficiently identified that carsharing is a social good that should be promoted, it must them decide whether to support private provision of the service -- with requirements for equity of opportunity, or supplement private provision with public carsharing options. If carsharing can provide increased access to affordable goods and services for low-income and other disadvantaged groups, the government can create opportunities for targeted groups to use the service. Many of the existing barriers could be rectified through a broader distribution of shared vehicles, a voucher system to subsidize the cost of carsharing for low-income users, and supporting innovations in carsharing models. Carsharing is not a viable option for residents who do not live within walking distance of a shared vehicle. Zipcar receives free or reduced parking for many of their vehicles, with the justification that the service provides benefits to users, the environment and the overall transport system. But there hasn’t been attention to the exclusionary aspects of this service. Incentivizing carsharing organizations to

51 |
locate shared vehicles more equitably could produce a more just distribution. Further research into the exclusionary elements of corporate carsharing services identified in this thesis could be helpful in determining the most likely potential users that are excluded by the current shared vehicle distribution. Mode of travel is often a choice of the least costly options, especially for households with limited resources. Research on college campuses has shown that providing vouchers for Zipcar use increases individuals’ use of the service, and users reported increased access to local goods and services (Zhou 2012). In this instance, vouchers could be funded by shared vehicle parking fees, and distributed as part of a welfare system to supplement a households transport options. If the government can harness this potential to increase access to carsharing and the associated access to goods and services for disadvantaged populations, then carsharing could increase mobility in a meaningful way for these groups. Innovations in the system could also expand the feasibility of carsharing for disadvantaged groups by providing more flexible and affordable opportunities to use the services. One example is a one-way or “point-to-point” system. Similar to how bike share systems are being implemented in the United States, a point-to-point system allows users to start a vehicle reservation at one location and return the vehicle to another location (Shaheen 2012). This would provide a more cost-competitive alternative for trips such as shopping where only one leg of the trip would largely benefit from using a private automobile. For populations who are more sensitive to price the ability to use the vehicle for one-way (and therefore shorter and less expensive) trips would represent an increase in mobility. Low-income and minority populations may also benefit from informal carsharing systems or personal vehicle sharing. One such innovation P2P, or a “peer-to-peer system”, is characterized by “short-term access to privately-owned vehicles” (Shaheen 2012). In this model, privately-owned vehicles are rented out for short periods of time by individuals or members, often in a more community-oriented setting. Organizations could provide administrative resources such as auto insurance, technology, and online interface to facilitate the program. In this case, the institutional barriers are reduced in these informal carsharing organizations, and therefore may expand accessibility. This innovation would also mitigate the language and cultural barriers that may be pervasive in corporate carsharing models. Informal, community carsharing more closely aligns with the idea of “the commons” that has inspired the rise in collaborative consumption.
DISCUSSION

52 | Shellooe
The analysis and recommendations in this thesis are necessarily limited by the existing research in this burgeoning field of study. Further research should examine the long-term net benefits and costs of carsharing systems on land use and urban transportation systems. As the literature has demonstrated, the net effect of the competing impacts of carshare usage is unclear. Cooper, howe and Mye emphasize the optimism bias represented by carsharing studies that emphasize the benfits of carsharing systems without addressing long term effects (Cooper, howes et al. 2000). Government support for carsharing should be more rooted in research that provides concrete evidence as to the benefits of carsharing. Especially in a metropolitan area such as New York City, the induced vehicular travel demand generated by this service has extremely ambiguous effects on the transportation system. A host of related transportation services such as taxi, car service, and non-motorized travel may be inversely affected by the expansion of carsharing. More research into the benefits and costs may provide a clearer picture of the existingly one-sided literature. As public-private partnerships and the private provision of goods and services that are typically qualified as public goods – such as transportation – become more common, planners and policy makers should be cognizant of the associated equity implications. As this thesis has demonstrated, private firms do not have the same responsibility to social equity that public and government actors do. Further research should investigate whether the different carsharing organization typologies produce different levels of equality in provision. Community organization,s, P2P, and other informal systems might be better equipped to serve disadvantaged populations that may have different needs than the traditional carshare user. Evaluating these alternative operations to provide carsharing in a manner that meets the needs of under-served populations should be top priority of both the research and governments seeking to create a more equitable and sustainable transportation network.
furThEr rESEArCh

53 |
CoNCluSIoN
CONCLUSION
Carsharing presents a great innovation in applying the principles of collaborative consumption to meet the challenges of urban transport systems. Private provision of this service allows those who are willing and able to pay for increased mobility options. however, this thesis has shown that the distribution of shared vehicles in New York City may prevent already disadvantaged groups from gaining access to this service. In terms of location, the density of shared vehicles is highest in areas with high-income, highly educated, white populations. This may be a key population for the CSO to return a profit on their service, and is certainly a target market. however, that does not mean that access to shared vehicles should not be realistically extended to low-income, less-educated, non-white populations that may not have the array of options already available to the affluent. Collaborative consumption can mitigate current urban transportation problems such as pollution, congestion, increasing costs and inefficient land use patterns. however, innovations in the overall transport system shouldn’t be reserved for only one income bracket. Creating a more equitable transportation system, where all residents have access to education and employment opportunities and affordable goods and services is a true measure of a sustainable future for the city.

54 | Shellooe
rEfErENCESBonsall, P., A. Jopson, et al. (2002). Car share and car clubs: Potential impacts. Burkhardt, J. and A. Millard-Ball (2006). “Who Is Attracted to Carsharing?” Transportation research record 1986(1): 98-105. Cervero, R. (2003). “City CarShare: First-year travel demand impacts.” Transportation Research Record: Journal of the Transportation Research Board 1839(-1): 159-166. Cervero, R., A. Golub, et al. (2007). “City CarShare: longer-term travel demand and car ownership impacts.” Transportation Research Record: Journal of the Transportation Research Board 1992(-1): 70-80. Cervero, R. and Y. Tsai (2004). “City CarShare in San Francisco, California: second-year travel demand and car ownership impacts.” Transportation Research Record: Journal of the Transportation Research Board 1887(-1): 117-127. City of New York, Office of the Mayor (2011). PlaNYC 2030. Cooper, G., D. howes, et al. (2000). “The Missing Link: An Evaluation of CarSharing Portland Inc.” Portland: Oregon Department of Environmental Quality. Duncan, M. (2011). “The cost saving potential of carsharing in a US context.” Transportation 38(2): 363-382. Garrett, M. and B. Taylor (1999). “Reconsidering social equity in public transit.” Berkeley Planning Journal 13: 6-27. Lane, C. (2005). “PhillyCarShare: First-year social and mobility impacts of carsharing in Philadelphia, Pennsylvania.” Transportation Research Record: Journal of the Transportation Research Board 1927(-1): 158-166. Levinson, D. (2002). “Identifying winners and losers in transportation.” Transportation Research Record: Journal of the Transportation Research Board 1812(-1): 179-185.

55 |
Litman, T. (2002). “Evaluating transportation equity.” World Transport Policy and Practice 8(2): 50-65. Martin, E. and S. Shaheen (2011). “The Impact of Carsharing on Public Transit and Non-Motorized Travel: An Exploration of North American Carsharing Survey Data.” Energies 4(11): 2094-2114. Martin, E., S. A. Shaheen, et al. (2010). “Impact of Carsharing on household Vehicle holdings.” Transportation Research Record: Journal of the Transportation Research Board 2143(-1): 150-158. Martin, E. S., Susan A.; Lidicker, Jeffrey (2010). “Impact of Carsharing on household Vehicle holdings.” Transportation Research Record: Journal of the Transportation Research Board 2143(2010): 150-158. Martin, E. W. and S. A. Shaheen (2011). “Greenhouse Gas Emission Impacts of Carsharing in North America.” Intelligent Transportation Systems, IEEE Transactions on 12(4): 1074-1086. Mathews, J. (2012). Zipcar New York Metro Fact Sheet 2012, Zipcar Public Relations. Millard-Ball, A., G. Murray, et al. (2006). Carsharing as a Parking Management Strategy. Millard-Ball, A., G. Murray, et al. (2005). Car-Sharing: Where and how it succeeds, Transportation Research Board. Millard-Ball, A., P. Siegman, et al. (2004). “Solving Campus Parking Shortages: New Solutions for an Old Problem.” Planning for higher Education 33(1): 14. New York City Department of City Planning (2010). “Car Share Zoning Text Amendment.”
REFERENCES

56 | Shellooe
Schwartz, Joachim. (1999). Presentation at Car-Free Cities Working Group Seminar, London.
Shaheen, S., A. P. Cohen, et al. (2005). “Carsharing in North America: Market growth, current developments, and future potential.” Shaheen, S. A. and A. P. Cohen (2012). “Carsharing and Personal Vehicle Services: Worldwide Market Developments and Emerging Trends.” International Journal of Sustainable Transportation 7(1): 5-34. Shaheen, S. C., Adam (2012). “Innovative Mobility Carsharing Outlook: Carsharing Market Overview, Analysis and Trends.”.” Transportation Sustainability Research Center - University of California, Berkeley Fall 2012. Shaheen, S. R., Caroline; Murray, Gail; Cohen, Adam; Martin, Elliot (2010). “Carsharing and Public Parking Policies: Assessing Benefits, Costs and Best Practices in North America.” Mineta Transportation Institute Report 09-09: 1-56. Shaheen, S. S., Daniel; Wagner, Conrad (1998). “Carsharing in Europe and North America: Past, Present and Future.” Transportation Quarterly 52(3): 35-52. Sullivan, F. (2010). Sustainable and Innovative Personal Transport Solutions: Strategic Analysis of Carsharing Market in Europe. Wachs, M. T., B. (1998). “Can Transportation Strategies help Meet the Welfare Challenge?” Journal of the American Planning Assn. 64(1): 15-19. Zhou, J. (2012). “An analysis of university employee car-sharers in Los Angeles.” Transportation Research Part D: Transport and Environment 17(8): 588-591. Zipcar, I. (2012). “Zipcar, Inc.” Green Benefits. from www.zipcar.com.

57 |
AppENdIx
A. Survey toolB. All variables by Community District C. Regression diagnostics
APPENDIx

1. What is the main purpose of your travel today? Work Shopping Personal/social Grocery shopping Business Recreation Other: __________ 2. How did you get to the shopping center today? Walk Drove alone Bike Drove with others Bus Carsharing Subway Taxi Livery cab Other: _________ 3. How will you travel home from the shopping center?
Walk Drove alone Bike Drove with others Bus Carsharing Subway Taxi Livery cab Other: _________
4. How much do you expect to pay for the travel part of your trip today? Free $10 -15 $0-5 $15-20 $5-10 More than $20
5. What is the main reason that you chose this way to travel?
Location – this option is closest to my home Cost – this is the least expensive option Comfort – this is the most comfortable Ease – this is the easiest way to travel Time – this is the fastest way to travel Other: _______________
For the next questions, please circle YES or NO
6. Do you have access to the internet? YES NO 7. Do you have a credit card? YES NO
8. Do you have a driver’s license? YES NO 9. Are you aware of shared vehicles like Zipcars in your neighborhood? YES NO
10. Would you use a carsharing service if it were near your home? YES NO
If no, why not? ______________________
11. Which zip code do you live in? ___________ 12. What is your household income? Less than $20,000 $20,000 – 35,000 $35,000 – 50,000 $50,000 - $75,000 $75,000 – 100,000 Over $100,000 13. What is your race/ethnicity? Asian Black or African American Caucasian Hispanic or Latino Other: _______________
14. What is your highest level of education? Less than high school High school graduate Some college Associate’s degree Bachelor’s degree Advanced degree
IN THE CITY OF NEW YORKTHE GRADUATE SCHOOL OF ARCHITECTURE PLANNING AND PRESERVATION
400 AVERY HALL
1172 AMSTERDAM AVENUE NEW YORK, NEW YORK 10027 TEL: 212 - 854 - 3414
Please complete this voluntary survey to the best of your ability. Thank you for your
participation in this research study!

59 |
AppENdIx b
CDN
UM
_CAR
CAR_
DEN
(pTO
T_PO
PPO
P_DE
N (
N_R
AIL
P_N
O_V
EHP_
ALT_
MO
MED
_HHI
P_N
ON
_WP_
BacD
egP_
POV
212
00
162,
347
45.7
310
0.32
0.57
45,7
58$
0.93
0.15
0.18
311
00
171,
938
72.1
417
0.40
0.68
43,2
87$
0.50
0.14
0.16
405
00
169,
142
35.0
16
0.28
0.58
55,1
80$
0.45
0.14
0.14
410
00
129,
014
32.8
69
0.17
0.48
61,4
21$
0.74
0.13
0.11
411
00
118,
085
19.6
50
0.07
0.32
75,8
31$
0.51
0.26
0.07
413
00
199,
048
24.7
60
0.07
0.37
78,3
49$
0.87
0.20
0.07
414
00
113,
017
25.0
910
0.28
0.47
47,5
08$
0.63
0.16
0.21
502
00
131,
223
9.85
60.
060.
3373
,201
$
0.
280.
180.
0950
30
016
0,52
811
.56
120.
030.
2586
,531
$
0.
150.
170.
0550
12
0.05
173,
065
19.4
64
0.16
0.41
60,1
65$
0.59
0.17
0.18
313
20.
2499
,112
49.4
98
0.42
0.69
33,1
21$
0.40
0.21
0.24
407
80.
2624
4,09
832
.49
10.
240.
4856
,542
$
0.
690.
220.
1330
54
0.27
175,
574
48.9
620
0.47
0.72
32,9
85$
0.96
0.08
0.32
209
50.
4617
1,04
665
.93
50.
460.
6637
,756
$
0.
980.
110.
2621
15
0.52
121,
281
52.6
56
0.31
0.56
46,4
68$
0.73
0.15
0.19
210
90.
5411
1,61
127
.84
50.
210.
4753
,842
$
0.
660.
140.
1341
214
0.55
221,
023
36.0
27
0.26
0.54
52,9
77$
0.98
0.13
0.16
315
90.
7114
5,27
248
.06
100.
260.
5848
,517
$
0.
290.
230.
1440
817
0.86
150,
242
31.5
35
0.18
0.50
58,5
18$
0.66
0.26
0.13
403
70.
8817
7,19
893
.04
60.
500.
7350
,039
$
0.
890.
140.
1920
88
0.90
103,
819
48.4
54
0.04
0.61
55,4
75$
0.63
0.19
0.16
318
220.
9220
4,47
835
.57
30.
190.
5064
,214
$
0.
740.
180.
1120
26
1.02
53,4
8137
.86
70.
600.
7322
,451
$
0.
990.
070.
4231
011
1.02
128,
716
49.7
97
0.34
0.62
56,4
66$
0.39
0.21
0.15
316
61.
2182
,096
69.0
814
0.52
0.75
26,3
85$
0.99
0.08
0.37
201
71.
2189
,556
64.6
711
0.64
0.78
21,6
74$
0.98
0.07
0.41
203
61.
4076
,466
74.3
32
0.59
0.72
22,7
76$
0.99
0.07
0.41
404
91.
4315
3,00
410
1.42
90.
470.
7546
,166
$
0.
920.
160.
1940
918
1.75
141,
933
57.6
610
0.26
0.58
56,8
54$
0.81
0.16
0.14
312
181.
8820
7,69
590
.62
130.
460.
6638
,414
$
0.
370.
150.
2940
231
2.31
109,
552
34.0
816
0.50
0.77
54,8
99$
0.71
0.23
0.12
205
92.
4412
9,60
614
6.65
80.
630.
7425
,526
$
0.
990.
080.
3930
726
2.51
118,
585
47.7
29
0.55
0.76
49,0
60$
0.71
0.18
0.21
APPENDIx

60 | Shellooe
204
142.
6314
5,06
211
3.70
90.
640.
7527
,509
$
0.
990.
070.
3640
151
3.11
184,
594
46.8
613
0.50
0.74
50,3
49$
0.54
0.24
0.16
317
303.
3416
0,72
774
.64
40.
430.
7045
,246
$
0.
980.
130.
1531
428
3.56
157,
187
83.3
310
0.47
0.72
44,7
52$
0.63
0.19
0.22
406
303.
8011
1,96
559
.03
50.
280.
6766
,122
$
0.
450.
300.
0830
341
5.39
145,
786
79.9
213
0.58
0.74
36,4
50$
0.90
0.15
0.30
206
235.
6177
,911
79.1
92
0.62
0.71
21,4
47$
0.92
0.08
0.43
207
316.
0612
0,49
098
.12
100.
600.
7531
,346
$
0.
920.
110.
3030
440
7.38
115,
541
88.8
318
0.61
0.78
35,8
21$
0.93
0.10
0.30
309
409.
2310
5,40
510
1.31
100.
560.
7639
,593
$
0.
820.
150.
2311
275
10.0
520
3,17
611
3.47
150.
710.
7839
,281
$
0.
830.
170.
2630
114
711
.59
169,
215
55.5
914
0.65
0.75
43,5
80$
0.40
0.24
0.30
110
7912
.47
124,
490
81.8
95
0.75
0.86
31,5
71$
0.88
0.14
0.30
306
106
12.8
811
2,72
557
.08
100.
520.
7885
,024
$
0.
400.
340.
1110
959
14.7
311
1,30
811
5.79
90.
740.
8337
,308
$
0.
760.
190.
2711
062
16.5
911
9,60
413
3.34
110.
660.
8034
,935
$
0.
890.
190.
2830
212
916
.77
98,0
8753
.13
250.
620.
7772
,685
$
0.
530.
300.
1830
875
17.1
887
,271
83.3
110
0.63
0.79
42,3
60$
0.82
0.21
0.25
103
8318
.49
157,
437
146.
179
0.79
0.82
41,5
69$
0.67
0.25
0.26
101
8721
.85
59,6
5462
.43
480.
730.
8312
3,06
3$
0.
390.
370.
0910
712
223
.95
206,
539
168.
9214
0.69
0.78
91,8
53$
0.32
0.32
0.12
108
172
32.5
821
6,23
317
0.67
80.
680.
7610
5,12
4$
0.
200.
380.
0610
212
434
.35
89,2
8910
3.06
230.
770.
7896
,029
$
0.
240.
420.
1010
615
040
.52
121,
176
136.
406
0.74
0.80
100,
355
$
0.27
0.42
0.09
104
235
49.8
310
3,84
591
.75
140.
790.
8277
,372
$
0.
390.
370.
1410
527
866
.37
66,8
4766
.49
360.
790.
8311
2,02
5$
0.
290.
420.
10

61 |
AppENdIx C
Regression analysis operates on the assumption that the data are normally distributed. Performing regression tests can determine issues with the distribution and if certain observations are exerting undue influence in the analysis. These tests can also examine if any of the independent variables are collinear, further skewing the results. In this dataset, regression diagnostics show that there are some outliers that could be exerting an influence on the regression. First, creating a scatter plot of the strong independent variables on car density shows initially that Community District 5 in Manhattan is a potential outlier.
I then created a studentized residual to determine outliers from a stem plot. Manhattan CD 4 and 5, and Queens CD6 exceed the recommended cut-off of absolute value<2. The next test uses a stem plot of leverage to determine outliers. Observations with values greater than (2k+2)/n where k=3 and n=59 may represent undue influence. In this analysis, 7 districts had leverage values greater than 0.136: Queens CD11; Manhattan CD 5, 6, 7 and 8; Bronx CD5; and Staten Island CD3. The next test is Cook’s D; the cut-off for this predictor is 4/n, or in this case 4/59. Both Manhattan CD 4 and 5 are above the Cook’s D cut-off. The cut-off for the next test,
APPENDIx

62 | Shellooe
DFITS, is 2*sqrt(k/n); Manhattan CD 4, 5; Bronx CD 6; Queens CD 2 and Staten Island CD 3 have DFITS values that exceed the cut-off.
Residual > 2: MN 4, 5, QN6 Leverage> (2k+2)/n: QN 11, MN 5, 6, 7, 8, Bx 5, SI 3 Cook’s D> 4/n: MN 4, 5 DFITS> 2*sqrt(k/n): MN 4, 5, Bx 6, QN 2, SI 3
Manhattan districts 4 and 5 are each identified as observations of concern in at least three of the diagnostic tests. This provides conclusive evidence that they may be influencing the analysis. Excluding Manhattan CD 4 and 5 from the data set produces the following descriptive statistics:
poverty 57 .2054133 .1018909 .051449 .4251774 bacdegree 57 .1870774 .0873187 .0652041 .4225875 nonwhite 57 .6806162 .2517702 .1546272 .9925326 income 57 52310.97 22444.55 21446.87 123062.8 altmode 57 .6626558 .1455046 .2482631 .8569271 zerocar 57 .45446 .2151827 .0278618 .7857037 rail 57 9.842105 7.32849 0 48 popdensity 57 69.23116 38.97241 9.852316 170.6654 cardensity 57 6.306798 9.415695 0 40.52229 Variable Obs Mean Std. Dev. Min Max
The resulting correlations are increased after excluding the two influential outliers from the dataset.
Appendix C, Table 1: Descriptive Statistics

63 |
_cons -17.80847 1.544147 -11.53 0.000 -20.9043 -14.71264 bacdegree 69.41795 6.01245 11.55 0.000 57.36371 81.47218 zerocar 24.48783 2.439785 10.04 0.000 19.59636 29.37931 cardensity Coef. Std. Err. t P>|t| [95% Conf. Interval]
Total 4964.6973 56 88.6553089 Root MSE = 3.8841 Adj R-squared = 0.8298 Residual 814.664756 54 15.0863844 R-squared = 0.8359 Model 4150.03254 2 2075.01627 Prob > F = 0.0000 F( 2, 54) = 137.54 Source SS df MS Number of obs = 57
_cons -20.37789 2.985602 -6.83 0.000 -26.36625 -14.38953 bacdegree 67.40563 6.408388 10.52 0.000 54.55203 80.25923 altmode 10.60361 5.288219 2.01 0.050 -.0032174 21.21043 popdensity .101805 .0200187 5.09 0.000 .0616526 .1419574 cardensity Coef. Std. Err. t P>|t| [95% Conf. Interval]
Total 4964.6973 56 88.6553089 Root MSE = 4.1002 Adj R-squared = 0.8104 Residual 891.027332 53 16.8118365 R-squared = 0.8205 Model 4073.66997 3 1357.88999 Prob > F = 0.0000 F( 3, 53) = 80.77 Source SS df MS Number of obs = 57
Appendix C, Table 3: Population density, commute mode, and education
Appendix C, Table 2: Car ownership and education
APPENDIx