Embed Size (px)
Citation preview
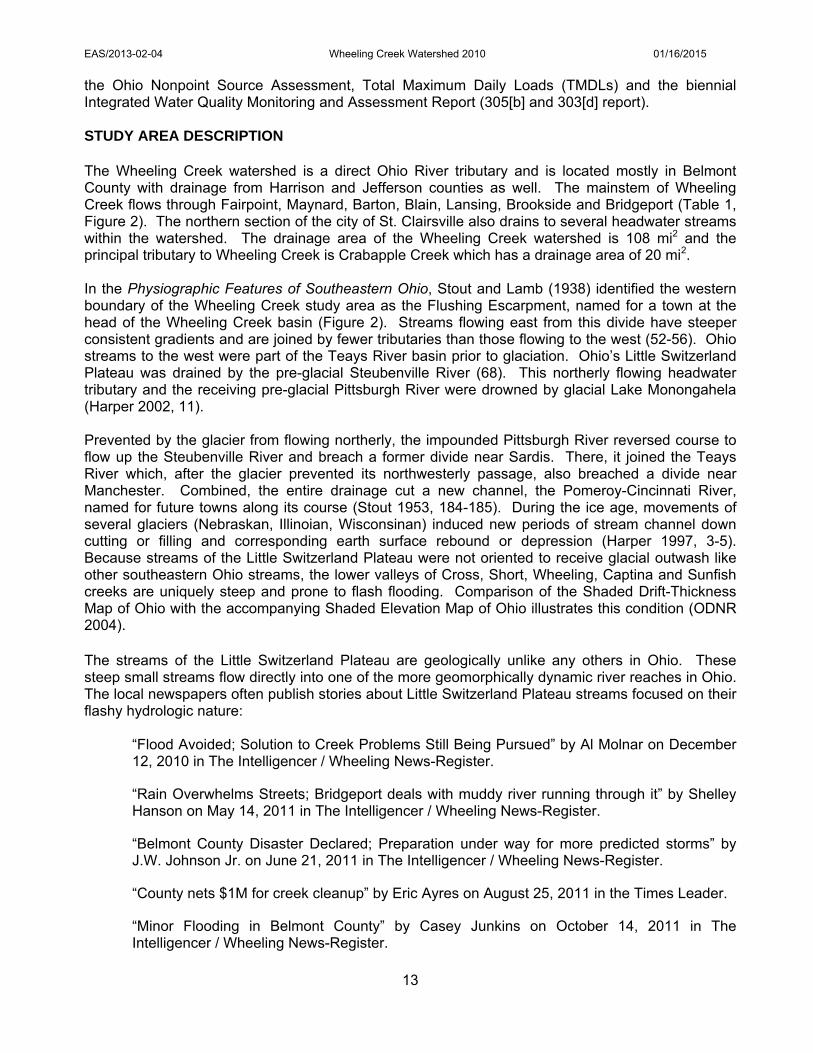
Biological and Water Quality Study
of the Wheeling Creek Watershed
2010 & 2011
Belmont, Jefferson and Harrison Counties
OHIO EPA Technical Report EAS/2013‐02‐04
Division of Surface Water January 16, 2015

EAS/2013-02-04 Wheeling Creek Watershed 2010 01/16/15
1
Biological and Water Quality Study of the
Wheeling Creek Basin
2010
Belmont, Jefferson and Harrison Counties, Ohio January 16, 2015
OEPA Report EAS 2013-02-04
prepared by
State of Ohio Environmental Protection Agency Division of Surface Water
Lazarus Government Center 50 West Town Street, Suite 700
P.O. Box 1049 Columbus, Ohio 43216-1049
Southeast District Office 2195 Front Street
Logan, Ohio 43138
Ecological Assessment Section 4675 Homer Ohio Lane Groveport, Ohio 43125
John R. Kasich, Governor Craig Butler, Director State of Ohio Environmental Protection Agency

EAS/2013-02-04 Wheeling Creek Watershed 2010 01/16/15
2
TABLE OF CONTENTS EXECUTIVE SUMMARY ................................................................................................................. 4 RECOMMENDATIONS .................................................................................................................... 9 INTRODUCTION ........................................................................................................................... 12 STUDY AREA DESCRIPTION ...................................................................................................... 13 RESULTS ...................................................................................................................................... 15 Water Chemistry ............................................................................................................................ 15 Recreation Use .............................................................................................................................. 20
Point Source Impacts ............................................................................................................ 22 Sediment ............................................................................................................................... 26 Fish Tissue ............................................................................................................................ 28 Stream Physical Habitat ........................................................................................................ 31
Fish Community ............................................................................................................................. 33 Macroinvertebrate Community ....................................................................................................... 36 ACKNOWLEDGEMENTS .............................................................................................................. 39 REFERENCES .............................................................................................................................. 40
APPENDICES ................................................................................................ Companion Document LIST OF FIGURES Figure Title Page Figure 1 Aquatic life use attainment in the Wheeling Creek study area, 2010. 4 Figure 2 Wheeling Creek watershed with sampling locations and biological narratives. 6 Figure 3 Mining Impact of Crabapple- Wheeling Creek. 7 Figure 4 Flows from a nearby USGS Gage (Short Creek) and dates of sampling in the Wheeling 16 Creek survey area in 2010. Figure 5 Map of the impacts to Wheeling Creek (NPDES permitted facilities and mining). 22 Figure 6 CSO and SSO dischargers along the lower section of Wheeling Creek. 25 Figure 7 Campbell Run with orange stained water from mine drainage discharges. 26 Figure 8 Wheeling Creek at Pease Road at Blain. 31 Figure 9 Number of sensitive mayfly taxa and average total dissolved solids found in water samples 37
collected from the Wheeling Creek study area compared to the nearby Central Ohio River tributaries sampled in 2010.

EAS/2013-02-04 Wheeling Creek Watershed 2010 01/16/15
3
LIST OF TABLES Table Title Page Table 1 Wheeling Creek watershed sampling locations, 2010. 5 Table 2 Aquatic life use attainment stations sampled in the Wheeling Creek watershed, 2010. 8 Table 3 Waterbody use designation recommendations for the Wheeling Creek watershed. 11 Table 4 Exceedances of Ohio Water Quality Standards criteria (OAC3745-1) for chemical/physical 17
parameters measured in the Wheeling Creek watershed. Table 5 Summary statistics for select mining water quality parameters sampled in the Wheeling 18
Creek study area, 2010. Table 6 Summary statistics for select nutrient water quality parameters sampled in the Wheeling 19
Creek study area, 2010.
Table 7 A summary of E. coli data sampled in the Wheeling Creek study area, 2010 and 2011 . 21 Table 8 Chemical parameters measured above screening levels in sediment samples collected 27
in the Wheeling Creek study area, 2010. Table 9 Metals concentrations (mg/kg) in fish tissue samples collected from Wheeling Creek, 2009. 29 Table 10 Organic compounds (mg/kg) in fish tissue samples collected from Wheeling Creek, 2009. 29 Table 11 Non-drinking water human health use attainment status based on fish tissue samples 30
collected from Wheeling Creek, 2009.
Table 12 Stream habitat (QHEI) results for the Wheeling Creek stud area, 2010. 32 Table 13 Fish community summaries based on pulsed D.C. electrofishing sampling conducted by Ohio 34
EPA in the Wheeling Creek watershed during 2010. Table 14 . Fish community trends from 1983 to 2010 based on pulsed D.C. electrofishing sampling 35
Ohio EPA in the Wheeling Creek watershed. Table 15 Summary of macroinvertebrate data collected from the Wheeling Creek study area, 2010. 38

EAS/2013-02-04 Wheeling Creek Watershed 2010 01/16/15
4
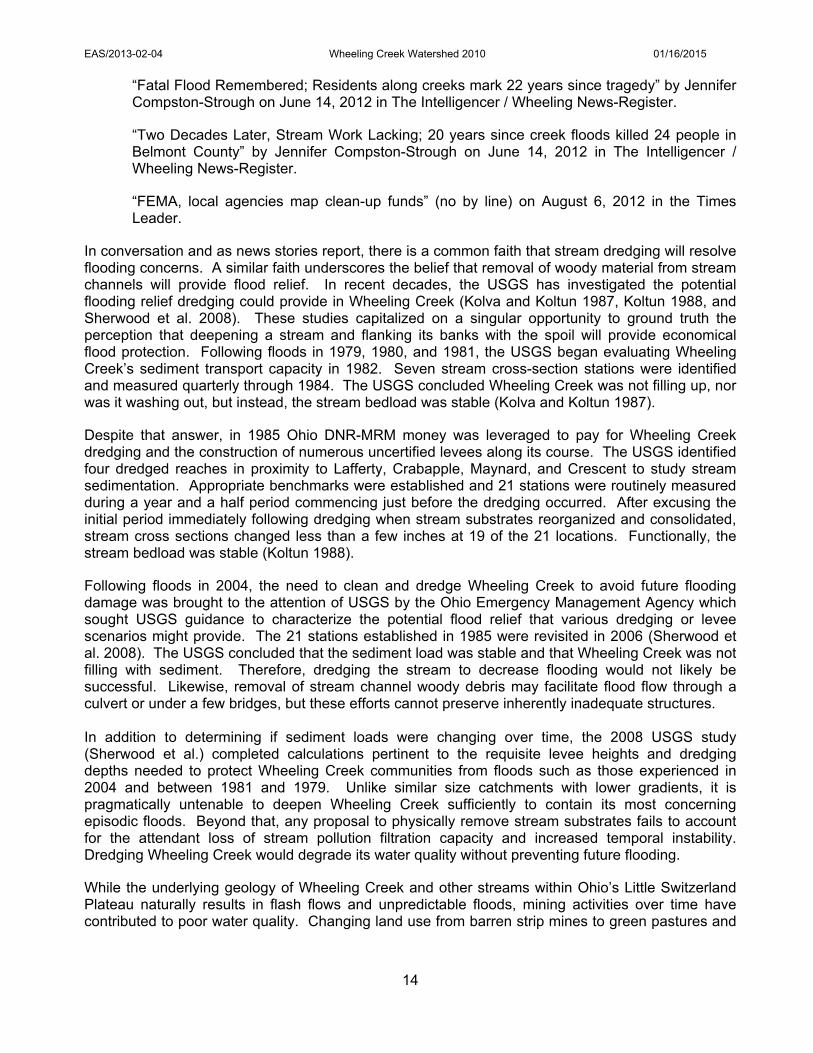
24%
47%
29%
Clean Water Act Goals
Full
Partial
Non
EXECUTIVE SUMMARY Rivers and streams in Ohio support a variety of uses related to recreation, water supply, and aquatic life. As part of the biological and water quality survey process, Ohio EPA annually evaluates streams from selected watersheds to determine their appropriate beneficial use designations and to verify the uses are meeting the goals of the federal Clean Water Act. In 2010, 17 sites from nine streams in the Wheeling Creek watershed were assessed for aquatic life and recreation use potential (see Table 1 and Figure 2 for sampling locations). Wheeling Creek is a direct Ohio River tributary and is located mostly in Belmont County with drainage from Harrison and Jefferson counties as well. The mainstem of Wheeling Creek flows through Fairpoint, Maynard, Barton, Blain, Lansing, Brookside and Bridgeport. The Wheeling Creek watershed has been extensively mined with a total of 78.8% of the basin affected by either surface or undergrounding mining or in some areas by both mining methods (Figure 3). Of the 17 biological samples collected, four sites (24%) were fully meeting the designated or recommended aquatic life use, eight (47%) were in partial attainment, and five (29%) were in non-attainment (Figure 1). The thirteen impaired sites were located in areas influenced by mine drainage or municipal waste water discharges. The biological community in the mainstem of Wheeling Creek was fair to good but only one site out of eight locations was meeting the recommended Warmwater Habitat (WWH) aquatic life use designation. However, many of these locations were very close to meeting WWH and, with further mine abatement projects and natural attenuation, Wheeling Creek should be able to attain WWH. The combination of optimal buffering capacity, widespread reclamation of both historic and active mines and gob, natural attenuation of the damaged landscape, strong base flow, and good habitat quality contributed to less severe biological impacts. As a testament to the improved conditions, two highly sensitive and previously unrecorded fish species, bluebreast and Tippecanoe darters, were found in lower Wheeling Creek. These fish are highly sensitive to siltation, and their presence is a strong indicator of reduced silt runoff and gradual water quality improvement in the watershed. This did not mean that the Wheeling Creek watershed was unaffected, or even unimpaired, by mining. Physical habitat quality, background watershed geology, and recovery trends in both the landscape and water courses were considered positive enough to justify the WWH use designation for Wheeling Creek and all the tributaries sampled with the exception of Steep Run. In Steep Run, the combination of both severe mine drainage and poor habitat quality (QHEI=30) justified a Modified Warmwater Habitat (MWH) re-classification from the unverified WWH use. Eight locations in the Wheeling Creek watershed were tested for the bacterium Escherichia coli (E. coli), to determine the attainment status of the Primary Contact Recreation (PCR) use in 2010. Additionally, five locations were sampled in 2011 near the unsewered communities of Barton and Crescent. Evaluation of E. coli results revealed that no location attained the applicable geometric mean PCR criterion, and only one site met the single sample maximum. Nearly all the communities in the Wheeling Creek watershed are unsewered, so the likely source of bacteria is sanitary waste
Figure 1. Aquatic life use attainment in the Wheeling Creek study area, 2010.

EAS/2013-02-04 Wheeling Creek Watershed 2010 01/16/15
5
from failing home sewage treatment systems. Poor agricultural activities such as cattle with free access to streams could also be a source of E. coli in the watershed.
Table 1. Wheeling Creek watershed sampling locations.
Site Number* Stream Name /Location
River Mile
Drainage Area (mi2) Latitude Longitude
1 Wheeling Creek @ CR 72 (Mt Hope Road) 27.9 4.4 40.109700 -81.026400
2 Wheeling Creek CR 78 (National Oco Road) 25.97 13.4 40.106601 -81.000277
3 Wheeling Creek @ TR 337 (Lee Rd) ust. Crabapple Creek
22.73 24.2 40.109619 -80.969829
4 Wheeling Creek @ CR 10 (Fairport - Maynard Rd) 17.34 59.6 40.127307 -80.906262
5 Wheeling Creek @ Crescent-Barton Rd (ust. Town Run)
10.99 80.0 40.114000 -80.860000
6 Wheeling Creek @ CR 10 (Barton -Blaine Road) 9.40 86.0 40.096802 -80.838542
7 Wheeling Creek @ Blain (Pease Road) 5.05 96.0 40.066900 -80.808600
8 Wheeling Creek @ Cr 24 (Boydsville Road) 1.64 103 40.067097 -80.767283
9 Crabapple Creek @ CR 66 (Uniontown - New Athens Road)
2.88 10.0 40.137746 -80.990941
10 Crabapple Creek @ CR 10 (Crabapple Road) 0.16 19.0 40.116900 -80.955600
11 Campbell Run @ mouth from abandoned TR 414 0.03 7.3 40.126406 -80.962699
12 McCracken Run near mouth at SR 9 0.23 4.7 40.123838 -80.937777
13 Pogue Run @ CR 10 (Fairport-Maynard Rd) 0.11 5.3 40.119658 -80.916839
14 Cox Run @ TR 432 (Stonehouse - Purseglove Road)
0.03 7.3 40.121064 -80.885988
15 Fall Run adjacent CR 10/CR5 near Crescent 0.03 3.83 40.121280 -80.862460
16 Town Run @ TR 434 (Hell’s Kitchen Road) 0.28 2.4 40.103898 -80.855285
17 Steep Run dst. CR 10 at old Rail Road bridge 0.03 2.27 40.107090 -80.841160
* The color of the site number corresponds to the narrative biological score green is good to marginally good (meets WWH goals) yellow is fair, orange is poor and red is very poor (fair, poor and very poor do not meet the goals of WWH).

EAS/2013-02-04 Wheeling Creek Watershed 2010 01/16/15
6

EAS/2013-02-04 Wheeling Creek Watershed 2010 01/16/15
7

EAS/2013-02-04 Wheeling Creek Watershed 2010 01/16/15
8
Table 2. Aquatic life use attainment status for stations sampled in the Wheeling Creek watershed, 2010. The Index of Biotic Integrity (IBI), Modified Index of well-being (MIwb), and Invertebrate Community Index (ICI) are scores based on the performance of the biotic community. The Qualitative Habitat Evaluation Index (QHEI) is a measure of the ability of the physical habitat of the stream to support a biotic community. The watersheds is located in the Western Allegheny Plateau (WAP) ecoregion. If biological impairment has occurred, the cause(s) and source(s) of the impairment are noted. NA is not applicable.
Stream River MileA
HUC 12
5030100
Drainage Area (mi2)F
Aquatic Life Use
DesignationE
Aquatic Life Attainment
StatusB IBI MIwbC ICI D Stream Habitat
Cause of Impairment
Source of Impairment
Wheeling Creek 27.90 -603-02 4.4H LWH/WWH-R NON 38* NA F* 60.3 Dissolved solids Mine drainage
Wheeling Creek 25.97 -603-02 13.4H LWH/WWH-R NON 34* NA F* 65.5 Dissolved solids Mine drainage
Wheeling Creek 22.73 -603-02 24.2W LWH/WWH-R PARTIAL 32* NA 42 81.3 Dissolved solids Mine drainage
Wheeling Creek 17.34 -603-03 59.6W LWH/WWH-R FULL 42 ns 8.2 ns 38 88.3
Wheeling Creek 10.99 -603-03 80.0W LWH/WWH-R PARTIAL 39* 7.9ns 38 78.5 Dissolved solids Mine drainage
Wheeling Creek 9.40 -603-04 86.0W LWH/WWH-R PARTIAL 41ns 7.8* 40 70.5 Dissolved solids Mine drainage
Wheeling Creek 5.05 -603-04 96.0W LWH/WWH-R PARTIAL 42ns 8.1 ns 30* 84.0 Dissolved solids Mine drainage
Wheeling Creek 1.64 -603-04 103W LWH/WWH-R PARTIAL 44 9.0 26* 67.0 Dissolved solids Mine drainage
Crabapple Creek 2.88 -603-01 10.0H WWH NON 38* NA F* 59.5 Dissolved solids Mine drainage
Crabapple Creek 0.16 -603-01 19.0H MWH/WWH-R FULL 42NS NA 36 67.8
Campbell Run 0.03 -603-01 7.3H WWH NON 32* NA VP* 70.8 Dissolved solids,
Metals Mine drainage
McCracken Run 0.23 -603-03 4.7H WWH NON 38* NA NA 54.0 Dissolved solids Mine drainage
Pogue Run 0.11 -603-03 5.3H WWH FULL 40ns NA G 81.0
Cox Run 0.03 -603-03 7.3 H WWH PARTIAL 46 NA F* 61.5 Dissolved solids Mine drainage
Fall Run 0.03 -603-03 3.8 H WWH FULL 40ns NA 32ns 65.3
Town Run 0.28 -603-03 2.4 H WWH PARTIAL 46 NA F* 58.8 Organic enrichment Muni. WWTP
Steep Run 0.03 -603-04 2.3 H WWH/MWH-R PARTIAL 26 NA P* 30.5 Dissolved solids, Metals, Ammonia
Mine drainage, Septic Tanks
A River Mile (RM) represents the Point of Record (POR) for the station, not the actual sampling RM.
B Attainment is given for the proposed status when a change is recommended.
C MIwb is not applicable (NA) to headwater streams with drainage areas < 202 .
D A narrative evaluation of the qualitative sample based on attributes such as EPT taxa richness, number of sensitive taxa, and community composition was used when quantitative data was not available or considered unreliable. VP=Very Poor, P=Poor, LF=Low Fair, F=Fair, MG=Marginally Good, G=Good, VG=Very Good, E=Exceptional.
E The existing use designation is listed first and ,if applicable, a recommended use designation follows flagged with the letter R. F H indicates headwater site and W indicates wading site.
ns Nonsignificant departure from biocriteria (<4 IBI or ICI units, or <0.5 MIwb units).
* Indicates significant departure from applicable biocriteria (>4 IBI or ICI units, or >0.5 MIwb units).
Underlined scores are in the Poor or Very Poor range.
Index – Site Type WWH MWH
IBI – Headwaters/Wading 44 24
MIwb – Wading 8.4 6.2
ICI 36 30

EAS/2013-02-04 Wheeling Creek Watershed 2010 01/16/2015
9
RECOMMENDATIONS The streams in the Wheeling Creek study area currently listed in the Ohio Water Quality Standards (WQS) are assigned one or more of the following aquatic life use designations: Warmwater Habitat (WWH), Modified Warmwater Habitat (MWH) due to mine drainage and Limited Warmwater Habitat (LWH) The LWH aquatic life use is no longer being assigned to Ohio streams and rivers and this assessment recommends redesignation of those streams in the watershed that are still assigned this use. As stated in the WQS at 3745-1-07(B)(1)(b), “Stream segments currently designated limited warmwater habitats will undergo use attainability analyses and will be redesignated other aquatic life habitats. No additional stream segments will be designated limited warmwater habitats”. The use designations for Crabapple Creek and Town Run in the Wheeling Creek basin are based on 1983 and 1991 biological surveys conducted by Ohio EPA. All other streams still retain their original 1978 WQS designations which were assigned before development of standardized approaches to the collection of instream biological data and numerical biological criteria. The most recent survey employed an extensive chemical and biological sampling effort to evaluate conditions and establish appropriate aquatic life uses throughout the study area. Non-aquatic life uses of Agricultural Water Supply (AWS), Industrial Water Supply (IWS), and Primary Contact Recreation (PCR) are verified and should be retained.for all streams.
Nine streams were evaluated for aquatic life and recreational use potential in 2010. As a result of the 2010 survey findings, the minimum aquatic life use designation recommended was WWH for all but one Wheeling Creek basin stream (Steep Run). All segments currently listed as MWH or LWH were recommended for upgrade to WWH. Those streams included Wheeling Creek and lower Crabapple Creek. Steep Run, a severely impacted and unverified WWH stream was recommended for MWH-mine affected (Table 2). All other streams were verified as WWH. Significant findings included the following:
The Wheeling Creek mainstem is currently listed as LWH due to acid mine drainage with an exemption for total dissolved solids (TDS) due to mining history. Despite chronic TDS exceedances, biological performance was typically near or within WWH standards including full or partial WWH aquatic life use attainment in the lower 23 miles of the main-stem. Mainstem QHEI scores averaged 74, clearly adequate to support WWH communities. Vast areas of historically mined lands in the basin have been reclaimed and Ohio Department of Natural Resources, Division of Mineral Resources Management (Ohio DNR-MRM) has been particularly active in gob pile remediation over the last quarter century. New collection records for pollution and silt intolerant bluebreast and Tippecanoe darters in lower Wheeling Creek suggest improving conditions and gradual healing of the disturbed landscape. For these reasons, the WWH designation is considered appropriate.
The lower one mile of Crabapple Creek downstream from Campbell Creek is a confirmed (+), MWH–mine affected stream located in the Wheeling Creek headwaters. Despite obvious chemical and visual evidence of mine drainage, an upgrade to WWH is recommended based on full WWH aquatic life use attainment within the reach and the presence of adequate physical habitat quality (QHEI=67.8). Recent and on-going reclamation efforts in the Campbell Creek basin and along lower Crabapple Creek reinforce the prospects for continued recovery.
Campbell Creek is a tributary to Crabapple Creek with significant mine drainage impairment;
biological performance ranged from fair (fish) to very poor (macroinvertebrates). However, physical habitat quality was adequate to support WWH communities (QHEI=70.75) and mine reclamation activity in the watershed is both recent and on-going. Based on 2010 sampling, the current WWH use should be retained due to the existing habitat quality and the prospects for additional recovery.

EAS/2013-02-04 Wheeling Creek Watershed 2010 01/16/2015
10
McCracken Run is a tributary to Wheeling Creek with significant and on-going reclamation
activity. Biological performance was fair (IBI=38) for fish. As the physical habitat quality was adequate to support WWH communities (QHEI=54), the current WWH use should be retained based on existing habitat quality and the prospects for additional recovery.
Fall Run is a small (3.4 mi2 drainage area), mined tributary to Wheeling Creek with significant and on-going reclamation activity. The WWH use is confirmed based on full attainment of WWH biocriteria near the mouth and the presence of good physical habitat quality (QHEI=65.3).
Cox Run is a small (7.0 mi2 drainage area), extensively mined tributary to Wheeling Creek.
Macroinvertebrates were impaired (fair) due to excessive siltation from mining but very good fish communities (IBI=46) and good physical habitat quality (QHEI=61.5) support the existing WWH use. Given the success of mine reclamation efforts in other similar streams within the Wheeling Creek watershed (e.g., Fall Run, Crabapple Creek), the current WWH use is verified and should be retained.
Stream temperatures in Cox Run were quite cold but no cold water fish were collected and numbers of cold water macroinvertebrates (3) were slightly below expectations. Reductions in silt runoff should result in improved biological performance which may eventually reveal the coldwater habitat (CWH) aquatic life use as the existing use for Cox Run.
Pogue Run is a small (7.0 mi2 drainage area), mined tributary to Wheeling Creek. The WWH
use was affirmed by the full attainment of the WWH biocriteria and the presence of excellent physical habitat quality (QHEI=81).
Steep Run is an unverified WWH tributary to Wheeling Creek with significant mine drainage
impairment. Steep Run is a small stream (2.4 mi2 drainage area at the mouth), with a QHEI (30.5) well below WWH expectations. The major source of mine drainage was from exposed, above grade, shaft mine drainage. No significant Ohio DNR-MRM reclamation is planned for the basin in the near future. The stream is also impacted by septic tank drainage from the village of Barton. While Steep Run benefits from limestone geo-type and is not highly acidic, prospects for recovery to WWH levels any time in the near future are unlikely. Based on these limitations, the MWH-mine affected aquatic life use designation is considered appropriate.
Town Run was verified as a WWH tributary to Wheeling Creek in 1991. The QHEI score of 58.8
and an IBI score of 46 indicates that this stream is capable of attaining WWH. The macroinvertebrate qualitative score was fair but this was attributed to organic enrichment from the St. Clairsville wastewater treatment plant (WWTP).

EAS/2013-02-04 Wheeling Creek Watershed 2010 01/16/2015
11
Table 3. Waterbody use designation recommendations for the Wheeling Creek watershed. Designations based on the 1978 and 1985 water quality standards appear as asterisks (*). In addition, streams not assessed during the 2010 survey are in light blue font. A plus sign (+) indicates a confirmation of an existing use and a triangle (▲) denotes a new recommended use based on the findings of this report.
Water Body Segment
Use Designations
Comments Aquatic Life Habitat Water Supply
Recreation
S R W
W W H
E W H
M W H
S S H
C W H
L R W
P W S
A W S
I W S
B W
P C R
S C R
Wheeling creek
▲ + +
+
Frazier run * * * *
Slaughterhouse run * * * *
Flat run * * * *
McMonies run * * * *
Steep run ▲ + + + Mine drainage
Town run + + + +
Fall run + + + +
Jug run - at RM 3.18 * o * * *
- all other segments * * * *
Sloan run * * * *
Cox run + + + +
Patton run * * * *
Pogue run + + + +
Loves run * * * *
McCracken run + + + +
Crabapple creek - Campbell creek (RM 1.0) to the mouth
▲ + + +
- all other segments + + + +
Campbell creek + + + +
Ross run * * * *

EAS/2013-02-04 Wheeling Creek Watershed 2010 01/16/2015
12
INTRODUCTION Ohio EPA sampled nine streams with 17 sampling locations in the Wheeling Creek watershed in 2010 using standard Ohio EPA protocols as described in Appendix Table 1. A total of five National Pollutant Discharge Elimination System (NPDES) permitted facilities discharge sanitary wastewater, industrial process water, and/or industrial storm water into the Wheeling Creek watershed study area. Additionally, there are several combined sewer overflows (CSOs) and sanitary sewer overflows (SSOs) in lower Wheeling Creek associated with the Eastern Ohio Regional Wastewater Authority (EORWA) WWTP (Figure 6). Numerous coal companies have mined in the Wheeling Creek watershed with many abandoned underground and surface mines throughout the basin (Figure 3). Active surface mining is occurring in the headwaters of Wheeling Creek and in several tributaries (Figure 5). Included in this study were assessments of the biological, surface water and recreation (bacterial) condition. A total of 17 biological, 17 water chemistry, six sediment, six fish tissue (2009), and eight bacterial stations (2010-2011) were sampled in the study area. Specific objectives of the evaluation were to: ascertain the present biological conditions in the Wheeling Creek watershed by evaluating fish
and macroinvertebrate communities, identify the relative levels of organic, inorganic, and nutrient parameters in the sediments and
surface water, evaluate influences from NPDES outfall discharges, evaluate influences from nonpoint pollution sources, particularly those associated with coal
mining, assess physical habitat influences on stream biotic integrity, determine recreational water quality, compare present results with historical conditions, and determine beneficial use attainment status and recommend use changes, if appropriate.
The Wheeling Creek watershed is located in the Western Allegheny Plateau (WAP) ecoregion in Belmont, Jefferson and Harrison counties. The mainstem of Wheeling Creek is designated LWH in the Ohio Water Quality Standards (WQS) and a recommendation to replace this obsolete aquatic life use with the WWH aquatic life use is proffered. Crabapple Creek is listed as MWH due to mine drainage in the WQS for the lower one mile, but the results of this study recommend the WWH aquatic life use due to the ongoing improvement to water quality in the stream. Steep Run is an unverified WWH tributary to Wheeling Creek with significant mine drainage impairment. The MWH-mine affected aquatic life use designation is recommended for this stream. The rest of the evaluated tributaries are designated WWH in the WQS, this aquatic life use is appropriate and should be verified and retained for each tributary. Some of these streams were originally designated for aquatic life uses in the 1978 Ohio WQS. The techniques used then did not include standardized approaches to the collection of instream biological data or numerical biological criteria. This study used biological data to evaluate and establish aquatic life uses for these streams. See the Recommendations section and Table 3 for use recommendation changes. All designated streams in the Wheeling Creek study area are currently assigned as Primary Contact Recreation (PCR) (Class B), Agricultural Water Supply (AWS) and Industrial Water Supply (IWS). The findings of this evaluation may factor into regulatory actions taken by the Ohio EPA (e.g. NPDES permits, Director’s Orders, or the Ohio Water Quality Standards [Ohio Administrative Code (OAC) 3745-1]), and may eventually be incorporated into State Water Quality Management Plans,
EAS/2013-02-04 Wheeling Creek Watershed 2010 01/16/2015
13
the Ohio Nonpoint Source Assessment, Total Maximum Daily Loads (TMDLs) and the biennial Integrated Water Quality Monitoring and Assessment Report (305[b] and 303[d] report). STUDY AREA DESCRIPTION The Wheeling Creek watershed is a direct Ohio River tributary and is located mostly in Belmont County with drainage from Harrison and Jefferson counties as well. The mainstem of Wheeling Creek flows through Fairpoint, Maynard, Barton, Blain, Lansing, Brookside and Bridgeport (Table 1, Figure 2). The northern section of the city of St. Clairsville also drains to several headwater streams within the watershed. The drainage area of the Wheeling Creek watershed is 108 mi2 and the principal tributary to Wheeling Creek is Crabapple Creek which has a drainage area of 20 mi2. In the Physiographic Features of Southeastern Ohio, Stout and Lamb (1938) identified the western boundary of the Wheeling Creek study area as the Flushing Escarpment, named for a town at the head of the Wheeling Creek basin (Figure 2). Streams flowing east from this divide have steeper consistent gradients and are joined by fewer tributaries than those flowing to the west (52-56). Ohio streams to the west were part of the Teays River basin prior to glaciation. Ohio’s Little Switzerland Plateau was drained by the pre-glacial Steubenville River (68). This northerly flowing headwater tributary and the receiving pre-glacial Pittsburgh River were drowned by glacial Lake Monongahela (Harper 2002, 11). Prevented by the glacier from flowing northerly, the impounded Pittsburgh River reversed course to flow up the Steubenville River and breach a former divide near Sardis. There, it joined the Teays River which, after the glacier prevented its northwesterly passage, also breached a divide near Manchester. Combined, the entire drainage cut a new channel, the Pomeroy-Cincinnati River, named for future towns along its course (Stout 1953, 184-185). During the ice age, movements of several glaciers (Nebraskan, Illinoian, Wisconsinan) induced new periods of stream channel down cutting or filling and corresponding earth surface rebound or depression (Harper 1997, 3-5). Because streams of the Little Switzerland Plateau were not oriented to receive glacial outwash like other southeastern Ohio streams, the lower valleys of Cross, Short, Wheeling, Captina and Sunfish creeks are uniquely steep and prone to flash flooding. Comparison of the Shaded Drift-Thickness Map of Ohio with the accompanying Shaded Elevation Map of Ohio illustrates this condition (ODNR 2004). The streams of the Little Switzerland Plateau are geologically unlike any others in Ohio. These steep small streams flow directly into one of the more geomorphically dynamic river reaches in Ohio. The local newspapers often publish stories about Little Switzerland Plateau streams focused on their flashy hydrologic nature:
“Flood Avoided; Solution to Creek Problems Still Being Pursued” by Al Molnar on December 12, 2010 in The Intelligencer / Wheeling News-Register.
“Rain Overwhelms Streets; Bridgeport deals with muddy river running through it” by Shelley Hanson on May 14, 2011 in The Intelligencer / Wheeling News-Register.
“Belmont County Disaster Declared; Preparation under way for more predicted storms” by J.W. Johnson Jr. on June 21, 2011 in The Intelligencer / Wheeling News-Register.
“County nets $1M for creek cleanup” by Eric Ayres on August 25, 2011 in the Times Leader.
“Minor Flooding in Belmont County” by Casey Junkins on October 14, 2011 in The Intelligencer / Wheeling News-Register.
EAS/2013-02-04 Wheeling Creek Watershed 2010 01/16/2015
14
“Fatal Flood Remembered; Residents along creeks mark 22 years since tragedy” by Jennifer Compston-Strough on June 14, 2012 in The Intelligencer / Wheeling News-Register.
“Two Decades Later, Stream Work Lacking; 20 years since creek floods killed 24 people in Belmont County” by Jennifer Compston-Strough on June 14, 2012 in The Intelligencer / Wheeling News-Register.
“FEMA, local agencies map clean-up funds” (no by line) on August 6, 2012 in the Times Leader.
In conversation and as news stories report, there is a common faith that stream dredging will resolve flooding concerns. A similar faith underscores the belief that removal of woody material from stream channels will provide flood relief. In recent decades, the USGS has investigated the potential flooding relief dredging could provide in Wheeling Creek (Kolva and Koltun 1987, Koltun 1988, and Sherwood et al. 2008). These studies capitalized on a singular opportunity to ground truth the perception that deepening a stream and flanking its banks with the spoil will provide economical flood protection. Following floods in 1979, 1980, and 1981, the USGS began evaluating Wheeling Creek’s sediment transport capacity in 1982. Seven stream cross-section stations were identified and measured quarterly through 1984. The USGS concluded Wheeling Creek was not filling up, nor was it washing out, but instead, the stream bedload was stable (Kolva and Koltun 1987).
Despite that answer, in 1985 Ohio DNR-MRM money was leveraged to pay for Wheeling Creek dredging and the construction of numerous uncertified levees along its course. The USGS identified four dredged reaches in proximity to Lafferty, Crabapple, Maynard, and Crescent to study stream sedimentation. Appropriate benchmarks were established and 21 stations were routinely measured during a year and a half period commencing just before the dredging occurred. After excusing the initial period immediately following dredging when stream substrates reorganized and consolidated, stream cross sections changed less than a few inches at 19 of the 21 locations. Functionally, the stream bedload was stable (Koltun 1988).
Following floods in 2004, the need to clean and dredge Wheeling Creek to avoid future flooding damage was brought to the attention of USGS by the Ohio Emergency Management Agency which sought USGS guidance to characterize the potential flood relief that various dredging or levee scenarios might provide. The 21 stations established in 1985 were revisited in 2006 (Sherwood et al. 2008). The USGS concluded that the sediment load was stable and that Wheeling Creek was not filling with sediment. Therefore, dredging the stream to decrease flooding would not likely be successful. Likewise, removal of stream channel woody debris may facilitate flood flow through a culvert or under a few bridges, but these efforts cannot preserve inherently inadequate structures. In addition to determining if sediment loads were changing over time, the 2008 USGS study (Sherwood et al.) completed calculations pertinent to the requisite levee heights and dredging depths needed to protect Wheeling Creek communities from floods such as those experienced in 2004 and between 1981 and 1979. Unlike similar size catchments with lower gradients, it is pragmatically untenable to deepen Wheeling Creek sufficiently to contain its most concerning episodic floods. Beyond that, any proposal to physically remove stream substrates fails to account for the attendant loss of stream pollution filtration capacity and increased temporal instability. Dredging Wheeling Creek would degrade its water quality without preventing future flooding.
While the underlying geology of Wheeling Creek and other streams within Ohio’s Little Switzerland Plateau naturally results in flash flows and unpredictable floods, mining activities over time have contributed to poor water quality. Changing land use from barren strip mines to green pastures and

EAS/2013-02-04 Wheeling Creek Watershed 2010 01/16/2015
15
targeted remedial efforts to reduce mine related pollution are fundamental to the area wide water quality improvements and stream bedload stability. Concurrent with the 2010 survey of the Wheeling Creek basin, watershed surveys were completed in neighboring Short Creek and Cross Creek basins (Figure 9). These three watersheds along with other miscellaneous direct Ohio River tributaries are collectively known as the central Ohio River tributaries (CORT). The findings from the Short Creek and Cross Creeks surveys are detailed in separate reports (Ohio EPA 2014 and 2013, respectively). Comparisons between the watersheds are provided here to summarize the similarities and differences in water quality of these neighboring watersheds. The Wheeling Creek, Short Creek and Cross Creek watersheds have similar topography and geology. Historic and active mining is prevalent in all three watersheds; however, the Wheeling Creek watershed has been the most impacted by mining activity. Full attainment of aquatic life uses decreased in a southerly direction with 77.4% of sites in the Cross Creek study area, 41% of sites in the Short Creek study area and only 24% of sites in the Wheeling Creek basin fully meeting the assigned or recommended aquatic life use designations. The mainstems of Cross and Short creeks were each in full attainment of WWH expectations while Wheeling Creek had only one of eight sites meet WWH aquatic life use goals. The trend is illustrated by Figure 9 in the macroinvertebrate section, which displays the strong negative correlations between intolerant mayfly taxa richness (a surrogate for higher macroinvertebrate quality) and elevated TDS (associated with mine drainage) levels from each sample site. Intolerant mayflies are sensitive to TDS and were typically absent or rare in mine impacted streams. Wheeling Creek has not recovered to the extent of Short Creek and Cross Creek due to several factors relating to mining intensity and the drainage of mine impacted water. Wheeling Creek has had more intensive mining activity than the other watersheds and the mine drainage is prevalent throughout the watershed as most of the tributaries to Wheeling Creek have been mined. The regional variation in coal abundance is apparent at ODNR’s abandoned mine website (https://gis.ohiodnr.gov/website/dgs/mines/). Forty-six percent of the area drained by Wheeling Creek has been surface mined and 62% has been mined underground. Within the Short Creek basin, 33% has been strip mined and 30% had been subsurface mined. For the Cross Creek drainage, the values were 35% and 2%, respectively. Mining reclamation activities have resulted in significant water quality improvements within the Short Creek and Cross Creek basins. Remedial efforts have now been completed at most former strip mines in the Wheeling Creek basin. Pasture (32%) has replaced these previously barren areas (Sherwood et al. 2008, Kolva and Koltun 1987) and a forest canopy (46%) conceals the extent of underground mining in the area. Perceiving how this legacy affects current water quality is further informed by the basin characteristics within the Little Switzerland Plateau and by flood prevention efforts (Brockman 1998). These study area factors are unique in Ohio and are easily misconstrued as typical coal mining area conditions. RESULTS
Water Chemistry Surface water chemistry samples were collected from the Wheeling Creek study area from June 23, 2010 through October 18, 2010 at all 17 biological sampling locations (Figure 2, Table 1). Additional samples were collected monthly from three sentinel sites (Wheeling Creek at Lee Road downstream from Crabapple Creek, Wheeling Creek at Blaine (Pease Road) and Crabapple Creek at CR 10) from March 9, 2010 to April 18, 2011. Stations were established in free-flowing sections of the streams and were primarily collected from bridge crossings. Surface water samples were collected directly into appropriate containers, preserved and delivered to Ohio EPA’s Environmental Services

EAS/2013-02-04 Wheeling Creek Watershed 2010 01/16/2015
16
laboratory. Collected water was preserved using appropriate methods, as outlined in the Manual of Ohio EPA Surveillance Methods and Quality Assurance Practices (Ohio EPA 2009). USGS gage data from Short Creek near Dillonvale was used to show flow trends in the Wheeling Creek watershed from 2010-2011 (Figure 4). Dates when water samples and bacteria samples were collected in the study area are noted on the graph for this period. Flow conditions during the 2010 summer field season were typically lower than the historic median. Low flow conditions were recorded from July through November, 2010 with some rain events elevating flow above the historic median. Water samples captured a variety of flow conditions in the study area during the field season. Bacteria was collected during the 2010 recreation use season (May 1 through October 31) at seven locations in the watershed and was typically collected during low flows when recreation was likely to occur. Additional bacteria samples were collected in 2011 upstream and downstream from Barton. Surface water samples were analyzed for metals, nutrients, organics, bacteria, pH, temperature, conductivity, dissolved oxygen (D.O.), percent D.O. saturation, and suspended and dissolved solids (Appendix Tables 2, 4 and 5). Parameters with results exceeding the Ohio WQS criteria are reported in Table 4. Bacteriological samples were collected from seven locations in 2010 and five locations in 2011, and the results are reported in the Recreation Use section and Appendix Table 5. Datasonde® water quality recorders were placed at seven locations to monitor hourly levels of D.O., pH, temperature, and conductivity during two 48-hour periods (Appendix Table 4). Sediment samples were collected from seven stream locations (Appendix Table 6). WQS exceedances of the aquatic life use (ALU) criteria for TDS were documented throughout the mainstem of Wheeling Creek as well as in Steep Run, Fall Run, Crabapple Creek, Campbell Run and McCracken Run (Table 4). WQS exceedances of the AWS criteria for iron were also found throughout Wheeling Creek, Steep Run, Crabapple Creek and Campbell Run. In addition to TDS, most mine drainages had correspondingly elevated levels of manganese, sulfates and conductivity (Table 5). The four sites that attained biological standards, despite these elevated parameters, often demonstrated marginal biological performance reflecting lingering mine drainage influences. Nutrients were measured at each water sampling location, and included ammonia-N, nitrate+nitrite-N, total phosphorus, and total Kjeldahl nitrogen (TKN). Summary statistics for nutrients measured in the Wheeling Creek watershed are detailed in Table 6. Nutrient levels were low at all monitoring locations on Wheeling Creek except for an elevated total phosphorus measurement upstream from Crabapple Creek. Elevated ammonia was found in Campbell Run and both sites on Crabapple Creek. Town Run had the highest average nitrate+nitrite-N (5.371 ug/l) and the highest overall value in the watershed (10.1ug/l). The St. Clairsville sanitary WWTP, which discharges to Town Run, and the associated sanitary sewer collection system has had many problems related to wet weather and inflow and infiltration (I/I). Overflows, bypasses of treatment and discharges from manholes in the Wheeling Creek watershed (mostly Town Run) have occurred numerous times from December 2009 through December 2012.
1
10
100
1,000
Jan Apr Jul Oct Jan Apr
USGS Gage 03111500 Short Creek SR 150 near Dillonvale, OH
FlowChemistryBacteriaHistorical Median
Figure 4. Flows in a nearby watershed (ShortCreek) and sampling dates in theWheeling Creek and selected tributariessurvey, 2010-2011.
EAS/2013-02-04 Wheeling Creek Watershed 2010 01/16/2015
17
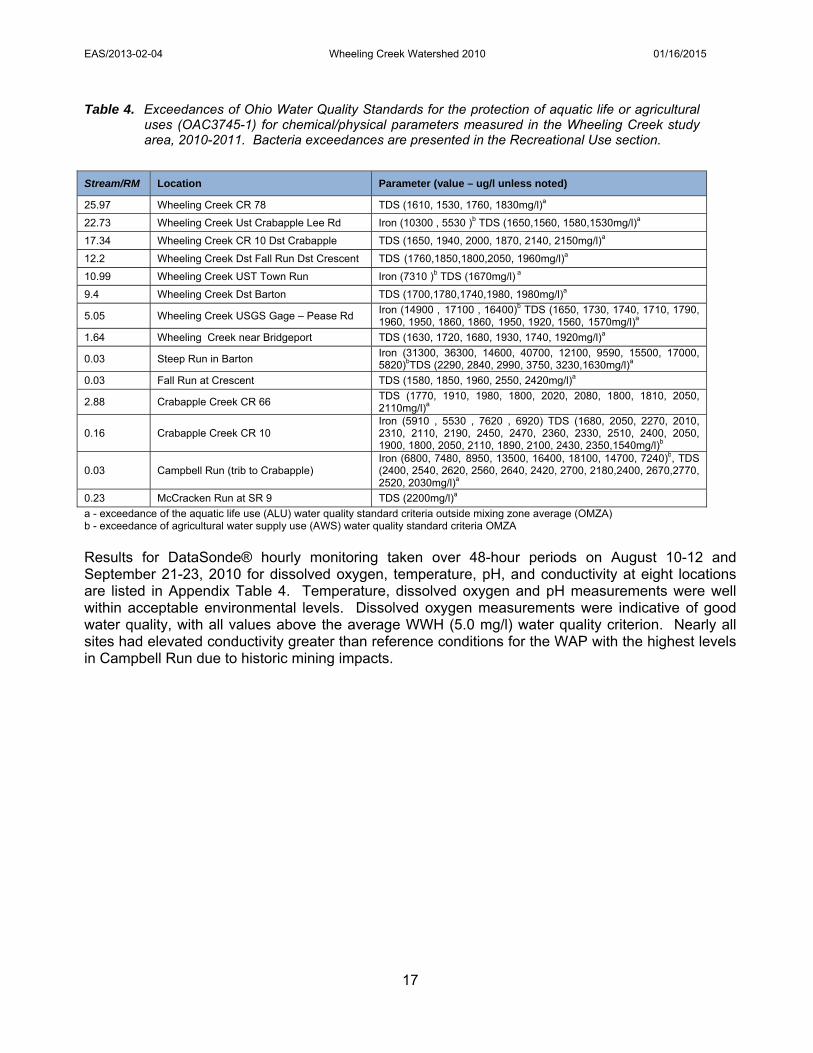
Table 4. Exceedances of Ohio Water Quality Standards for the protection of aquatic life or agricultural uses (OAC3745-1) for chemical/physical parameters measured in the Wheeling Creek study area, 2010-2011. Bacteria exceedances are presented in the Recreational Use section.
Stream/RM Location Parameter (value – ug/l unless noted)
25.97 Wheeling Creek CR 78 TDS (1610, 1530, 1760, 1830mg/l)a
22.73 Wheeling Creek Ust Crabapple Lee Rd Iron (10300 , 5530 )b TDS (1650,1560, 1580,1530mg/l)a
17.34 Wheeling Creek CR 10 Dst Crabapple TDS (1650, 1940, 2000, 1870, 2140, 2150mg/l)a
12.2 Wheeling Creek Dst Fall Run Dst Crescent TDS (1760,1850,1800,2050, 1960mg/l)a
10.99 Wheeling Creek UST Town Run Iron (7310 )b TDS (1670mg/l) a
9.4 Wheeling Creek Dst Barton TDS (1700,1780,1740,1980, 1980mg/l)a
5.05 Wheeling Creek USGS Gage – Pease Rd Iron (14900 , 17100 , 16400)b TDS (1650, 1730, 1740, 1710, 1790, 1960, 1950, 1860, 1860, 1950, 1920, 1560, 1570mg/l)a
1.64 Wheeling Creek near Bridgeport TDS (1630, 1720, 1680, 1930, 1740, 1920mg/l)a
0.03 Steep Run in Barton Iron (31300, 36300, 14600, 40700, 12100, 9590, 15500, 17000, 5820)bTDS (2290, 2840, 2990, 3750, 3230,1630mg/l)a
0.03 Fall Run at Crescent TDS (1580, 1850, 1960, 2550, 2420mg/l)a
2.88 Crabapple Creek CR 66 TDS (1770, 1910, 1980, 1800, 2020, 2080, 1800, 1810, 2050, 2110mg/l)a
0.16 Crabapple Creek CR 10 Iron (5910 , 5530 , 7620 , 6920) TDS (1680, 2050, 2270, 2010, 2310, 2110, 2190, 2450, 2470, 2360, 2330, 2510, 2400, 2050, 1900, 1800, 2050, 2110, 1890, 2100, 2430, 2350,1540mg/l)b
0.03 Campbell Run (trib to Crabapple) Iron (6800, 7480, 8950, 13500, 16400, 18100, 14700, 7240)b, TDS (2400, 2540, 2620, 2560, 2640, 2420, 2700, 2180,2400, 2670,2770, 2520, 2030mg/l)a
0.23 McCracken Run at SR 9 TDS (2200mg/l)a
a - exceedance of the aquatic life use (ALU) water quality standard criteria outside mixing zone average (OMZA) b - exceedance of agricultural water supply use (AWS) water quality standard criteria OMZA
Results for DataSonde® hourly monitoring taken over 48-hour periods on August 10-12 and September 21-23, 2010 for dissolved oxygen, temperature, pH, and conductivity at eight locations are listed in Appendix Table 4. Temperature, dissolved oxygen and pH measurements were well within acceptable environmental levels. Dissolved oxygen measurements were indicative of good water quality, with all values above the average WWH (5.0 mg/l) water quality criterion. Nearly all sites had elevated conductivity greater than reference conditions for the WAP with the highest levels in Campbell Run due to historic mining impacts.

EAS/2013-02-04 Wheeling Creek Watershed 2010 01/16/2015
18
Table 5. Summary statistics for select mine drainage inorganic water quality parameters sampled in the Wheeling Creek watershed, 2010-2011. The 90th percentile value for reference sites from the WAP ecoregion is shown for comparison. Values above reference conditions are shaded.
Iron Manganese Conductivity Chloride Sulfate Aluminum
Units µg/l µg/l umhos/cm mg/l mg/l µg/l
Stream River Mile Mean Mean Mean Mean Mean Mean
Wheeling Creek 27.90 195 112 1715 21 726 <200
Wheeling Creek 25.97 264 102 1986 17 887 <200
Wheeling Creek 22.73 1344 234 1587 26 695 609
Wheeling Creek 17.34 263 44 2330 19 986 <200
Wheeling Creek 12.2 161 21 2228 20 1063 <200
Wheeling Creek 10.99 1471 165 1733 17 814 661
Wheeling Creek 9.40 252 25 2166 23 1032 <200
Wheeling Creek 5.05 2347 170 1790 25 824 1009
Wheeling Creek 1.64 273 27 2114 28 1000 212
Crabapple Creek 2.88 905 308 2190 12 1054 314
Crabapple Creek 0.16 2785 251 2443 15 1239 344
Campbell Run 0.03 9019 262 2833 17 1494 765
McCracken Run 0.23 1010 194 2540 9 1330 <200
Pogue Run 0.11 62 16 1294 23 503 <200
Cox Run 0.03 159 22 1860 9 697 <200
Fall Run 0.03 167 96 2775 34 1252 <200
Town Run 0.28 1126 90 884 90 141 455
Steep Run 0.03 19151 515 2458 51 1236 3691 Reference Values: headwater/ wading
1266/ 1820 35/ 25 1019/ 791 88.2/ 55 259/ 242 750a

EAS/2013-02-04 Wheeling Creek Watershed 2010 01/16/2015
19
Nutrient Parameter WAP 90th %ile Value
Site Type Headwater (H)
(0‐20mi2) Wading (W) (>20‐200 mi2)
Ammonia‐N (mg/l) 0.060 0.060
Nitrate+Nitrite‐N (mg/l) 0.606 1.054
Phosphorus‐T (mg/l) 0.090 0.110
Table 6. Summary statistics for select nutrient water quality parameters sampled in the Wheeling Creek watershed 2010-2011. The 90th percentile values from reference sites in the Western Allegheny Plateau (WAP) ecoregion (Ohio EPA 1999) are shown for comparison. Values above reference conditions are shaded yellow.
Ammonia—N Nitrate+Nitrite-N Phosphorus-T
Stream River Mile
Mean Mean Mean
Wheeling Creek –H 27.90 0.052 0.100 0.017 Wheeling Creek -H 25.97 <0.050 0.100 0.012 Wheeling Creek –W 22.73 0.055 0.487 0.183 Wheeling Creek –W 17.34 <0.050 0.100 0.016 Wheeling Creek- W 12.2 <0.050 0.100 0.010 Wheeling Creek - W 10.99 0.052 0.264 0.027 Wheeling Creek - W 9.40 <0.050 0.178 0.012 Wheeling Creek - W 5.05 0.053 0.359 0.040 Wheeling Creek - W 1.64 <0.050 0.100 0.011 Crabapple Creek- W 2.88 0.073 0.118 0.018 Crabapple Creek- H 0.16 0.080 0.164 0.025 Campbell Run - H 0.03 0.119 0.198 0.013 McCracken Run - H 0.23 <0.050 0.120 0.011 Pogue Run - H 0.11 <0.050 0.406 0.015 Cox Run - H 0.03 <0.050 0.244 0.013 Fall Run - H 0.03 <0.050 0.135 0.013 Town Run - H 0.28 0.053 5.371 0.633 Steep Run - H 0.03 0.389 0.315 0.051

EAS/2013-02-04 Wheeling Creek Watershed 2010 01/16/2015
20
Recreation Use
Water quality criteria for determining attainment of recreation uses are established in the Ohio Water Quality Standards (Table 7-13 in OAC 3745-1-07) based upon the presence or absence of bacteria indicators (Escherichia coli) in the water column.
Escherichia coli (E. coli) bacteria are microscopic organisms that are present in large numbers in the feces and intestinal tracts of humans and other warm-blooded animals. E. coli typically comprises approximately 97 percent of the organisms found in the fecal coliform bacteria of human feces (Dufour, 1977), but there is currently no simple way to differentiate between human and animal sources of coliform bacteria in surface waters, although methodologies for this type of analysis are becoming more practicable. These microorganisms can enter water bodies where there is a direct discharge of human and animal wastes, or may enter water bodies along with runoff from soils where these wastes have been deposited.
Pathogenic (disease causing) organisms are typically present in the environment in such small amounts that it is impractical to monitor them directly. Fecal indicator bacteria by themselves, including E. coli, are usually not pathogenic. However, some strains of E. coli can be pathogenic, capable of causing serious illness. Although not necessarily agents of disease, fecal indicator bacteria such as E. coli may indicate the potential presence of pathogenic organisms that enter the environment through the same pathways. When E. coli are present in high numbers in a water sample, it invariably means that the water has received fecal matter from one source or another. Swimming or other recreational-based contact with water having a high fecal coliform or E. coli count may result in ear, nose, and throat infections, as well as stomach upsets, skin rashes, and diarrhea. Young children, the elderly, and those with depressed immune systems are most susceptible to infection.
The streams of the Wheeling Creek watershed evaluated in this survey are designated with the Primary Contact Recreation (PCR) use in OAC Rule 3745-1-24. Water bodies with a designated recreational use of PCR “...are waters that, during the recreation season, are suitable for one or more full-body contact recreation activities such as, but not limited to, wading, swimming, boating, water skiing, canoeing, kayaking and SCUBA diving” [OAC 3745-1-07 (B)(4)(b)]. There are three classes of PCR use to reflect differences in the potential frequency and intensity of use. Streams designated PCR Class A typically have identified public access points and support primary contact recreation. Streams designated PCR Class B support, or potentially support, occasional primary contact recreation activities. The streams evaluated for the Wheeling Creek survey area are all designated Class B PCR waters. The E. coli criteria that apply to PCR class B streams include a geometric mean of 161 cfu/100 ml, and a maximum value of 523 cfu/100 ml. The geometric mean is based on two or more samples and is used as the basis for determining attainment status when more than one sample is collected.
Summarized bacteria results from the Wheeling Creek watershed are listed in Table 7, and the complete dataset is reported in Appendix Table 5. Seven locations in Wheeling Creek, Crabapple Creek and Steep Run were sampled for E. coli two to eleven times, from May 25th to October 19th, 2010. Targeted sampling also occurred around the unsewered area of Barton at five locations on Wheeling Creek and Steep Run; samples were collected five times in September 2011. Evaluation of E. coli results revealed none of the sites in the Wheeling Creek watershed met the applicable geometric mean PCR Class B criterion. The majority of sampling locations in the Wheeling Creek watershed are in areas without centralized sewage treatment. The non-attainment is most likely due to unsanitary conditions from poorly treated sanitary waste. The highest geometric values were found in Steep Run in both 2010 and 2011 which flows through the unsewered community of Barton. Agricultural activities in the

EAS/2013-02-04 Wheeling Creek Watershed 2010 01/16/2015
21
watershed are somewhat sparse but it is possible that poor manure management or concentrated animal feedlots are also causing unsanitary conditions in the Wheeling Creek watershed. Table 7. A summary of E. coli data for locations sampled in the Wheeling Creek watershed from May 25
through October 19, 2010 and September 1 to September 27, 2011. Recreation use attainment is based on comparing the geometric mean to the Primary Contact Recreation (PCR) Class B geometric mean water quality criterion of 161 cfu/100 ml (Ohio Administrative Code 3745-1-07). All values are expressed in colony forming units (cfu) per 100 ml of water. Gray shaded values exceed the applicable PCR Class B geometric mean criterion or the single sample maximum.
HUC-12 Location River Mile
Maximum Value
Geometric Mean
# of Samples
2010 Recreation season
050301060302 Wheeling Creek ust. Crabapple Ck TR 337 Lee Rd. 24.87 5800 478 11
050301060303 Wheeling Creek near Barton ust. Town Run 10.99 3000 271 7
050301060304 Wheeling Creek at Barton @ CO. RD. 4 10.50 320 247 2
050301060304 Wheeling Creek at Blaine @ Pease Road 5.05 1800 207 11
050301060301 Crabapple Creek SW of Fairport @ CR 10 0.16 520 241 10
050301060304 Steep Run at Barton @ CR 10 0.10 3900 1082 2
050301060304 Steep Run at Barton @ mouth 0.03 6500 1111 2
2011 Recreation season
050301060303 Wheeling Creek near Barton ust Town Run 10.99 8800 620 5
050301060304 Wheeling Creek at Barton @ CR 4 10.50 8000 588 5
050301060304 Steep Run at Colerain-Barton Rd 0.98 2400 424 5
050301060304 Steep Run at Barton @ CR 10 0.10 20000 1597 5
050301060304 Steep Run at Barton @ mouth 0.03 7600 1541 5

EAS/2013-02-04 Wheeling Creek Watershed 2010 01/16/2015
22
Point Source Impacts (NPDES, storm water, mining, combined sewer overflows)
The Wheeling Creek watershed has a total of five individual NPDES permitted facilities that discharge wastewater from sanitary wastewater plants and an industrial groundwater remediation treatment system. The sanitary wastewater is from four publically owned wastewater treatment plants serving area communities. Near the mouth of Wheeling Creek are seven CSOs in the village of Bridgeport, one SSO in the village of Brookside, and one SSO west of Brookside in Belmont County and all are associated with the Eastern Ohio Regional Wastewater Authority (EORWA). NPDES effluent summary results from 2006-2012 for all the facilities that discharge to the Wheeling Creek watershed can be found in Appendix Table 3. Mining in the area began in the early 1800s and has continued until the present (Crowell, 1995). Abandoned underground mines are found throughout the Wheeling Creek basin (Figure 5). Abandoned surface mines are common as well. From 1971 thru 2011, there have been at least 32 different coal companies mining in the study area. There are 15 active NPDES permitted facilities in the study area for wastewater and storm water from surface coal mining activities covered under the General NPDES permit. These general permitted surface coal mines must control storm water and monitor for mining related contaminants.
Figure 5. Active NPDES permitted facilities and previous and active coal mining in the Wheeling Creek watershed.
EAS/2013-02-04 Wheeling Creek Watershed 2010 01/16/2015
23
Gould Electronics, Inc./Gould Bridgeport Facility (Ohio EPA Permit # 0IN00250; outfall 001) The Gould Electronics, Inc./Gould Bridgeport Facility is located at 1700 Coupling Road, Lansing, Belmont County. The facility is a groundwater remediation operation that is composed of an extraction well, air stripper, carbon adsorption unit and a design discharge of approximately 69,000 gallons per day (GPD) to Wheeling Creek at RM 4.4. The organics; 1,2-cis-dichloroethene, vinyl chloride and trichloroethylene are monitored monthly. No detection has been made of these parameters thru the review period of January 2006 through December 2012. The 50th percentile flow rate for this period was 26,900 GPD. City of St. Clairsville Wastewater Treatment Plant (Ohio EPA Permit # 0PC00014; outfall 001) The city of St. Clairsville WWTP is located at 100 Lexington Road, St. Clairsville, Belmont County. The WWTP is a secondary treatment facility consisting of a bar screen and grit removal, primary clarification, ten rotating biological contactors, final clarification and disinfection. The plant has sludge handling facilities and two equalization tanks. The collection system is 100% separate and serves over 5,000 people. The WWTP is designed to treat 0.95 million gallons per day (MGD) and discharges to Town Run at RM 3.05 (the headwater of Town Run). The St. Clairsville WWTP had nine ammonia NPDES permit limit violations from January 2006 through December 2012. The WWTP has had numerous influent flows exceeding the design flow for the review period including 104 days exceeding in 2011. The St. Clairsville WWTP and sanitary sewer system has had many problems related to wet weather and I/I. Overflows, bypasses of treatment and discharges from manholes in the Wheeling Creek watershed (mostly Town Run) have occurred numerous times from December 2009 through December 2012. In December 2009, plant bypasses and overflows discharged an estimated 120,000 gallons of improperly treated wastewater. In the last quarter of 2010, an estimated 125,000 gallons were discharged. In 2011, an estimated 1.99 million gallons were discharged and in 2012, an estimated 150,000 gallons were discharged. St. Clairsville is on the drainage divide between Wheeling Creek and McMahon Creek. Many more overflows occurred to the McMahon Creek watershed than to Wheeling Creek. Belmont County Commissioners – Pennwood Estates Subdivision STP (Sewage Treatment Plant) (Ohio EPA Permit # 0PH00012; outfall 001) The Pennwood Estates STP is part of the Belmont County Sewer District and is located at County Road 4, St. Clairsville, Belmont County. The WWTP consists of primary treatment, activated sludge extended aeration, clarification, sand filters and disinfection. The plant has sludge handling facilities and flow equalization. The collection system is 100% separate and serves over 530 people. The WWTP is designed to treat 75,000 GPD and discharges to the headwaters of McMonies Run at RM 1.95. The Penn Estates Subdivision STP had 32 ammonia NPDES permit limit violations from January 2006 through December 2012. Belmont County Commissioners – Fox Shannon WWTP (Ohio EPA Permit # 0PG00063; outfall 001) The Fox Shannon WWTP is part of the Belmont County Sewer District and is located at 68750 Hammond Road, St. Clairsville, Belmont County. The WWTP consists of primary treatment, activated sludge extended aeration - two oxidation ditches, fixed media filtration, secondary clarification, disinfection and final effluent pumping. The plant has sludge handling facilities and flow equalization. The collection system is 100% separate and serves a population of over 12,000. Wastewater sources to the WWTP include one trailer park, three schools, three correctional facilities, county buildings and the seasonal Jamboree in the Hills music festival. The WWTP is designed to treat 750,000 GPD and discharges to the headwaters of an unnamed tributary to Wheeling Creek at

EAS/2013-02-04 Wheeling Creek Watershed 2010 01/16/2015
24
RM 4.2. The Fox Shannon WWTP had one dissolved oxygen and 14 ammonia NPDES permit limit violations from January 2006 through December 2012. Village of Flushing WWTP (Ohio EPA Permit # 0PB00013; outfall 001) The Flushing WWTP is located at 1197 Mill Road, Flushing, Belmont County. The WWTP consists of primary treatment, activated sludge extended aeration– two oxidation ditches, clarification and disinfection. The collection system is 100% separate and serves over 920 people. The WWTP is designed to treat 200,000 GPD and discharges to an unnamed tributary of Wheeling Creek at RM 0.55 (the tributary enters the headwater of Wheeling Creek at RM 30.2). The Flushing WWTP had 13 ammonia and 12 total suspended solids NPDES permit limit violations from January 2006 through December 2012. Eastern Ohio Regional Wastewater Authority – WWTP (Ohio EPA Permit # 0PQ00000; outfalls 035, 036, 039, 040, 041, 043, 051) Eastern Ohio Regional Wastewater Authority’s (EORWA) WWTP is located at 6000 North Guernsey Street, Bellaire, Belmont County. EORWA serves numerous Ohio River communities including the villages of Brookside and Bridgeport, both within the Wheeling Creek watershed. Each political entity that is within the service area of the EORWA WWTP is responsible for the operation and maintenance of their sewer collection system. EORWA is responsible for the outfalls which are all located in Bridgeport (Figure 6). The outfalls are CSOs which are sanitary and storm sewers combined into one sewer pipe. When it rains, the sewer exceeds its transport capacity thus overflowing untreated wastewater and storm water through a relief structure into a stream. The villages of Brookside and Bridgeport own and operate their respective collection systems and are therefore responsible for the flows within the sewer. Brookside has one SSO in its separated collection system and Belmont County has one SSO at the Boydsville pump station which then flows to Brookside’s collection system. The SSOs are not listed in the NPDES permit and are to be eliminated by June 2016. EORWA submitted a CSO Long Term Control Plan (LTCP) to Ohio EPA (received in July 2008; final revisions received June 25, 2010) as required by the NPDES permit. The LTCP was approved by Ohio EPA on June 21, 2011. The plan consists of a series of controls, including plugging overflows, raising weirs, installing backflow preventers, downspout disconnection, storm water redirection, local storage, rerouting of industrial discharges and construction of relief sewers to address the various sewersheds within its service area and bring their overflows into compliance with the National CSO Policy. The objective of the LTCP is to eliminate discharges where possible or to maximize flow to the WWTP. The LTCP has a schedule for CSO structures 035, 039, 040 and 051 to be evaluated so the regulator or diversion structures are configured to send more wastewater to the interceptor sewer before discharging. Beginning June 1, 2012 EORWA is to submit an annual CSO report summarizing all CSO discharges and control activities completed the previous year. The LTCP requires EORWA to reduce CSO discharges or eliminate CSOs completely. On March 12, 2012, EORWA submitted the first Sanitary Sewer Overflow Annual Report for 2011. The report states that, in July 2012, CSOs 031 and 032 were eliminated and on October 21, 2010, CSO 038 was eliminated (Figure 6). The report also states that the village of Brookside’s SSO discharged 1.4 MGD of raw sewage from the diversion manhole 304 and Belmont County SSO at Boydsville pump station discharged 0.46 MGD. Ohio EPA is currently negotiating with the five political subdivisions that are within the service area of EORWA including Brookside, Bridgeport and Belmont County. The resulting negotiations will be for Ohio EPA to issue Director’s Final Findings and Orders (DFF&Os) to each political subdivision requiring compliance and implementation of all terms and conditions of the EORWA NPDES permit including the LTCP.

EAS/2013-02-04 Wheeling Creek Watershed 2010 01/16/2015
25
Figure 6. Combined sewer overflow and sanitary sewer overflow discharge locations along Wheeling Creek.

EAS/2013-02-04 Wheeling Creek Watershed 2010 01/16/2015
26
Sediment
Surficial sediment samples were collected at six locations in Wheeling Creek, Crabapple Creek, Campbell Run, Steep Run and Fall Run by the Ohio EPA on August 3 and 4, 2010. Sampling locations were co-located with biological sampling sites. Samples were analyzed for total analyte list inorganics (metals) and total phosphorus. Specific chemical parameters tested and results are listed in Appendix Table 6. Sediment data were evaluated using Ohio Sediment Reference Values (Ohio EPA 2008a), along with guidelines established in Development and Evaluation of Consensus-Based Sediment Quality Guidelines for Freshwater Ecosystems (MacDonald et al. 2000) and the Persaud et al. 1993 phosphorus guidelines (Lowest Effect Level (LEL) = 600 mg/kg, and Severe Effect Level (SEL) = 2000 mg/kg). The consensus-based sediment guidelines define two levels of ecotoxic effects. A Threshold Effect Concentration (TEC) is a level of sediment chemical quality below which harmful effects are unlikely to be observed. A Probable Effect Concentration (PEC) indicates a level above which harmful effects are likely to be observed. Sediment samples were conservatively sampled by focusing on depositional areas of fine grain material (silts and clays). These areas typically are represented by higher contaminant levels, compared to coarse sands and gravels. Coarse sands were the predominant substrate type at all the sites with the exception of the lower site on Wheeling Creek at Pease Road (RM 5.05) which was predominated by coarse and fine grained silt. In areas with coarse substrates, it’s likely that the biological community is not significantly impacted by contaminants in the sediment. However, in some streams heavily impacted by mine drainage, such as Steep Run and Campbell Run (Figure 7), orange stained water and substrates are likely having a negative impact on the biology. The Wheeling Creek watershed has been extensively mined and still receives mine drainage throughout the watershed. As a result, elevated levels of arsenic, calcium, strontium and nickel were found at all six sediment sites (Table 8). Phosphorus was also elevated above the LEL levels at all sites except Campbell Run. The two Wheeling Creek sites had arsenic, zinc and nickel above the TEC level and calcium and strontium above the SRV levels. Additionally cadmium and copper above the TEC levels were found at the lower site on Wheeling Creek at Pease Road (RM 5.05) near Blain. The highest sediment metal levels were found in Steep Run which is a heavily mined subwatershed in Wheeling Creek that flows through the community of Barton. Steep Run had nickel and zinc levels significantly above the PEC levels which suggest toxic sediment levels as well as arsenic, iron, strontium, calcium and manganese above the SRV levels and copper and cadmium above the TEC values. Steep Run receives mine drainage from several underground abandoned mines and is often discolored orange indicating a large amount of iron and other metals in the water column that are being deposited in the sediment. The iron values found in the sediment of Steep Run were 300,000 mg/kg which correlates with the numerous water quality exceedances found in Steep Run (Table 4) and the poor biological community. Campbell Run had elevated iron, zinc, strontium and calcium above the SRV levels and nickel and arsenic above the TEC. Similar to Steep Run, Campbell Run is discolored orange and receives a large amount of mine drainage (Figure 7). A very poor macro-invertebrate community was found in Campbell Run along with numerous water quality exceedances of
Figure 7. Campbell Run with orange stained water from mine drainage.

EAS/2013-02-04 Wheeling Creek Watershed 2010 01/16/2015
27
TDS and iron. Crabapple Creek located just below Campbell Run had arsenic, cadmium, manganese, iron, zinc, strontium and calcium above the SRV levels and nickel above the TEC level. Crabapple Creek is also impacted from upstream surface and underground mine drainage that occurs in the headwaters of Wheeling Creek. Fall Run is a direct tributary to Wheeling Creek in the village of Crescent that also receives mine drainage discharges. However, several reclamation projects by ODNR-MRM in the Fall Run subwatershed have resulted in a significant improvement to water quality. There were still TDS exceedances but the biological community was fully meeting the WWH biological criteria. Sediment samples from Fall Run had arsenic, lead, and nickel values above the TEC and manganese, strontium and calcium above the SRV but these did not seem to have a significant impact on the biological community.
Contamination levels were determined for parameters using Ohio Sediment Reference Values (SRVs) and consensus-based sediment quality guidelines (MacDonald, et al. 2000). Shaded numbers indicate values above the following: SRVs (blue0, Threshold Effect Concentration – TEC (yellow), Probable Effect Concentration – PEC (red) and phosphorus LELs (orange). Sampling locations are indicated by river mile (RM). Samples with ND are not detected at or above the method detection limit. All samples units are mg/kg.
Table 8. Chemical parameters measured above screening levels in samples collected by Ohio EPA from surficial sediments in the Wheeling Creek watershed, 2010.
Parameter
Wheeling Cr upstream Crabapple RM 22.7
Wheeling Creek at Pease Rd RM 5.05
Crabapple Cr Fairport CR 10
RM 0.16
Campbell Run at mouth RM 0.36
Fall Run at Crescent
near mouth RM 0.03
Steep Run Barton near
mouth RM 0.03
Aluminum 13000 13500 10800 10900 10900 45400
Ammonia 77 110 110 120 21 200
Arsenic 13.6 14.4 20.1 17.2 18.3 28.6
Barium 168 147 126 109 129 148
Cadmium 0.769 1.03 0.822 0.744 0.696 1.89
Calcium 46900 54300 122000 67400 84800 41800
Chromium 15.5 17.4 14.3 12.8 13.4 10.7
Copper 26.2 34.2 24.2 19.1 23.2 51.8
Iron 34300 40700 78400 94200 46200 300000
Lead 23.2 30.2 24.6 13.1 39.7 14.5
Magnesium 6760 6940 6530 3330 19500 ND
Manganese 1940 1120 3530 2340 1500 4080
Nickel 28.4 36 41.8 42.2 25.3 252
Phosphorus 1460 956 670 522 788 1910
Potassium 2520 2230 1240 ND 2000 ND
Selenium ND ND ND ND ND ND
Sodium ND ND 3105 ND ND ND
Strontium 284 323 815 537 409 556
Zinc 141 162 182 171 89.4 975

EAS/2013-02-04 Wheeling Creek Watershed 2010 01/16/2015
28
Fish Tissue
Ohio’s Fish Consumption Advisory program (FCA) was reorganized in 1993 as a cooperative effort amongst the Ohio Department of Health (ODH), Ohio DNR, and Ohio EPA. This multi-agency approach has produced a broad consistent fish tissue contaminant database from all of the State’s waters. Concurrently, the Great Lakes Governors Association, US EPA, and Ohio’s FCA have improved data evaluation and risk communication. The Ohio FCA website provides further information: http://www.epa.state.oh.us/dsw/fishadvisory/index.aspx. Fish tissue in six samples comprised by 15 fish either singularly or combined was collected from the study area in 2009. Table 9 summarizes the concentrations of detected metals from these fish and Table 10 lists the detected organic compounds. Results for other typical tissue parameters not presented in these tables were less than the method detection limits. These analytes, specific FCA guidance, and contaminant thresholds are discussed in: State of Ohio Cooperative Fish Tissue Monitoring Program Sport Fish Tissue Consumption Advisory Program (2010, http://www.epa.state.oh.us/portals/35/fishadvisory/FishAdvisoryProcedure.pdf). The ubiquitous presence of mercury has resulted in a statewide recommendation to monitor fish consumption based on location and species specific risk. Broadly, it’s prudent to eat most fish about 52 times annually (once a week). While yellow perch, crappie and sunfish may be consumed more often, the mercury contamination in other species could exceed the amount most people would normally metabolize and eliminate. In places where the amount of species specific mercury contamination is excessive, advisories are issued to limit consumption accordingly. Thus, a monthly advisory suggests certain fish from a specific water body should be eaten less frequently than the weekly recommendation would suggest. Smallmouth bass from Wheeling Creek were determined to have higher mercury concentrations than appropriate for weekly meals. Limiting consumption of smallmouth bass to about 12 times annually is recommended. In addition to consumption advisories, fish tissue data supports assessment of the non-drinking water human health use. “Section E: Evaluating Beneficial Use: Human Health (Fish Contaminants)” of the 2012 Ohio EPA Integrated Report (http://epa.ohio.gov/portals/35/tmdl/2012IntReport/IR12SectionEfinal.pdf) explains the rationale used to characterize this attainment status based on the USGS 12 digit Hydrologic Unit Code (HUC 12) delineations. Table 11 includes the calculation procedure that determined one of the four study area HUC 12 assessment units is impaired due to PCB contamination based on new data collected in 2009. The same calculation for mercury is shown to illustrate the difference between this beneficial use expectation and that of the FCA procedure. During the 2009 study, insufficient or no data were collected from the other three Wheeling Creek HUC 12 watersheds although each still retains an impaired status based on historical data. Polychlorinated biphenyls (PCBs) have been illegal to manufacture in the U.S. since 1979 and worldwide since 2001. The persistence of these carcinogens in the environment challenges contemporary source location. The frequent detection of PCBs in study area fish tissue reflects the region’s industrial heritage and calls for vigilance in the proper disposal of these toxins.

EAS/2013-02-04 Wheeling Creek Watershed 2010 01/16/2015
29
Table 9. Metals concentrations (mg/kg) in fish tissue samples collected from Wheeling Creek, 2009. Values
preceded by a less than sign (<) indicate results were below the method detection limit. Comparative values under each analyte are Ohio adopted triggers. Bold values exceed the unrestricted consumption risk trigger (biweekly for mercury), bold italicized values exceed the weekly consumption risk trigger. Yellow and red highlighted mean values support respective consumption advisories. The sample type is skin off fillet composite (SFFC)
Species Arsenic Cadmium Lead Mercury Selenium
n/type Year RM Location 0.150/ 0.656
0.500/ 2.188
0.086/ 0.375
0.110/ 0.220
2.500/ 10.938
Carp 3/SFFC 2009 15.0 CR 10 <0.099 0.0064 <0.040 0.110 0.719 Yellow bullhead 2/SFFC 2009 15.0 CR 10 <0.099 <0.0040 <0.040 0.130 0.250 Rock Bass 3/SFFC 2009 5.7 US 40 <0.100 <0.0040 0.126 0.191 0.600 Smallmouth bass 3/SFFC 2009 15.0 CR 10 <0.098 <0.0039 <0.039 0.270 0.469 2/SFFC 2009 14.0 Maynard Rd. <0.100 <0.0040 <0.040 0.267 0.695 2/SFFC 2009 5.7 US 40 0.101 <0.0039 0.053 0.188 0.626
Mean values 0.067 -- 0.031 0.242 0.597 Table 10. Organic compounds (mg/kg) in fish tissue samples collected from Wheeling Creek, 2009. Values
preceded by a less than sign (<) indicate results were below the method detection limit. Comparative values under each analyte are Ohio adopted recommendations. Bold values exceed the unrestricted consumption risk trigger, bold italicized values exceed the weekly consumption risk trigger. Yellow and red highlighted mean values support respective consumption advisories. The sample type is skin off fillet composite (SFFC)
Species PCB Aroclors Total PCBs Total DDT
n/type Year RM Location 1254 1260 0.050/ 0.220
0.500/ 2.188
Carp 3/SFFC 2009 15.0 CR 10 0.082 0.087 0.170 <0.010 Yellow bullhead 2/SFFC 2009 15.0 CR 10 <0.050 <0.050 -- <0.010 Rock Bass 3/SFFC 2009 5.7 US 40 <0.050 <0.050 -- <0.010 Smallmouth bass 3/SFFC 2009 15.0 CR 10 <0.050 <0.050 -- <0.010 2/SFFC 2009 14.0 Maynard Rd. <0.050 <0.050 -- <0.010 2/SFFC 2009 5.7 US 40 <0.050 <0.050 -- <0.010

EAS/2013-02-04 Wheeling Creek Watershed 2010 01/16/2015
30
Table 11. Non-drinking water human health use attainment status based on fish tissue samples collected from the Cox Run Wheeling Creek HUC12 watershed (05030106 0303), 2009. Bold values (mg/kg) in the heading are parameter specific criterion. Red bold highlighted values violate the criteria and signify impairment. Values preceded by a less than sign (<) indicate results were below the method detection limit. The sample type is skin off fillet composite (SFFC).
Species Trophic Level Mercury Total PCBs
n/type Year RM Location 1.0 0.054
Carp 3 3/SFFC 2009 15.0 CR 10 0.110 0.170 Yellow bullhead 3 2/SFFC 2009 15.0 CR 10 0.130 0.050 Smallmouth bass 4 3/SFFC 2009 15.0 CR 10 0.270
0.050
2/SFFC 2009 14.0 Maynard Rd. 0.267 Geometric mean 0.268
Mean 3 value (11.8) 0.120 1.416 0.110 1.298 Mean 4 value (5.7) 0.268 1.528 0.050 0.285
Sum 2.944 1.583 Divided by /17.5 0.168 0.090

EAS/2013-02-04 Wheeling Creek Watershed 2010 01/16/2015
31
Stream Physical Habitat Stream habitat conditions were assessed at 17 fish sampling sites in the Wheeling Creek basin in 2010 (Appendix Table 7). Based on the functional ability to support fish, each site’s substrate, instream cover, and channel characteristics were graded and composited using the Qualitative Habitat Evaluation Index (QHEI). While QHEI scores range between 0 and 100, scores above 60 are typical of good habitat conditions associated with WWH aquatic communities. QHEI scores less than 45 are consistent with poor habitat conditions associated with the MWH aquatic life use, while QHEI values above 75 are typical of excellent habitat conditions correlated with an EWH aquatic life use and potential to support exceptional biological communities. QHEI scores are most meaningful when considered in aggregate groups. For instance, an average of several QHEI scores from a river reach or the trend among many small streams in close proximity is more informative than relying on any single location QHEI score. It is unlikely for any site with particularly good or poor habitat to exert the same extreme influences on its resident aquatic community. Instead, aquatic assemblages at unique habitat locations tend to reflect the wider ambient condition. Good habitat conditions were found in Wheeling Creek and habitat in most of the tributaries ranged from good to excellent with the exception of McCracken Run which had fair habitat and Steep Run which had poor habitat (Table 12). The few sites where habitat was subpar were impacted by historic or active coal mining. Otherwise, habitat conditions were sufficient to support aquatic communities representative of or exceeding WWH expectations throughout the study area. Wheeling Creek had good habitat conditions (QHEI x̄=63, n=8) with high gradients, a wide array of substrates, deep pools, well defined riffles, and good availability of several cover types. These frequently encountered features and the comparable QHEI scores suggest any differences in aquatic community performance between sites are unlikely to be attributed solely to habitat factors. Several sites in the lower section of Wheeling Creek had excellent habitat with bedrock slabs and excellent channel development (Figure 8). A critical habitat type of the state endangered eastern hellbender salamander is bedrock slabs similar to those found in the lower section of Wheeling Creek. Other direct Ohio River tributaries in Mahoning, Columbiana, Jefferson, Belmont and Monroe counties have these habitat features and still have populations of eastern hellbenders. Water quality impacts and sedimentation to Wheeling Creek from active and historic mining have most likely resulted in the extirpation of eastern hellbender populations from Wheeling Creek but with continued reclamation and natural attenuation, it’s possible that eastern hellbenders would be able to repopulate Wheeling Creek. Mine runoff and associated sedimentation were evident at some locations within the Wheeling Creek basin. Steep Run (QHEI =30.5) and McCracken Run (QHEI =54.0) had an abundance of silty fine iron stained substrates. Campbell Run had excellent habitat but had evidence of mine drainage with
Figure 8. Wheeling Creek at Pease Road (RM 5.05) at Blain

EAS/2013-02-04 Wheeling Creek Watershed 2010 01/16/2015
32
iron stained substrates noted. In 2012, a new source of mine drainage began discharging iron laden water into Campbell Run which caused heavy deposits of iron in the substrates and further downstream in Crabapple Creek at RM 0.16 (Figure 7). Table 12. Stream physical habitat quality as scored by the Qualitative Habitat Evaluation Index(QHEI) at sites
in the Wheeling Creek watershed, 2010.
Stream River Mile
Drainage area (mi2)
Location QHEI Comments
Wheeling Creek 27.9 4.4 CR 72 (Mt Hope Road) 60.3 Sand and gravel substrates
Wheeling Creek 25.97 13.5 CR 78 (National Oco Road) 65.5 Sparse cover
Wheeling Creek 22.73 24.0 TR 337 (Lee Rd) ust.Crabapple Creek 81.3 Cobble and gravel substrates with boulders present
Wheeling Creek 17.34 59.6 CR 10 (Fairport - Maynard Rd) 88.3 Nice mix of substrate with evidence of some excessive sand bed-load .
Wheeling Creek 10.99 82.0 Crescent-Barton Road (ust. Town Run) 78.5 Cobble and gravel substrates
Wheeling Creek 9.40 86.0 CR 10 (Barton -Blaine Road) 70.5 Gravel substrates moderately embedded
Wheeling Creek 5.05 97.6 Blaine (Pease Road) 84.0 Bedrock slab, extensive cover, excellent pool, riffle, run development
Wheeling Creek 1.64 104.0 CR 24 (Boydsville Road) Bridgeport 67.0 Cobble and gravel substrates, embedded substrates, channel straightened
Crabapple Creek 2.88 10.2 CR 66 (Uniontown - New Athens Road) 59.5 Sand and silt substrates with poor development and sparse cover
Crabapple Creek 0.16 19.6 CR 10 (Crabapple Road) 67.8 Cobble and gravel substrates but iron stained with extensive siltation
Campbell Run 0.03 7.3 @ mouth from abandoned TR 414 70.8 Iron stained substrates, heavy sand bed-load
McCracken Run 0.23 4.7 Near mouth at SR 9 54.0 Iron stained sandy substrates
Pogue Run 0.11 5.3 CR 10 (Fairport-Maynard Road) 81.0 Cobble and gravel substrates with deep pools
Cox Run 0.03 7.3 TR 432 (Stonehouse – Purseglove ) 61.5 Cobble and gravel substrates, moderately embedded.
Fall Run 0.03 3.8 CR 10/CR5 near Crescent 65.3 Sand and gravel substrates, sparse cover
Town Run 0.28 2.4 TR 434 (Hells Kitchen Road) 58.8 Bedrock stream with many boulders; covered in fine layers of silt and brown algae.
Steep Run 0.03 2.3 Dst. CR 10 at RR bridge 30.5 Iron flocculent, sewage fungus and algae present, near absent cover, channel modified
General narrative ranges assigned to QHEI scores.
Narrative Rating
QHEI Range
Headwaters (<20 mi2) Larger Streams
Excellent >70 >75
Good 55 to 69 60 to 74
Fair 43 to 54 45 to 59
Poor 30 to 42 30 to 44
EAS/2013-02-04 Wheeling Creek Watershed 2010 01/16/2015
33
Fish Community A total of 12,633 fish representing 38 species and one hybrid were collected from the Wheeling Creek watershed study area between June and September, 2010. Relative numbers and species collected per location are presented in Appendix Table 8 and IBI and MIwb scores are presented in Appendix Table 9. Sampling locations were evaluated using WWH or MWH biocriteria. Three of the eight sites (37.5%) on Wheeling Creek met the recommended WWH fish biocriteria. In 2010, the average IBI and MIwb scores for the eight mainstem Wheeling Creek sites were 39 and 8.2, respectively (Table 13). IBI scores have steadily improved from 1985 (average of 25), 1991 (average of 27) and 2002 (average of 39). The average MIwb score in 2002 was 6.2 (fair) but significantly improved into the marginally good range of 8.2 in 2010. While the mainstem is not fully meeting the WWH biocriteria, there is a trend of improved water quality indicating that further attenuation and mining reclamation projects will eventually lead to full recovery (Table 14). Two sensitive species of darters (bluebreast and Tippecanoe darters) were found at the mouth of Wheeling Creek further indicating the potential for recovery of the mainstem of this heavily mined watershed. The capture of the former northerly flowing Steubenville and Pittsburgh River basins by the new post glacial Ohio River has had long lasting effects on the hydrology of the CORT basins. From a biological perspective, these changes facilitated the introduction of new species to each drainage system. Since the Little Switzerland Plateau is central to these shifts, the presence of previously undocumented species in the region may be a continuing outcome of geologic events. Trautman (11) speculated the depauperate riffle assemblage he observed in eastern flowing streams of the Flushing Escarpment was due to the abundance of shale substrate, flash flows, and pollution. He suggested the absence of mottled sculpin was symptomatic of mine, industrial and domestic pollution. The only record of mottled sculpin in the Little Switzerland Plateau shown in the Fishes of Ohio (705) is a single location from before 1955 in Yellow Creek. Ohio EPA (2008b) evaluated streams in the Yellow Creek basin in 2005. In total, 9,633 mottled sculpin were present in 58 samples across the watershed. The Yellow Creek study documented significant water quality improvement from previous mine related degradation. In 1983, Ohio EPA recorded 1,347 mottled sculpin in 32 samples from the Cross Creek watershed. In 2010, this study collected 2,495 mottled sculpin in 24 Cross Creek basin samples (The 1983 survey had more multiple samples at the same sites, discussed above). Wills Creek (direct Ohio River tributary in Jefferson County) was assessed twice at three locations in 1983. Mottled sculpin numerically averaged 131 in the six samples. Two hundred and thirty-nine mottled sculpin were present in one 1999 Wills Creek collection. In 2010, this study returned an average of 309 mottled sculpin in single samples at three Wills Creek basin sites. No mottled sculpin were present in prior Ohio EPA Short Creek watershed assessments. In 2010, ten mottled sculpin were recorded in Short Creek at RM 4.1, while 18 were present in Little Short Creek at RM 0.1. At this point, mottled sculpin have not been collected in the Wheeling Creek watershed. If water quality continues to improve, it’s possible that mottled sculpins would be able to repopulate Wheeling Creek similar to other direct central Ohio River Tributaries. Trautman’s observation regarding the absence of riffle obligate species in the Little Switzerland Plateau was especially relevant to Wheeling Creek. Only three darter species in the basin (johnny, greenside, and fantail), all collected prior to 1955, are represented in his book. Ohio EPA collected two darter species (johnny and fantail) in Wheeling Creek in 1983. Two more (greenside and rainbow) were recorded in 1991. In 2010, eight darter species were present in the watershed. The four new species (logperch, banded, bluebreast, and Tippecanoe) were only collected in Wheeling Creek at RM 1.9. From this site between interstate 70 and a small residential neighborhood to its Ohio River confluence, Wheeling Creek is variously channelized, conveyed in a concrete sluice, or constrained by any of seven bridge crossings. Tippecanoe darters are one of the smallest species

EAS/2013-02-04 Wheeling Creek Watershed 2010 01/16/2015
34
of darter found in Ohio, about an inch long. Their 2010 presence in Wheeling Creek along with river chub, mimic shiner, flathead catfish, and other sensitive species indicated improvements to water quality despite the gauntlet of lower reach stream modifications. The presence of Tippecanoe darters, bluebreast darters, and other species of Teays River origin in these former Pittsburgh River headwaters may mark a first, but more likely it represents the first return of these fish in more than one hundred years. The fish community of Wheeling Creek reflects a healthier condition of water quality. Little improvement in Wheeling Creek tributaries has been noted over time. Of the three previously sampled streams, Crabapple Creek (1991), Fall Run (2002), and Town Run (1983), only Town Run has shown significant improvement. In 1983, Town Run RM 0.28 received an IBI score of 30 with only eight species present. In 2010, the same location on Town Run received an IBI score of 46 with eleven species present including the moderately pollution intolerant northern hog sucker and rainbow darter.
A - H indicates headwater site and W indicates wading site. B - The MIwb is no applicable to sites with 20 mi2 drainage area. ns - Nonsignificant departure from biocriterion (<4 IBI units; <0.5 MIwb units). * - Significant departure from biocriterion (>4 IBI units; >0.5 MIwb units). Poor
and very poor results are underlined.
Table 13. Fish community summaries based on pulsed D.C. electrofishing sampling conducted by Ohio EPA in the Wheeling Creek watershed during 2010. Relative numbers and weight are per 0.3 km for wading and headwater sites. NA= not applicable.
Stream
River Mile
Drainage Area (mi2)A
Fish Species (Total)
Relative Number
Relative Weight
(kg) QHEI
(Habitat) IBI MIwbb Narrative
Evaluation
Wheeling Creek 27.90 4.4H 9 639 NA 60.3 38* NA Fair
Wheeling Creek 25.97 13.4H 11 516 NA 65.5 34* NA Fair
Wheeling Creek 22.73 24.2W 9 956 12.93 81.3 32* NA Fair
Wheeling Creek 17.34 59.6W 18 930 16.23 88.3 42 ns 8.2 ns Marginally Good
Wheeling Creek 10.99 80.0W 18 1274 17.26 78.5 39* 7.9ns Fair
Wheeling Creek 9.40 86.0W 14 1380 12.49 70.5 41ns 7.8* Marginally Good/Fair
Wheeling Creek 5.05 96.0W 17 579 20.57 84.0 42ns 8.1 ns Marginally Good
Wheeling Creek 1.64 103W 26 1907 33.24 67.0 44 9.0 Good
Crabapple Creek 2.90 10.0H 13 314 NA 59.5 38* NA Fair
Crabapple Creek 0.16 19.6H 15 555 NA 67.8 42NS NA Marginally Good
Campbell Run 0.03 7.3H 8 202 NA 70.8 32* NA Fair
McCracken Run 0.23 4.7H 12 693 NA 54.0 38* NA Marginally Good
Pogue Run 0.11 5.3H 12 1622 NA 81.0 40ns NA Marginally Good
Cox Run 0.03 7.3 H 12 1142 NA 61.5 46 NA Very Good
Fall Run 0.03 3.8 H 9 718 NA 65.3 40ns NA Marginally Good
Town Run 0.28 2.4 H 11 901 NA 58.8 46 NA Very Good
Steep Run 0.03 2.3 H 3 103 NA 30.5 26 NA Poor
BIOCRITERIA
INDEX - Site Type WWH MWH
IBI: Headwater/Wading 44 24
MIwb: Wading 8.4 6.2

EAS/2013-02-04 Wheeling Creek Watershed 2010 01/16/2015
35
A - H indicates headwater site and W indicates wading site.
Table 14. Fish community trends from 1983 to 2010 based on pulsed D.C. electrofishing sampling conducted by Ohio EPA in the Wheeling Creek watershed.
Stream - Location
River Mile
Drainage Area (mi2)A
1983 IBI (# of Species)
1985 IBI (# of Species)
1991 IBI (# of Species)
2002 IBI (# of Species)
2010 IBI (# of Species)
Wheeling Creek at Mt Hope Rd 27.90 4.4H NA 32 (8) NA NA 38 (9)
Wheeling Creek a CR78 25.97 13.5 NA 22 (11) 24 (10) NA 34 (11)
Crabapple Creek CR 66 2.88 10.2H NA NA 50 (17) NA 38 (13)
Crabapple Creek at CR 10 0.16 19.6H NA NA 36 (12) NA 42(15)
Fall Run at Crescent Rd. 0.03 3.8 H NA NA NA 41 (12) 40 (9)
Town Run at Hells Kitchen Rd 0.28 2.4 H 30 (8) NA NA NA 46 (11)

EAS/2013-02-04 Wheeling Creek Watershed 2010 01/16/2015
36
Macroinvertebrate Community Macroinvertebrates were sampled at 16 locations in the Wheeling Creek basin (Figure 2). Qualitative sampling was conducted at all sampling sites while quantitative, Hester/Dendy artificial substrate samplers were retrieved from eight sites. Artificial substrate sampling was largely restricted to drainages greater than 20 mi2 and regional reference sites. A summary of the macroinvertebrate data are presented in Table 15 while raw macroinvertebrate data are presented in Appendix Table 10 and ICI and metric scores are in Appendix Table 11. Sampling locations were evaluated using the WWH or MWH biocriterion based on the current or recommended aquatic life use designation.
ICI scores at four of the eight mainstem Wheeling Creek sites met the WWH biocriterion; assessments ranged from fair to very good. Three of eight Wheeling Creek tributary sites met the WWH expectations with assessments ranging from very poor to good (Table 15). The watersheds just north of the Wheeling Creek survey area were also sampled in 2010. These watersheds included Cross Creek, Short Creek, Island Run, Croxton Run, Wills Creek, Rush Run, Glenns Run, Deep Run and
Salt Run. Collectively, these watersheds along with Wheeling Creek are called the Central Ohio River Tributaries (CORT) in the Ohio WQS (OAC 3745-1-13). Compared with Wheeling Creek, and negating stream size, lower performing sites were not evenly distributed over the study area. Rather, macroinvertebrate performance tended to transition from higher to lower quality in a north to south direction, from one basin to the next. As evidence, the percentage of fully meeting sites shifted from 100% (Island Run, Croxton Run and Will Creek watersheds), to 70% (Cross Creek watershed), to 67% (Short Creek watershed), to 56% (Rush Run, Glenns Run, Salt Run and Deep Run) to a low of 44% in the southernmost, Wheeling Creek watershed. The trend of shifting macroinvertebrate quality across all the basins corresponded with shifts in land use, abandoned coal mines and chemical water quality. Historic and active coal mining increased along with elevated concentrations of mine drainage parameters in roughly the same, north to south direction across the CORT study area. The trend is illustrated in Figure 9, which displays the strong negative correlations between intolerant mayfly taxa richness (a surrogate for higher macroinvertebrate quality) and elevated TDS levels from each sample site. While mayflies are considered sensitive to TDS as a group, several common, facultative varieties were routinely encountered at many mine-influenced CORT sites. However, intolerant mayflies were typically absent or rare in mine impacted streams and appeared particularly sensitive to mine drainage.
MACROINVERTEBRATE BIOCRITERION Full Attainment
Wheeling Creek 50% Wheeling Creek Tributaries 37% Stonefly

EAS/2013-02-04 Wheeling Creek Watershed 2010 01/16/2015
37
Figure 9. Number of sensitive mayfly taxa and average total dissolved solids found in samples collected from the Wheeling Creek study area compared to other nearby central Ohio River watersheds sampled in 2010.
Macroinvertebrate Trends Limited Wheeling Creek mainstem sampling was conducted in 2002 at two sites bracketing Fall Run at RMs 12.3 and 12.2; similar 2010 sites were located at RMs 17.3 and 11.55. ICI scores from both sites and both years met WWH criteria and were very similar, both in scores and compositionally. Low numbers of mayflies and a predominance of facultative hydropsychid caddisflies and tanytarsini midges were common to all samples, characteristically reflecting background mining influences. Fall Run sampling near the confluence with Wheeling Creek was conducted in both 2002 and 2010 surveys. Both surveys found good or marginally good quality communities despite significant historical mining and reclamation activity in the subbasin. Town Run receives the discharge of the St. Clairsville WWTP (RM 3.05) and was sampled near the mouth in both 1983 and 2010. Macroinvertebrates experienced minimal change over the period ranging from poor in 1983 to the lower fair range in 2010.

EAS/2013-02-04 Wheeling Creek Watershed 2010 01/16/2015
38
Table 15. Summary of macroinvertebrate data collected from artificial substrates (quantitative sampling) and natural substrates (qualitative sampling) in Wheeling Creek basin from July to October, 2010.
River RMa D.A.b Qualc Taxa
Sens. d Taxa Ql./Total
EPT Taxa Ql./Total
Density e Ql. or Qt.
ICI Predominant Populations on the Natural Substrates (Tolerance Categories = sensitive, facultative, tolerant)d
Wheeling Creek 27.80 3.8 35 7 8 Low -- Net-spinning caddisflies (sens.–facultative), riffle beetles (fac.)
Wheeling Creek 25.90 13.5 47 5 9 Low -- Net-spinning caddisflies (sens.–facultative)
Wheeling Creek 22.50 24.4 53 7 / 9 7 / 10 847 42 Net-spinning caddisflies (sensitive-facultative)
Wheeling Creek 17.30 59.6 37 4 / 6 6 / 7 696 38 Net-spinning (facultative) and fingernet caddisflies (sensitive)
Wheeling Creek 11.55 81.8 34 6 / 7 8 / 10 1,233 38 Net-spinning (facultative) and fingernet caddisflies (sensitive)
Wheeling Creek 9.40 86.0 37 3 / 5 7 / 9 578 40 Net-spinning caddisflies (facultative)
Wheeling Creek 6.00 96.4 29 3 / 4 7 / 7 73 30* Net-spinning caddisflies (facultative)
Wheeling Creek 1.64 104.0 27 4 / 6 6 / 9 294 26* Net-spinning (facultative) and fingernet caddisflies (sensitive)
Crabapple Creek 2.88 10.2 29 3 7 Low -- Net-spinning caddisflies and fingernail clams facultative)
Crabapple Creek 0.16 19.6 22 2 / 3 5 / 7 128 36 Net-spinning caddisflies, alderflies (facultative)
Campbell Creek 0.03 7.3 7 1 1 V. Low -- None
Pogue Run 0.11 5.3 48 11 14 Low-Mod. -- Fingernet (sensitive) and net-spinning caddisflies (facultative)
Cox Run 0.50 7.0 26 4 5 Mod.-High -- Scuds (facultative)
Fall Run 0.10 3.4 42 8 / 10 8 / 10 92 32ns Net-spinning caddisflies (facultative), Town Run 0.28 2.4 25 1 3 Low-Mod. -- Flatworms and midges (facultative) Steep Run 0.03 2.3 13 3 0 V. Low -- Mites (facultative)
a RM = River Mile. b D.A. = Drainage Area (mi2). c Ql.: Qualitative sample collected from the natural substrates. d Sens: Sensitive taxa derived from Ohio EPA macroinvertebrate taxa tolerance categories. “Sensitive” includes Intolerant and Moderately Intolerant taxa. e Ql. = Qualitative sample. Qualitative sample relative density: Mod. (Moderate) Qt. = Quantitative sample collected on Hester-Dendy artificial substrates; density is expressed in organisms per square foot.
General narrative ranges
Excellent/Very Good
Good/Marginally Good
Fair
Poor
EAS/2013-02-04 Wheeling Creek Watershed 2010 01/16/2015
39
ACKNOWLEDGEMENTS The following Ohio EPA staff provided technical expertise for this project: Report preparation and analysis Jack Freda, Kelly Capuzzi and Brian Alsdorf Data support Dennis Mishne and Bryan Schmucker Reviewers Jeff DeShon, Holly Tucker, Chuck Boucher, Joann
Montgomery, Aaron Pennnington Stream sampling Macroinvertebrates – Jack Freda
Fish – Brian Alsdorf, Ben Rich, Kelly Capuzzi, Randy Spencer and Gregg Sablak
Chemistry – Randy Spencer, Kelly Capuzzi, Joann Montgomery and Dan Imhoff Modeling - Dale White and Paul Gledhill
We would like to thank Chad Kinney and Mike Mozena with ODNR-MRM for their review of the report and their assistance with field reconnaissance and sampling. We would also like to thank Dylan Pendleton and Tamara Richards with ODNR-MRM and staff with the Jefferson County SWCD which include John Boleigh (now with ODNR), Brandon Andresen, Wendee Zadanski and Maggie Corder (now with Ohio EPA) for their assistance with field reconnaissance and data collection. Seasonal college interns who assisted with field data collection include Audra Sabo, Nicole (Smith) Clark, Amelia Hettinger (now with Hocking County SWCD), Lynn Parkins, Christopher Stephan, Andrew Butler, Caleb Shields, Nicholas Hardesty, April Denega, Brie Elking, Lindsey Boaz, Josh Griffin (now with Ohio EPA) Matt Lane, Claire Westervelt (now with Ohio EPA) and Mike Taricska. The Ohio EPA appreciates the numerous property owners who allowed field staff access to the project area.

EAS/2013-02-04 Wheeling Creek Watershed 2010 01/16/2015
40
REFERENCES Brockman, C. Scott. 1998. “A New Map of the Physiographic Regions of Ohio.” Ohio Geology
(Summer): 4-5. Crowell, Douglas L. 1995. History of the Coal-Mining Industry in Ohio. Bulletin 72. Ohio Dept. of
Natural Resources, Div. of Geological Survey, Columbus.
Dufour, A.P. (1977). Escherichia coli: The fecal coliform. Am. Soc. Test. Mater. Spec.Publ. 635: 45-58.
Harper, John A. 2002. “Lake Monongahela: Anatomy of an Immense Ice Age Pond.” Pennsylvania Geology 32(1): 2-12.
Harper, John A. 1997. “Of Ice and Waters Flowing: The Formation of Pittsburgh’s Three Rivers.”
Pennsylvania Geology 28(3/4): 2-8. Kolva, James R. and G.F. Koltun. 1987. Flooding and Sedimentation in Wheeling Creek Basin,
Belmont County, Ohio. Water-Resources Investigations Report 87-4053. Columbus, OH: U.S. Geological Survey.
Koltun, G.F. 1988. Analysis of Postdredging Bed-Level Changes in Selected Reaches of Wheeling
Creek, Eastern Ohio, 1985-87. Water-Resources Investigations Report 88-4119. Columbus, OH: U.S. Geological Survey.
MacDonald, D., C. Ingersoll, T. Berger. 2000. Development and evaluation of consensus-based
sedimentquality guidelines for freshwater ecosystems. Arch. Environ. Contam. Toxical.: Vol.39, 20-31.
Ohio Department of Natural Resources (ODNR).. 2004. Shaded Drift-Thickness Map of Ohio. Division of Geological Survey Map SG-3. Columbus, OH. Ohio Division of Geological Survey.
Ohio Environmental Protection Agency (OEPA). 2014. Biological and Water Quality Study of
Short Creek and Selected Ohio River Tributaries, 2010. Jefferson, Belmont and Harrison Counties, Ohio.
Ohio Environmental Protection Agency (OEPA). 2013. Biological and Water Quality Study of the Cross Creek Basin and Selected Ohio River Watersheds (Island Creek, Croxton Run and Wills Creek), 2010. Jefferson and Harrison Counties, Ohio.
Ohio Environmental Protection Agency (OEPA). . 2012. “Section E: Evaluating Beneficial Use: Human Health (Fish Contaminants)” Ohio 2012 Integrated Water Quality Monitoring and Assessment Report. Columbus, OH: OEPA-Division of Surface Water.
Ohio Environmental Protection Agency (OEPA). 2009. Manual of Ohio EPA Surveillance Methods and Quality Assurance Practices, updated edition. Columbus, OH: OEPA -Division of Surface Water.
Ohio Environmental Protection Agency (OEPA) 2008a. Ecological risk assessment guidance manual. Feb. 2003.Division of Emergency and Remedial Response, Columbus, Ohio.

EAS/2013-02-04 Wheeling Creek Watershed 2010 01/16/2015
41
Ohio Environmental Protection Agency (OEPA). 2008b. Biological and Water Quality Study of Yellow Creek and Selected Tributaries 2005-2006. Ohio EPA Technical Report EAS/2008-7-7. Columbus, OH. Ohio Division of Surface Water.
Ohio Environmental Protection Agency. 1999. Association Between Nutrients, Habitat, and Aquatic
Biota in Ohio Rivers and Streams. Ohio EPA Tech. Bull. EAS/2006-06-1. Division of Surface Water, Ecological Assessment Section, Columbus, Ohio.
Persaud, D., Jaagumagi, R. and A. Hayton. 1993. Guidelines for the Protection and Management of
Aquatic Sediment Quality in Ontario. Ontario Ministry of Environment and Energy Report. Sherwood, James M., Carrie A. Huitger, Andrew D. Ebner and G.F. Koltun. 2008. Morphological
Analyses and Simulated Flood Elevations in a Watershed with Dredged and Leveed Stream Channels, Wheeling Creek, Eastern Ohio. Scientific Investigations Report 2008-5133. Reston, VA. U.S. Geological Survey.
State of Ohio. 2010. State of Ohio Cooperative Fish Tissue Monitoring Program Sport Fish
Tissue Consumption Advisory Program. Columbus, OH: Ohio Division of Surface Water.
Stout, Wilber. 1953. “Age of Fringe Drift in Eastern Ohio.” Ohio Journal of Science 53(3): 183-189. Stout, Wilber and G.F. Lamb. 1938. “Physiographic Features of Southeastern Ohio.” Ohio Journal of
Science 38(2): 49-83. Trautman, Milton B. 1981. The Fishes of Ohio. Columbus, OH: Ohio State University Press. Wolfe, Mark E., compiler. 2012. 2011 Report on Ohio Mineral Industries: An Annual Summary of the
State’s Economic Geology. Columbus, OH: Ohio Division of Geological Survey.