Embed Size (px)
Citation preview
This product was financed in part or totally through a grant from the Ohio Environmental
Protection Agency and the United States Environmental Protection Agency with the
following funds: Section 604b and NEFCO member dues. The contents and views,
including any opinions, findings, or conclusions or recommendations, contained in this
product or publication are those of the authors and have not been subject to an Ohio
Environmental Protection Agency and United States Environmental Protection Agency
peer or administrative review and may not necessarily reflect the views of the Ohio
Environmental Protection and the United States Environmental Protection Agency and
no official endorsement should be inferred.
Deer Creek & Walborn Reservoir Watershed Study
NEFCO
June 15, 2016
www.NEFCOplanning.org
Deer Creek & Walborn Reservoir Watershed Study, i
June 15, 2016
Executive Summary
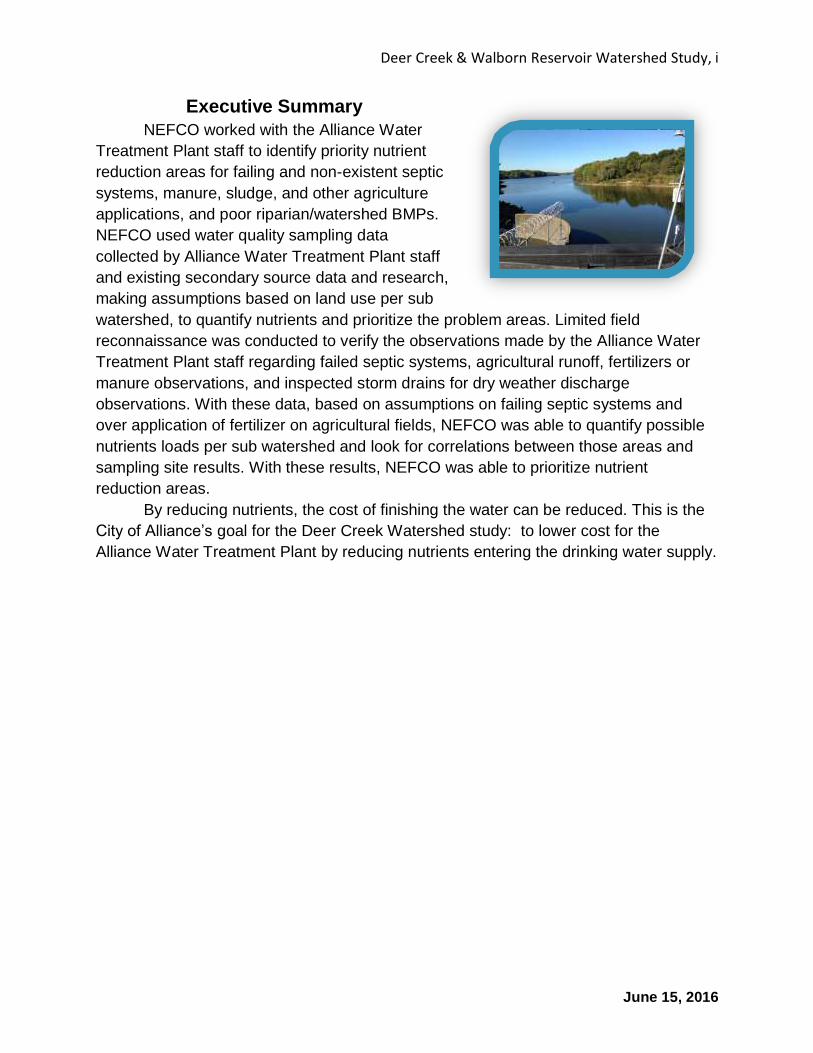
NEFCO worked with the Alliance Water
Treatment Plant staff to identify priority nutrient
reduction areas for failing and non-existent septic
systems, manure, sludge, and other agriculture
applications, and poor riparian/watershed BMPs.
NEFCO used water quality sampling data
collected by Alliance Water Treatment Plant staff
and existing secondary source data and research,
making assumptions based on land use per sub
watershed, to quantify nutrients and prioritize the problem areas. Limited field
reconnaissance was conducted to verify the observations made by the Alliance Water
Treatment Plant staff regarding failed septic systems, agricultural runoff, fertilizers or
manure observations, and inspected storm drains for dry weather discharge
observations. With these data, based on assumptions on failing septic systems and
over application of fertilizer on agricultural fields, NEFCO was able to quantify possible
nutrients loads per sub watershed and look for correlations between those areas and
sampling site results. With these results, NEFCO was able to prioritize nutrient
reduction areas.
By reducing nutrients, the cost of finishing the water can be reduced. This is the
City of Alliance’s goal for the Deer Creek Watershed study: to lower cost for the
Alliance Water Treatment Plant by reducing nutrients entering the drinking water supply.
Deer Creek & Walborn Reservoir Watershed Study, ii
June 15, 2016
Contents
Executive Summary .................................................................................................................... i
List of Figures/Tables/Maps ..................................................................................................... iii
Introduction ............................................................................................................................... 1
Harmful Algal Blooms ............................................................................................................... 3
Nutrients .................................................................................................................................... 4
Phosphorus ............................................................................................................................... 5
Limits ......................................................................................................................................... 5
Eutrophication ........................................................................................................................... 7
Internal Loading ........................................................................................................................ 8
Alliance Sampling Study ......................................................................................................... 10
Costs of Treating Cyanobacteria ............................................................................................ 15
Sources of Nutrients in the Watershed ................................................................................... 18
The Watershed ....................................................................................................................... 20
Topography ............................................................................................................................. 31
Woodlands .............................................................................................................................. 31
Floodplains and Riparian Corridors ........................................................................................ 31
Wetlands and Hydric Soils ...................................................................................................... 31
Soils ......................................................................................................................................... 31
Point Source Pollution ............................................................................................................ 42
National Pollution Discharge Elimination System .................................................................. 42
Failing Septic Systems ........................................................................................................... 43
Agricultural Manure ................................................................................................................. 49
Nonpoint Source Impacts to Water Quality ............................................................................ 51
Agriculture ............................................................................................................................... 53
Residential .............................................................................................................................. 57
Priority Nutrient Reduction Areas ........................................................................................... 57
Next Steps ............................................................................................................................... 62
Glossary .................................................................................................................................. 63
References .............................................................................................................................. 66
Deer Creek & Walborn Reservoir Watershed Study, iii
June 15, 2016
List of Figures/Tables/Maps
Figures:
1 Seasonal cycle of plankton ................................................................................................. 3
2 Seasonal cycle of nutrients and algae/plankton ................................................................. 3
3 Phosphorous cycle.............................................................................................................. 5
4 Eutrophication ..................................................................................................................... 7
5 Nutrient flow within a lake ecosystem ................................................................................ 8
6 Thermal stratification ....................................................................................................... 10 7 Geosmin from 2008-2013 in the two reservoirs and finished drinking water .................. 14
8 MIB from 2008-2012 in the two reservoirs and finished drinking water ........................... 14
9 MIB from 2009-2012 at various sampling sites around the two reservoirs...................... 15
Tables:
1 Drinking water and recreational limits for cyanotoxins, nitrogen, phosphorous, MIB, and
geosmin as set by the EPA and WHO ............................................................................... 6
2 Limits set for common nutrients that can cause problems in drinking water ..................... 9
3 Monthly average sampling data for phosphorous (mg/L) in 2010 at various locations
around the Deer Creek Watershed .................................................................................. 12
4 Recent costs associated with treating drinking water at the Alliance Water Treatment Plant .................................................................................................................................. 17
5 Land and vegetation cover in the Deer Creek Watershed ............................................... 20
6 Results from E. coli sampling in Stark County in areas with failing home septic
systems ............................................................................................................................. 45
7 Field Best Management Practices for the reduction of dissolved phosphorous loading to
streams and ditches in NW Ohio ...................................................................................... 52
8 Number of sludge application sites from wastewater treatment plants located within the
Deer Creek Watershed ..................................................................................................... 53
Maps:
1 Location of the Deer Creek Watershed in Portage and Stark Counties ............................ 2
2 Sampling locations selected by the Alliance Water Treatment Plant Staff ...................... 11
3 Subwatersheds of the Deer Creek Watershed................................................................. 19
4 Jurisdictions within the Deer Creek Watershed ............................................................... 21
5 Historical imagery from 1940 of the Deer Creek Watershed ........................................... 22
6 Historical imagery from 1950 of the Deer Creek Watershed ........................................... 23
7 Historical imagery from 1960 of the Deer Creek Watershed ........................................... 24
8 Historical imagery from 1970 of the Deer Creek Watershed ........................................... 25
9 Historical imagery from 1980 of the Deer Creek Watershed ........................................... 26
10 Historical imagery from 1990 of the Deer Creek Watershed ........................................... 27
11 Historical imagery from 2000 of the Deer Creek Watershed ........................................... 28
12 Historical imagery from 2010 of the Deer Creek Watershed ........................................... 29
Deer Creek & Walborn Reservoir Watershed Study, iv
June 15, 2016
Maps (continued):
13 Landcover of the Deer Creek Watershed ......................................................................... 30
14 Percent slope of the land in the Deer Creek Watershed ................................................. 32
15 Digital Elevation Model (DEM) and hillshade of the Deer Creek Watershed .................. 33
16 Woodland resources and protected areas in the Deer Creek Watershed ....................... 34
17 Floodplains and riparian corridors of the Deer Creek Watershed ................................... 35
18 Wetlands within the Deer Creek Watershed .................................................................... 36
19 Hydric soils of the Deer Creek Watershed ....................................................................... 37
20 Drainage of the soils in the Deer Creek Watershed ......................................................... 38
21 Infiltration rate of the soils in the Deer Creek Watershed ................................................ 39
22 Erodibility of the soils of the Deer Creek Watershed ....................................................... 40
23 Soil ratings for septic systems in the Deer Creek Watershed.......................................... 41
24 Approved sludge fields applications within the Deer Creek Watershed .......................... 46
25 Aquatic life and recreation use attainment of the Deer Creek Watershed ...................... 47
26 Known failing home sewage treatment systems in the Deer Creek Watershed ............. 48
27 Locations of farms within the Deer Creek Watershed...................................................... 50
28 Areas with a lack of green infrastructure within the Deer Creek Watershed ................... 58
29 Areas with failing and potentially failing septic systems in the Deer Creek Watershed .. 59
30 Potential agriculture areas in need of Best Management Practices (BMPs) in the Deer
Creek Watershed .............................................................................................................. 60
31 Priority nutrient reduction areas within the Deer Creek Watershed................................. 61
Deer Creek & Walborn Reservoir Watershed Study, 1
June 15, 2016
Introduction
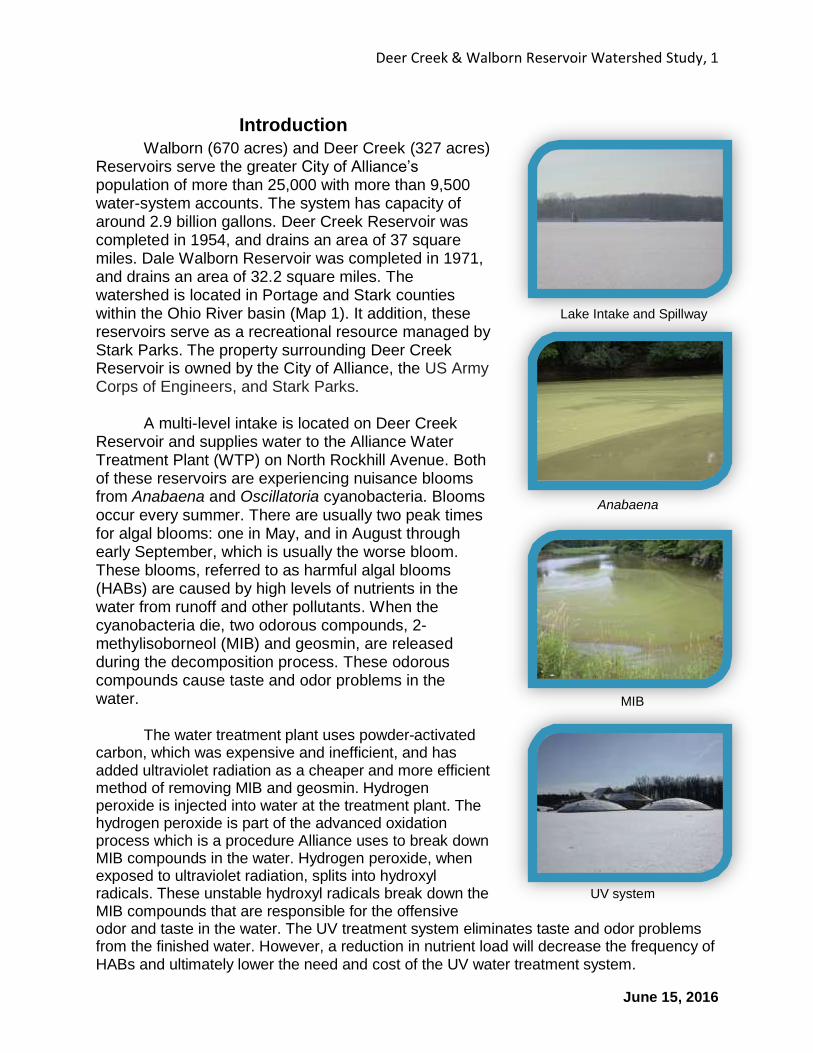
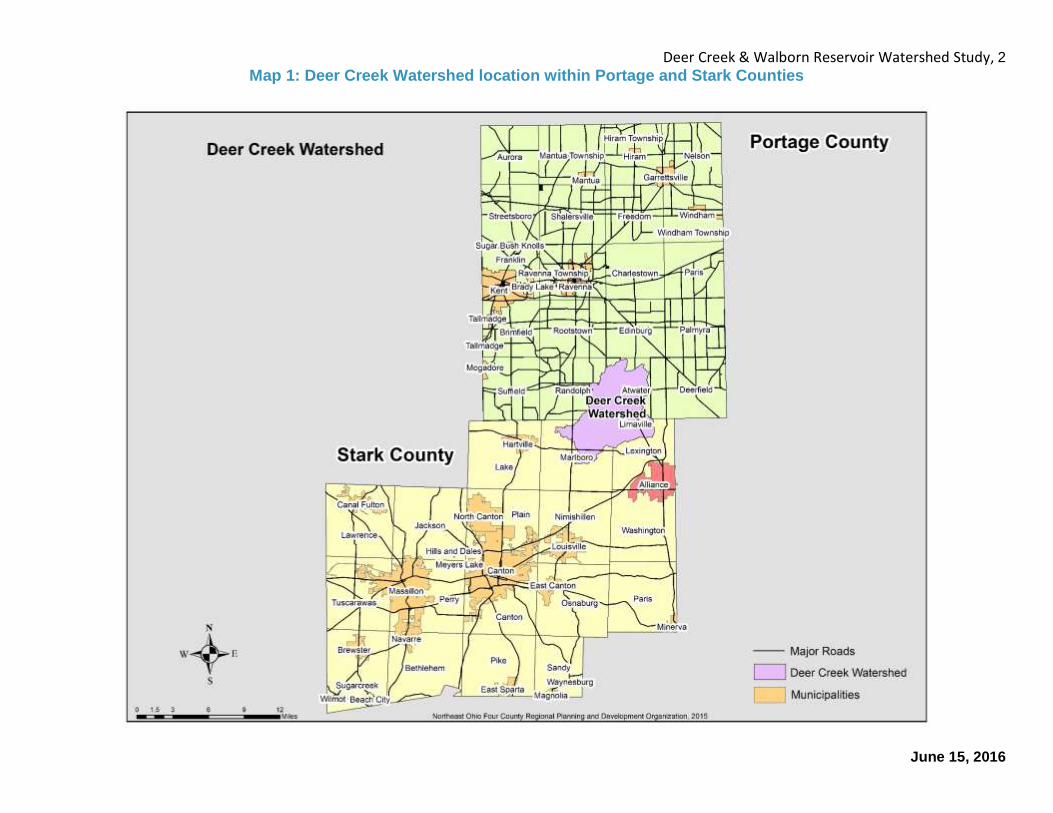
Walborn (670 acres) and Deer Creek (327 acres) Reservoirs serve the greater City of Alliance’s population of more than 25,000 with more than 9,500 water-system accounts. The system has capacity of around 2.9 billion gallons. Deer Creek Reservoir was completed in 1954, and drains an area of 37 square miles. Dale Walborn Reservoir was completed in 1971, and drains an area of 32.2 square miles. The watershed is located in Portage and Stark counties within the Ohio River basin (Map 1). It addition, these reservoirs serve as a recreational resource managed by Stark Parks. The property surrounding Deer Creek Reservoir is owned by the City of Alliance, the US Army Corps of Engineers, and Stark Parks.
A multi-level intake is located on Deer Creek
Reservoir and supplies water to the Alliance Water Treatment Plant (WTP) on North Rockhill Avenue. Both of these reservoirs are experiencing nuisance blooms from Anabaena and Oscillatoria cyanobacteria. Blooms occur every summer. There are usually two peak times for algal blooms: one in May, and in August through early September, which is usually the worse bloom. These blooms, referred to as harmful algal blooms (HABs) are caused by high levels of nutrients in the water from runoff and other pollutants. When the cyanobacteria die, two odorous compounds, 2-methylisoborneol (MIB) and geosmin, are released during the decomposition process. These odorous compounds cause taste and odor problems in the water.
The water treatment plant uses powder-activated
carbon, which was expensive and inefficient, and has added ultraviolet radiation as a cheaper and more efficient method of removing MIB and geosmin. Hydrogen peroxide is injected into water at the treatment plant. The hydrogen peroxide is part of the advanced oxidation process which is a procedure Alliance uses to break down MIB compounds in the water. Hydrogen peroxide, when exposed to ultraviolet radiation, splits into hydroxyl radicals. These unstable hydroxyl radicals break down the MIB compounds that are responsible for the offensive odor and taste in the water. The UV treatment system eliminates taste and odor problems from the finished water. However, a reduction in nutrient load will decrease the frequency of HABs and ultimately lower the need and cost of the UV water treatment system.
Lake Intake and Spillway
Anabaena
MIB
UV system
Deer Creek & Walborn Reservoir Watershed Study, 2
June 15, 2016
Map 1: Deer Creek Watershed location within Portage and Stark Counties
Deer Creek & Walborn Reservoir Watershed Study, 3
June 15, 2016
Harmful Algal Blooms
Harmful algal blooms (HABs) are a conglomeration of microscopic organisms found in various water bodies. They are termed harmful since many produce toxins during decomposition that can affect the health of humans and aquatic life. Surface scums may form during some algal blooms near or on the surface of water and can be a few inches thick. Algal blooms are affected by (USEPA (cyanotoxins), 2012):
the duration and intensity of sunlight
nutrient levels
water temperature
pH
increases in precipitation
water flow
the stability of the water column
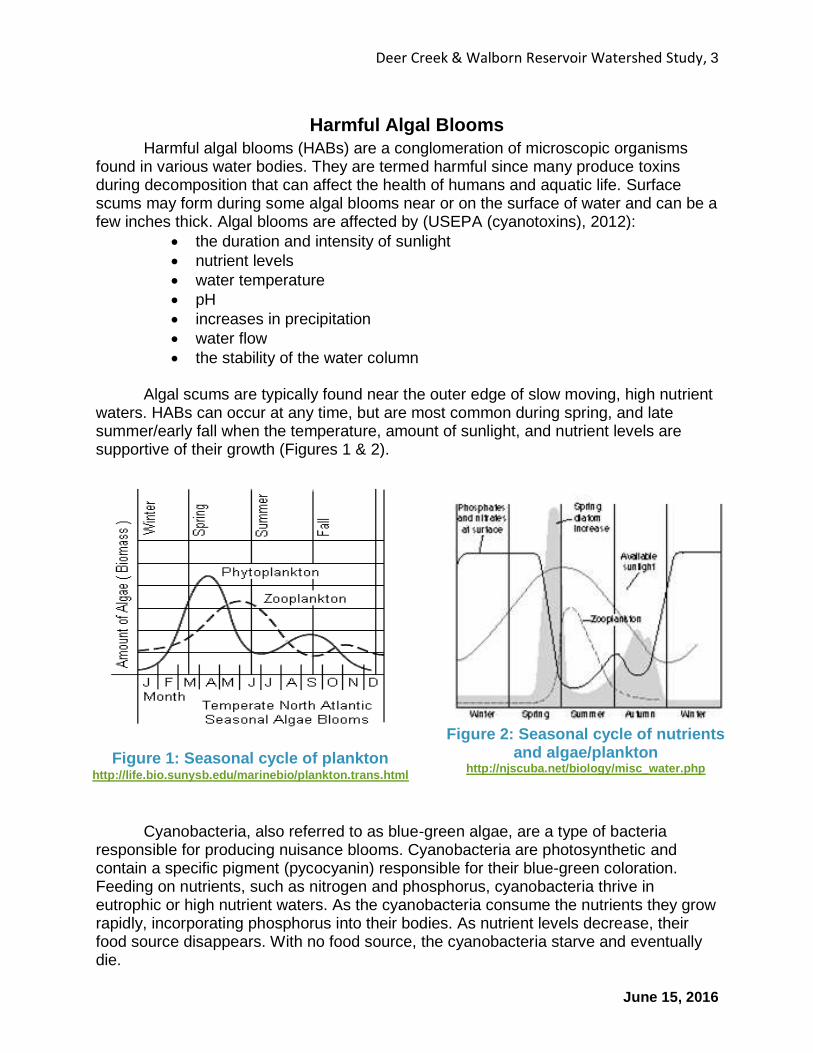
Algal scums are typically found near the outer edge of slow moving, high nutrient waters. HABs can occur at any time, but are most common during spring, and late summer/early fall when the temperature, amount of sunlight, and nutrient levels are supportive of their growth (Figures 1 & 2).
Cyanobacteria, also referred to as blue-green algae, are a type of bacteria
responsible for producing nuisance blooms. Cyanobacteria are photosynthetic and contain a specific pigment (pycocyanin) responsible for their blue-green coloration. Feeding on nutrients, such as nitrogen and phosphorus, cyanobacteria thrive in eutrophic or high nutrient waters. As the cyanobacteria consume the nutrients they grow rapidly, incorporating phosphorus into their bodies. As nutrient levels decrease, their food source disappears. With no food source, the cyanobacteria starve and eventually die.
Figure 2: Seasonal cycle of nutrients and algae/plankton
http://njscuba.net/biology/misc_water.php Figure 1: Seasonal cycle of plankton
http://life.bio.sunysb.edu/marinebio/plankton.trans.html
Deer Creek & Walborn Reservoir Watershed Study, 4
June 15, 2016
Through decomposition, some cyanobacteria release toxins known as cyanotoxins. While the cyanobacteria are alive, the toxin is contained within the cell and is not continuously excreted. The decomposition of cyanobacteria releases the toxin from the cell, introducing the toxin into the water column. High levels of cyanotoxins can cause various human health effects such as (USEPA (cyanotoxins), 2012):
headaches
fevers
muscle aches
stomach cramps
diarrhea
vomiting
decreased liver function
Microcystin is a cyanotoxin that primarily affects liver function and is produced by specific types of cyanobacteria. Anabaena, currently found in Walborn Reservoir, is known to produce cyanotoxins that affect the liver and nervous system. Another cyanobacteria contaminating Walborn Reservoir is Oscillatoria, which produces cyanotoxins that affect the nervous system, and can be fatal at high levels.
Microcystis is a cyanobacteria that can produce hepatotxins (e.g., microcystin).
Certain forms of nitrogen (e.g., urea fertilizers) can favor Microcystis growth in bodies of water. Then, when the body of water is nitrogen limited, it encourages the release of microcystin into the water column (Orihel et al., 2012). Researchers have found that total nitrogen seems to be the best predictor of toxin concentration within a water body (Scott, 2013). But phosphorus can also be a predictor of toxicity. In the case of the reservoirs, anabaena phosphorus is limiting or is a predictor of toxin growth. Anabaena can fix its own nitrogen so nitrogen is not limiting.
In addition to producing toxins, cyanobacteria can also produce odorous
chemicals within their cells that are released during their life or decomposition. Geosmin and MIB (2-Methylisborneol) are common chemicals that create an earthy/musty odor in water bodies containing cyanobacteria. Although not harmful to human health, MIB and geosmin cause taste and odor problems. Currently, water treatment facilities are using a variety of methods to eliminate taste and odor problems during their water treatment process. These methods can include oxidation, absorption, treatment of the compounds with UV light, or ozone with hydrogen peroxide. This plant does not have ozone with hydrogen peroxide.
Nutrients Nutrients are essential to the development, survival, and reproduction of all
organisms. In a lake ecosystem, nutrients cycle seasonally. During winter months, high levels of nutrients are present in the water as a result of the turbulent mixing of the water column during the fall. However, cyanobacteria growth is limited during the winter months due to cold temperatures and limited sunlight so the nutrients remain suspended in the water. However, when spring arrives sunlight is adequate and the cyanobacteria are able to thrive in the nutrient rich waters. As spring transitions to summer, the cyanobacteria begin to consume the nutrients, extinguishing the supply.
Deer Creek & Walborn Reservoir Watershed Study, 5
June 15, 2016
The cyanobacteria die off and their bodies decompose. Through decomposition, the nutrients and toxins that were once bound in their bodies are released back into the water column.
Specific ratios of nutrients favor optimal growth for various organisms. Plant
growth is limited by the scarcest element. The scarcest element, or limiting nutrient, is a nutrient whose ratio of supply and demand is the lowest. As nitrogen fixers, some cyanobacteria are capable of converting atmospheric nitrogen into an organic forms such as nitrate or ammonia. As a result, cyanobacterial growth is usually limited by the availability of phosphorus (USEPA (cyanotoxins), 2012).
Phosphorus As a limiting element in the growth of plants, phosphorus is a key nutrient to all
living organisms. Phosphorus is present in the aquatic environment as organic and inorganic phosphates (USEPA (phosphorous), 2012). Organic phosphate is a phosphate molecule attached to a carbon based molecule, such as plant or animal tissue (USEPA (phosphorous), 2012). A phosphate molecule that is not attached to carbon is considered inorganic (USEPA (phosphorous), 2012).
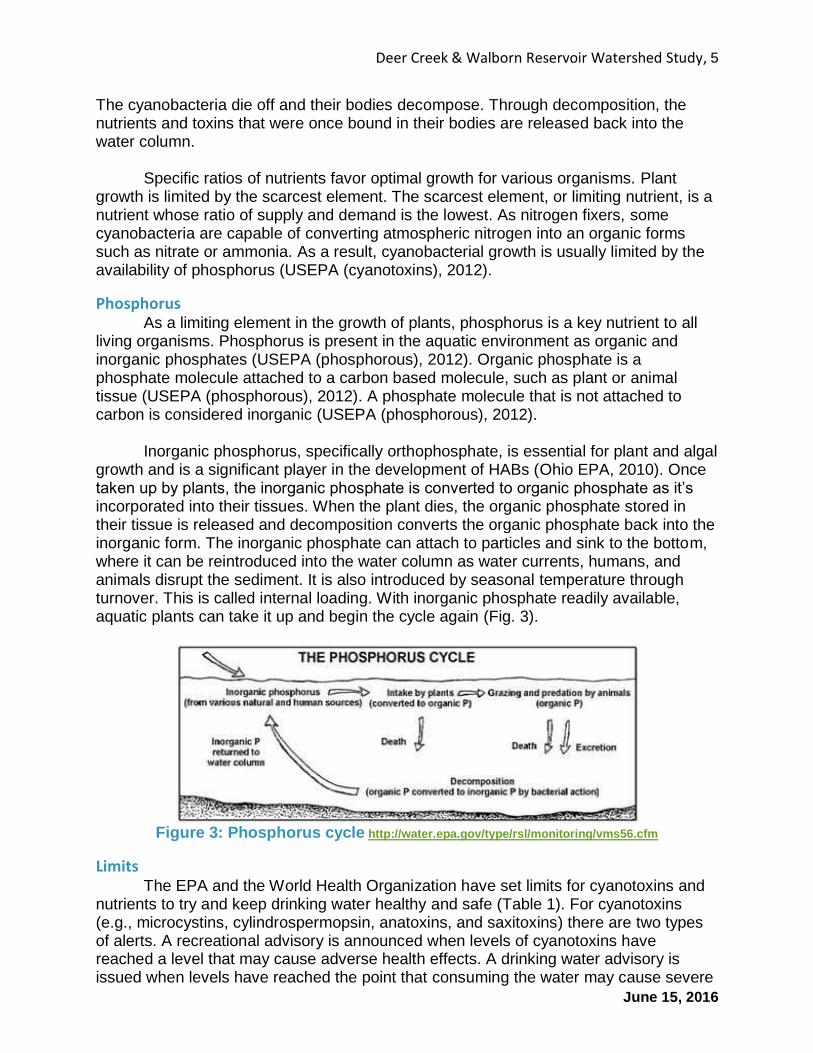
Inorganic phosphorus, specifically orthophosphate, is essential for plant and algal
growth and is a significant player in the development of HABs (Ohio EPA, 2010). Once taken up by plants, the inorganic phosphate is converted to organic phosphate as it’s incorporated into their tissues. When the plant dies, the organic phosphate stored in their tissue is released and decomposition converts the organic phosphate back into the inorganic form. The inorganic phosphate can attach to particles and sink to the bottom, where it can be reintroduced into the water column as water currents, humans, and animals disrupt the sediment. It is also introduced by seasonal temperature through turnover. This is called internal loading. With inorganic phosphate readily available, aquatic plants can take it up and begin the cycle again (Fig. 3).
Figure 3: Phosphorus cycle http://water.epa.gov/type/rsl/monitoring/vms56.cfm
Limits The EPA and the World Health Organization have set limits for cyanotoxins and
nutrients to try and keep drinking water healthy and safe (Table 1). For cyanotoxins (e.g., microcystins, cylindrospermopsin, anatoxins, and saxitoxins) there are two types of alerts. A recreational advisory is announced when levels of cyanotoxins have reached a level that may cause adverse health effects. A drinking water advisory is issued when levels have reached the point that consuming the water may cause severe
Deer Creek & Walborn Reservoir Watershed Study, 6
June 15, 2016
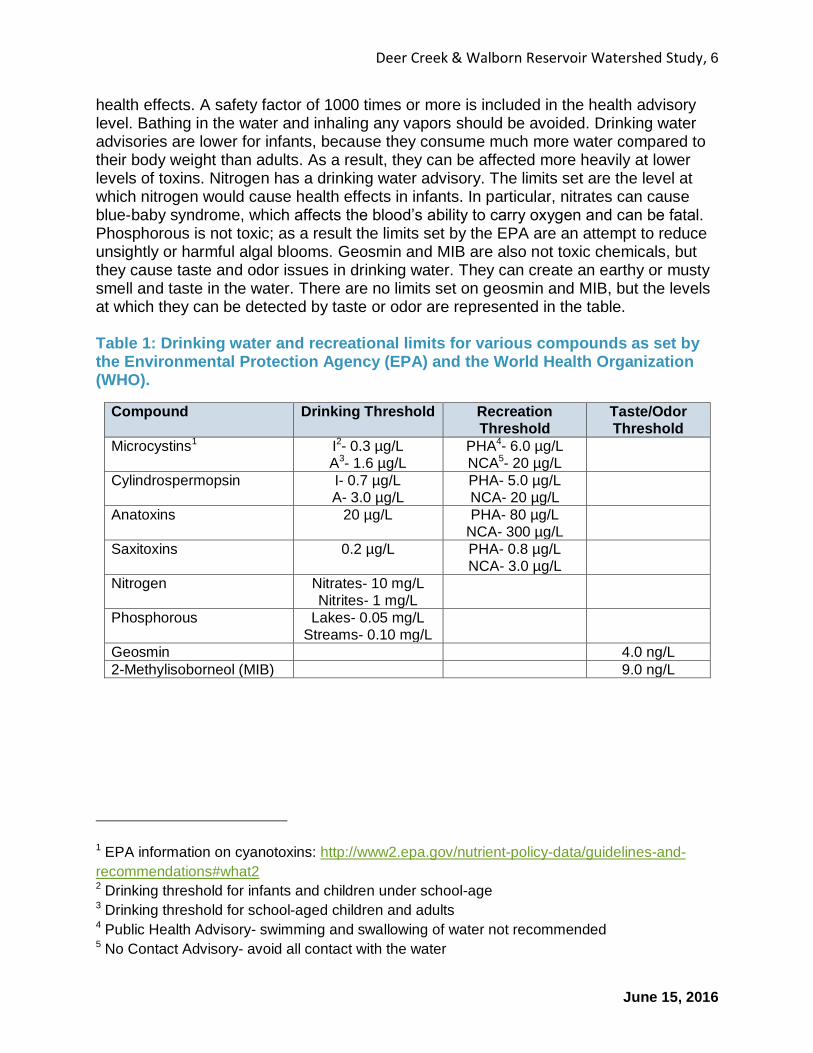
health effects. A safety factor of 1000 times or more is included in the health advisory level. Bathing in the water and inhaling any vapors should be avoided. Drinking water advisories are lower for infants, because they consume much more water compared to their body weight than adults. As a result, they can be affected more heavily at lower levels of toxins. Nitrogen has a drinking water advisory. The limits set are the level at which nitrogen would cause health effects in infants. In particular, nitrates can cause blue-baby syndrome, which affects the blood’s ability to carry oxygen and can be fatal. Phosphorous is not toxic; as a result the limits set by the EPA are an attempt to reduce unsightly or harmful algal blooms. Geosmin and MIB are also not toxic chemicals, but they cause taste and odor issues in drinking water. They can create an earthy or musty smell and taste in the water. There are no limits set on geosmin and MIB, but the levels at which they can be detected by taste or odor are represented in the table.
Table 1: Drinking water and recreational limits for various compounds as set by the Environmental Protection Agency (EPA) and the World Health Organization (WHO).
Compound Drinking Threshold Recreation Threshold
Taste/Odor Threshold
Microcystins1 I2- 0.3 µg/L A3- 1.6 µg/L
PHA4- 6.0 µg/L NCA5- 20 µg/L
Cylindrospermopsin I- 0.7 µg/L A- 3.0 µg/L
PHA- 5.0 µg/L NCA- 20 µg/L
Anatoxins 20 µg/L PHA- 80 µg/L NCA- 300 µg/L
Saxitoxins 0.2 µg/L PHA- 0.8 µg/L NCA- 3.0 µg/L
Nitrogen Nitrates- 10 mg/L Nitrites- 1 mg/L
Phosphorous Lakes- 0.05 mg/L Streams- 0.10 mg/L
Geosmin 4.0 ng/L
2-Methylisoborneol (MIB) 9.0 ng/L
1 EPA information on cyanotoxins: http://www2.epa.gov/nutrient-policy-data/guidelines-and-
recommendations#what2 2 Drinking threshold for infants and children under school-age 3 Drinking threshold for school-aged children and adults 4 Public Health Advisory- swimming and swallowing of water not recommended 5 No Contact Advisory- avoid all contact with the water
Deer Creek & Walborn Reservoir Watershed Study, 7
June 15, 2016
Eutrophication
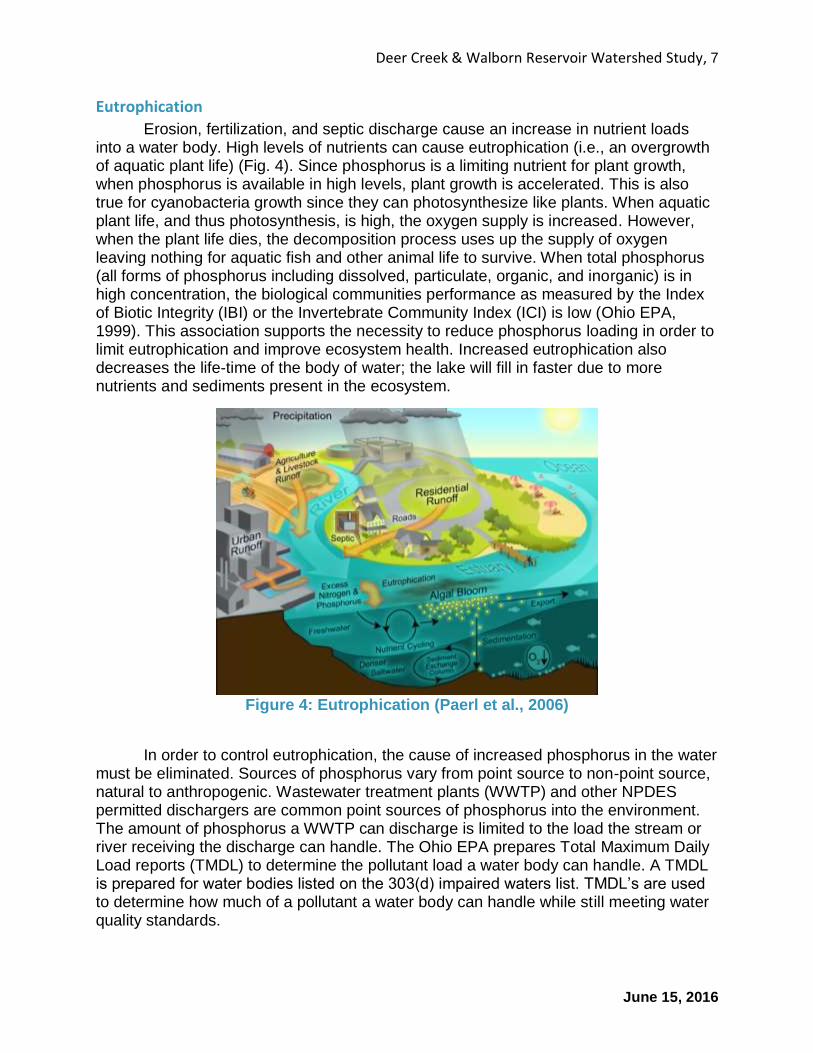
Erosion, fertilization, and septic discharge cause an increase in nutrient loads into a water body. High levels of nutrients can cause eutrophication (i.e., an overgrowth of aquatic plant life) (Fig. 4). Since phosphorus is a limiting nutrient for plant growth, when phosphorus is available in high levels, plant growth is accelerated. This is also true for cyanobacteria growth since they can photosynthesize like plants. When aquatic plant life, and thus photosynthesis, is high, the oxygen supply is increased. However, when the plant life dies, the decomposition process uses up the supply of oxygen leaving nothing for aquatic fish and other animal life to survive. When total phosphorus (all forms of phosphorus including dissolved, particulate, organic, and inorganic) is in high concentration, the biological communities performance as measured by the Index of Biotic Integrity (IBI) or the Invertebrate Community Index (ICI) is low (Ohio EPA, 1999). This association supports the necessity to reduce phosphorus loading in order to limit eutrophication and improve ecosystem health. Increased eutrophication also decreases the life-time of the body of water; the lake will fill in faster due to more nutrients and sediments present in the ecosystem.
Figure 4: Eutrophication (Paerl et al., 2006)
In order to control eutrophication, the cause of increased phosphorus in the water must be eliminated. Sources of phosphorus vary from point source to non-point source, natural to anthropogenic. Wastewater treatment plants (WWTP) and other NPDES permitted dischargers are common point sources of phosphorus into the environment. The amount of phosphorus a WWTP can discharge is limited to the load the stream or river receiving the discharge can handle. The Ohio EPA prepares Total Maximum Daily Load reports (TMDL) to determine the pollutant load a water body can handle. A TMDL is prepared for water bodies listed on the 303(d) impaired waters list. TMDL’s are used to determine how much of a pollutant a water body can handle while still meeting water quality standards.
Deer Creek & Walborn Reservoir Watershed Study, 8
June 15, 2016
Deer Creek and Walborn Reservoirs are both eutrophic. Nutrient contaminants from the streams are flowing into the reservoirs from the watershed, including nitrogen compounds and phosphorus.
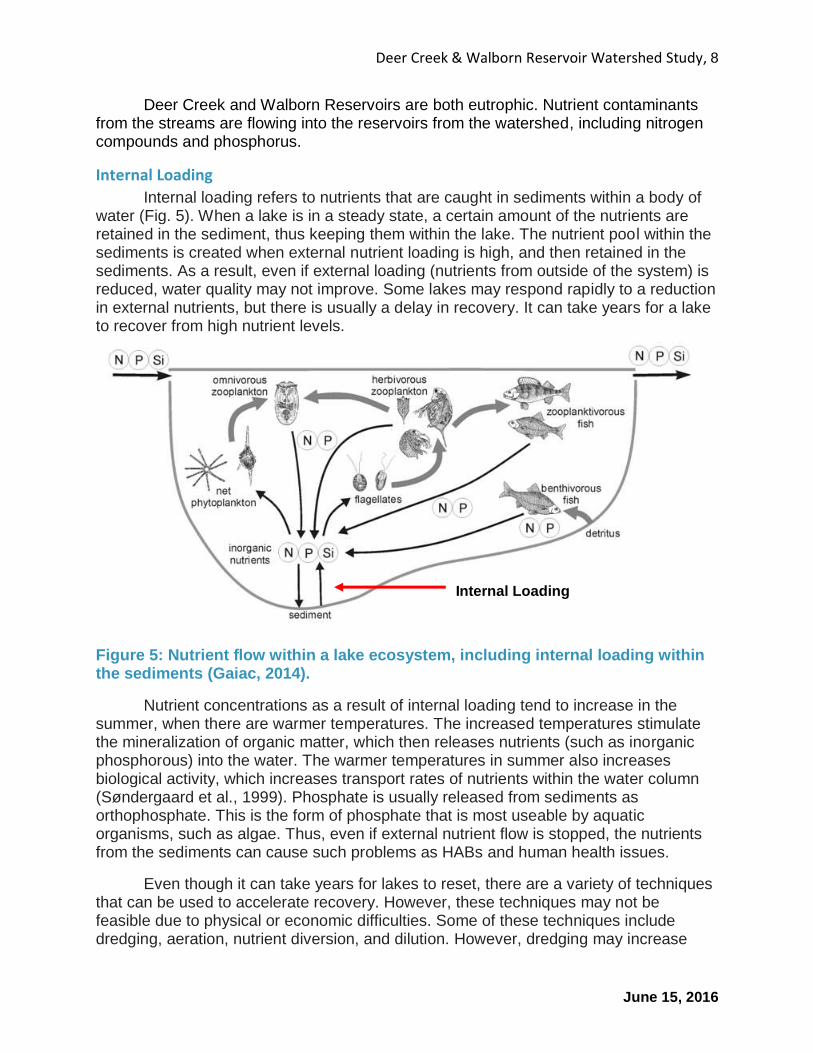
Internal Loading
Internal loading refers to nutrients that are caught in sediments within a body of water (Fig. 5). When a lake is in a steady state, a certain amount of the nutrients are retained in the sediment, thus keeping them within the lake. The nutrient pool within the sediments is created when external nutrient loading is high, and then retained in the sediments. As a result, even if external loading (nutrients from outside of the system) is reduced, water quality may not improve. Some lakes may respond rapidly to a reduction in external nutrients, but there is usually a delay in recovery. It can take years for a lake to recover from high nutrient levels.
Figure 5: Nutrient flow within a lake ecosystem, including internal loading within the sediments (Gaiac, 2014).
Nutrient concentrations as a result of internal loading tend to increase in the summer, when there are warmer temperatures. The increased temperatures stimulate the mineralization of organic matter, which then releases nutrients (such as inorganic phosphorous) into the water. The warmer temperatures in summer also increases biological activity, which increases transport rates of nutrients within the water column (Søndergaard et al., 1999). Phosphate is usually released from sediments as orthophosphate. This is the form of phosphate that is most useable by aquatic organisms, such as algae. Thus, even if external nutrient flow is stopped, the nutrients from the sediments can cause such problems as HABs and human health issues.
Even though it can take years for lakes to reset, there are a variety of techniques that can be used to accelerate recovery. However, these techniques may not be feasible due to physical or economic difficulties. Some of these techniques include dredging, aeration, nutrient diversion, and dilution. However, dredging may increase
Internal Loading
Deer Creek & Walborn Reservoir Watershed Study, 9
June 15, 2016
and release phosphorous. For a full list of the techniques, visit the Washington Department of Ecology’s website (Washington, 2015).
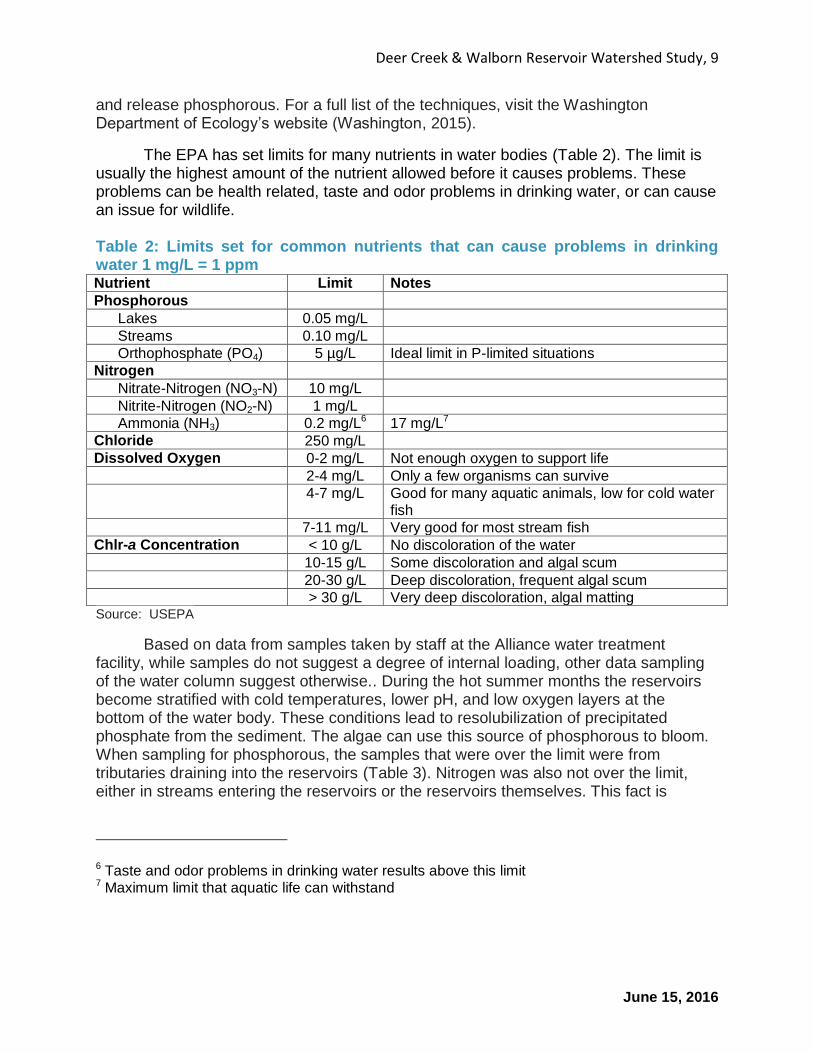
The EPA has set limits for many nutrients in water bodies (Table 2). The limit is usually the highest amount of the nutrient allowed before it causes problems. These problems can be health related, taste and odor problems in drinking water, or can cause an issue for wildlife.
Table 2: Limits set for common nutrients that can cause problems in drinking water 1 mg/L = 1 ppm Nutrient Limit Notes
Phosphorous
Lakes 0.05 mg/L
Streams 0.10 mg/L
Orthophosphate (PO4) 5 µg/L Ideal limit in P-limited situations
Nitrogen
Nitrate-Nitrogen (NO3-N) 10 mg/L
Nitrite-Nitrogen (NO2-N) 1 mg/L
Ammonia (NH3) 0.2 mg/L6 17 mg/L7
Chloride 250 mg/L
Dissolved Oxygen 0-2 mg/L Not enough oxygen to support life
2-4 mg/L Only a few organisms can survive
4-7 mg/L Good for many aquatic animals, low for cold water fish
7-11 mg/L Very good for most stream fish
Chlr-a Concentration < 10 g/L No discoloration of the water
10-15 g/L Some discoloration and algal scum
20-30 g/L Deep discoloration, frequent algal scum
> 30 g/L Very deep discoloration, algal matting Source: USEPA
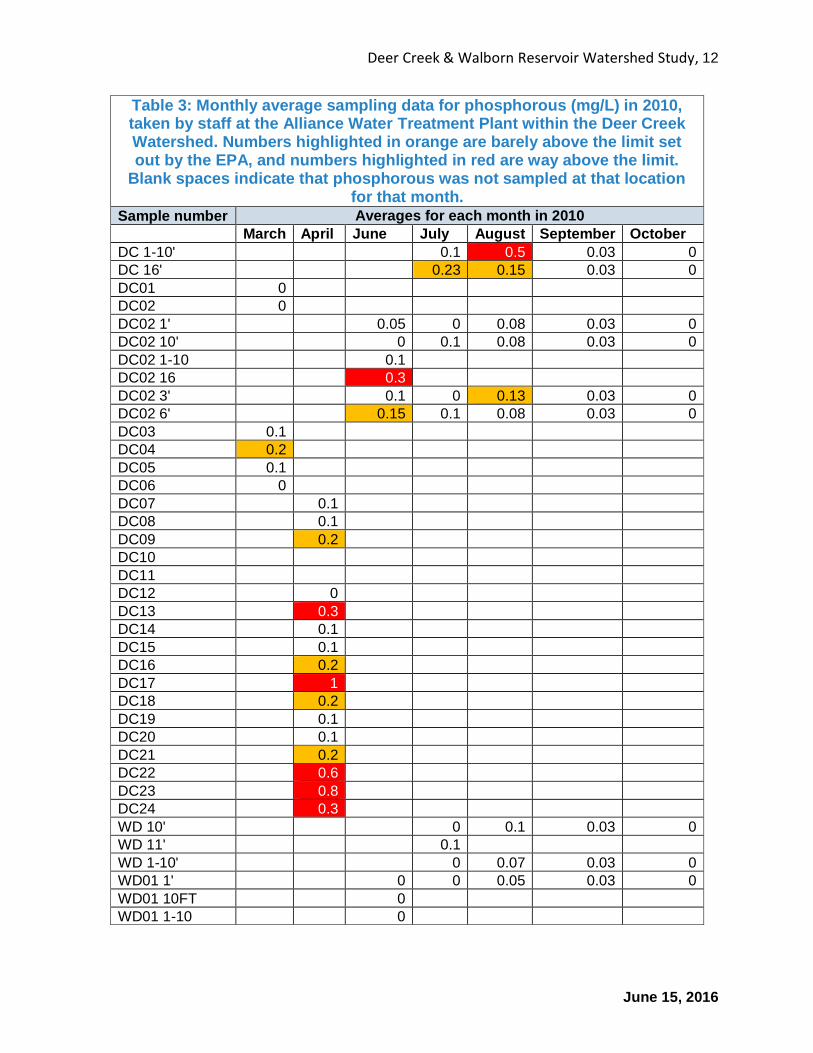
Based on data from samples taken by staff at the Alliance water treatment facility, while samples do not suggest a degree of internal loading, other data sampling of the water column suggest otherwise.. During the hot summer months the reservoirs become stratified with cold temperatures, lower pH, and low oxygen layers at the bottom of the water body. These conditions lead to resolubilization of precipitated phosphate from the sediment. The algae can use this source of phosphorous to bloom. When sampling for phosphorous, the samples that were over the limit were from tributaries draining into the reservoirs (Table 3). Nitrogen was also not over the limit, either in streams entering the reservoirs or the reservoirs themselves. This fact is
6 Taste and odor problems in drinking water results above this limit 7 Maximum limit that aquatic life can withstand
Deer Creek & Walborn Reservoir Watershed Study, 10
June 15, 2016
confirmed by a water quality report done on the Alliance water treatment facility (Middleton et al., 2010).
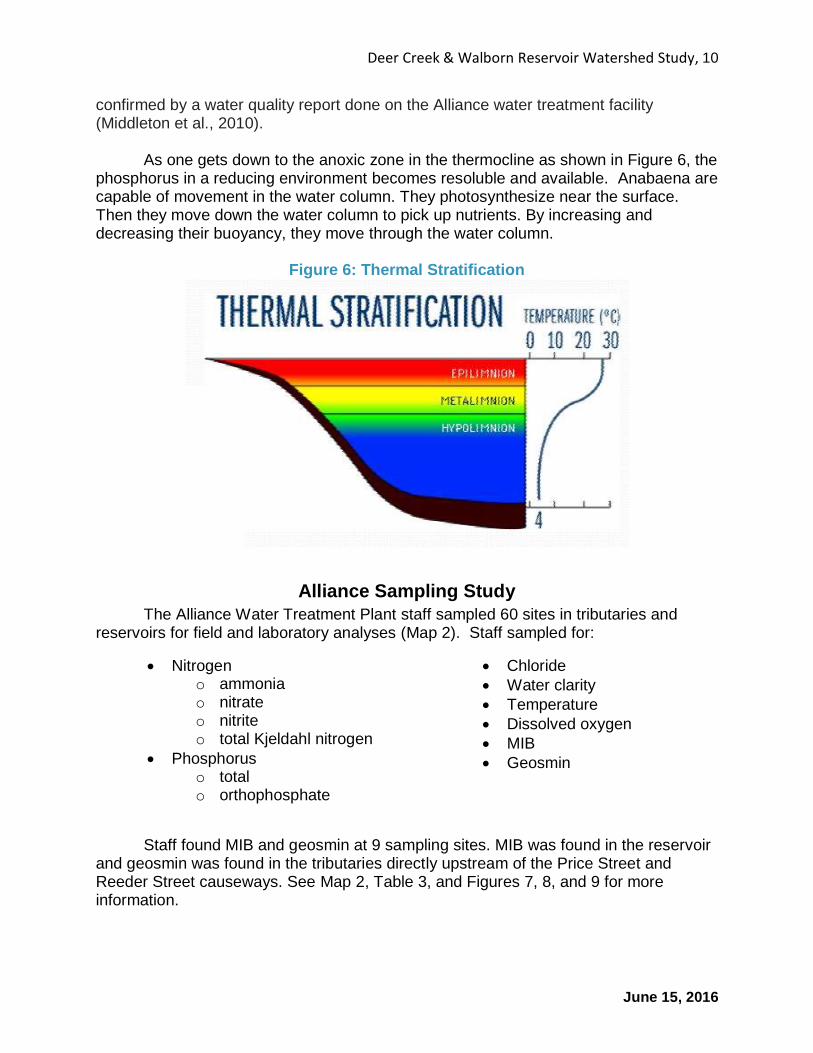
As one gets down to the anoxic zone in the thermocline as shown in Figure 6, the
phosphorus in a reducing environment becomes resoluble and available. Anabaena are capable of movement in the water column. They photosynthesize near the surface. Then they move down the water column to pick up nutrients. By increasing and decreasing their buoyancy, they move through the water column.
Figure 6: Thermal Stratification
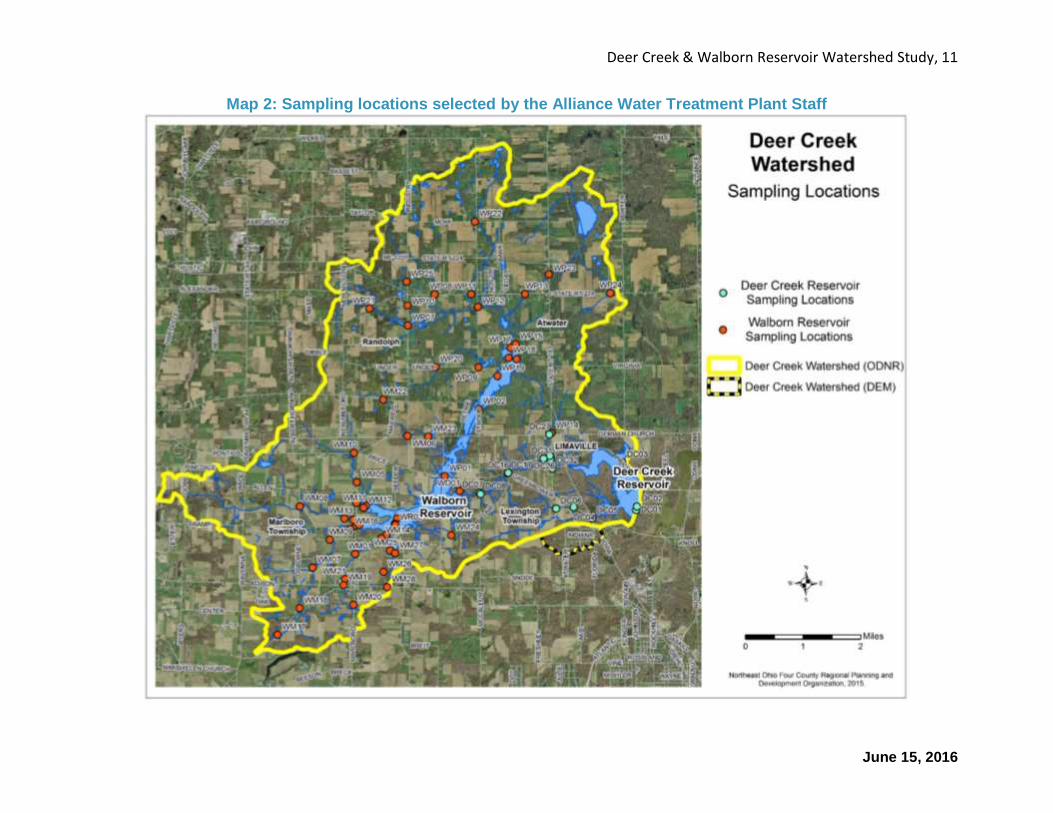
Alliance Sampling Study
The Alliance Water Treatment Plant staff sampled 60 sites in tributaries and reservoirs for field and laboratory analyses (Map 2). Staff sampled for:
Nitrogen o ammonia o nitrate o nitrite o total Kjeldahl nitrogen
Phosphorus o total o orthophosphate
Chloride
Water clarity
Temperature
Dissolved oxygen
MIB
Geosmin
Staff found MIB and geosmin at 9 sampling sites. MIB was found in the reservoir and geosmin was found in the tributaries directly upstream of the Price Street and Reeder Street causeways. See Map 2, Table 3, and Figures 7, 8, and 9 for more information.
Deer Creek & Walborn Reservoir Watershed Study, 11
June 15, 2016
Map 2: Sampling locations selected by the Alliance Water Treatment Plant Staff
Deer Creek & Walborn Reservoir Watershed Study, 12
June 15, 2016
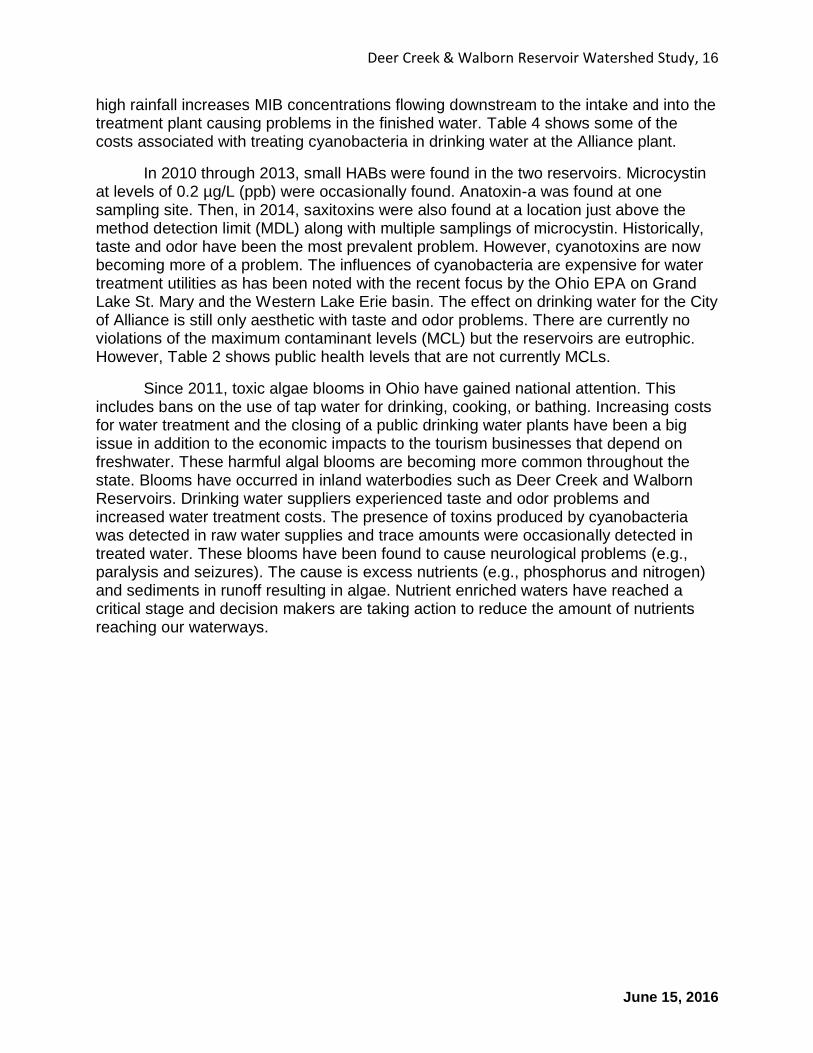
Table 3: Monthly average sampling data for phosphorous (mg/L) in 2010, taken by staff at the Alliance Water Treatment Plant within the Deer Creek Watershed. Numbers highlighted in orange are barely above the limit set out by the EPA, and numbers highlighted in red are way above the limit.
Blank spaces indicate that phosphorous was not sampled at that location for that month.
Sample number Averages for each month in 2010
March April June July August September October
DC 1-10'
0.1 0.5 0.03 0
DC 16'
0.23 0.15 0.03 0
DC01 0 DC02 0 DC02 1'
0.05 0 0.08 0.03 0
DC02 10'
0 0.1 0.08 0.03 0
DC02 1-10
0.1 DC02 16
0.3
DC02 3'
0.1 0 0.13 0.03 0
DC02 6'
0.15 0.1 0.08 0.03 0
DC03 0.1 DC04 0.2 DC05 0.1 DC06 0 DC07
0.1
DC08
0.1 DC09
0.2
DC10 DC11 DC12
0 DC13
0.3
DC14
0.1 DC15
0.1
DC16
0.2 DC17
1
DC18
0.2 DC19
0.1
DC20
0.1 DC21
0.2
DC22
0.6 DC23
0.8
DC24
0.3 WD 10'
0 0.1 0.03 0
WD 11'
0.1 WD 1-10'
0 0.07 0.03 0
WD01 1'
0 0 0.05 0.03 0
WD01 10FT
0 WD01 1-10
0

Deer Creek & Walborn Reservoir Watershed Study, 13
June 15, 2016
Table 3 (continued): Monthly average sampling data for phosphorous (mg/L) in 2010, taken by staff at the Alliance Water Treatment Plant within
the Deer Creek Watershed. Numbers highlighted in orange are barely above the limit set out by the EPA, and numbers highlighted in red are way above the limit. Blank spaces indicate that phosphorous was not sampled at that
location for that month. Sample number Averages for each month in 2010
WD01 3'
0 0 0.05 0.03 0
WD01 6'
0.03 0.08 0.03 0
WD02 6 FT
0 WM01 0.4
1.775
WM02 0.1 WM03 0.25 WM04 0 WM05 0.1
0.53 WM06 0.05
WM07 0.1 WM08 0.1 WM09 0.1 WM10 0.2
0.23 WM16 0.1
WM17 0.05 WM18 0.3 WM19 0.15
1.13 WM20 0.2
0.13
WM21 0.3
0.63 WM23 0
WM26 0.4 WM28 0.15 WP01 0 WP02 0 WP07 0.1 WP10 0 WP14 0.15 WR02 0 WR03 0
Deer Creek & Walborn Reservoir Watershed Study, 14
June 15, 2016
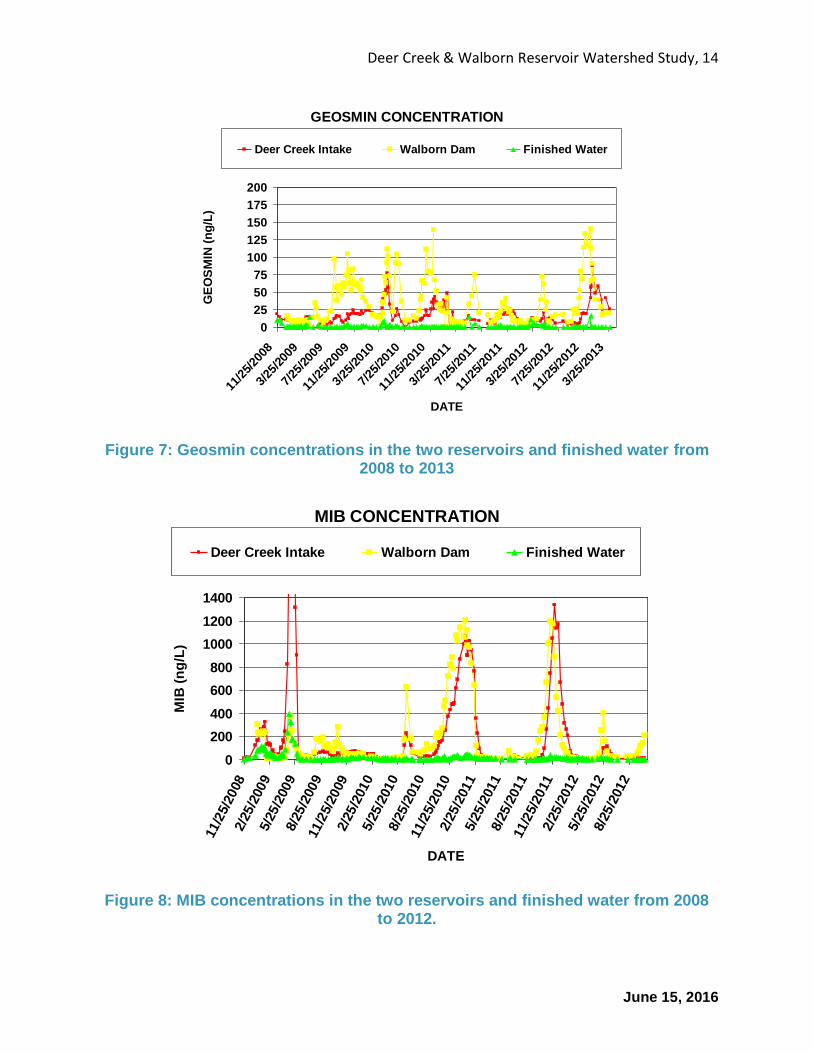
Figure 7: Geosmin concentrations in the two reservoirs and finished water from 2008 to 2013
Figure 8: MIB concentrations in the two reservoirs and finished water from 2008 to 2012.
GEOSMIN CONCENTRATION
0
25
50
75
100
125
150
175
200
11/2
5/20
083/
25/2
009
7/25
/200
911
/25/
2009
3/25
/201
07/
25/2
010
11/2
5/20
103/
25/2
011
7/25
/201
111
/25/
2011
3/25
/201
27/
25/2
012
11/2
5/20
123/
25/2
013
DATE
GE
OS
MIN
(n
g/L
)
Deer Creek Intake Walborn Dam Finished Water
MIB CONCENTRATION
0
200
400
600
800
1000
1200
1400
11/2
5/2
008
2/2
5/2
009
5/2
5/2
009
8/2
5/2
009
11/2
5/2
009
2/2
5/2
010
5/2
5/2
010
8/2
5/2
010
11/2
5/2
010
2/2
5/2
011
5/2
5/2
011
8/2
5/2
011
11/2
5/2
011
2/2
5/2
012
5/2
5/2
012
8/2
5/2
012
DATE
MIB
(n
g/L
)
Deer Creek Intake Walborn Dam Finished Water
Deer Creek & Walborn Reservoir Watershed Study, 15
June 15, 2016
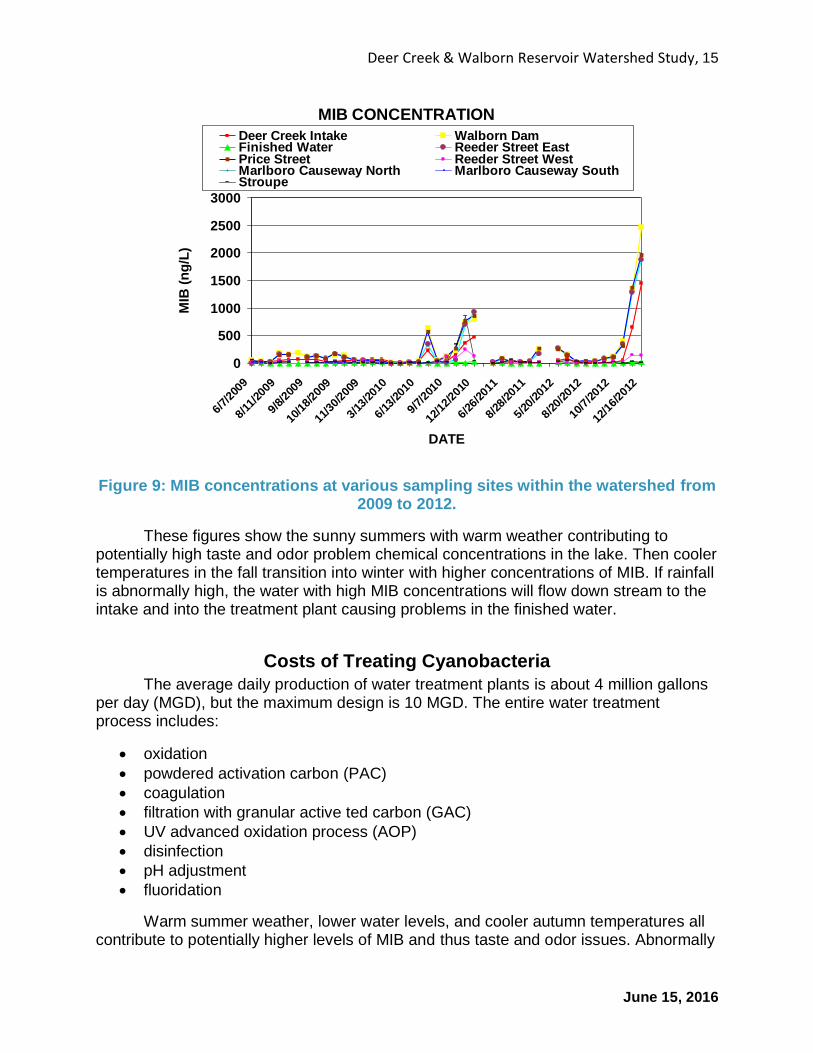
Figure 9: MIB concentrations at various sampling sites within the watershed from 2009 to 2012.
These figures show the sunny summers with warm weather contributing to potentially high taste and odor problem chemical concentrations in the lake. Then cooler temperatures in the fall transition into winter with higher concentrations of MIB. If rainfall is abnormally high, the water with high MIB concentrations will flow down stream to the intake and into the treatment plant causing problems in the finished water.
Costs of Treating Cyanobacteria
The average daily production of water treatment plants is about 4 million gallons per day (MGD), but the maximum design is 10 MGD. The entire water treatment process includes:
oxidation
powdered activation carbon (PAC)
coagulation
filtration with granular active ted carbon (GAC)
UV advanced oxidation process (AOP)
disinfection
pH adjustment
fluoridation
Warm summer weather, lower water levels, and cooler autumn temperatures all contribute to potentially higher levels of MIB and thus taste and odor issues. Abnormally
MIB CONCENTRATION
0
500
1000
1500
2000
2500
3000
6/7/
2009
8/11
/200
9
9/8/
2009
10/1
8/20
09
11/3
0/20
09
3/13
/201
0
6/13
/201
0
9/7/
2010
12/1
2/20
10
6/26
/201
1
8/28
/201
1
5/20
/201
2
8/20
/201
2
10/7
/201
2
12/1
6/20
12
DATE
MIB
(n
g/L
)
Deer Creek Intake Walborn DamFinished Water Reeder Street EastPrice Street Reeder Street WestMarlboro Causeway North Marlboro Causeway SouthStroupe
Deer Creek & Walborn Reservoir Watershed Study, 16
June 15, 2016
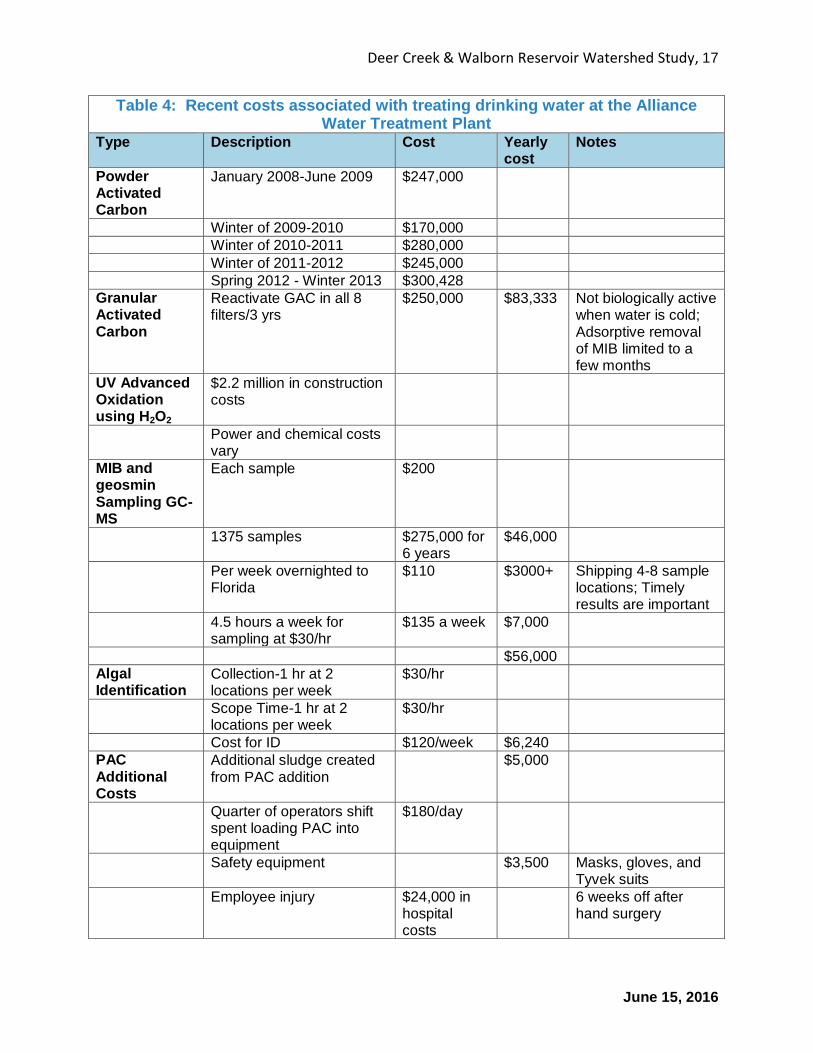
high rainfall increases MIB concentrations flowing downstream to the intake and into the treatment plant causing problems in the finished water. Table 4 shows some of the costs associated with treating cyanobacteria in drinking water at the Alliance plant.
In 2010 through 2013, small HABs were found in the two reservoirs. Microcystin at levels of 0.2 µg/L (ppb) were occasionally found. Anatoxin-a was found at one sampling site. Then, in 2014, saxitoxins were also found at a location just above the method detection limit (MDL) along with multiple samplings of microcystin. Historically, taste and odor have been the most prevalent problem. However, cyanotoxins are now becoming more of a problem. The influences of cyanobacteria are expensive for water treatment utilities as has been noted with the recent focus by the Ohio EPA on Grand Lake St. Mary and the Western Lake Erie basin. The effect on drinking water for the City of Alliance is still only aesthetic with taste and odor problems. There are currently no violations of the maximum contaminant levels (MCL) but the reservoirs are eutrophic. However, Table 2 shows public health levels that are not currently MCLs.
Since 2011, toxic algae blooms in Ohio have gained national attention. This includes bans on the use of tap water for drinking, cooking, or bathing. Increasing costs for water treatment and the closing of a public drinking water plants have been a big issue in addition to the economic impacts to the tourism businesses that depend on freshwater. These harmful algal blooms are becoming more common throughout the state. Blooms have occurred in inland waterbodies such as Deer Creek and Walborn Reservoirs. Drinking water suppliers experienced taste and odor problems and increased water treatment costs. The presence of toxins produced by cyanobacteria was detected in raw water supplies and trace amounts were occasionally detected in treated water. These blooms have been found to cause neurological problems (e.g., paralysis and seizures). The cause is excess nutrients (e.g., phosphorus and nitrogen) and sediments in runoff resulting in algae. Nutrient enriched waters have reached a critical stage and decision makers are taking action to reduce the amount of nutrients reaching our waterways.
Deer Creek & Walborn Reservoir Watershed Study, 17
June 15, 2016
Table 4: Recent costs associated with treating drinking water at the Alliance Water Treatment Plant
Type Description Cost Yearly cost
Notes
Powder Activated Carbon
January 2008-June 2009 $247,000
Winter of 2009-2010 $170,000
Winter of 2010-2011 $280,000
Winter of 2011-2012 $245,000
Spring 2012 - Winter 2013 $300,428
Granular Activated Carbon
Reactivate GAC in all 8 filters/3 yrs
$250,000 $83,333 Not biologically active when water is cold; Adsorptive removal of MIB limited to a few months
UV Advanced Oxidation using H2O2
$2.2 million in construction costs
Power and chemical costs vary
MIB and geosmin Sampling GC-MS
Each sample $200
1375 samples $275,000 for 6 years
$46,000
Per week overnighted to Florida
$110 $3000+ Shipping 4-8 sample locations; Timely results are important
4.5 hours a week for sampling at $30/hr
$135 a week $7,000
$56,000
Algal Identification
Collection-1 hr at 2 locations per week
$30/hr
Scope Time-1 hr at 2 locations per week
$30/hr
Cost for ID $120/week $6,240
PAC Additional Costs
Additional sludge created from PAC addition
$5,000
Quarter of operators shift spent loading PAC into equipment
$180/day
Safety equipment $3,500 Masks, gloves, and Tyvek suits
Employee injury $24,000 in hospital costs
6 weeks off after hand surgery
Deer Creek & Walborn Reservoir Watershed Study, 18
June 15, 2016
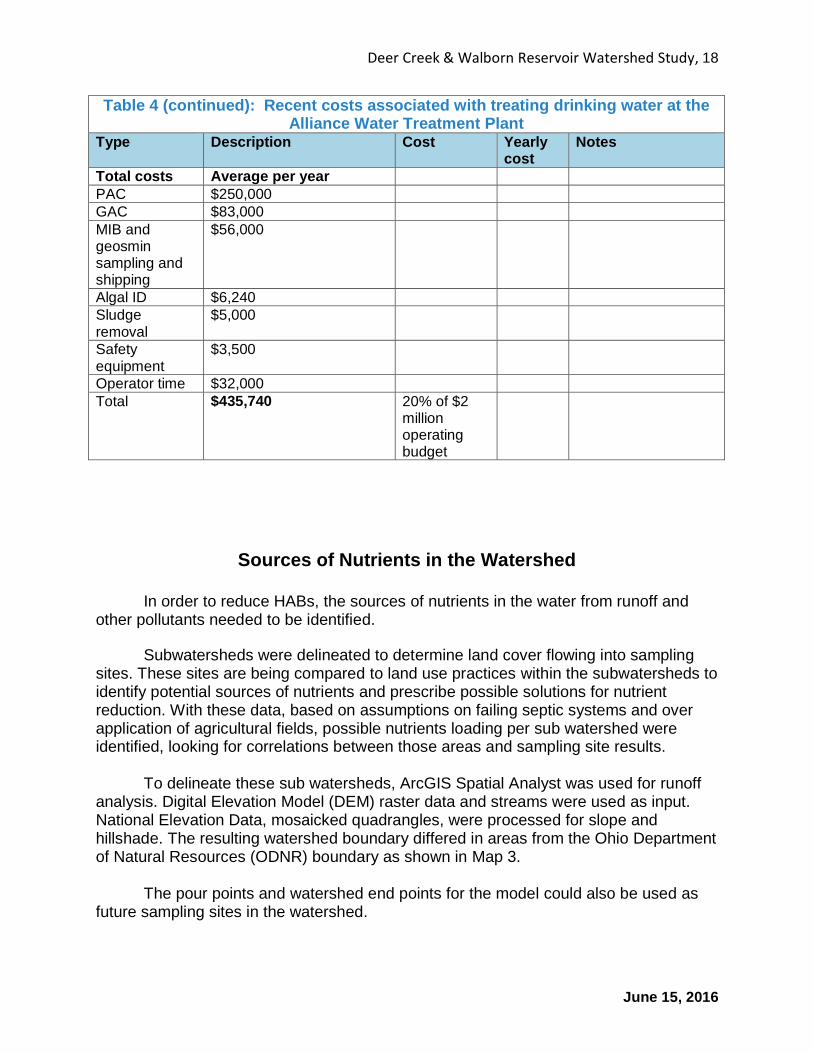
Table 4 (continued): Recent costs associated with treating drinking water at the Alliance Water Treatment Plant
Type Description Cost Yearly cost
Notes
Total costs Average per year
PAC $250,000
GAC $83,000
MIB and geosmin sampling and shipping
$56,000
Algal ID $6,240
Sludge removal
$5,000
Safety equipment
$3,500
Operator time $32,000
Total $435,740 20% of $2 million operating budget
Sources of Nutrients in the Watershed
In order to reduce HABs, the sources of nutrients in the water from runoff and
other pollutants needed to be identified.
Subwatersheds were delineated to determine land cover flowing into sampling sites. These sites are being compared to land use practices within the subwatersheds to identify potential sources of nutrients and prescribe possible solutions for nutrient reduction. With these data, based on assumptions on failing septic systems and over application of agricultural fields, possible nutrients loading per sub watershed were identified, looking for correlations between those areas and sampling site results.
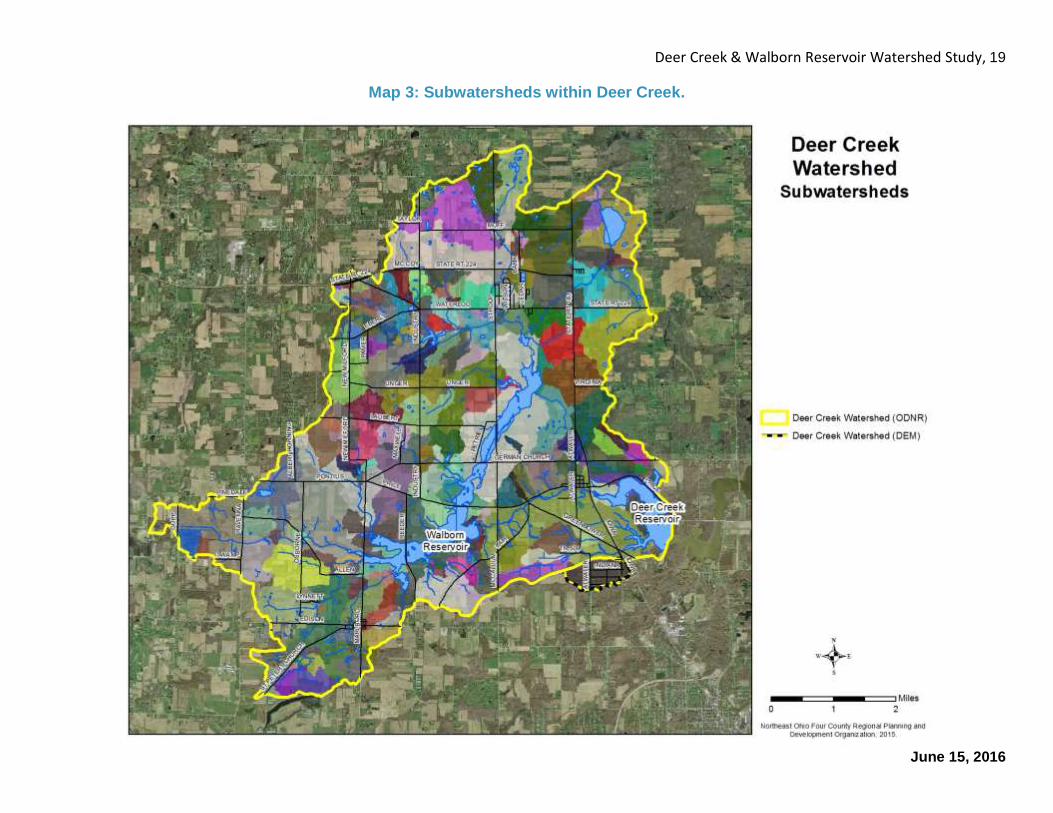
To delineate these sub watersheds, ArcGIS Spatial Analyst was used for runoff analysis. Digital Elevation Model (DEM) raster data and streams were used as input. National Elevation Data, mosaicked quadrangles, were processed for slope and hillshade. The resulting watershed boundary differed in areas from the Ohio Department of Natural Resources (ODNR) boundary as shown in Map 3.
The pour points and watershed end points for the model could also be used as
future sampling sites in the watershed.
Deer Creek & Walborn Reservoir Watershed Study, 19
June 15, 2016
Map 3: Subwatersheds within Deer Creek.

Deer Creek & Walborn Reservoir Watershed Study, 20
June 15, 2016
The Watershed
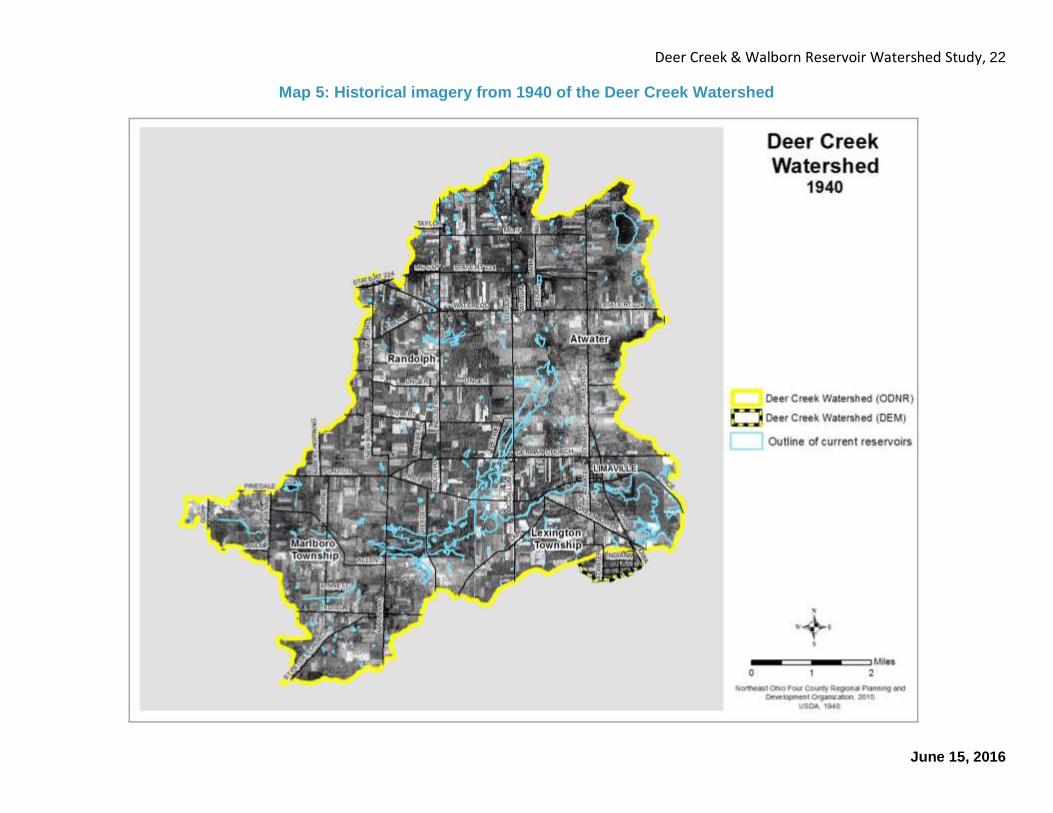
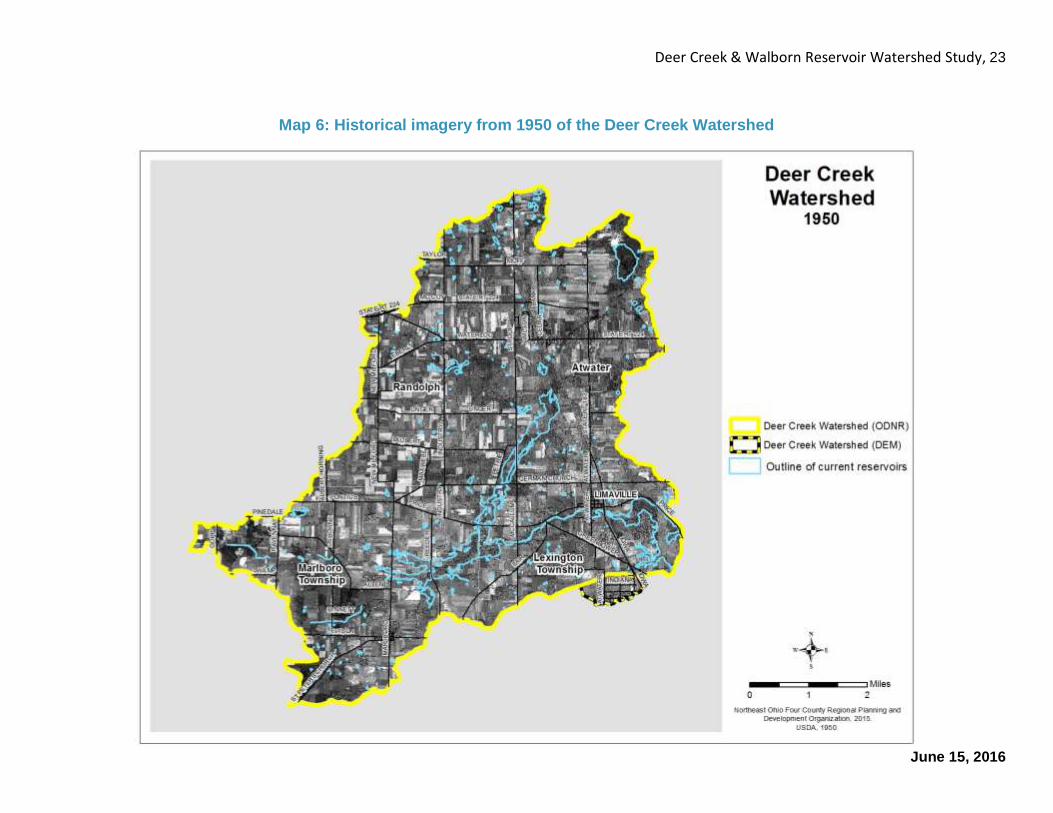
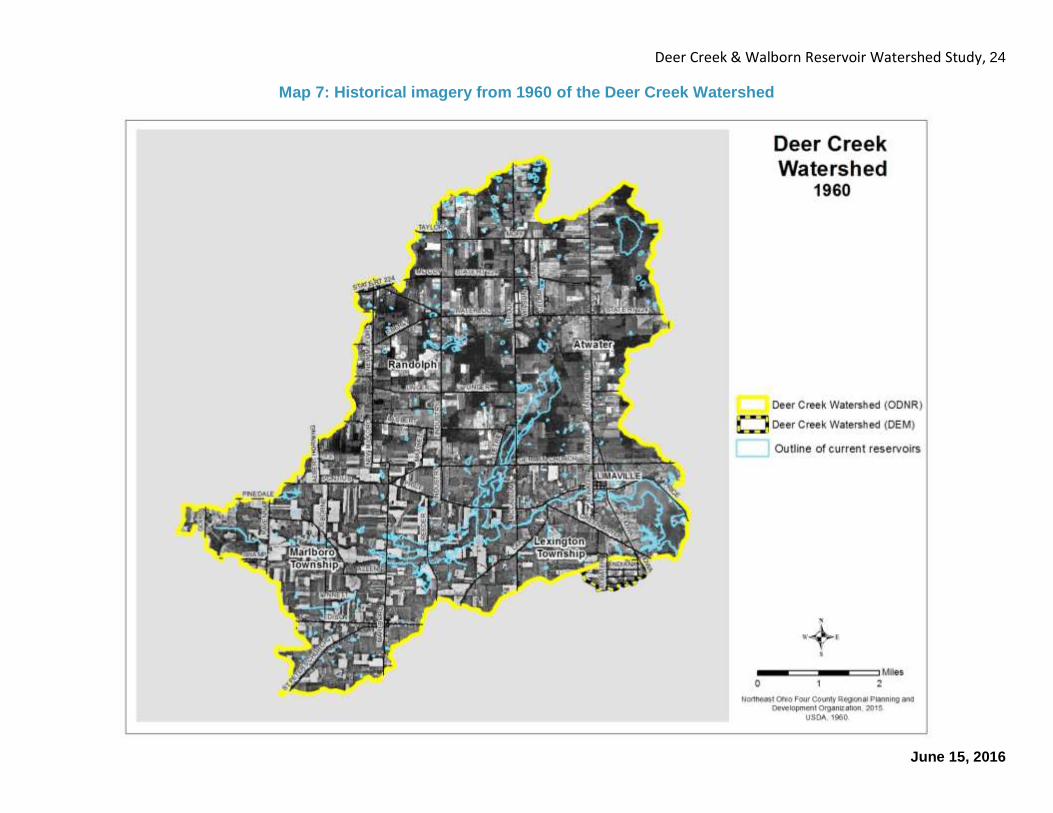
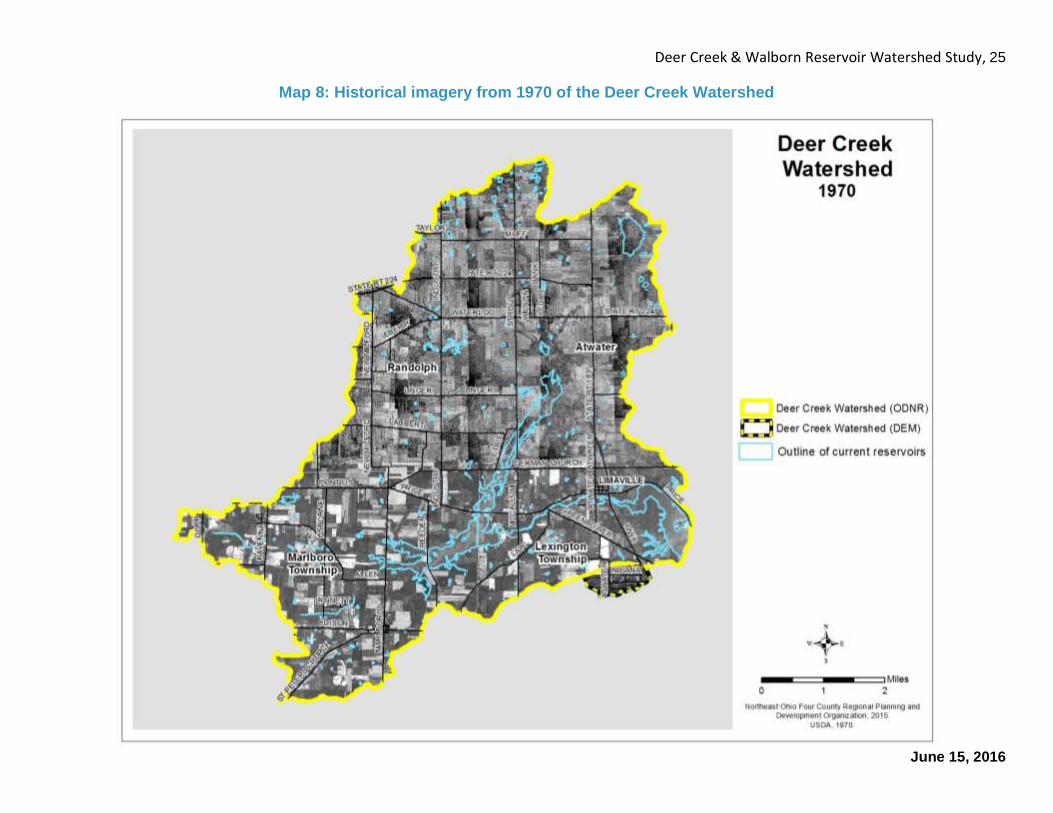
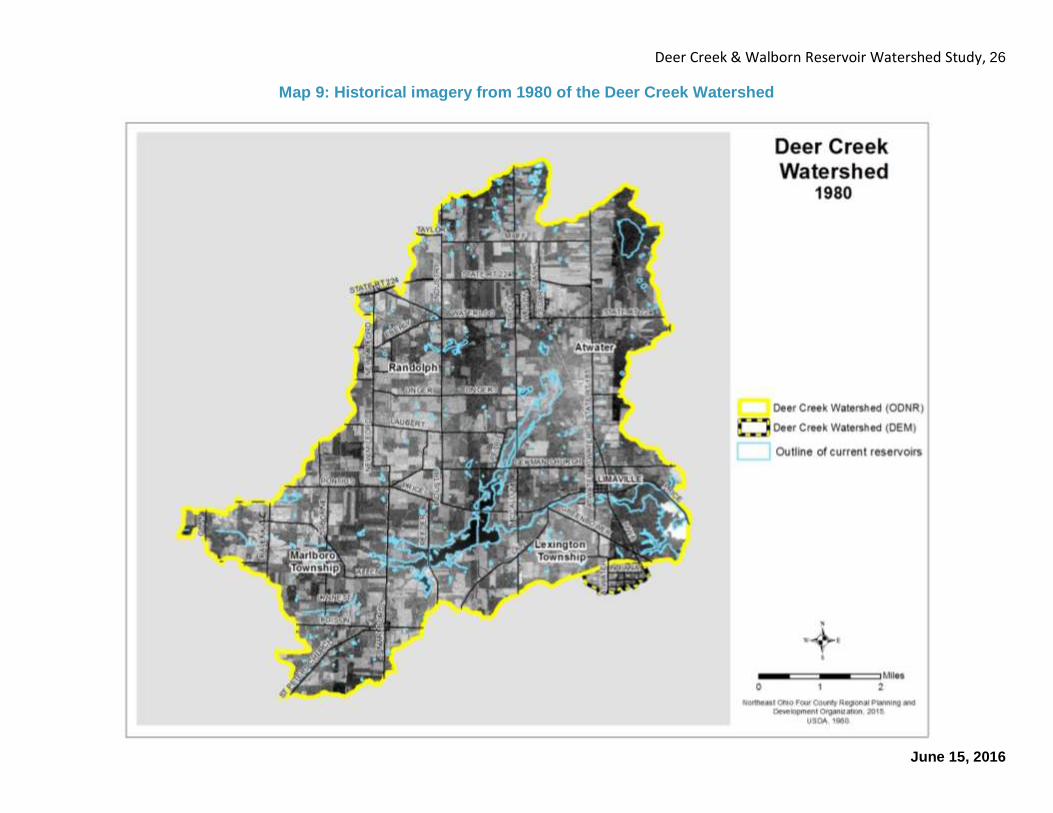
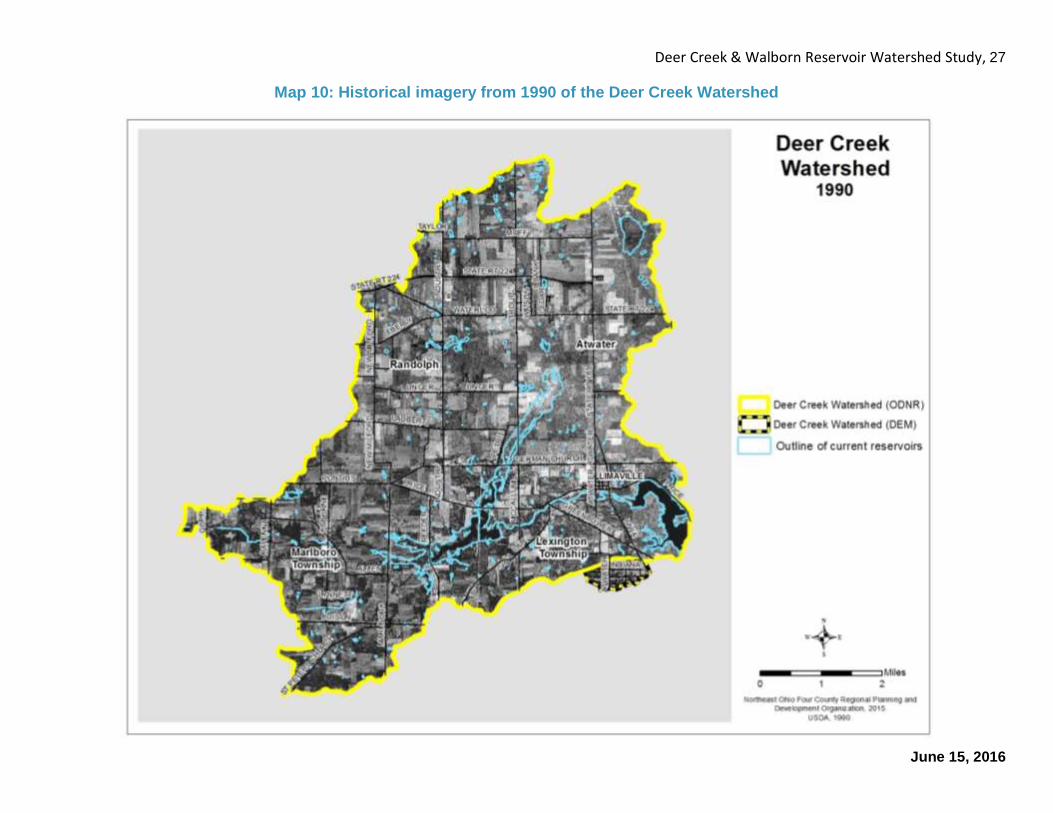
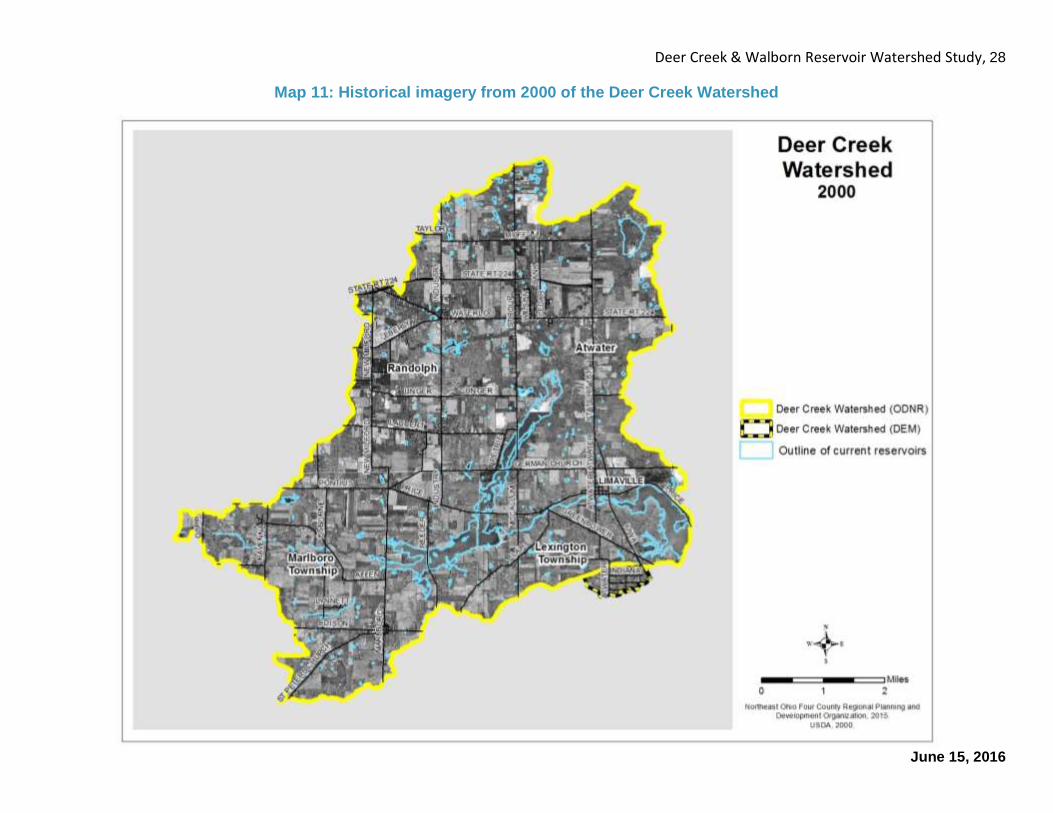
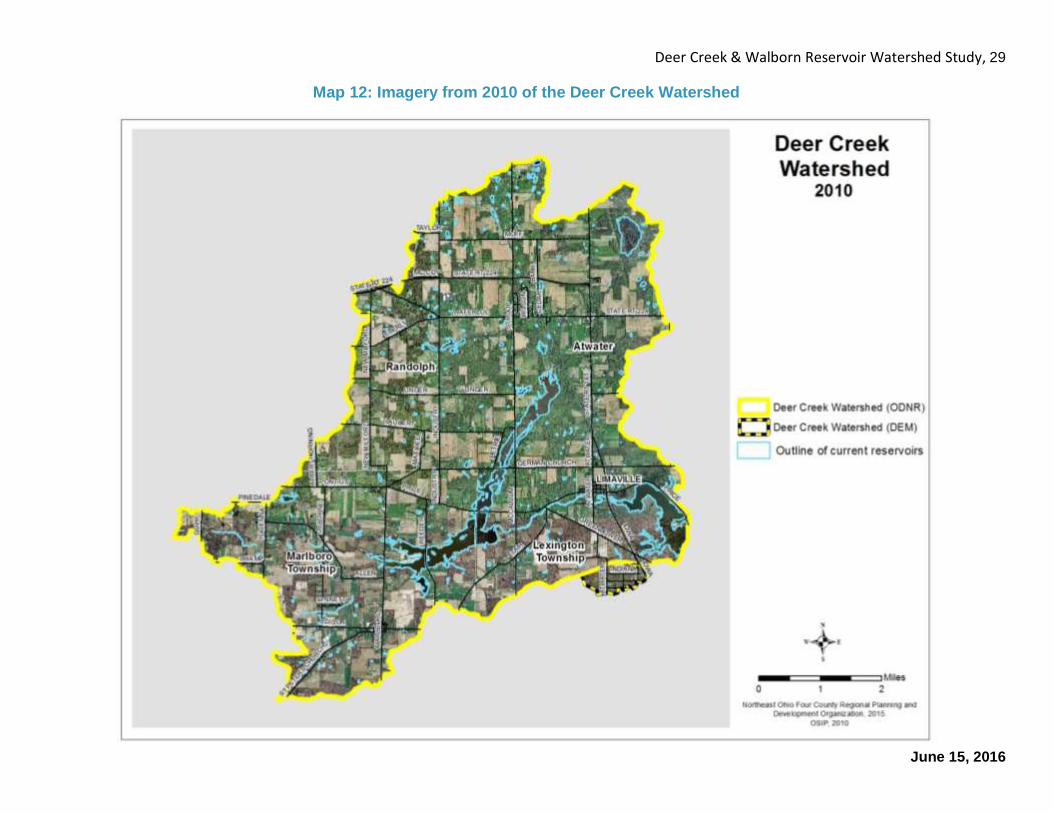
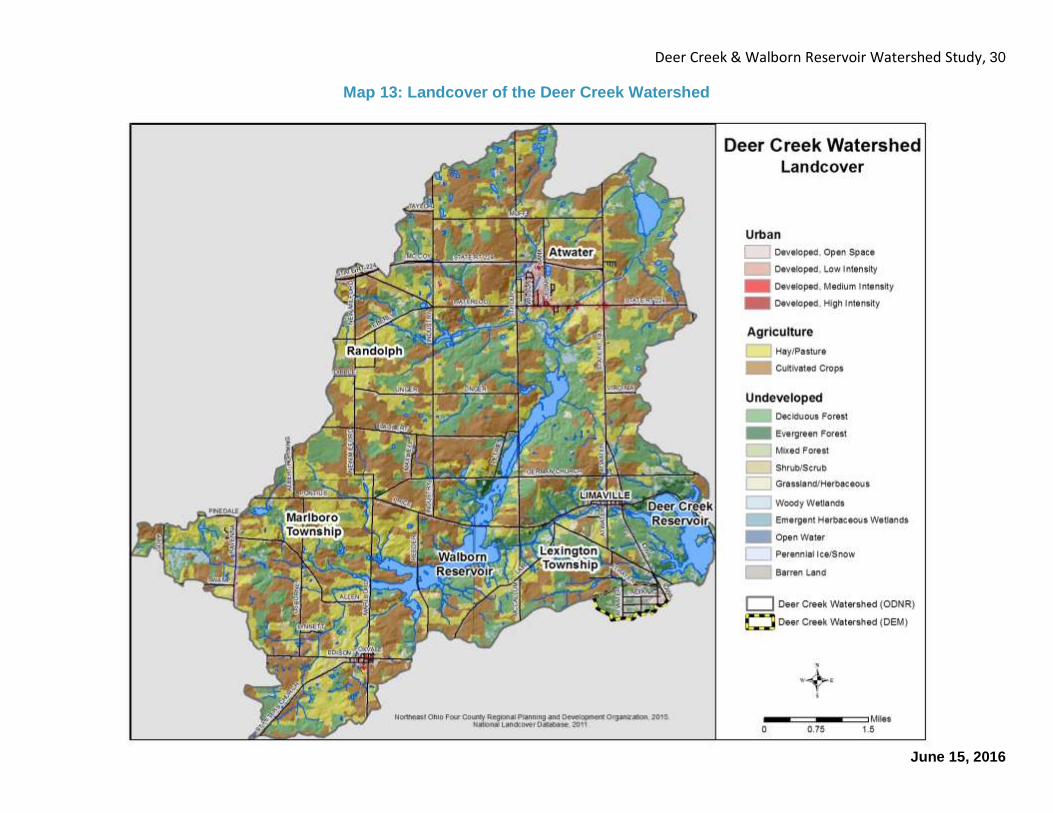
The watershed is made up of Atwater and Randolph Townships in Portage County and Lexington Township, the Village of Limaville, and Marlboro Township in Stark County as shown in Map 4. Appendix 1 shows the Community Profile of residents living in the watershed, and Appendix 2 provides a Business Summary of non-residential land uses. Maps 5 through 12 show historical aerial photography of the watershed over the decades. The watershed has remained predominately rural. The 1940 and 1950 aerial photography show the watershed before the Deer Creek Reservoir was built. Those and the 1960 and 1970 images show the watershed before Dale Walborn Reservoir before it was built. It should be noted the quality and resolution of aerial photography has improved over the years. Map 13 shows recent land cover data developed from satellite imagery.
These land cover categories have been analyzed by grouping them into
undeveloped lands (natural lands and agricultural lands) and developed lands in Table 5.
Table 5. Land and Vegetation Cover (2011)
DESCRIPTION % of Watershed
UNDEVELOPED LANDS
Natural Lands 58.0972
Woodland Resources
Forest-Deciduous 10.9858
Forest-Evergreen 11.9049
Forest-Mixed 2.0587
Successional Resources
Shrub/scrub 21.3577
Wetlands Resources
Wetlands – Wooded 3.8717
Wetlands - Emergent Herbaceous 1.2509
Open Water 5.1776
Agricultural Lands 36.7074
Pasture/Hay 6.7265
Cultivated Crops 15.5124
Grassland/herbaceous 14.4685
DEVELOPED LANDS 5.1954
Open Space 3.2524
Low Intensity 1.4391
Medium Intensity 0.5740
High Intensity 0.1961
Barren Land 1.2056 Source: USGS

Deer Creek & Walborn Reservoir Watershed Study, 21
June 15, 2016
Map 4: Jurisdictions within the Deer Creek Watershed
Deer Creek & Walborn Reservoir Watershed Study, 22
June 15, 2016
Map 5: Historical imagery from 1940 of the Deer Creek Watershed
Deer Creek & Walborn Reservoir Watershed Study, 23
June 15, 2016
Map 6: Historical imagery from 1950 of the Deer Creek Watershed
Deer Creek & Walborn Reservoir Watershed Study, 24
June 15, 2016
Map 7: Historical imagery from 1960 of the Deer Creek Watershed
Deer Creek & Walborn Reservoir Watershed Study, 25
June 15, 2016
Map 8: Historical imagery from 1970 of the Deer Creek Watershed
Deer Creek & Walborn Reservoir Watershed Study, 26
June 15, 2016
Map 9: Historical imagery from 1980 of the Deer Creek Watershed
Deer Creek & Walborn Reservoir Watershed Study, 27
June 15, 2016
Map 10: Historical imagery from 1990 of the Deer Creek Watershed
Deer Creek & Walborn Reservoir Watershed Study, 28
June 15, 2016
Map 11: Historical imagery from 2000 of the Deer Creek Watershed
Deer Creek & Walborn Reservoir Watershed Study, 29
June 15, 2016
Map 12: Imagery from 2010 of the Deer Creek Watershed
Deer Creek & Walborn Reservoir Watershed Study, 30
June 15, 2016
Map 13: Landcover of the Deer Creek Watershed
Deer Creek & Walborn Reservoir Watershed Study, 31
June 15, 2016
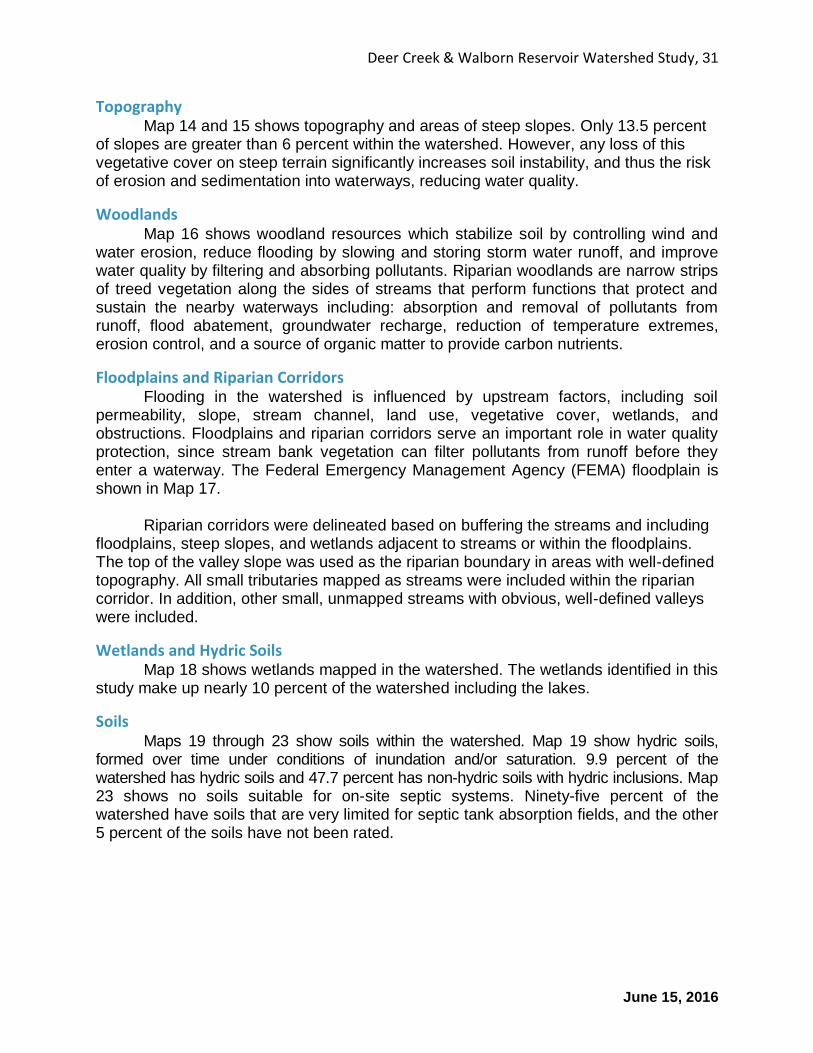
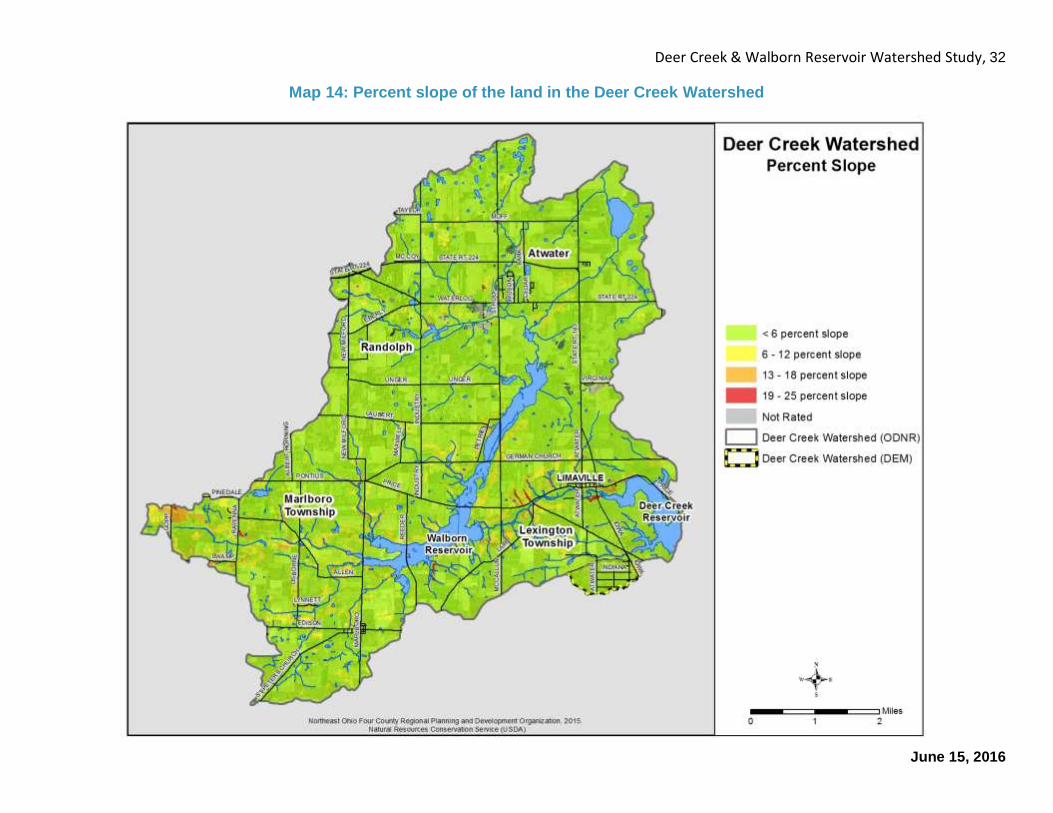
Topography Map 14 and 15 shows topography and areas of steep slopes. Only 13.5 percent
of slopes are greater than 6 percent within the watershed. However, any loss of this vegetative cover on steep terrain significantly increases soil instability, and thus the risk of erosion and sedimentation into waterways, reducing water quality.
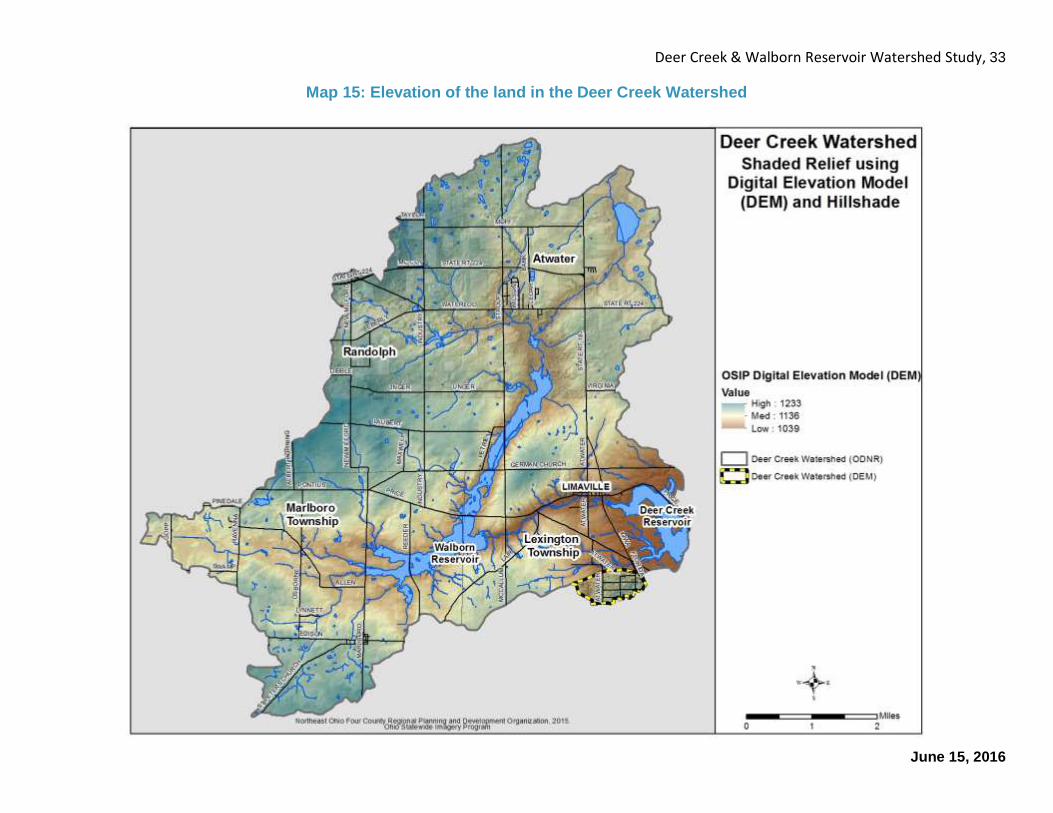
Woodlands Map 16 shows woodland resources which stabilize soil by controlling wind and
water erosion, reduce flooding by slowing and storing storm water runoff, and improve water quality by filtering and absorbing pollutants. Riparian woodlands are narrow strips of treed vegetation along the sides of streams that perform functions that protect and sustain the nearby waterways including: absorption and removal of pollutants from runoff, flood abatement, groundwater recharge, reduction of temperature extremes, erosion control, and a source of organic matter to provide carbon nutrients.
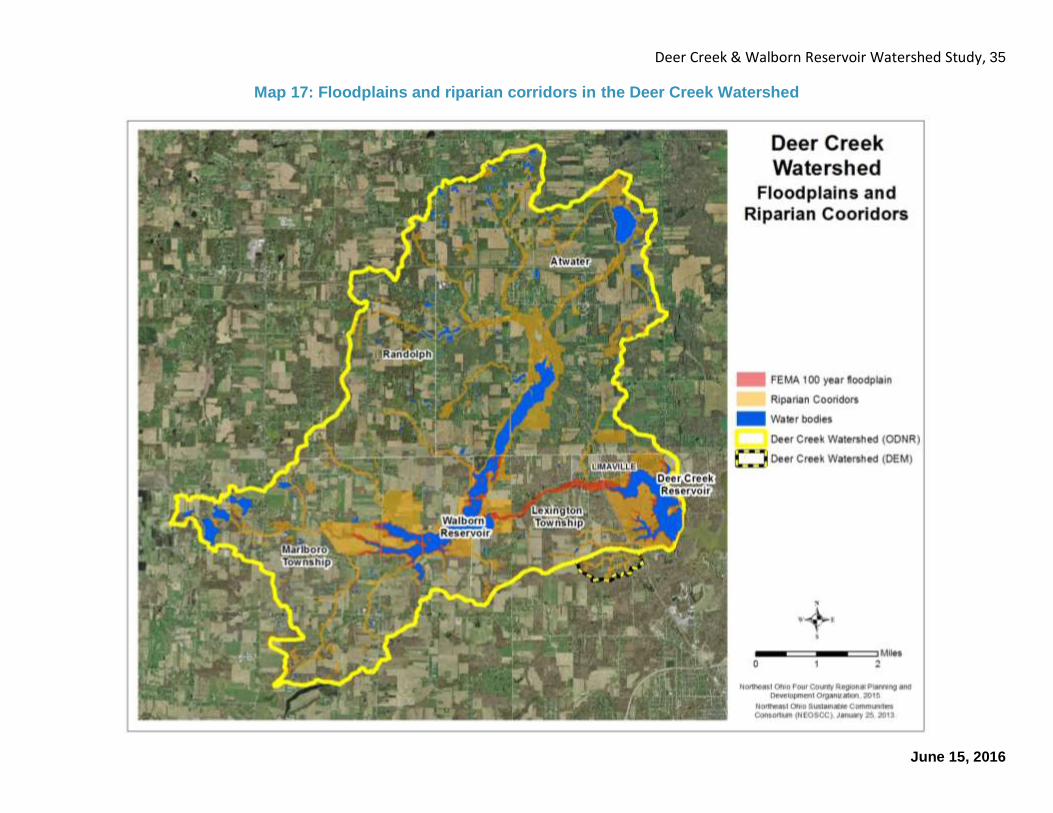
Floodplains and Riparian Corridors Flooding in the watershed is influenced by upstream factors, including soil
permeability, slope, stream channel, land use, vegetative cover, wetlands, and obstructions. Floodplains and riparian corridors serve an important role in water quality protection, since stream bank vegetation can filter pollutants from runoff before they enter a waterway. The Federal Emergency Management Agency (FEMA) floodplain is shown in Map 17.
Riparian corridors were delineated based on buffering the streams and including
floodplains, steep slopes, and wetlands adjacent to streams or within the floodplains. The top of the valley slope was used as the riparian boundary in areas with well-defined topography. All small tributaries mapped as streams were included within the riparian corridor. In addition, other small, unmapped streams with obvious, well-defined valleys were included.
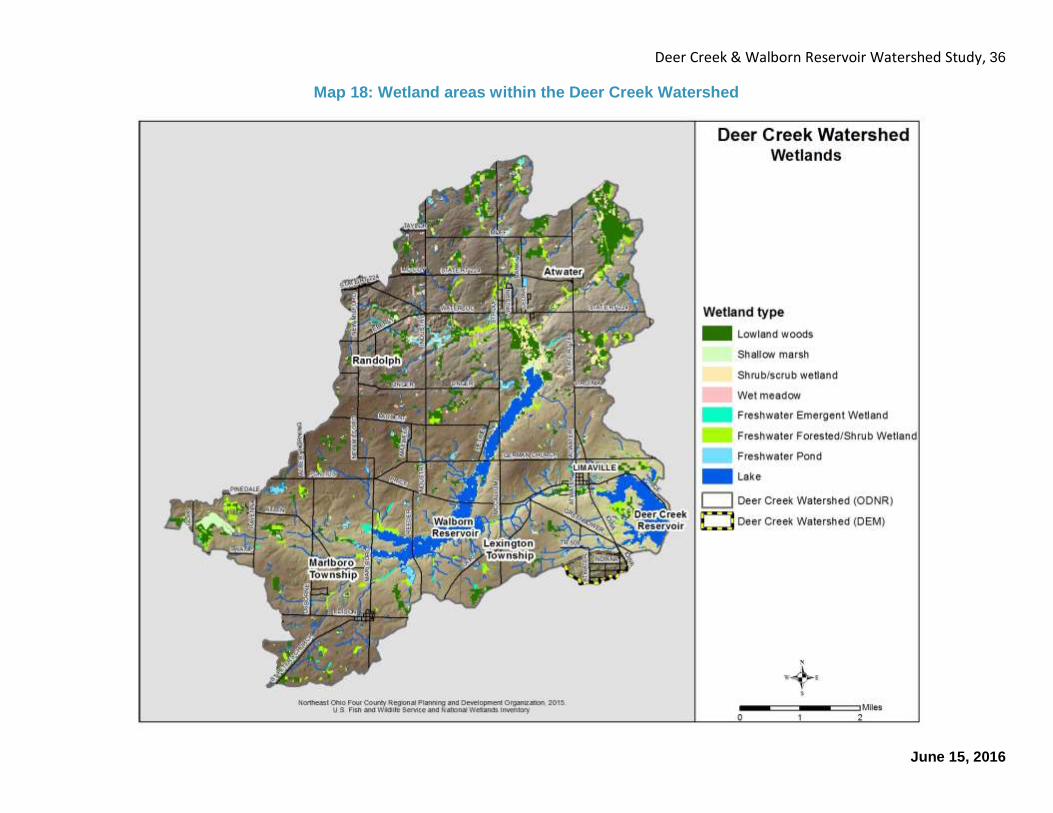
Wetlands and Hydric Soils Map 18 shows wetlands mapped in the watershed. The wetlands identified in this
study make up nearly 10 percent of the watershed including the lakes.
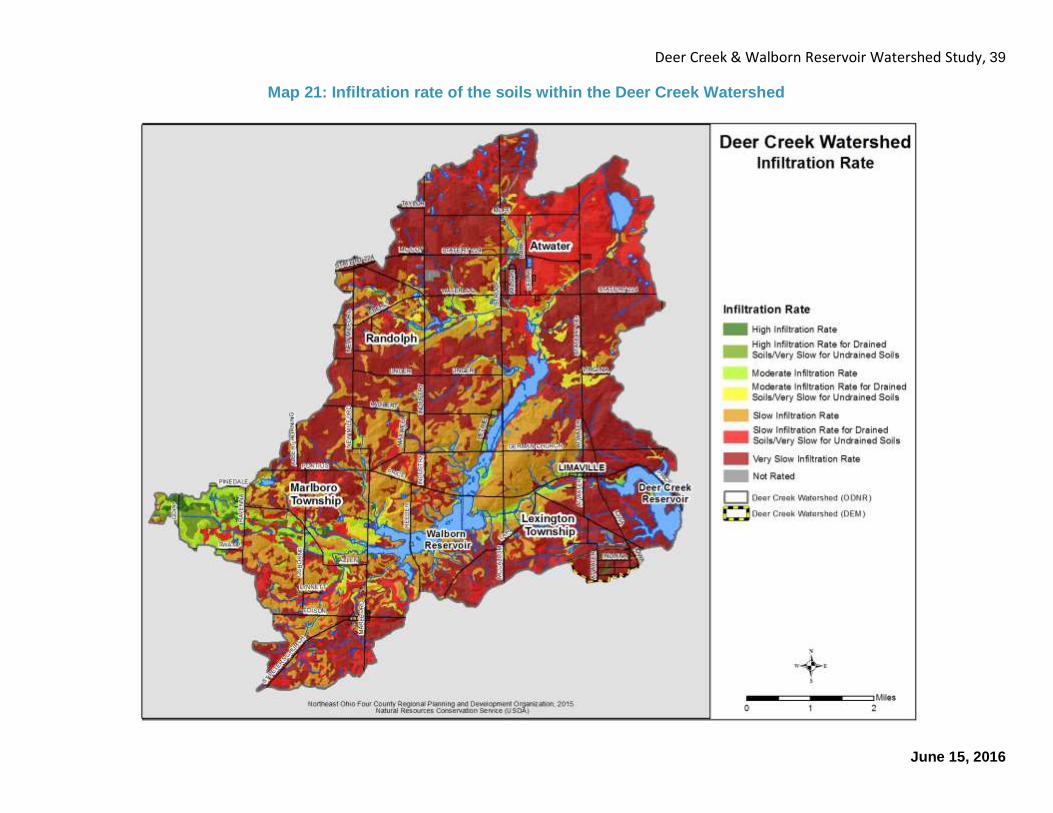
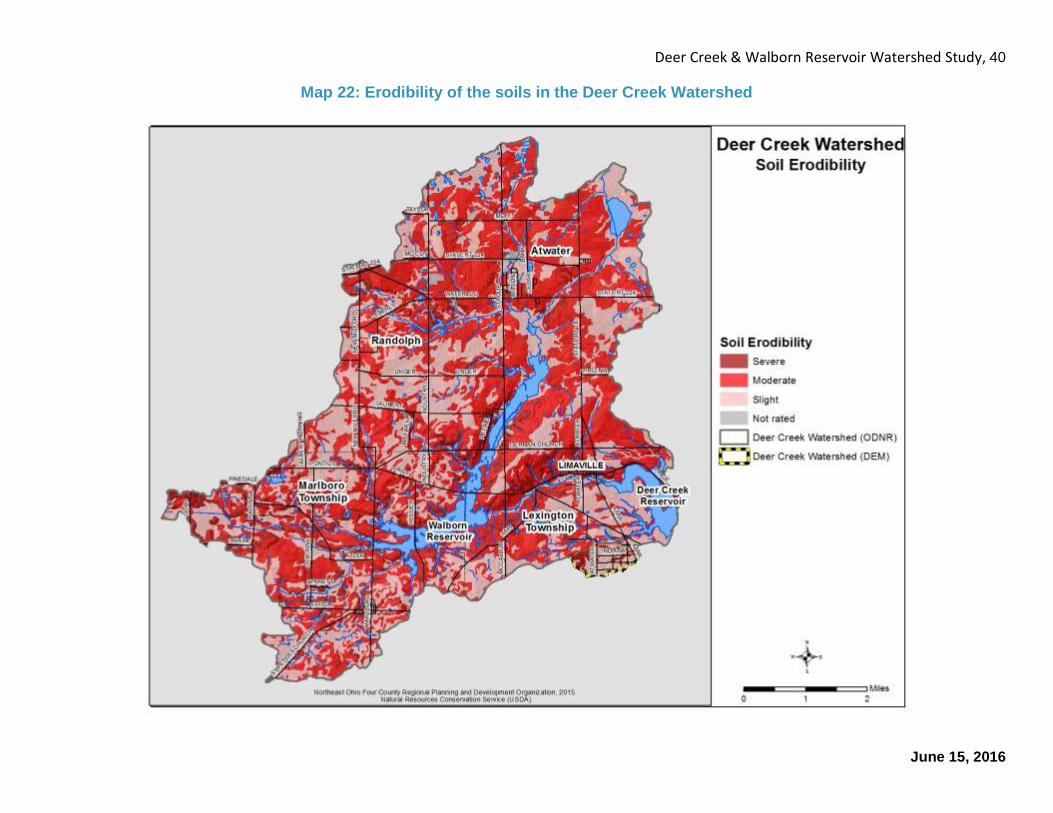
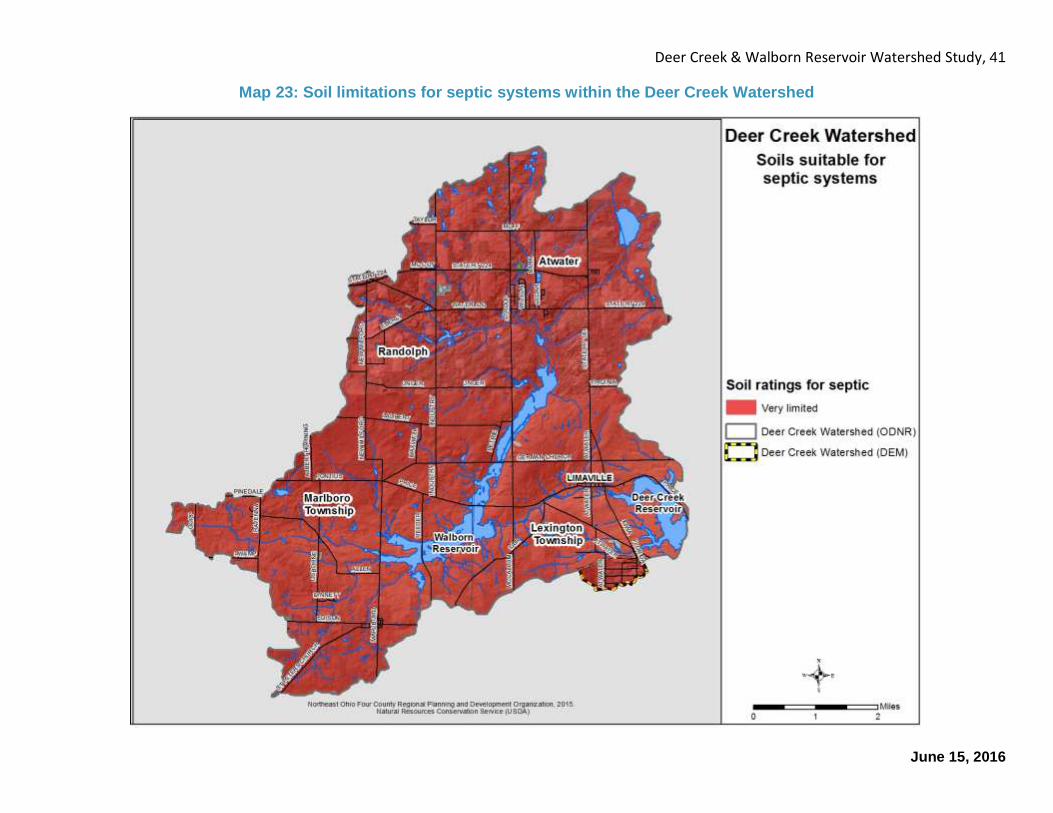
Soils Maps 19 through 23 show soils within the watershed. Map 19 show hydric soils,
formed over time under conditions of inundation and/or saturation. 9.9 percent of the watershed has hydric soils and 47.7 percent has non-hydric soils with hydric inclusions. Map 23 shows no soils suitable for on-site septic systems. Ninety-five percent of the watershed have soils that are very limited for septic tank absorption fields, and the other 5 percent of the soils have not been rated.
Deer Creek & Walborn Reservoir Watershed Study, 32
June 15, 2016
Map 14: Percent slope of the land in the Deer Creek Watershed
Deer Creek & Walborn Reservoir Watershed Study, 33
June 15, 2016
Map 15: Elevation of the land in the Deer Creek Watershed
Deer Creek & Walborn Reservoir Watershed Study, 34
June 15, 2016
Map 16: Protected and woodland areas in the Deer Creek Watershed
Deer Creek & Walborn Reservoir Watershed Study, 35
June 15, 2016
Map 17: Floodplains and riparian corridors in the Deer Creek Watershed
Deer Creek & Walborn Reservoir Watershed Study, 36
June 15, 2016
Map 18: Wetland areas within the Deer Creek Watershed

Deer Creek & Walborn Reservoir Watershed Study, 37
June 15, 2016
Map 19: Hydric soils in the Deer Creek Watershed

Deer Creek & Walborn Reservoir Watershed Study, 38
June 15, 2016
Map 20: Drainage of the soils within the Deer Creek Watershed
Deer Creek & Walborn Reservoir Watershed Study, 39
June 15, 2016
Map 21: Infiltration rate of the soils within the Deer Creek Watershed
Deer Creek & Walborn Reservoir Watershed Study, 40
June 15, 2016
Map 22: Erodibility of the soils in the Deer Creek Watershed
Deer Creek & Walborn Reservoir Watershed Study, 41
June 15, 2016
Map 23: Soil limitations for septic systems within the Deer Creek Watershed

Deer Creek & Walborn Reservoir Watershed Study, 42
June 15, 2016
Point Source Pollution
The EPA defines point source pollution as any single identifiable source of pollution from which pollutants are discharged, such as a pipe or a ditch. The sources are varied: commercial, industrial, agricultural, and residential sites.
Commercial and industrial businesses use hazardous materials in manufacturing or maintenance, and then discharge various wastes from their operations. Point sources of pollution from agriculture may include animal feeding operations, animal waste treatment lagoons, or the storage, handling, mixing, and cleaning areas for pesticides, fertilizers, and petroleum. Residential point sources might include wastewater treatment plants or failing septic systems.
If the facility or landowner does not handle, store, and dispose of wastes properly, these pollutants could end up in the water supply. This may occur through discharges at the end of a pipe to surface water, discharges on the ground that move through the ground with infiltrating rainwater, or direct discharges beneath the ground surface.
National Pollution Discharge Elimination System
Map 24 shows the location of National Pollution Discharge Elimination System (NPDES) permits required for any discharge of pollutants into the waters of the United States. The Atwater WWTP holds a municipal permit as a Publicly-Operated Treatment Works (POTWs), discharging wastewater from sewage treatment or industries connected to the drainage system.
The Ohio EPA uses biological criteria primarily to assess the effects of larger
aquatic pollution sources such as industrial and wastewater treatment facilities that hold NPDES permits. These data can be used to assess the overall health of the waterway and identify potential problems or other trends. Adverse impacts to aquatic habitat (and thus water quality) may stem from point sources (discrete discharge points such as municipal sewage treatment systems or industrial waste outputs) or non-point sources (dispersed sources such as road or agricultural runoff during rainfall events).
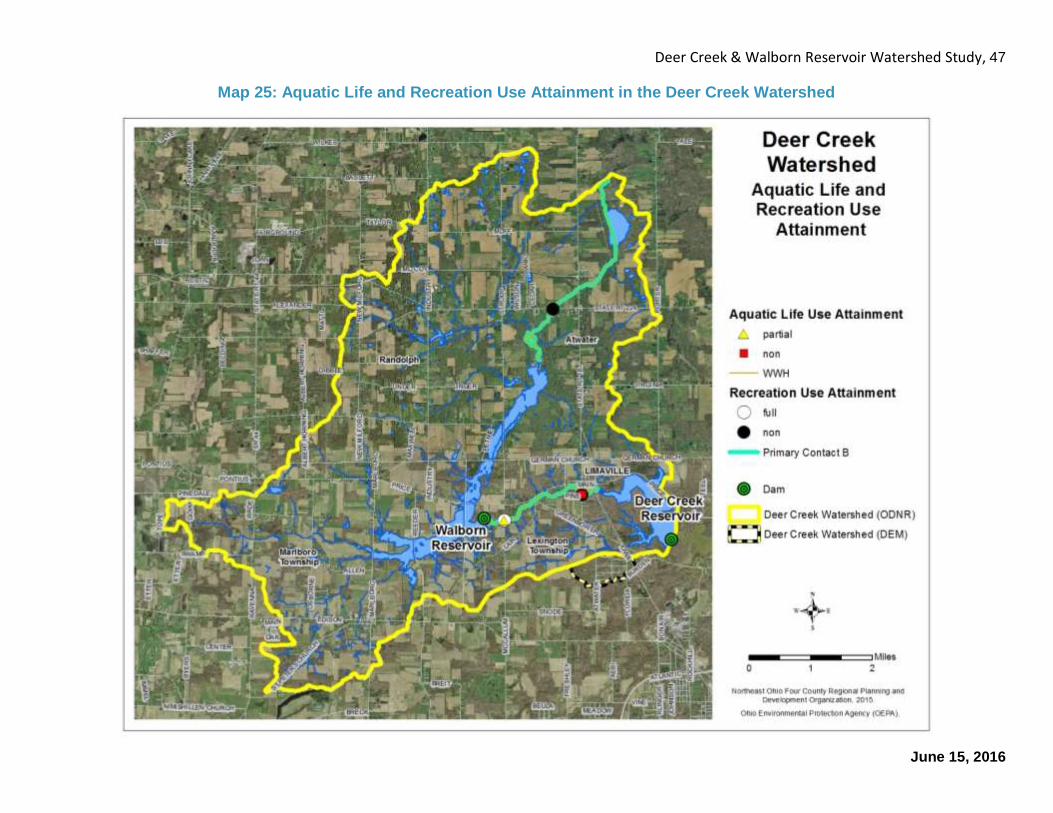
The Clean Water Act use designations for the watershed are shown in Map 25
representing water quality/water use goals for restoring the “chemical, physical, and biological integrity” of the streams. These Ohio EPA use designations help to identify especially sensitive waters and monitor how well water quality goals are being met.
Deer Creek & Walborn Reservoir Watershed Study, 43
June 15, 2016
Waters not attaining their designated use standards are noted as “impaired.” Impaired waters are listed based on the likely contaminants and prioritized for Total Maximum Daily Load (TMDL) development based on the type of impairment and designated use, among other factors. TMDLs were developed for nutrients (e.g., total phosphorus) entering Dale Walborn to shift the trophic conditions from a high state of algae/plant production (eutrophic to hyper-eutrophic) to a mid-range level of productivity (mesotrophic). Listing for TMDL development indicates that the waterbody or watercourse does not support its designated use.
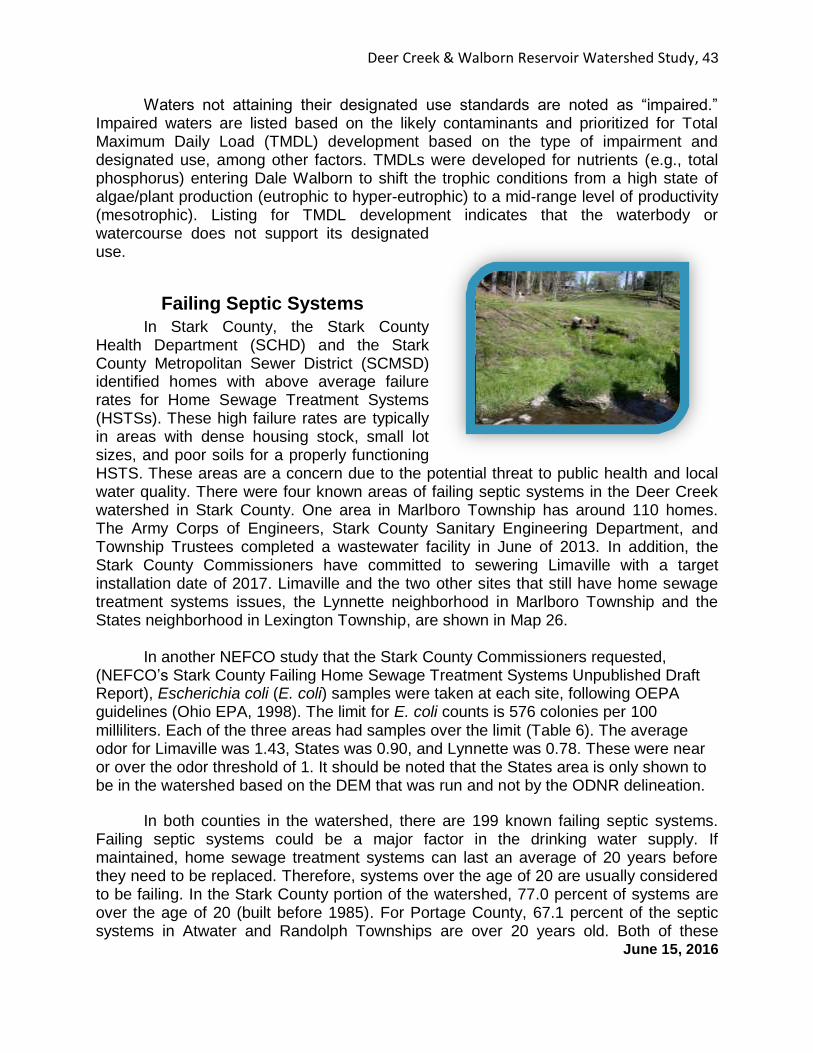
Failing Septic Systems
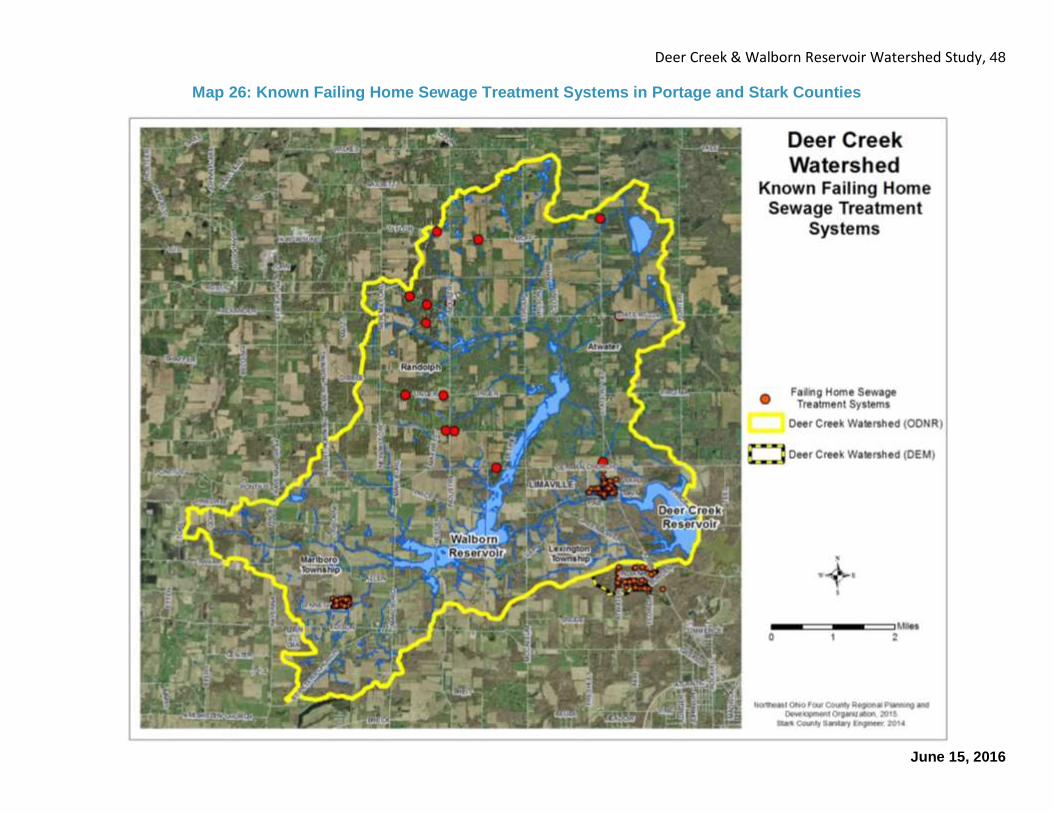
In Stark County, the Stark County Health Department (SCHD) and the Stark County Metropolitan Sewer District (SCMSD) identified homes with above average failure rates for Home Sewage Treatment Systems (HSTSs). These high failure rates are typically in areas with dense housing stock, small lot sizes, and poor soils for a properly functioning HSTS. These areas are a concern due to the potential threat to public health and local water quality. There were four known areas of failing septic systems in the Deer Creek watershed in Stark County. One area in Marlboro Township has around 110 homes. The Army Corps of Engineers, Stark County Sanitary Engineering Department, and Township Trustees completed a wastewater facility in June of 2013. In addition, the Stark County Commissioners have committed to sewering Limaville with a target installation date of 2017. Limaville and the two other sites that still have home sewage treatment systems issues, the Lynnette neighborhood in Marlboro Township and the States neighborhood in Lexington Township, are shown in Map 26.
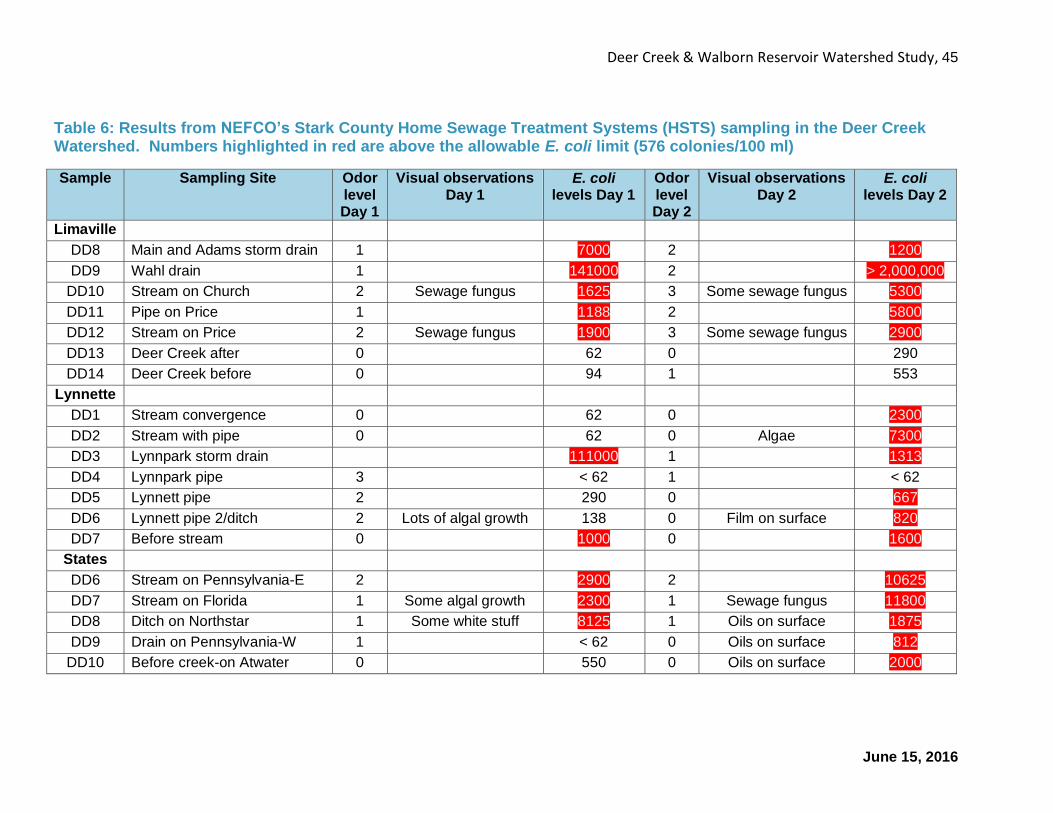
In another NEFCO study that the Stark County Commissioners requested,
(NEFCO’s Stark County Failing Home Sewage Treatment Systems Unpublished Draft Report), Escherichia coli (E. coli) samples were taken at each site, following OEPA guidelines (Ohio EPA, 1998). The limit for E. coli counts is 576 colonies per 100 milliliters. Each of the three areas had samples over the limit (Table 6). The average odor for Limaville was 1.43, States was 0.90, and Lynnette was 0.78. These were near or over the odor threshold of 1. It should be noted that the States area is only shown to be in the watershed based on the DEM that was run and not by the ODNR delineation.
In both counties in the watershed, there are 199 known failing septic systems. Failing septic systems could be a major factor in the drinking water supply. If maintained, home sewage treatment systems can last an average of 20 years before they need to be replaced. Therefore, systems over the age of 20 are usually considered to be failing. In the Stark County portion of the watershed, 77.0 percent of systems are over the age of 20 (built before 1985). For Portage County, 67.1 percent of the septic systems in Atwater and Randolph Townships are over 20 years old. Both of these
Deer Creek & Walborn Reservoir Watershed Study, 44
June 15, 2016
numbers are above the state-wide average (31 percent) for failure rate of septic systems (Ohio Department of Health, 2013). As a result, most of the septic systems within the watershed in both counties should be replaced.
According to the U. S. Census (See Appendix 1), there are 4,918 households
with 2.62 persons as the average household size. If we assume that 70 percent of the septic systems are failing, that could mean 3,443 homes have failing systems with the human waste of 9,020 people discharging at 100 gallons per person into the watershed. Since almost all of the soils in the watershed are very limited for septic systems, it could be assumed that the majority of septic systems are not working correctly within the watershed.
The state average cost of replacing a sewage system is $8,200 but the costs in Northeast Ohio are estimated to be $10,000 to $14,000. Financial assistance for repair and replacement of household sewage treatment systems is very limited at this time. The median household income is $54,782 ($25,222 per capita income) and the average home value is $174,687 (See Appendix 1). Renter occupied houses also make up 14 percent of the households.
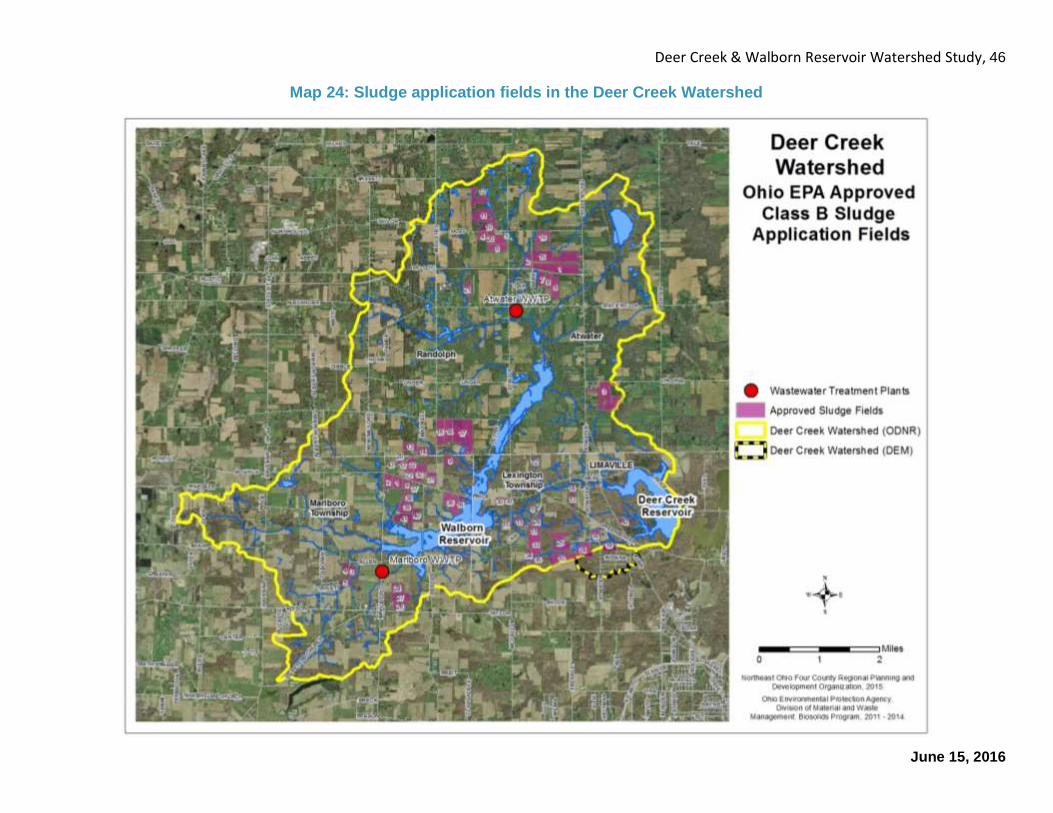
The watershed also has a number of Ohio EPA approved class B sludge
application fields as shown in Map 24. The application of biosolids, sewage sludge, is regulated and can only occur if it is injected or immediately incorporated. The ground cannot be frozen or snow-covered. Biosolids cannot be used at a rate that exceeds 5,000 gallons per acre and they cannot be used on more than 20 contiguous acres. The slope of the land cannot be greater than six per cent and a 200 foot isolation distance must be maintained. Beneficial use site drainage and tile outlets must be visually monitored at the end of beneficial use, and periodically afterwards when the weather is likely to produce runoff until the biosolids have been assimilated into the site and are no longer likely to discharge into surface waters. The soil for a beneficial use site must be tested every 3 years and the soil pH must be 5.5 or greater. No one shall beneficially use biosolids within the sanitary isolation distance a public water system must maintain for a drinking water supply well or within an emergency management zone for a public water system using surface water. Where no emergency management zone has been endorsed by the Ohio EPA, the isolation distance shall be a circle with a radius of 1500 feet from the intake. If the drinking water source protection area is underlain by fractured bedrock and has been determined to be highly susceptible to contamination, the isolation distance shall include the entire drinking water source protection area.
Deer Creek & Walborn Reservoir Watershed Study, 45
June 15, 2016
Table 6: Results from NEFCO’s Stark County Home Sewage Treatment Systems (HSTS) sampling in the Deer Creek Watershed. Numbers highlighted in red are above the allowable E. coli limit (576 colonies/100 ml)
Sample Sampling Site Odor level Day 1
Visual observations Day 1
E. coli levels Day 1
Odor level Day 2
Visual observations Day 2
E. coli levels Day 2
Limaville
DD8 Main and Adams storm drain 1 7000 2 1200
DD9 Wahl drain 1 141000 2 > 2,000,000
DD10 Stream on Church 2 Sewage fungus 1625 3 Some sewage fungus 5300
DD11 Pipe on Price 1 1188 2 5800
DD12 Stream on Price 2 Sewage fungus 1900 3 Some sewage fungus 2900
DD13 Deer Creek after 0 62 0 290
DD14 Deer Creek before 0 94 1 553
Lynnette
DD1 Stream convergence 0 62 0 2300
DD2 Stream with pipe 0 62 0 Algae 7300
DD3 Lynnpark storm drain 111000 1 1313
DD4 Lynnpark pipe 3 < 62 1 < 62
DD5 Lynnett pipe 2 290 0 667
DD6 Lynnett pipe 2/ditch 2 Lots of algal growth 138 0 Film on surface 820
DD7 Before stream 0 1000 0 1600
States
DD6 Stream on Pennsylvania-E 2 2900 2 10625
DD7 Stream on Florida 1 Some algal growth 2300 1 Sewage fungus 11800
DD8 Ditch on Northstar 1 Some white stuff 8125 1 Oils on surface 1875
DD9 Drain on Pennsylvania-W 1 < 62 0 Oils on surface 812
DD10 Before creek-on Atwater 0 550 0 Oils on surface 2000
Deer Creek & Walborn Reservoir Watershed Study, 46
June 15, 2016
Map 24: Sludge application fields in the Deer Creek Watershed
Deer Creek & Walborn Reservoir Watershed Study, 47
June 15, 2016
Map 25: Aquatic Life and Recreation Use Attainment in the Deer Creek Watershed
Deer Creek & Walborn Reservoir Watershed Study, 48
June 15, 2016
Map 26: Known Failing Home Sewage Treatment Systems in Portage and Stark Counties
Deer Creek & Walborn Reservoir Watershed Study, 49
June 15, 2016
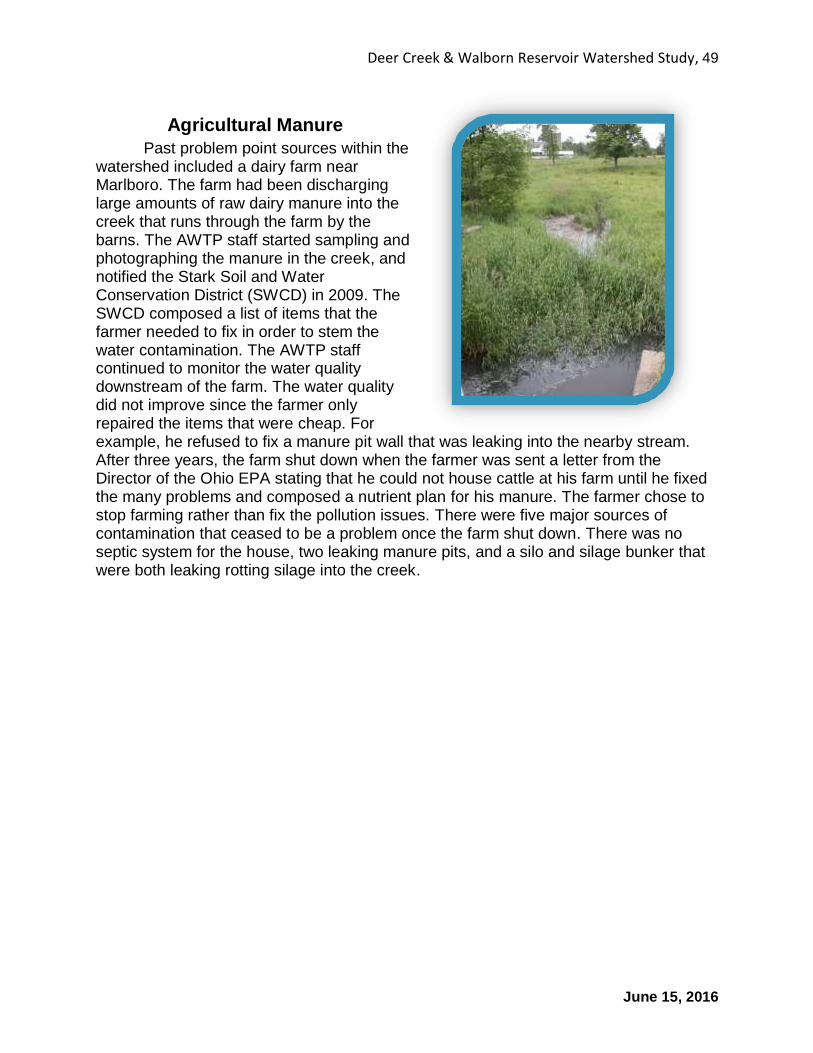
Agricultural Manure
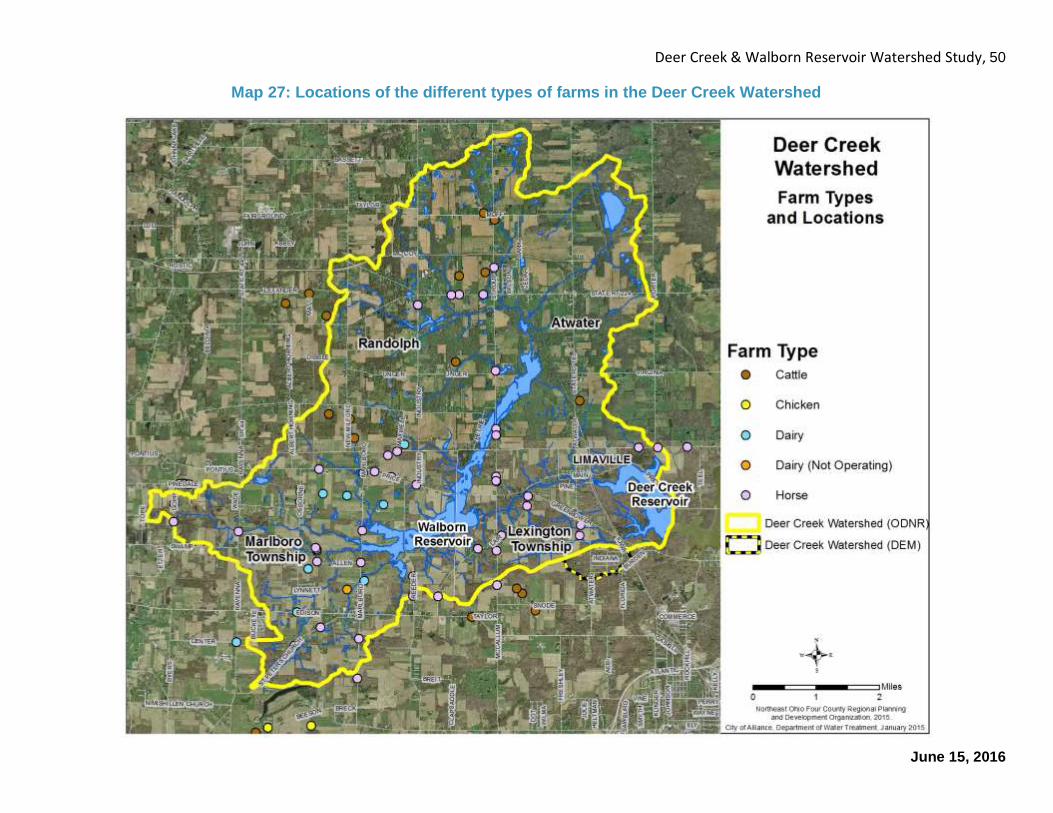
Past problem point sources within the watershed included a dairy farm near Marlboro. The farm had been discharging large amounts of raw dairy manure into the creek that runs through the farm by the barns. The AWTP staff started sampling and photographing the manure in the creek, and notified the Stark Soil and Water Conservation District (SWCD) in 2009. The SWCD composed a list of items that the farmer needed to fix in order to stem the water contamination. The AWTP staff continued to monitor the water quality downstream of the farm. The water quality did not improve since the farmer only repaired the items that were cheap. For example, he refused to fix a manure pit wall that was leaking into the nearby stream. After three years, the farm shut down when the farmer was sent a letter from the Director of the Ohio EPA stating that he could not house cattle at his farm until he fixed the many problems and composed a nutrient plan for his manure. The farmer chose to stop farming rather than fix the pollution issues. There were five major sources of contamination that ceased to be a problem once the farm shut down. There was no septic system for the house, two leaking manure pits, and a silo and silage bunker that were both leaking rotting silage into the creek.
Deer Creek & Walborn Reservoir Watershed Study, 50
June 15, 2016
Map 27: Locations of the different types of farms in the Deer Creek Watershed
Deer Creek & Walborn Reservoir Watershed Study, 51
June 15, 2016
Nonpoint Source Impacts to Water Quality
Water quality can be adversely affected by non-point (dispersed) sources (NPS), such as failing septic systems (as noted above) or runoff from agricultural settings. Storm water runoff from agricultural uses carries soil, pathogens, and other pollutants from streets, eroded sediment, pesticides, and fertilizers. Unlike point sources of pollution, NPS pollution is difficult to identify, manage, and quantify. There are no pipe or outflow sources to monitor, and it can be difficult to locate sources and the pathways these pollutants travel into downstream receiving waters.
Nonpoint source pollution is caused by rainfall, snowmelt, and other sources of
water across the landscape. As the water moves over a surface, it picks up pollutants and sediments that are then carried to water bodies. Fertilizers, sediment, agricultural runoff, and organic waste from sewage are a few sources of phosphorus into the environment. The pollutant load caused by nonpoint sources can be calculated by subtracting the point source pollution inputs from the total watershed output (Ohio EPA, 2010). Nonetheless, sources of nonpoint contamination are difficult to quantify.
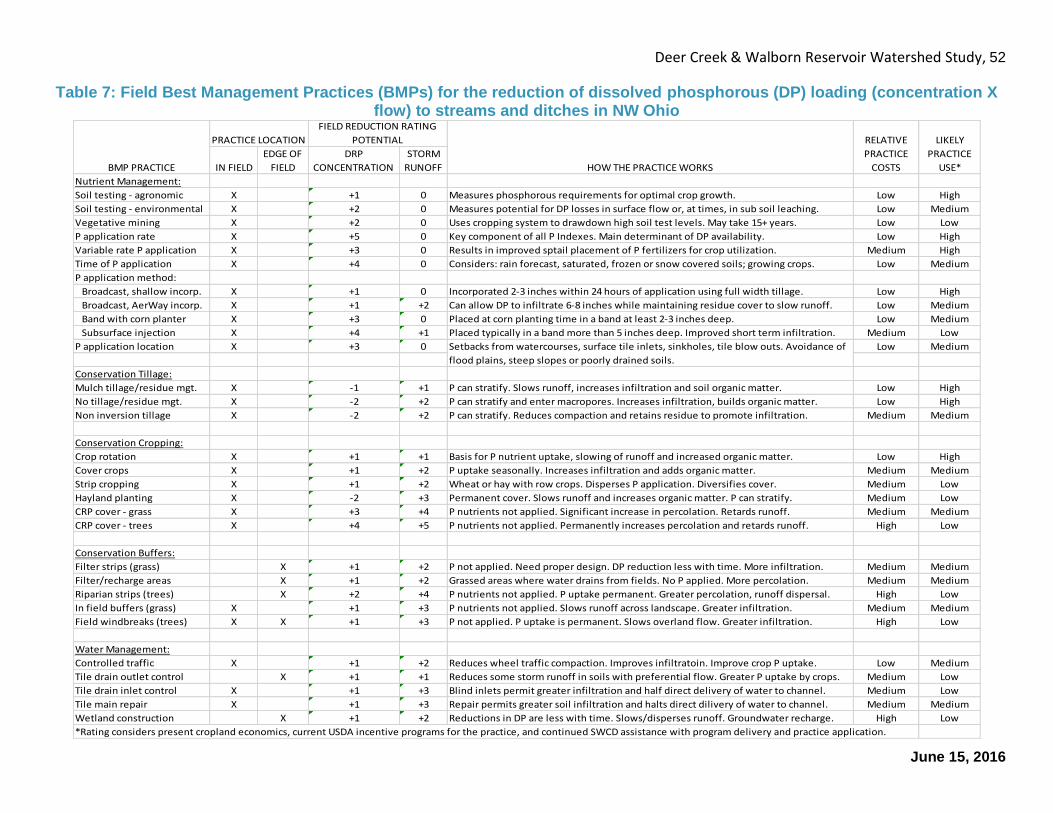
Water quality is reflective of the surrounding landscape and any efforts to
preserve, protect, or improve the integrity of rivers, streams, and lakes should address the long-term management of watersheds. In order to limit the amount of phosphorus entering a water body from nonpoint sources, best management practices (BMPs) are implemented (Table 7). The United States Department of Agriculture (USDA) Natural Resources Conservation Service (NRCS) has developed conservation BMPs that serve to reduce, if not eliminate, the problems caused by a variety of activities. In a technical support document (TSD) written for the Mahoning River in 2006, the Ohio EPA states that siltation is a cause of impairment to Deer Creek (Ohio EPA, 2008). Siltation occurs when sediment or soil settles onto the rocks, logs, and other substrate that make up the stream bed. Sediment, the number one water pollutant, carries pollutants like phosphorus and other nutrients into water bodies.
The TSD report also found nutrient enriched conditions being exported from Dale
Walborn reservoir (e.g., high nutrient loading and algae). TMDLs were developed for nutrients (total phosphorus) entering Dale Walborn in an effort to shift the trophic conditions from a high state of algae/plant production (eutrophic to hyper-eutrophic) to a mid-range level of productivity (mesotrophic). Controlling nutrients to the lake will reduce their export and subsequent detrimental effects to downstream habitats as well as limit the amount of dead and/or living algae which likewise impairs habitat and other aspect of the aquatic community.
The report called for phosphorus reductions to address eutrophic conditions in
the reservoir systems as well as in-stream eutrophic conditions separate from this reservoir complex. The TMDLs and allocations for each of these environmental settings were different in terms of how the eutrophic conditions impact the aquatic community of the streams as well as the methods used to determine the allowable loading. Because the median total nitrogen concentration of their model results were within proposed Ohio’s Lake Habitat Criteria, reduction estimates and allocations were not proposed for total nitrogen.
Deer Creek & Walborn Reservoir Watershed Study, 52
June 15, 2016
Table 7: Field Best Management Practices (BMPs) for the reduction of dissolved phosphorous (DP) loading (concentration X flow) to streams and ditches in NW Ohio
IN FIELD
EDGE OF
FIELD
DRP
CONCENTRATION
STORM
RUNOFF
Nutrient Management:
Soil testing - agronomic X +1 0 Measures phosphorous requirements for optimal crop growth. Low High
Soil testing - environmental X +2 0 Measures potential for DP losses in surface flow or, at times, in sub soil leaching. Low Medium
Vegetative mining X +2 0 Uses cropping system to drawdown high soil test levels. May take 15+ years. Low Low
P application rate X +5 0 Key component of all P Indexes. Main determinant of DP availability. Low High
Variable rate P application X +3 0 Results in improved sptail placement of P fertilizers for crop utilization. Medium High
Time of P application X +4 0 Considers: rain forecast, saturated, frozen or snow covered soils; growing crops. Low Medium
P application method:
Broadcast, shallow incorp. X +1 0 Incorporated 2-3 inches within 24 hours of application using full width tillage. Low High
Broadcast, AerWay incorp. X +1 +2 Can allow DP to infiltrate 6-8 inches while maintaining residue cover to slow runoff. Low Medium
Band with corn planter X +3 0 Placed at corn planting time in a band at least 2-3 inches deep. Low Medium
Subsurface injection X +4 +1 Placed typically in a band more than 5 inches deep. Improved short term infiltration. Medium Low
P application location X +3 0 Low Medium
Conservation Tillage:
Mulch tillage/residue mgt. X -1 +1 P can stratify. Slows runoff, increases infiltration and soil organic matter. Low High
No tillage/residue mgt. X -2 +2 P can stratify and enter macropores. Increases infiltration, builds organic matter. Low High
Non inversion tillage X -2 +2 P can stratify. Reduces compaction and retains residue to promote infiltration. Medium Medium
Conservation Cropping:
Crop rotation X +1 +1 Basis for P nutrient uptake, slowing of runoff and increased organic matter. Low High
Cover crops X +1 +2 P uptake seasonally. Increases infiltration and adds organic matter. Medium Medium
Strip cropping X +1 +2 Wheat or hay with row crops. Disperses P application. Diversifies cover. Medium Low
Hayland planting X -2 +3 Permanent cover. Slows runoff and increases organic matter. P can stratify. Medium Low
CRP cover - grass X +3 +4 P nutrients not applied. Significant increase in percolation. Retards runoff. Medium Medium
CRP cover - trees X +4 +5 P nutrients not applied. Permanently increases percolation and retards runoff. High Low
Conservation Buffers:
Filter strips (grass) X +1 +2 P not applied. Need proper design. DP reduction less with time. More infiltration. Medium Medium
Filter/recharge areas X +1 +2 Grassed areas where water drains from fields. No P applied. More percolation. Medium Medium
Riparian strips (trees) X +2 +4 P nutrients not applied. P uptake permanent. Greater percolation, runoff dispersal. High Low
In field buffers (grass) X +1 +3 P nutrients not applied. Slows runoff across landscape. Greater infiltration. Medium Medium
Field windbreaks (trees) X X +1 +3 P not applied. P uptake is permanent. Slows overland flow. Greater infiltration. High Low
Water Management:
Controlled traffic X +1 +2 Reduces wheel traffic compaction. Improves infiltratoin. Improve crop P uptake. Low Medium
Tile drain outlet control X +1 +1 Reduces some storm runoff in soils with preferential flow. Greater P uptake by crops. Medium Low
Tile drain inlet control X +1 +3 Blind inlets permit greater infiltration and half direct delivery of water to channel. Medium Low
Tile main repair X +1 +3 Repair permits greater soil infiltration and halts direct dilivery of water to channel. Medium Medium
Wetland construction X +1 +2 Reductions in DP are less with time. Slows/disperses runoff. Groundwater recharge. High Low
*Rating considers present cropland economics, current USDA incentive programs for the practice, and continued SWCD assistance with program delivery and practice application.
BMP PRACTICE
PRACTICE LOCATION
FIELD REDUCTION RATING
POTENTIAL RELATIVE
PRACTICE
COSTS
LIKELY
PRACTICE
USE*HOW THE PRACTICE WORKS
Setbacks from watercourses, surface tile inlets, sinkholes, tile blow outs. Avoidance of
flood plains, steep slopes or poorly drained soils.
Deer Creek & Walborn Reservoir Watershed Study, 53
June 15, 2016
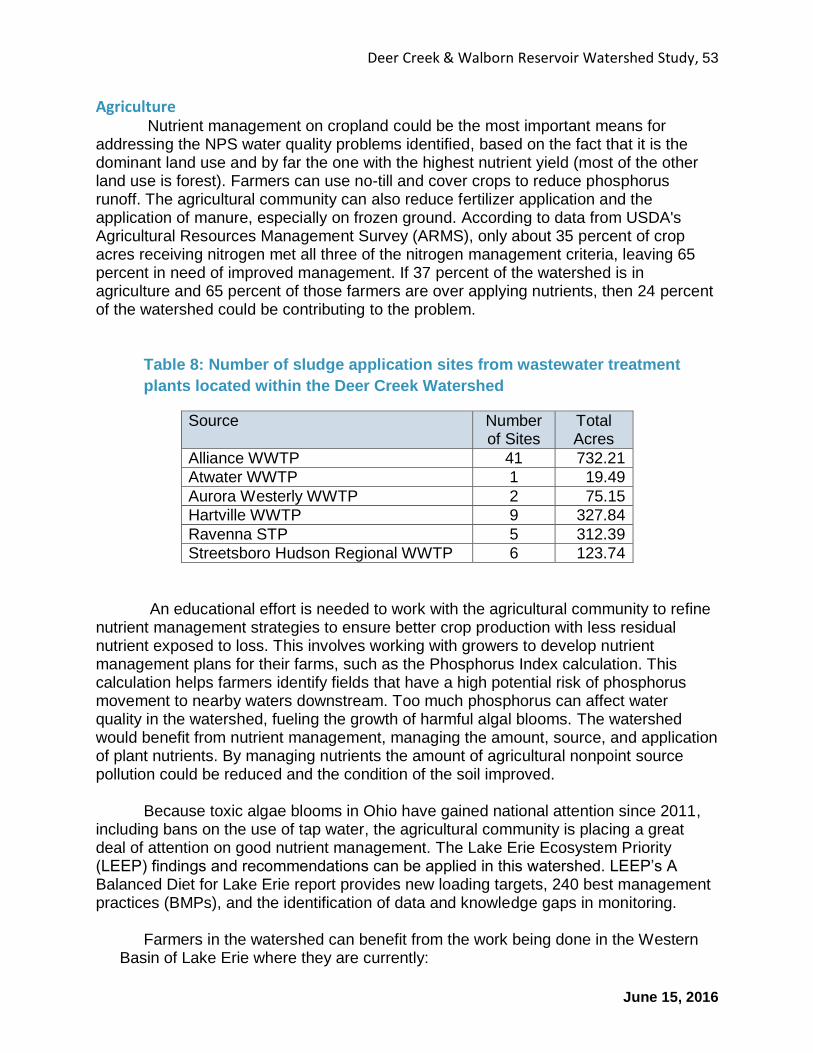
Agriculture Nutrient management on cropland could be the most important means for
addressing the NPS water quality problems identified, based on the fact that it is the dominant land use and by far the one with the highest nutrient yield (most of the other land use is forest). Farmers can use no-till and cover crops to reduce phosphorus runoff. The agricultural community can also reduce fertilizer application and the application of manure, especially on frozen ground. According to data from USDA's Agricultural Resources Management Survey (ARMS), only about 35 percent of crop acres receiving nitrogen met all three of the nitrogen management criteria, leaving 65 percent in need of improved management. If 37 percent of the watershed is in agriculture and 65 percent of those farmers are over applying nutrients, then 24 percent of the watershed could be contributing to the problem.
Table 8: Number of sludge application sites from wastewater treatment
plants located within the Deer Creek Watershed
Source Number of Sites
Total Acres
Alliance WWTP 41 732.21
Atwater WWTP 1 19.49
Aurora Westerly WWTP 2 75.15
Hartville WWTP 9 327.84
Ravenna STP 5 312.39
Streetsboro Hudson Regional WWTP 6 123.74
An educational effort is needed to work with the agricultural community to refine
nutrient management strategies to ensure better crop production with less residual nutrient exposed to loss. This involves working with growers to develop nutrient management plans for their farms, such as the Phosphorus Index calculation. This calculation helps farmers identify fields that have a high potential risk of phosphorus movement to nearby waters downstream. Too much phosphorus can affect water quality in the watershed, fueling the growth of harmful algal blooms. The watershed would benefit from nutrient management, managing the amount, source, and application of plant nutrients. By managing nutrients the amount of agricultural nonpoint source pollution could be reduced and the condition of the soil improved.
Because toxic algae blooms in Ohio have gained national attention since 2011, including bans on the use of tap water, the agricultural community is placing a great deal of attention on good nutrient management. The Lake Erie Ecosystem Priority (LEEP) findings and recommendations can be applied in this watershed. LEEP’s A Balanced Diet for Lake Erie report provides new loading targets, 240 best management practices (BMPs), and the identification of data and knowledge gaps in monitoring.
Farmers in the watershed can benefit from the work being done in the Western
Basin of Lake Erie where they are currently:
Deer Creek & Walborn Reservoir Watershed Study, 54
June 15, 2016
Assisting farmers in developing nutrient management plans that meet Natural Resources Conservation Service (NRCS) cost-share program eligibility. These plans can help identify a variety of conservation land-use concerns that could be further addressed by a certified farm conservation plan.
Helping growers interested in developing voluntary nutrient management plans
that meet statutory requirements for an approvable plan through the Ohio Department of Natural Resources and the Soil and Water Conservation District program. A voluntary nutrient management plan is an important step for farmers to defend themselves from lawsuits as stipulated in Ohio’s new nutrient management laws.
Providing technical support to private nutrient management plan development
providers (including certified crop advisers, certified professional agronomists and technical service providers) who are developing plans that meet NRCS cost-share eligibility on behalf of farmers.
With the written approval of a plan owner, utilize data gathered from the
management plans (such as field distance from water, soil types and soil test values) to better understand the phosphorus index and other water quality risk tools, in order to develop more user-friendly means for growers and farm advisers to monitor fertilizer use.
Another effort to reduce nutrient runoff could be working with agricultural nutrient
service providers who deliver nutrient recommendations, nutrient application services or both to farmers so they can achieve certification in the voluntary 4R Nutrient Stewardship Certification Program — which encourages farmers to use the right fertilizer source, at the right rate, at the right time, with the right placement.
Understanding how different physical, chemical, and biological factors create
conditions that trigger harmful and nuisance algal blooms could be helpful. In addition, it would be useful to have an understanding of how various BMPs actually reduce phosphorus loading and how much they cost. The issue of climate change has been also identified as a problem.
According to Laura McCann, an associate professor at the University of Missouri, a model was created that would predict which characteristics of farmers and their farms might correlate with adoption of three specific technologies: nitrogen soil testing, nitrogen inhibitors, and plant tissue testing (McCann, 2015).
1) Nitrogen soil testing was most widely used, with an adoption rate of 21 percent,
providing farmers with information about the amount of nitrogen in their soil that is available to plants. This test, done before planting, is not included in standard soil tests, and has an additional cost. If there is extra nitrogen in their soils already, farmers can then account for it and subtract that from how much they apply.
Deer Creek & Walborn Reservoir Watershed Study, 55
June 15, 2016
2) Nitrogen inhibitors were used at a rate of 10 percent. These inhibitors work to keep nitrogen in the soil, where it can be used by the crops, preventing nitrogen from being converted into forms that can easily leach or evaporate.
3) Plant tissue testing was used the least, at 3 percent. This is done while the crops
are growing. Leaf tissue samples are collected and sent to a lab so that the farmer knows how much nitrogen is getting into the plant. If levels are lower than they should be, additional nitrogen can be applied. Plant tissue testing appeared to the researchers to be a sort of peak practice–if farmers weren’t already using other technologies, they weren’t likely to adopt plant tissue testing. The adoption of these technologies by farmers was affected by many factors,
such as the age of the farmer, size of the farm, cost of implementing the practice, other management practices the farmers were using, and their sources of information about nitrogen. Younger farmers were more likely to adopt the practices. The use of irrigation correlated with the use of nitrogen soil testing and nitrogen inhibitors. Farmers who use conservation tillage were more likely to adopt the use of nitrogen inhibitors. One variable that correlated with adoption of the technologies was the farmer’s source of information. Farmers who didn’t receive information or those who got information from fertilizer dealers were less likely to adopt nitrogen-efficient technologies. Meanwhile, farmers who talked with consultants or extension specialists were more likely to use the practices. The researchers suggested that programs need to be implemented for fertilizer dealers so they could sell nitrogen inhibitors as a new product.
Working with the agricultural community, the Ohio Farm Bureau Federation (OFBF) has scheduled an introductory meeting to provide educational solutions on March 10, 2016. Promotional and educational materials could be distributed at local agricultural businesses. This special water quality briefing on the Deer Creek Watershed: “Protecting and Improving Our Water Resources will be facilitated by Portage County and Stark County Farm Bureaus’ Director Nick Kennedy, who is reaching out to the communities within the Deer Creek Watershed to help discuss ways that all citizens within the watershed can help play a vital role in the improvement of water quality and safety for all residents. Dr. Larry Antosch, Senior Director of Policy Development and Environmental Policy for the Ohio Farm Bureau, Dr. Dean Reynolds, Superintendent of the City of Alliance Department of Water Treatment, and Laura Minnig, NEFCO Environmental Planner, will be presenting. The presentation will cover nutrients and drinking water quality in Deer Creek, the costs of treating water with armful algal blooms (HABs), and a watershed approach to implementing best management practices that could be implemented to protect, enhance, and fix the problem.
The Ohio USDA NRCS Conservation Practices lists the following BMPs for
addressing nutrients as a cause of water quality impairment:
1. Forage and Biomass Planting This BMP is implemented by establishing adapted or compatible forage species or herbaceous species suitable for pasture, hay, or biomass production. The purpose of this BMP is to reduce soil erosion and improve
Deer Creek & Walborn Reservoir Watershed Study, 56
June 15, 2016
soil and water quality while improving or maintaining livestock nutrient and/or health, increasing forage supply, and producing feedstock for biofuel or energy production.
2. Conservation Crop Rotation Crop rotation consists of growing crops in a planned sequence on the same field. By constantly having a crop on the field, the soil is kept in place by plant roots and the nutrients are being captured by the plants. This prevents soil erosion and nutrient loss. This practice improves water quality by managing the balance of plant nutrients, supplying nitrogen via nitrogen fixation, conserving water, reducing wind erosion, and improving soil quality.
3. Filter Strip A filter strip is an area of herbaceous vegetation that removes contaminants from water as it move over the landscape. This practice aims to reduce suspended and dissolved contaminates in runoff and irrigation tail water.
4. Riparian Forest Buffer An area of trees and/or shrubs that is adjacent and up-gradient of a water body is known as a riparian forest buffer. This BMP reduces the amount of sediment, organic material, nutrients, and other contaminants entering a water body. The buffer also provides shade which can lower water temperature and improve aquatic life habitat. It also acts as a source of detritus for fish and other aquatic organisms, as well as habitat for wildlife.
5. Riparian Herbaceous Cover This BMP consists of grasses, sedges, rushes, ferns, legumes, and forbs tolerant of wet conditions located in the transitional zone between upland and aquatic habitats. Herbaceous riparian cover can be used to improve or maintain water quality, increase water storage, reduce erosion and improve steam bank stability, increase carbon storage. It also provides food and habitat for pollinators, fish, wildlife, and livestock.
6. Prescribed Grazing Prescribed grazing uses grazing animals to manage the harvest of vegetation. This can be used to improve or maintain water quality and reduce soil erosion while improving the food and cover available for wildlife.
7. Field Border This BMP uses a strip of permanent vegetation at the edge or perimeter of a field in order to reduce erosion and protect soil and water quality. It can also be used to manage pest populations, increase carbon storage, improve air quality, and provide wildlife food and cover.
8. Nutrient Management
Deer Creek & Walborn Reservoir Watershed Study, 57
June 15, 2016
This practice manages the amount, source, and application of plant nutrients. By managing nutrients the amount of agricultural nonpoint source pollution is reduced and the condition of the soil is improved.
9. Critical Area Planting Critical area planting provides permanent vegetation to areas with high erosion rates and some sort of condition that prevents the establishment of vegetation with normal practices. This vegetation provides stream bank, riparian, and channel stabilization while reducing rates of soil erosion.
10. Conservation Cover This practice establishes and maintains permanent vegetative cover in order to reduce soil erosion and sedimentation. It also improves soil and water quality, enhances wildlife habitat, and can be used to manage plant pests.
Residential Homeowners in the watershed use fertilizers that can also cause problems when
they enter the streams through runoff. Homeowners should be encouraged to test soils to determine exactly what nutrients their soil needs. Homeowners could also benefit from instruction on using the right fertilizer source, at the right rate, at the right time, with the right placement.
Vegetated riparian setbacks from streams and rain gardens should be
encouraged. Homeowners should compost lawn trimmings. Storm gutters and drains should be kept clear of decomposing vegetative matter, since it can leach nutrients.
Homeowners should work with the Portage and Stark Soil and Water
Conservation Districts, especially those land owners that have property adjacent to streams, and everyone should be invited to educational programming.
Priority Nutrient Reduction Areas
Combining GIS data per watershed, sub watersheds were weighted for nutrient reduction efforts. Map 28 examines the lack of green infrastructure: vegetated riparian corridors, wetlands, and woodlands. Map 29 shows areas with failing and potentially failing septic systems. Map 30 shows the potential agricultural areas in need of BMPs based on croplands and pastures, and known farming operations. Map 31 is a composite of these three maps.
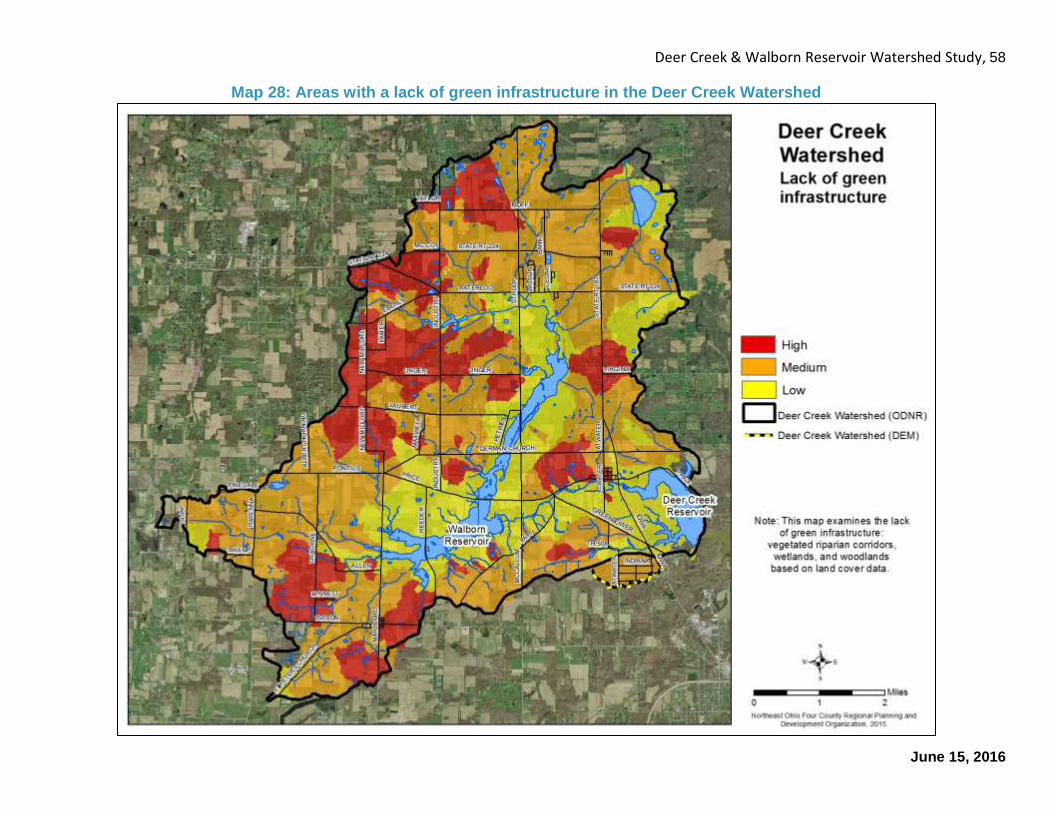
Deer Creek & Walborn Reservoir Watershed Study, 58
June 15, 2016
Map 28: Areas with a lack of green infrastructure in the Deer Creek Watershed
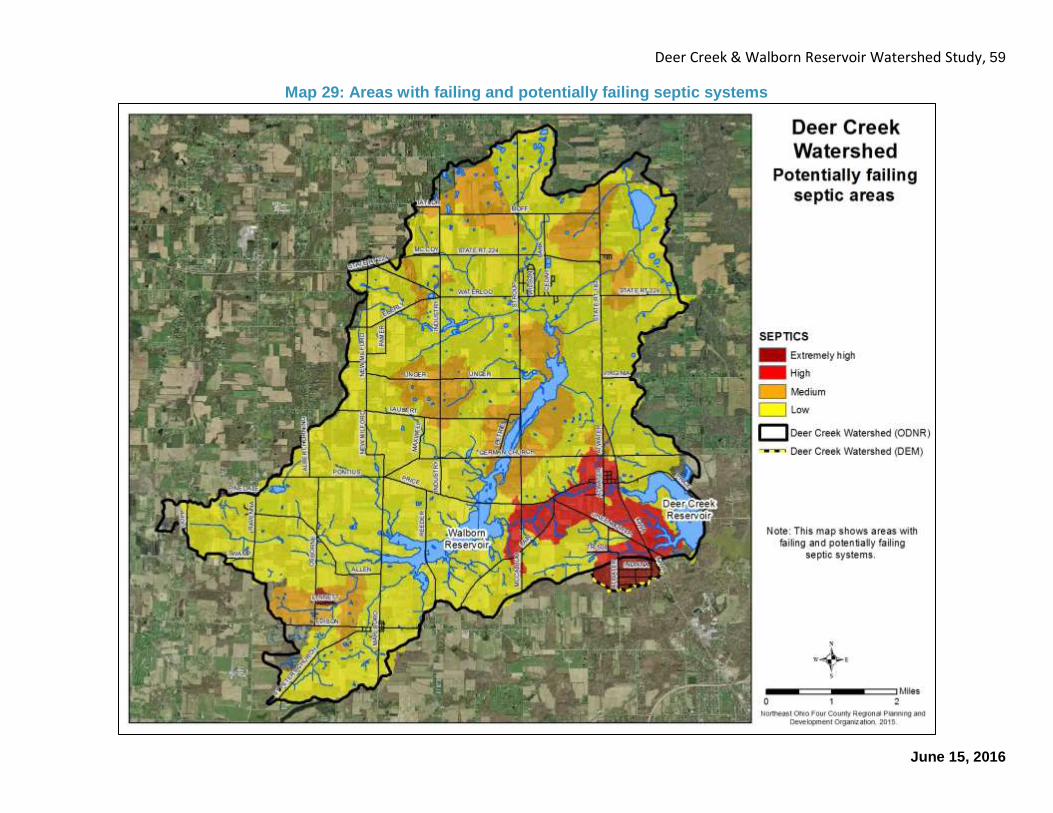
Deer Creek & Walborn Reservoir Watershed Study, 59
June 15, 2016
Map 29: Areas with failing and potentially failing septic systems
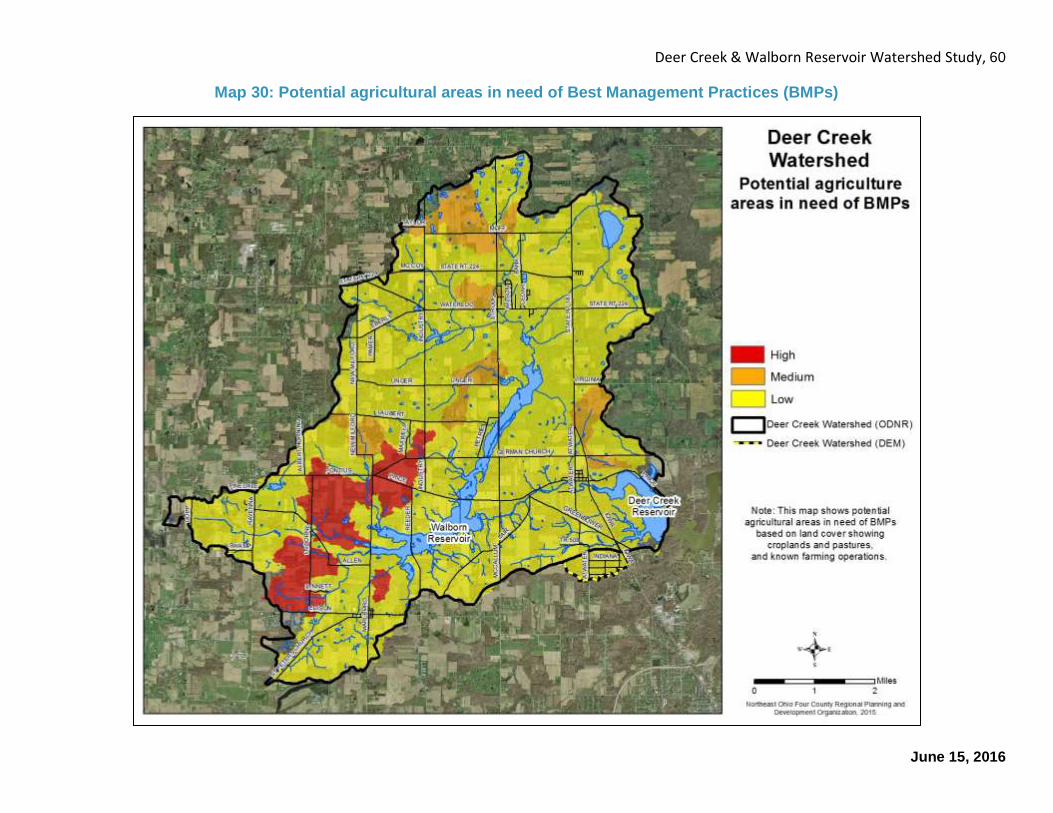
Deer Creek & Walborn Reservoir Watershed Study, 60
June 15, 2016
Map 30: Potential agricultural areas in need of Best Management Practices (BMPs)
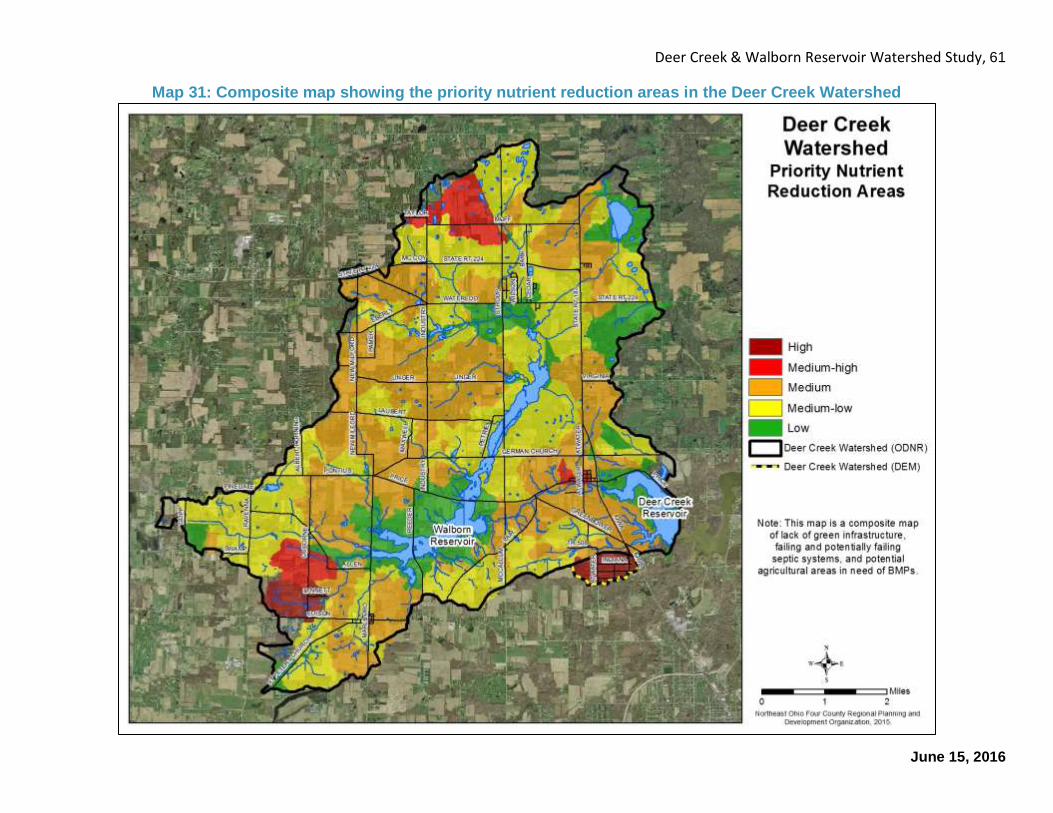
Deer Creek & Walborn Reservoir Watershed Study, 61
June 15, 2016
Map 31: Composite map showing the priority nutrient reduction areas in the Deer Creek Watershed
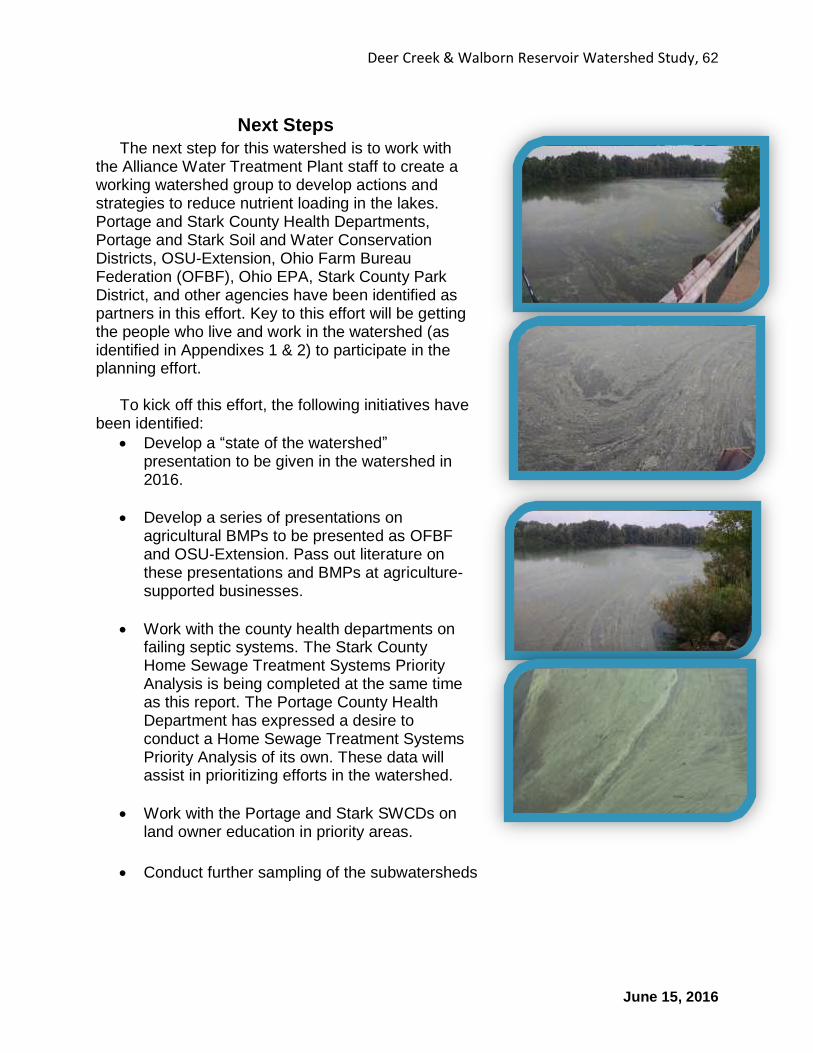
Deer Creek & Walborn Reservoir Watershed Study, 62
June 15, 2016
Next Steps
The next step for this watershed is to work with the Alliance Water Treatment Plant staff to create a working watershed group to develop actions and strategies to reduce nutrient loading in the lakes. Portage and Stark County Health Departments, Portage and Stark Soil and Water Conservation Districts, OSU-Extension, Ohio Farm Bureau Federation (OFBF), Ohio EPA, Stark County Park District, and other agencies have been identified as partners in this effort. Key to this effort will be getting the people who live and work in the watershed (as identified in Appendixes 1 & 2) to participate in the planning effort.
To kick off this effort, the following initiatives have
been identified:
Develop a “state of the watershed” presentation to be given in the watershed in 2016.
Develop a series of presentations on agricultural BMPs to be presented as OFBF and OSU-Extension. Pass out literature on these presentations and BMPs at agriculture-supported businesses.
Work with the county health departments on failing septic systems. The Stark County Home Sewage Treatment Systems Priority Analysis is being completed at the same time as this report. The Portage County Health Department has expressed a desire to conduct a Home Sewage Treatment Systems Priority Analysis of its own. These data will assist in prioritizing efforts in the watershed.
Work with the Portage and Stark SWCDs on land owner education in priority areas.
Conduct further sampling of the subwatersheds
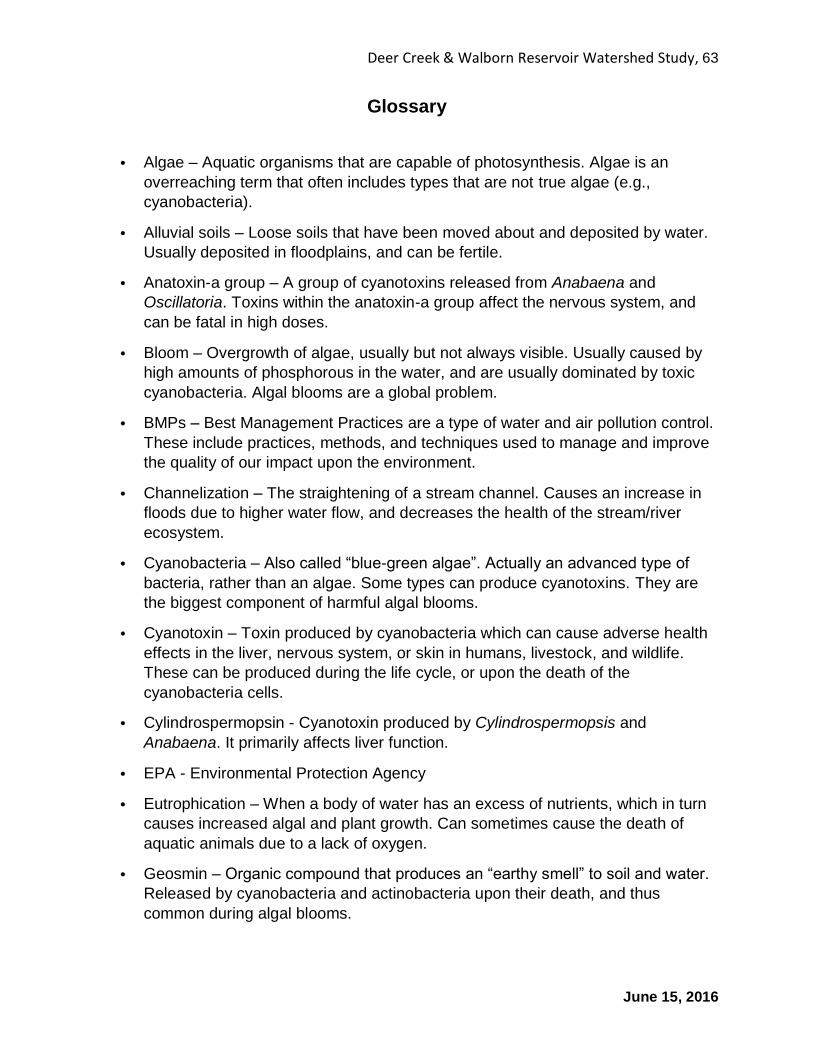
Deer Creek & Walborn Reservoir Watershed Study, 63
June 15, 2016
Glossary
• Algae – Aquatic organisms that are capable of photosynthesis. Algae is an
overreaching term that often includes types that are not true algae (e.g.,
cyanobacteria).
• Alluvial soils – Loose soils that have been moved about and deposited by water.
Usually deposited in floodplains, and can be fertile.
• Anatoxin-a group – A group of cyanotoxins released from Anabaena and
Oscillatoria. Toxins within the anatoxin-a group affect the nervous system, and
can be fatal in high doses.
• Bloom – Overgrowth of algae, usually but not always visible. Usually caused by
high amounts of phosphorous in the water, and are usually dominated by toxic
cyanobacteria. Algal blooms are a global problem.
• BMPs – Best Management Practices are a type of water and air pollution control.
These include practices, methods, and techniques used to manage and improve
the quality of our impact upon the environment.
• Channelization – The straightening of a stream channel. Causes an increase in
floods due to higher water flow, and decreases the health of the stream/river
ecosystem.
• Cyanobacteria – Also called “blue-green algae”. Actually an advanced type of
bacteria, rather than an algae. Some types can produce cyanotoxins. They are
the biggest component of harmful algal blooms.
• Cyanotoxin – Toxin produced by cyanobacteria which can cause adverse health
effects in the liver, nervous system, or skin in humans, livestock, and wildlife.
These can be produced during the life cycle, or upon the death of the
cyanobacteria cells.
• Cylindrospermopsin - Cyanotoxin produced by Cylindrospermopsis and
Anabaena. It primarily affects liver function.
• EPA - Environmental Protection Agency
• Eutrophication – When a body of water has an excess of nutrients, which in turn
causes increased algal and plant growth. Can sometimes cause the death of
aquatic animals due to a lack of oxygen.
• Geosmin – Organic compound that produces an “earthy smell” to soil and water.
Released by cyanobacteria and actinobacteria upon their death, and thus
common during algal blooms.
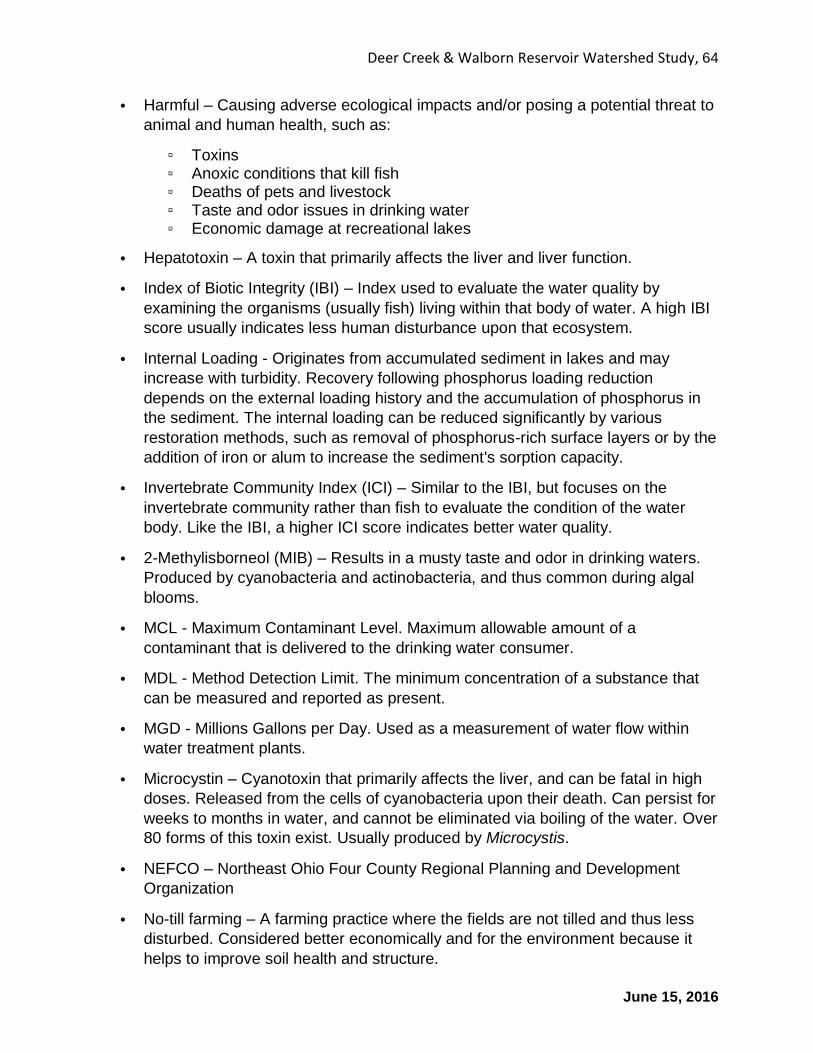
Deer Creek & Walborn Reservoir Watershed Study, 64
June 15, 2016
• Harmful – Causing adverse ecological impacts and/or posing a potential threat to
animal and human health, such as:
▫ Toxins ▫ Anoxic conditions that kill fish ▫ Deaths of pets and livestock ▫ Taste and odor issues in drinking water ▫ Economic damage at recreational lakes
• Hepatotoxin – A toxin that primarily affects the liver and liver function.
• Index of Biotic Integrity (IBI) – Index used to evaluate the water quality by
examining the organisms (usually fish) living within that body of water. A high IBI
score usually indicates less human disturbance upon that ecosystem.
• Internal Loading - Originates from accumulated sediment in lakes and may
increase with turbidity. Recovery following phosphorus loading reduction
depends on the external loading history and the accumulation of phosphorus in
the sediment. The internal loading can be reduced significantly by various
restoration methods, such as removal of phosphorus-rich surface layers or by the
addition of iron or alum to increase the sediment's sorption capacity.
• Invertebrate Community Index (ICI) – Similar to the IBI, but focuses on the
invertebrate community rather than fish to evaluate the condition of the water
body. Like the IBI, a higher ICI score indicates better water quality.
• 2-Methylisborneol (MIB) – Results in a musty taste and odor in drinking waters.
Produced by cyanobacteria and actinobacteria, and thus common during algal
blooms.
• MCL - Maximum Contaminant Level. Maximum allowable amount of a
contaminant that is delivered to the drinking water consumer.
• MDL - Method Detection Limit. The minimum concentration of a substance that
can be measured and reported as present.
• MGD - Millions Gallons per Day. Used as a measurement of water flow within
water treatment plants.
• Microcystin – Cyanotoxin that primarily affects the liver, and can be fatal in high
doses. Released from the cells of cyanobacteria upon their death. Can persist for
weeks to months in water, and cannot be eliminated via boiling of the water. Over
80 forms of this toxin exist. Usually produced by Microcystis.
• NEFCO – Northeast Ohio Four County Regional Planning and Development
Organization
• No-till farming – A farming practice where the fields are not tilled and thus less
disturbed. Considered better economically and for the environment because it
helps to improve soil health and structure.
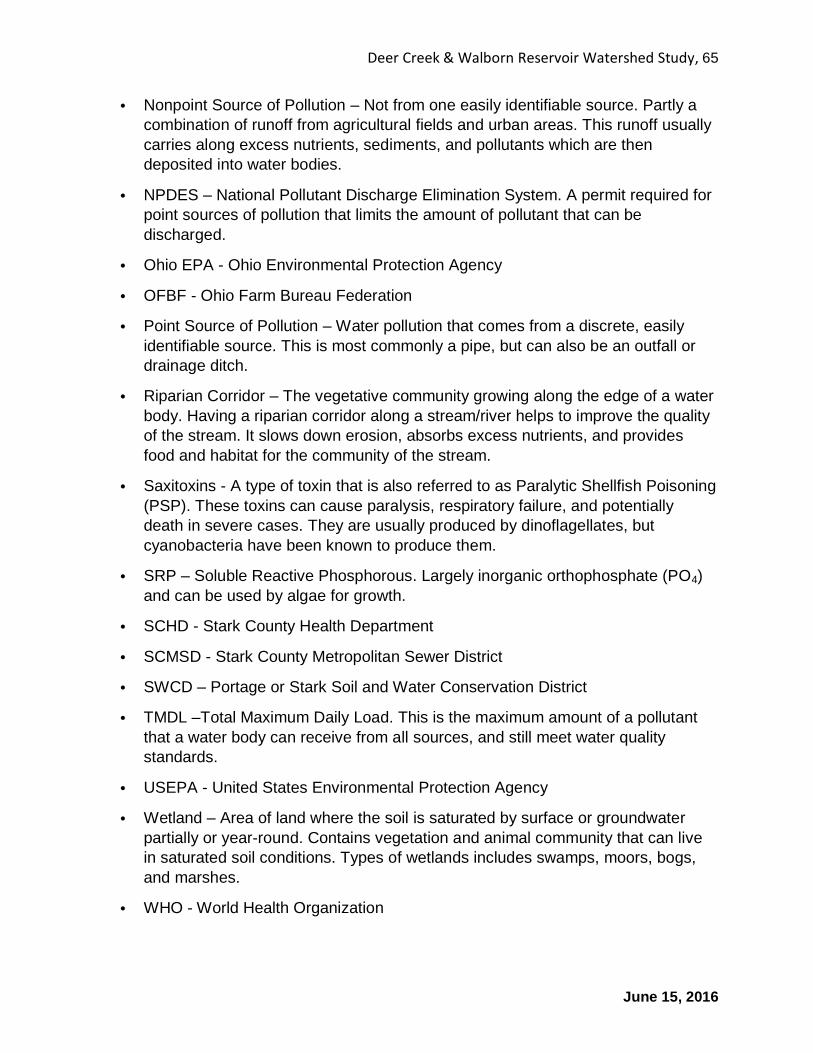
Deer Creek & Walborn Reservoir Watershed Study, 65
June 15, 2016
• Nonpoint Source of Pollution – Not from one easily identifiable source. Partly a
combination of runoff from agricultural fields and urban areas. This runoff usually
carries along excess nutrients, sediments, and pollutants which are then
deposited into water bodies.
• NPDES – National Pollutant Discharge Elimination System. A permit required for
point sources of pollution that limits the amount of pollutant that can be
discharged.
• Ohio EPA - Ohio Environmental Protection Agency
• OFBF - Ohio Farm Bureau Federation
• Point Source of Pollution – Water pollution that comes from a discrete, easily
identifiable source. This is most commonly a pipe, but can also be an outfall or
drainage ditch.
• Riparian Corridor – The vegetative community growing along the edge of a water
body. Having a riparian corridor along a stream/river helps to improve the quality
of the stream. It slows down erosion, absorbs excess nutrients, and provides
food and habitat for the community of the stream.
• Saxitoxins - A type of toxin that is also referred to as Paralytic Shellfish Poisoning
(PSP). These toxins can cause paralysis, respiratory failure, and potentially
death in severe cases. They are usually produced by dinoflagellates, but
cyanobacteria have been known to produce them.
• SRP – Soluble Reactive Phosphorous. Largely inorganic orthophosphate (PO4)
and can be used by algae for growth.
• SCHD - Stark County Health Department
• SCMSD - Stark County Metropolitan Sewer District
• SWCD – Portage or Stark Soil and Water Conservation District
• TMDL –Total Maximum Daily Load. This is the maximum amount of a pollutant
that a water body can receive from all sources, and still meet water quality
standards.
• USEPA - United States Environmental Protection Agency
• Wetland – Area of land where the soil is saturated by surface or groundwater
partially or year-round. Contains vegetation and animal community that can live
in saturated soil conditions. Types of wetlands includes swamps, moors, bogs,
and marshes.
• WHO - World Health Organization
Deer Creek & Walborn Reservoir Watershed Study, 66
June 15, 2016
References Gaiac: Research Institute for Ecological Analysis and Assessment. 2014. http://www.gaiac.rwth-aachen.de/index.php/en/modelling/simulations-modell-stolam McCann, Laura. 2015. Improving nitrogen use efficiency in crop and livestock production systems. Journal of Environmental Quality 44: 391-401. Middleton, T.E., Blaser, J.B., Reynolds, D.A., & M.D. Dreger. 2010. Water quality report:
Alliance water treatment facility. Alliance, OH. Available from:
http://www.cityofalliance.com/DocumentCenter/View/109
Ohio Department of Health (ODH). 2013. Household sewage treatment system failures in
Ohio.
Ohio Environmental Protection Agency (OEPA). 1998. Sampling methods for documentation
of a public health nuisance under OAC Rule 3745-1-04 (F) & (G).
Ohio Environmental Protection Agency (OEPA). 1999. Association between nutrients,
habitat, and the aquatic biota in Ohio rivers and streams. Ohio EPA Technical Bulletin
MAS/1999-1-1.
Ohio Environmental Protection Agency (OEPA). 2008. Biological and water quality study of
the upper Mahoning River and selected tributaries 2006. OHIO EPA Technical Report
EAS/2008-10-8.
Ohio Environmental Protection Agency (OEPA). 2010. Ohio Lake Erie phosphorous task
force final report.
Ohio Environmental Protection Agency (OEPA). 2013. Ohio Nutrient Reduction Strategy.
Orihel, D.M., Bird, D.F., Brylinsky, M., Chen, H., Donald, D.B., Huang, D.Y., Giani, A.,
Kinniburgh, D., Kling, H., Kotak, B.G., Leavitt, P.R., Nielsen, C.C., Reedyk, S., Rooney,
R.C., Watson, S.B., Zurawell, R.W., & R.D. Vinebrooke. 2012. High microcystin
concentrations occur only at low nitrogen-to-phosphorous ratios in nutrient-rich Canadian
lakes. Canadian Journal of Fisheries and Aquatic Sciences 69: 1457-1462.
Paerl, H.W., Valdes, L.M., Peierls, B.L., Adolf, J.E., & L.W. Harding Jr. 2006. Anthropogenic
and climatic influences on the eutrophication of large estuarine ecosystems. Limnology and
Oceanography 51: 448-462.
Scott, J.T., McCarthy, M.J., Otten, T.G., Steffen, M.M., Baker, B.C., Grantz, E.M., Wilhelm,
S.W., & H.W. Paerl. 2013. Comment: an alternative interpretation of the relationship
between TN:TP and microcystins in Canadian lakes. Canandian Journal of Fisheries and
Aquatic Sciences 70: 1265-1268.
Søndergaard, M., Jensen, J.P., & E. Jeppesen. 1999. Internal phosphorous loading in
shallow Danish lakes. Hydriobiologia 408/409: 145-152.
Deer Creek & Walborn Reservoir Watershed Study, 67
June 15, 2016
United States Environmental Protection Agency (USEPA). 2012. Cyanobacteria and cyanotoxins: information for drinking water systems. EPA-810F11001. United States Environmental Protection Agency (USEPA). 2012. 5.6 Phosphorous. Available from: http://water.epa.gov/type/rsl/monitoring/vms56.cfm Washington Department of Ecology. 2015. Lake restoration and management for algae.
Available from Algae Control Program:
http://www.ecy.wa.gov/programs/wq/plants/algae/lakes/lakerestoration.html