Embed Size (px)
Citation preview

What We Know:
The Global economy will shrink by 3% this year
Loss to GDP could amount to $9 trillion

2
GDP Growth Projections
The COVID-19 health crisis will have a severe impact on economic activity in 2020
Source: IMF, World Economic Outlook, April 2020

3
GDP Growth Projections
Source: Oxford Economics / Haver Analytics
World GDP
Global GDPQ4 2019=100

Worldwide trade will plummet 11% this year

5
Goods Trade Barometer
Source: World Trade Organization, WTO Trade Barometers, May 20, 2020
World Merchandise Trade Volume, 2000-2022
Below trend
Above trend

Most governments will be heavily indebted from expensive emergency relief measures

7
General GovernmentDebt to GDP Ratio In select OECD countries
Source: IMF
Source: Committee for a Responsible Federal Budget, Congressional Budget Office
US Debt to GDP before Coronavirus

8
Debt to GDP Ratio Forecast
NEDA Source: Committee for a Responsible Federal Budget, Congressional Budget Office

U.S. jobless claims have surpassed 40 million people

10
United States Initial Jobless Claims
Week ended May 23
Source: TRADINGECONOMICS.COM | U.S DEPARTMENT OF LABOURNEDA

11
NEDA
U.S Unemployment Rate
Source: Committee for a Responsible Federal Budget, Congressional Budget Office

Steep short-term decline in FDI

Top 5,000 MNEs which account for lion’s share of FDI: downward revisions of 2020 earnings estimates of 30% due to COVID-19. Hardest hit:
COVID-19 Impact on Global FDI
-208%Energy & basic materials
-116%Airlines
-47%Automotive Industry
-41%Hotels, Restaurants / Leisure
Source: UNCTAD, Investment Trends Monitor, March 2020
Downward pressure on FDI could be -30% to -40% during 2020-2021

COVID-19 Affects on MNEs by April, 2020
Source: World Bank Group, 2019-2020 Global Investment Competitiveness Report
14
NEDA

Continued self-isolation and depressed spending against a potential resurgence of the virus

Respondents who agree that…(%) “The worst of the coronavirus is still ahead”As of April 2020
BCG: COVID-19 BCG Perspectives, Version 8: May 8, 2020
Consumers starting to display more optimistic outlook

NEDA BCG: COVID-19 BCG Perspectives, Version: 24 April, 2020
US Consumer SentimentSome willingness to resume activities post lockdown, but not to pre-crisis level even with treatment

What We Don’t Know:
Greater protection/Reshoring of strategic supply chains and less reliance on imports

Lack of supply chain visibility
Source: BCI, 2019
Pre COVID-19 Learning:

Reshore: creation of favourable business conditions, skilled workforce and incentivesBCG Study (2002 – 2014) of major factors impacting manufacturing location decisions
• Increased wages: china’s wages rose 15-20% per year at the average Chinese factory
• Fluctuating currency value: the Chinese yuan increased in value by 35% against the USD
• Labor productivity: measured as the gains in output per manufacturing worker
• Reduction of energy costs from 2002 – 2014, especially in energy dependent industries such as iron, steel and chemicals
Historically US manufacturers struggled to maintain cost and productivity advantages
US shifted focus to complex, high-value products and industries
• Others closed US-based factories or sought cost savings by offshoring
• Shortly after China joined the WTO (2001) a large exodus of US manufacturers occurred
Supply chain dynamics have changed• By 2010 cost savings began to erode
(increases in labor and transportation costs)• Hidden costs: monitoring and QC, protection
of IP and lengthy supply chains

Potential Cumulative Reshored Jobs
Scenario Description Source Jobs
ReshoredCumulative Total Jobs
Using TCI analysis Reshoring initiative 500,000 1,000,000
If Chinese Wage Trends continue at 18% a year Boston Consulting Group 1,000,000 2,000,000
Adoption of better U.S training, increased process improvements & competitive tax rates
Federal Government’s Advanced Manufacturing Partnership 2,000,000 4,000,000
End of foreign currency manipulation Almost all manufacturing groups 3,000,000 6,000,000
Source: IEDC

22
Strategies to consider for our recovery
• Investment weary• Net Income & Revenue focus• Regionalization• Re-evaluate value chains / subsegments• Increased automation / digitization
Stakeholders know that capital investment and job creation results will be lower than expected this year.
Most Important KPI for EDOs: Adjustment to your strategy in an
efficient and effective manner?
All companiesReduction in investment and FDI
Revised EDO strategy+ =

23
Strategies to consider for our recovery - Companies• Reshoring manufacturing/supply chain• +1 sourcing strategy• Near shoring supply chain• Mitigating risk in existing supply chains / de-coupling from China• Increase in data driven and AI powered decision-making
• Massive investments in technology• Massive investment in digitization• Massive investment in skills update (Industry 4.0)• Worker productivity and output• Availability of finance
• Employee safety measures• “Work from home” is here to stay• The footprint for office real estate will change• Remote and virtual working models will proliferate

24
Strategies to consider for our recovery - EDOs
• Verify that industry and geographic targets are still viable• Re-assess your budget• Keep your stakeholders in the loop• Engage in concerted BR&E Activity• Re-visit your value proposition • Ensure that your mix of marketing collaterals are adapted to today’s reality• Strengthen cooperation
• Now is NOT the time to cease business development activities• Virtual conferences• Augmented and Virtual Reality• Digital/virtual meetings and site tours• Digital marketing• Seize new opportunities from changing FDI (huge capacity requirements
for potential reshoring)

Tracking OpportunitiesDr. Nadine Jeserich

26
Intro
Tracking growth industries,
Workforce, business planning and technology development
retain and support?create opportunities beyond 2020?

27
2020 employment by sector so far
Source: U.S Bureau of Labor Statistics.
Sectoral trends mostly well known by now –leisure/hospitality, retail
Employment change by industry, April 2020, seasonally adjusted, 3 month net change

28
Manufacturing production trendsIndustry Group NAICS MAR-APR
2020APR ‘19-APR’20
Natural gas 2212 10.7 11.1COVID Computer and electronic products 334 -5 0.2COVID Paper 322 -2.6 -1.5MIXED Electrical equipment, appliances, and components 335 -6 -5.4MIXED Food, beverage, and tobacco products 311.2 -7.1 -6.7MIXED Electric 2211 -3.3 -6.7MIXED Mining 21 -6.1 -7.5MIXED Chemicals 325 -5.1 -7.7MIXED Wood products 321 -9 -7.9MIXED Plastics and rubber products 326 -11 -13.2MIXED Machinery 333 -11 -14.4MIXED Fabricated metal products 332 -11.3 -14.9RISK Nonmetallic mineral products 327 -16.3 -18.5RISK Petroleum and coal products 324 -18.5 -22.1RISK Furniture and related products 337 -20.6 -24.5RISK Primary metals 331 -20.4 -27RISK Printing and support 323 -21.2 -27.6RISK Textile and product mills 313.4 -20.7 -28.7RISK Apparel and leather 315.6 -24.1 -34.5RISK Aerospace and miscellaneous transportation equipment 3364-9 -21.6 -34.9RISK Motor vehicles and parts 3361-3 -71.7 -79.3
••
•
Source: US Census Bureau, Industrial production index

29
Niche sectors that have fared well through 2019 and so far into 2020
IT – research – consulting – training⁃ Software⁃ Data processing⁃ Internet publishing⁃ Customer computer programming services / 5415⁃ Management and human resource consulting⁃ R&D⁃ Marketing research⁃ Business, computer, and management training 6114
Medical devices / supplies and pharma
Plastic products
Packaged nonperishablefood and snacks
Computer & peripheralequipment, wireless equipment

30
Supply chain strength
March supply chain disruptions were being reported in 9% 17% 24% 38%
North America Japan & Korea Europe China(9% for U.S. supply chains,
6% for supply chains elsewhere in North America)
of respondents each of respondents of respondents
Source: Institute for Supply Management

31
Trickle effects of foreign supply chain collapses:
TOTAL $347.3 BILLION
Primary sources of intermediate goods for the US
Source: USITC
Canada18%
China10%
Mexico7%
Ireland7%
Japan5%
Germany5%
Other48%

32
Extent of reliance on international supply chains
Share of foreign value added in electronics exports was around 10% for the United States,
companies came to a standstill!

33
And not just electronics
Source: OECD TiVA, Bloomberg Economics

A dependency on China manufacturing and/or Chinese suppliers
• Vulnerability ranges across industry sectors example - China sourcing viewpoint Electronics & electrical is likely the highest risk sector globally
Source: BCG, 2020

35
Likelihood of Reshoring Due to Coronavirus Outbreak
54% of respondents chose Likely, Very Likely or Extremely Likelyoptions on reshoring.
Source: Thomas Industrial Survey (n-1,073)

36
Reshoring trends
⁃ 2018 Tariff impacts prepared some industries and companies
⁃ Some imports were shifted to other South-East Asia locations: Furniture/Toys
⁃ Others to Canada and Mexico: chemicals, metals, car parts
Source: USTIC; The Economist
Change in share of US imports between Jul-Dec 2017 and Jul-Dec 2019, percentage points

37
Reshoring Interest by IndustryLikely to Extremely Likely to Reshore Production/Sourcing
Source: ThomasNet April 2020 COVID-19’s Impact on North American Manufacturers

38
Reshoring destinations
Most likely reshoring destination: Pennsylvania, Wisconsin, Texas
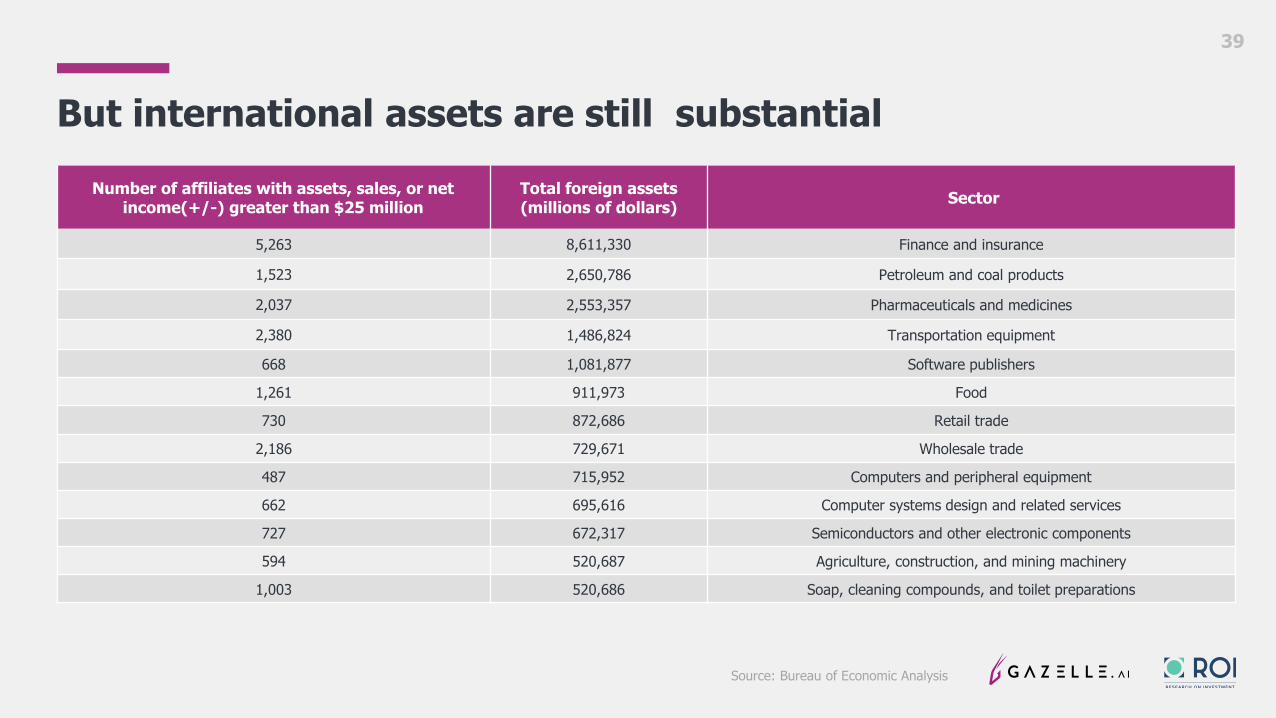
39
But international assets are still substantialNumber of affiliates with assets, sales, or net
income(+/-) greater than $25 millionTotal foreign assets(millions of dollars) Sector
5,263 8,611,330 Finance and insurance
1,523 2,650,786 Petroleum and coal products
2,037 2,553,357 Pharmaceuticals and medicines
2,380 1,486,824 Transportation equipment
668 1,081,877 Software publishers
1,261 911,973 Food
730 872,686 Retail trade
2,186 729,671 Wholesale trade
487 715,952 Computers and peripheral equipment
662 695,616 Computer systems design and related services
727 672,317 Semiconductors and other electronic components
594 520,687 Agriculture, construction, and mining machinery
1,003 520,686 Soap, cleaning compounds, and toilet preparations
Source: Bureau of Economic Analysis

40
Accelerating technologies
Those part of new normal and technology acceleration
• Distancing measures & reshoring trends = automation & robotics & AI/cloud computing needs• Remote work becoming permanent part of the economy• Health IT

41
Top Sectors for VC investment, 2017-Q1 2020
Source: PwC / CB insights MoneytreeTM Report Q1 2020

Bottom lineOpportunities Potential Risk
Medtech Transportation & Logistics Airlines
Pharma/Biotech High-tech Leisure/tourism
Online retail Machinery & Equipment Automotive
Software/AI/IT Consumer Electronics Offline retail
Online platforms Construction Energy & chemicals
Telecom services Plastics Apparel
Automation Wood
Aerospace
Defense

43
NEDA competitiveness
Where does theNorth east fit in?

NEDA
NEDA Economic Situation – Unemployment Claims
Unemployment Compensation Claims as a Percentage of the Civilian Workforce
⁃ Initial and Continuing Regular Unemployment Claims as a Percentage of the Civilian Labor Force, May 23, 2020
Source: Tax Foundation

NEDA
NEDA Economic Situation -Business Applications w Planned Wages

46
NEDA competitiveness• Widespread expertise
in Electronic components / Communications equipment
• => Robotics / automation / IoT => including upgrading Warehousing and distribution as a key distribution hub for the US
Supplier dense regions Integrator employment Supplier employment
Columbus, OH 358 4993
New York-Newark-Jersey City, NY-NJ-PA 121 1071
San Jose-Sunnyvale-Santa Clara, CA 76 580
Boston-Cambridge-Newton, MA-NH 287 1781
Grand Rapids-Wyoming, MI 389 2123
Birmingham-Hoover, AL 81 250
Pittsburgh, PA 190 525
Los Angeles-Long Beach-Anaheim, CA 564 949
Minneapolis-St. Paul-Bloomington, MN-WI 849 1416
Dallas-Fort Worth-Arlington, TX 152 228
Philadelphia-Camden-Wilmingon, PA-NJ-DE-MD 254 356
Source: Leigh & Kraft, Regional Studies vol. 52(2018)

47
Metalworking : custom/contract manufacturing – the supply chain for all manufacturing!Companies look for regional with manufacturing history and skilled trades and robust upskilling and automation programs
Source: Gazelle.ai
California19%
New York8%
Michigan7%
Ohio6%
New Jersey 6%Pennsylvania
6%Texas4%
Massachusetts4%
Florida4%
Connecticut4%
Illinois4%
Other28% Precision Manufacturing
Hubs

48
Reshoring opportunities
Transportation access
Ecosystem:of course
Skilled workforce: was often a reason for moving abroad
Have to be cost effective: competitive labor, real estate/construction costs, low-cost electricity

Pharma& medical device hotspots

Nationalhotspotsfor lifesciencesR&D

51
But cost competitive alternative
0 1,000,000 2,000,000 3,000,000 4,000,000 5,000,000 6,000,000 7,000,000 8,000,000 9,000,000 10,000,000
New YorkTexas
CaliforniaWashington
MassachusettsNew Jersey
FloridaIllinois
PennsylvaniaVermontColorado
ConnecticutNorth Carolina
MinnesotaMaryland
New HampshireMaine
DelawareRhode Island
Indiana
Property & Utility Costs for Typical Biopharma Project
Property Utility
Project: 350 employee, 247,570 ft² of Industrial space, 24,757 ft² of Office space
Source: fDibenchmark

52
Accelerating technologies
• Education⁃ remote learning software⁃ virtual training⁃ lots of startup opportunities not just for big cities
post-secondary education hubs are in the Northeast based on job shares
7/10 statesTOP Edtech Ecosystems to Watch
Source: Startup Genome

53
NEDA competitiveness
• Fit of targets with local communities• Carve out subsectors most suitable but play into regional strength and story• And pursuing sectors that will be relevant to a wider cross-section of
regional communities • More diversified economies are always more resilient!

Economic RecoveryKirsten McGregor, Principal SAGAX Associates, LLC

55
Phases of Recovery
1.2.3.4.5.

56
Disruption & Response
• Solving the Immediate Impacts
• Focus on the responding to the disruption
• Ongoing simultaneously with COVID 19
• Set the foundation for Recovery

57
Intermediate & Long-Term Recovery
• Initiatives • Events • Policies• Strategies• Plans

58
Building Recovery Capacity
• Sustainable & Transparent Oversight• Subject Matter Experts• Dedicated interagency recovery staff• Coordination for all levels of government• Stakeholder engagement

59
Economic Impact Assessment
• Required for most grant applications • Preexisting Vulnerabilities• Disruption Impact assessments• Quantitative Data• Qualitative Data

60
FundingInvestment Priorities
• Priority Projects• Federal Funding• Leveraging Resources• State and Local Funding• Philanthropic Resources• Tracking Funding
(Grants Management)
Strategy• Priority Projects• Coordinated Approach• Champion• Appropriate Resources• Grant Applications
Leveraging Resources• State and Local Funding• Philanthropic Funding• COVID Federal
Appropriations• Non-COVID Federal Funding

61
Recovery Action Plans & Strategies • Start with an Action Plan to identify your top
economic recovery concerns and develop a road map for solutions
• Continue to support your community with initiatives and evolving policies during the recovery process
• Encourage clear and coordinated messaging • Develop a coordinated and updated economic
vision• Create a recovery strategy that provides in-depth
analysis and long-term inter-coordinated

QUESTIONS?