Embed Size (px)
Citation preview


What Should School Systems Expect
During the Transition to the Common Core
and Consortia Assessments?

Why this new set of standards?
• What was the motivation behind the move towards the Common Core?
– No longer concerned with student “proficiency”
– Shift in focus to preparation of students for college and career
– Higher aspirations more in line with what students and parents want

Why this new set of standards?
What was the motivation behind the move towards the Common Core?
No longer concerned with student “proficiency”
Shift in focus to preparation of students for college and career
Higher aspirations more in line with what students and parents want
What are some of the changes we might expect to see as a result of this transition?
Changes in student performance (especially percentage of students meeting new benchmarks)
Changes in format, score, types, etc. of new test items
Changes in content assessed on new assessments

Changes in Student Test Performance

Perceptions of Changes in New York
NY Times article repeatedly addresses “drops in scores”
But did test scores really “sink” in New York?

Estimated Changes in Cut Scores on the New York State
Mathematics Assessment
39 36
33
40 37
52
69 72
82
69 75 73
0
10
20
30
40
50
60
70
80
90
Grade 3 Grade 4 Grade 5 Grade 6 Grade 7 Grade 8
Prior test
Current Test

MAP Mathematics Grade Means Spring 2012- Spring 2013
Spring 2012 Spring 2013 Difference
District 1 218.1 219.6 +1.5
District 2 219.4 221.8 +2.4
District 3 210.9 224.8 +13.9
District 4 215.3 219.8 +4.5
District 5 218.1 221.3 +3.2
District 6 201.4 204.6 +3.2
Estimated 4th grade cut score = 220

Estimated change in MAP Grade 4 estimated proficiency
rates in math
Spring 2012 – 2012 CUT SCORE
Spring 2013 – 2013 CUT SCORE
Difference
District 1 89.1% 54.9% -34.2%
District 2 87.9% 56.1% -31.8%
District 3 95.5% 65.1% -30.4%
District 4 82.6% 53.0% -29.6%
District 5 85.6% 58.9% -26.7%
District 6 36.8% 13.5% -23.3%
DIFFERENT CUT SCORES
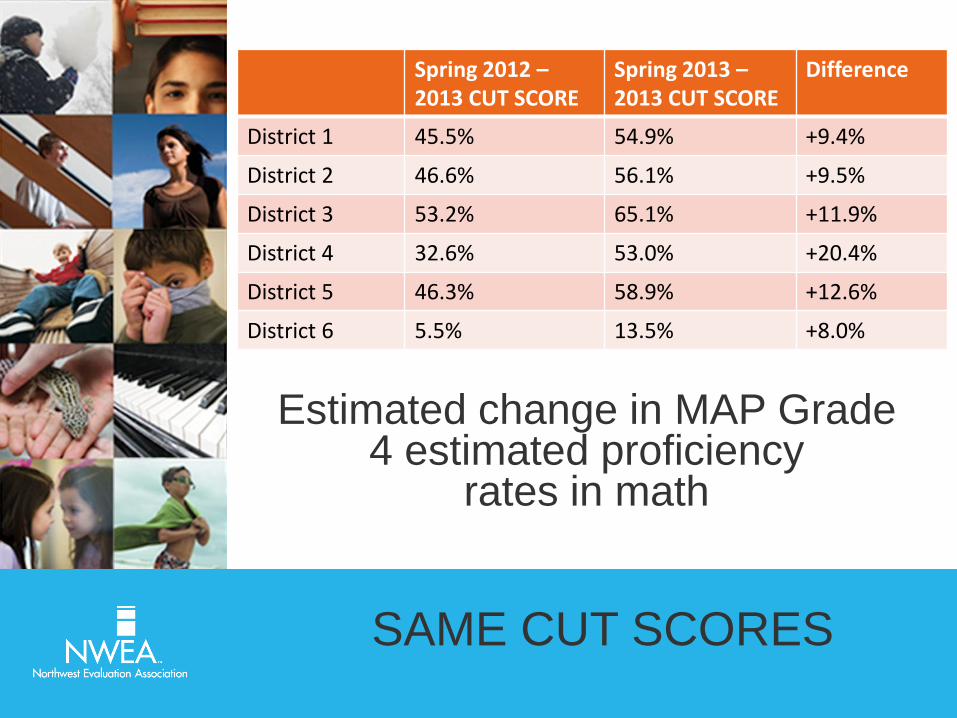
Estimated change in MAP Grade 4 estimated proficiency
rates in math
Spring 2012 – 2013 CUT SCORE
Spring 2013 – 2013 CUT SCORE
Difference
District 1 45.5% 54.9% +9.4%
District 2 46.6% 56.1% +9.5%
District 3 53.2% 65.1% +11.9%
District 4 32.6% 53.0% +20.4%
District 5 46.3% 58.9% +12.6%
District 6 5.5% 13.5% +8.0%
SAME CUT SCORES

Changes in Item Type, Format, Length, etc.

Grade 4 Math SBAC Practice Item

Grade 7 Math SBAC Practice Item

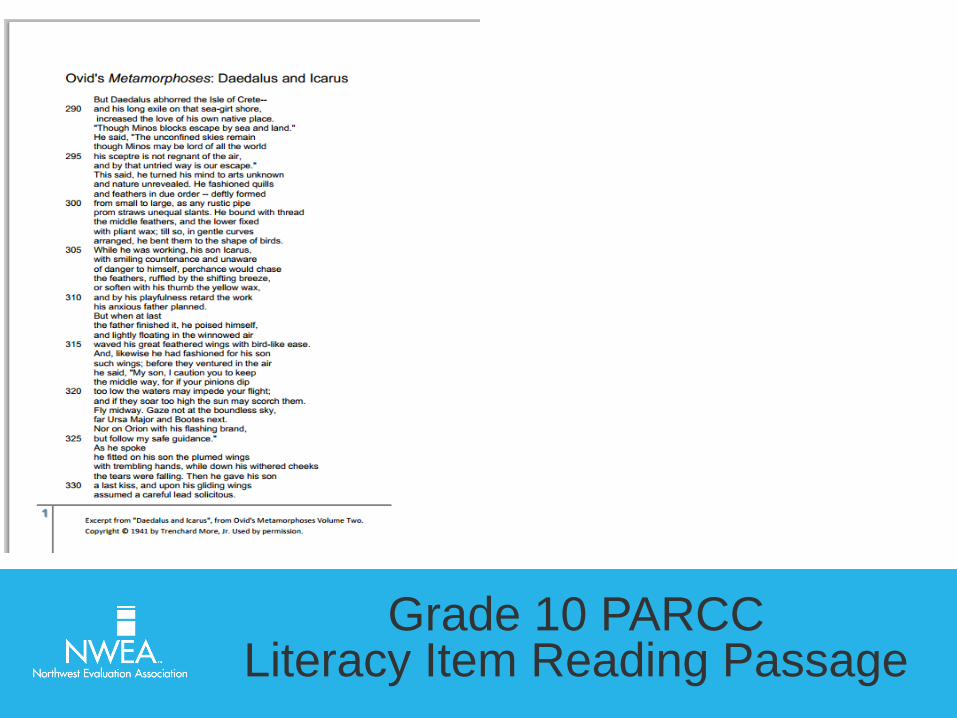
Grade 10 PARCC Literacy Item
Ovid’s Metamorphoses:
Daedalus and Icarus

Grade 10 PARCC Literacy Item Reading Passage
“But Daedalus abhorred the Isle of
Crete—and his long exile on that
sea-girt shore, increased the love
of his own native place. ‘Though
Minos blocks escape by sea and
land,’ He Said, ‘The unconfined
skies remain though Minos may be
lord of all the world his sceptre is
not regnant of the air, and by that
untried way is our escape.’”
Grade 10 PARCC Literacy Item Reading Passage
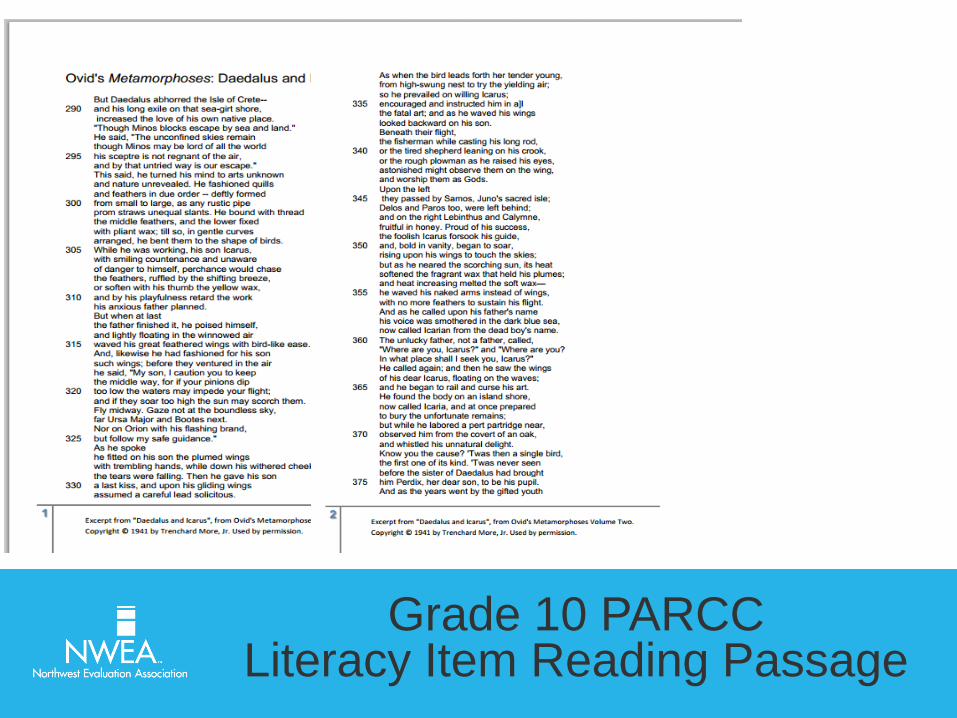
Grade 10 PARCC Literacy Item Reading Passage

Grade 10 PARCC Literacy Item Reading Passage

Grade 10 PARCC Literacy Item

Grade 3 PARCC Literacy Item

Grade 3 PARCC Literacy Item Reading Passage

Grade 3 PARCC Literacy Item Reading Passage

Grade 3 PARCC Literacy Item Reading Passage

Changes in Content Assessed on New
Assessments

• All New York students who took the NWEA Common Core aligned MAP test in the fall of 2012.
• Fall 2012 was first term in which the Common Core was the curriculum for New York students.
• Subgoal performance was analyzed by evaluating student response to over 1,000,000 items in each subject.
The Research
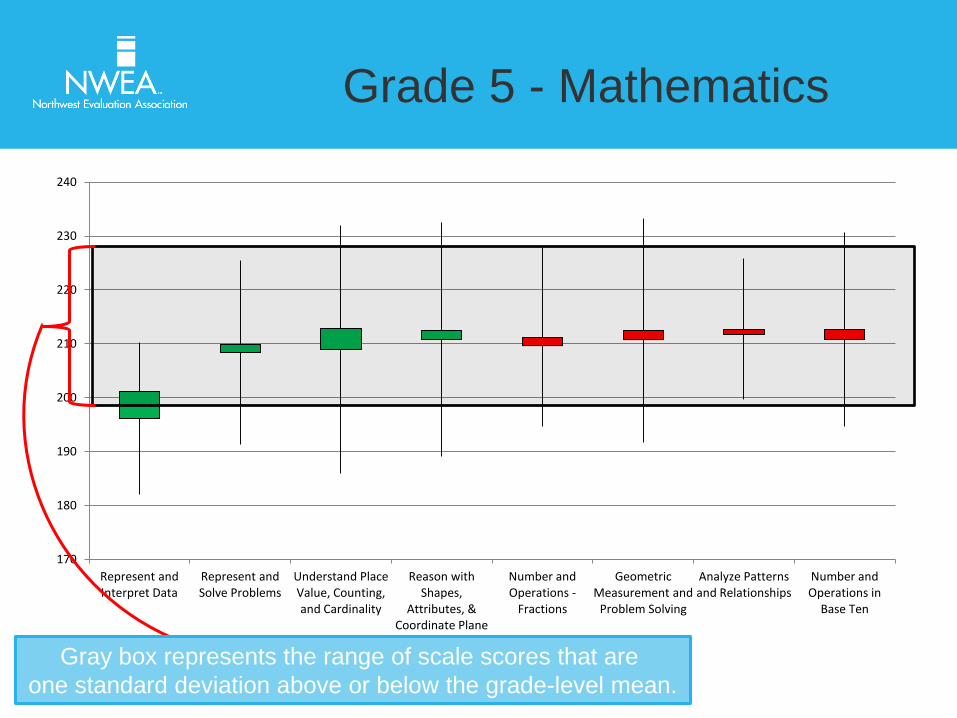
Grade 5 - Mathematics
170
180
190
200
210
220
230
240
Represent and Interpret Data
Represent and Solve Problems
Understand Place Value, Counting, and Cardinality
Reason with Shapes,
Attributes, & Coordinate Plane
Number and Operations -
Fractions
Geometric Measurement and
Problem Solving
Analyze Patterns and Relationships
Number and Operations in
Base Ten
Gray box represents the range of scale scores that are
one standard deviation above or below the grade-level mean.

Grade 5 - Mathematics
170
180
190
200
210
220
230
240
Represent and Interpret Data
Represent and Solve Problems
Understand Place Value, Counting, and Cardinality
Reason with Shapes,
Attributes, & Coordinate Plane
Number and Operations -
Fractions
Geometric Measurement and
Problem Solving
Analyze Patterns and Relationships
Number and Operations in
Base Ten
The line shows items’ range of difficulty (one standard deviation). This gives an indication of how difficult the skills being measured are in relation to the scale

Grade 5 - Mathematics
170
180
190
200
210
220
230
240
Represent and Interpret Data
Represent and Solve Problems
Understand Place Value, Counting, and Cardinality
Reason with Shapes,
Attributes, & Coordinate Plane
Number and Operations -
Fractions
Geometric Measurement and
Problem Solving
Analyze Patterns and Relationships
Number and Operations in
Base Ten
The box represents the difference between the average items difficulty value and the student’s actual performance on that item. A red box indicates that students underperformed relative to the item’s difficulty.

Grade 5 - Mathematics
170
180
190
200
210
220
230
240
Represent and Interpret Data
Represent and Solve Problems
Understand Place Value, Counting, and Cardinality
Reason with Shapes,
Attributes, & Coordinate Plane
Number and Operations -
Fractions
Geometric Measurement and
Problem Solving
Analyze Patterns and Relationships
Number and Operations in
Base Ten

Grade 6 – Mathematics
190
200
210
220
230
240
250
Using Sampling and Probability
to Make Decisions
Perform Operations
Expressions and Equations
Interpreting Categorical and
Quantitative Data
Ratios and Proportional Relationships
Extend and Use Properties
Congruence, Similarity, Right Triangles, & Trig
Geometric Measurement
and Relationships
Use Functions to Model
Relationships

130
135
140
145
150
155
160
165
170
175
180
Print Concepts Language: Grammar,
Usage
Language: Context Clues
and References
Phonics and Word
Recognition
Literature: Key ideas, Craft,
Structure
Vocabulary Acquisition and
Use
Informational Text: Key
Ideas, Details, Craft, Structure
Phonological Awareness
Capitalize, Spell,
Punctuate
Writing: Purposes: Plan, Develop, Edit
Grade 1 – English/Language Arts

160
170
180
190
200
210
220
Print Concepts, Phonics, and Word
Recognition
Word Relationships and Nuance
Literature: Key Ideas and Details
Informational Text: Craft and Structure
Context Clues and Reference
Informational Text: Key Ideas and Details
Literature: Craft and Structure
Grade 3 – Reading

180
185
190
195
200
205
210
215
220
225
230
Purpose and Audience
Capitalization Spelling Phrases, Clauses, Agreement, Sentences
Plan, Organize; Create Cohesion, Use Transitions
Parts of Speech Punctuation Establish and Maintain Style:
Use Precise Language
Provide Support; Develop Topics;
Conduct Research
Grade 5 – Language Usage

Implications of These Changes

How has student performance changed?
With the transitions to new standards and assessments, what do you actually know about how student performance has changed? Has performance improved or declined?
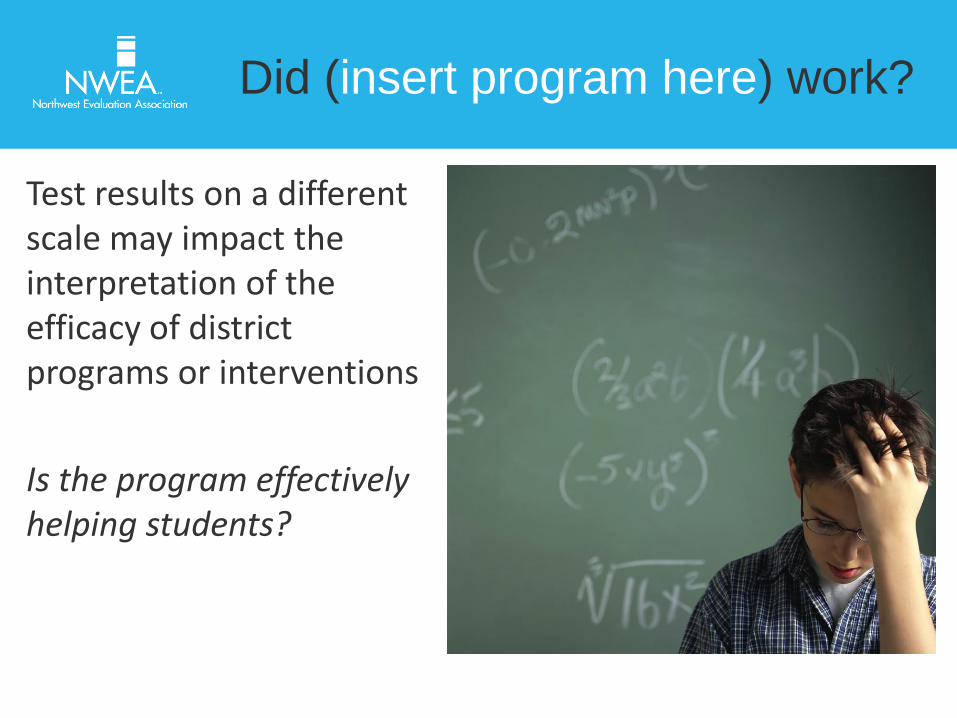
Did (insert program here) work?
Test results on a different scale may impact the interpretation of the efficacy of district programs or interventions
Is the program effectively helping students?

How will parents or the public view your school/district?
If student performance “appears” to decline, what message does that send to the broader public?
Could the perception of your school/district be skewed?

Conclusions & Recommendations

What should you do during this transition?
Maintain Own Longitudinal Data Systems -Data consistency
-Understand how students are progressing from year to year
-Can compare results from own data to state testing data

What should you do during this transition?
Maintain Own Longitudinal Data Systems
Promote Data Literacy in Your School - Important so educators fully understand how students are performing in their school
- Can understand and communicate if changes in student performance are consistent with changes in achievement
-Can more effectively communicate changes in student performance to parents and families
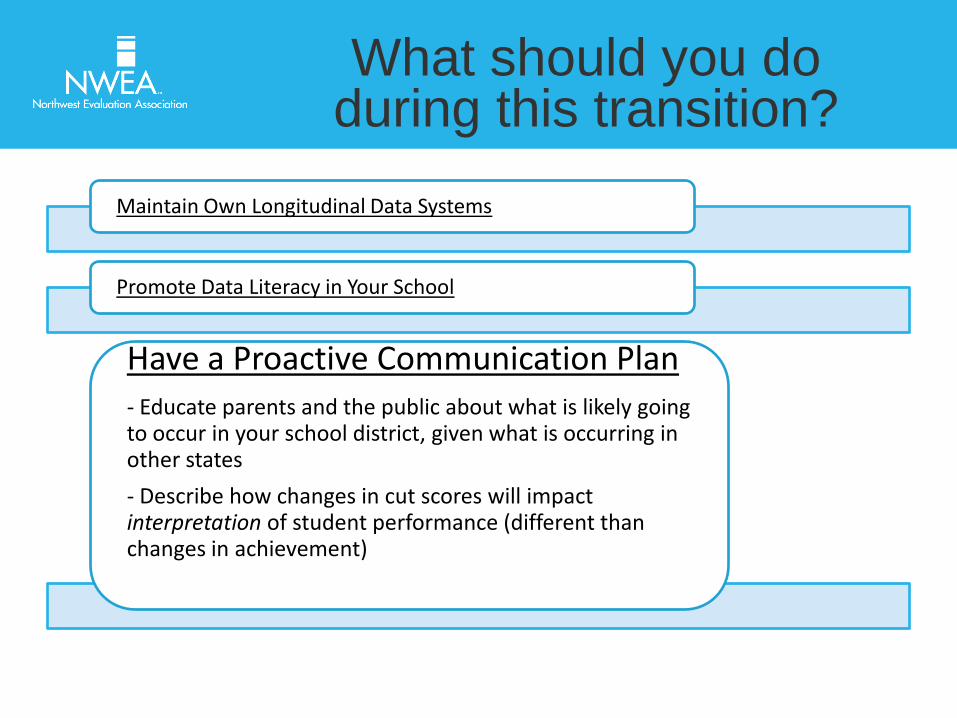
What should you do during this transition?
Maintain Own Longitudinal Data Systems
Promote Data Literacy in Your School
Have a Proactive Communication Plan - Educate parents and the public about what is likely going to occur in your school district, given what is occurring in other states
- Describe how changes in cut scores will impact interpretation of student performance (different than changes in achievement)
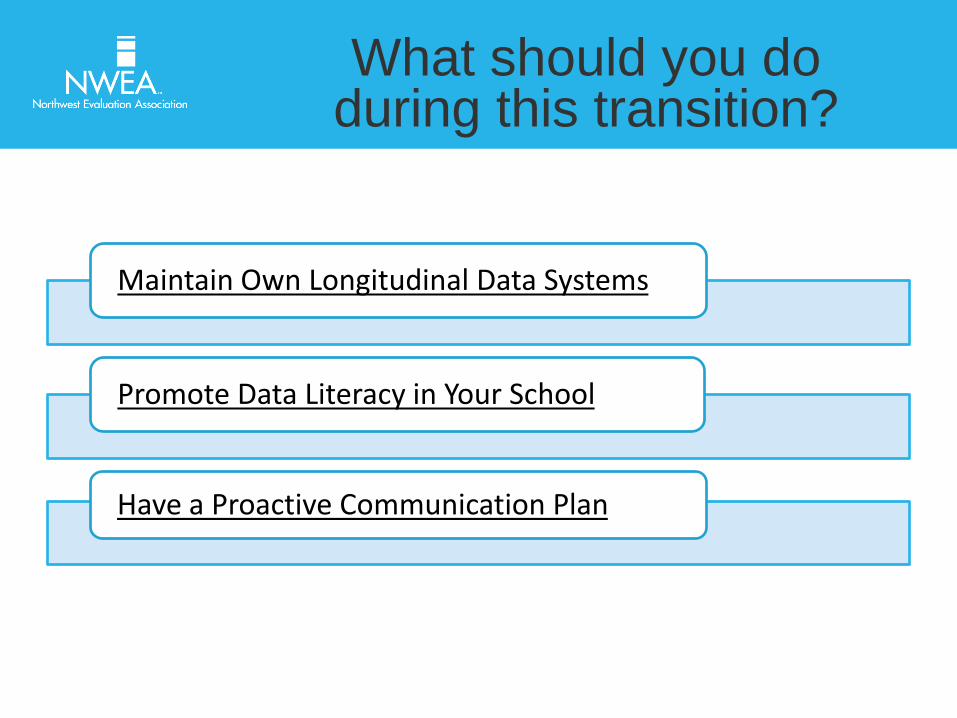
What should you do during this transition?
Maintain Own Longitudinal Data Systems
Promote Data Literacy in Your School
Have a Proactive Communication Plan

Presenter - John Cronin, Ph.D.
To contact us:
503-624-1951
Thank you for attending!