Embed Size (px)
Citation preview
What is Software Process Improvement
Tor StålhaneIDI / NTNU

What is SPI – 1 Many of the problems for the software industry are related to people, the way they •Work•Cooperate•Communicate Different companies have different ways to work, different cultures and different values. Solution to the problems need to be adapted to each company – there is no silver bullet and there is no such thing as “one size fits all”. For this reason, this course contains no “how to start using inspections”, “how to start using UML” or any other tool or method.
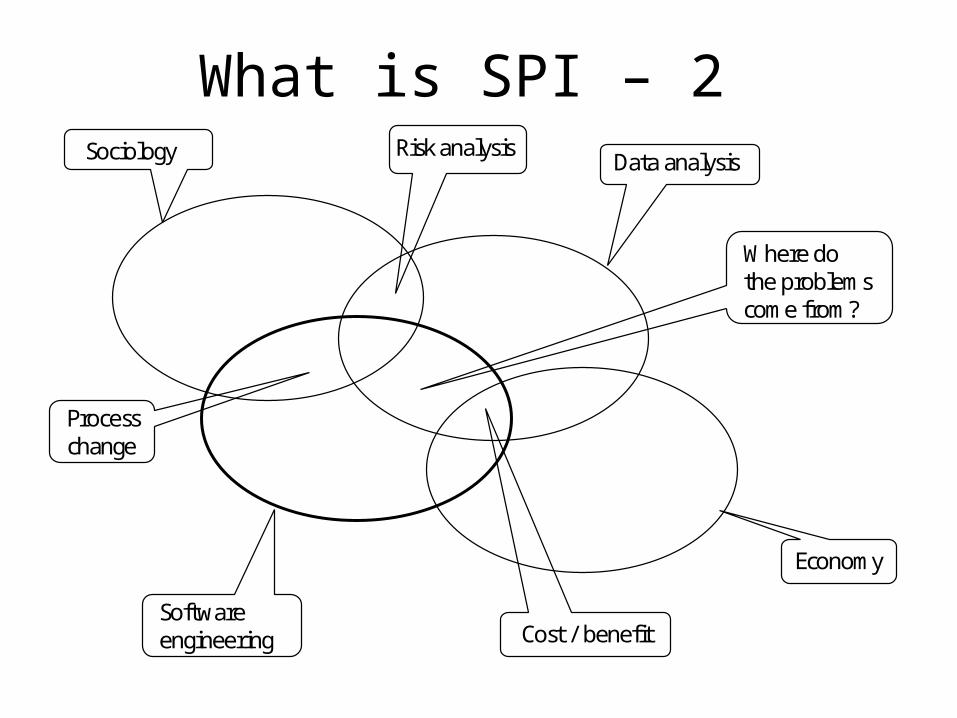
What is SPI – 2 Sociology Data analysis
Economy
Software engineering
Risk analysis
Process change
Cost / benefit
Where dothe problemscome from?

What is SPI – 3
The starting point of effective SPI is twofold - first and foremost:•“Listen to your customers”. Avoid complaints and elicit compliments.•“Listen to your personnel”. Fix the problems that they complain about and strengthen the things they like. Customers and developers have one thing in common – it is cheaper to keep the ones you have that to get new ones.

What is SPI – 4
In order to successfully implement SPI we need answers to the following questions:•What are our main problems?•How can we solve these problems?•How can we control that we really have solved the problems?•How can we avoid running into the same problems again?

The SPI feedback loop
Market Developers
Product
Customer feedback
Maintenance
Market Developers
Product
Customer feedback
Maintenance

Keep it simple SPI must be simple – it cannot be the exclusive field of advanced statistics and process experts. SPI will affect everyone in an organization. In order to be implemented, the ideas and processes of SPI must be trusted.
Trust stems from understanding what is going on and how it will affect those involved.
Trust can only be gained if the ideas and concepts are simple. Complicated statistical models and advanced, data-heavy decision models have their place but not here. In order to realize SPI, quality must be everybody’s business. If everybody shall participate, everybody must understand what is going on, why we do this and why we do that.

Know thy company Two questions need to be answered before we start improvement•what is your goal?•what are your competitive advantages? If we ignore these factors we might end up prescribing the wrong type of medicine.
Usually, the goal will be to•avoid complaints and defend the market share – a purely reactive strategy•elicit compliments and gain new market shares – a proactive strategy.
Current research seems to indicate that large companies will prefer the first strategy while the small ones will prefer the latter.

The job of the SPI engineer Identify the company’s most important problems. Many persons, both developers and management know what their main problems are. What the SPI engineer do is just to bring it to the surface. •Identify possible solutions – improvement opportunities. •Identify and give priorities to possible solutions.•Implement solution.•Check that the solution had the intended effect. Unfortunately, most companies don’t care about this last activity.

SPI through “Follow the bandwagon”We need to be aware that many companies never do any conscious SPI – i.e. collect data, analyse and decide.Instead they follow the bandwagon or any current fad, based on the argument that if•Company X does it, it must be a smart move.•If guru Y recommends it, it must be a good way to do the job

The bandwagon effect – 1 The basic bandwagon model has a feed-back loop where the bandwagon effect is strengthened by the observation that more companies has adopted a certain technique or tool, thus leading more companies to follow in their footsteps. Not all companies will jump on the bandwagon right away, since different companies need different levels of pressure – bandwagon threshold – before they give in.

The bandwagon effect – 2 The general mechanism seems to be•A few early adopters start to use a new technology. This creates a small bandwagon effect.•Companies with a low bandwagon threshold will get on, thus creating a stronger bandwagon effect.•This brings on companies with a higher threshold, thus creating a stronger bandwagon effect and so ad infinitum.•This adoption cycle stops when the new level of the bandwagon effect stays below the adoption threshold for the remaining part of the relevant industrial sector.
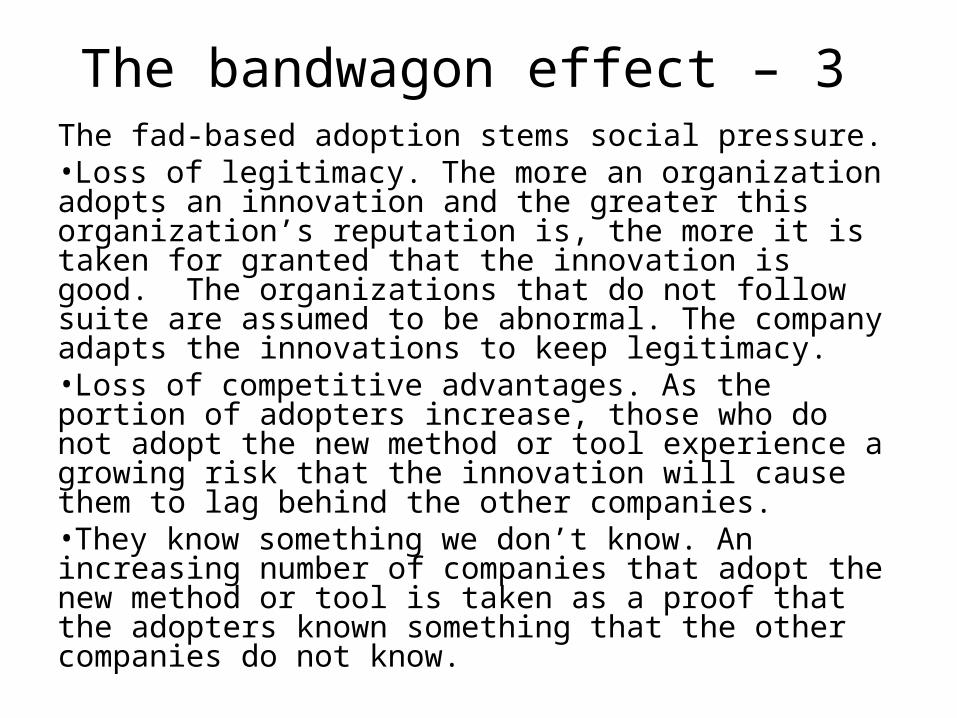
The bandwagon effect – 3 The fad-based adoption stems social pressure.•Loss of legitimacy. The more an organization adopts an innovation and the greater this organization’s reputation is, the more it is taken for granted that the innovation is good. The organizations that do not follow suite are assumed to be abnormal. The company adapts the innovations to keep legitimacy. •Loss of competitive advantages. As the portion of adopters increase, those who do not adopt the new method or tool experience a growing risk that the innovation will cause them to lag behind the other companies. •They know something we don’t know. An increasing number of companies that adopt the new method or tool is taken as a proof that the adopters known something that the other companies do not know.

Ambiguity We have three types of ambiguity:•State ambiguity: ignorance about possible future states of the environment – where will we be? •Effect ambiguity: ignorance about the effect of a future state of the environment – what are the consequences? •Response ambiguity: ignorance about the outcome of response choices for a specific environmental state – how can we handle it?

Bandwagon effect – simple approach • Bi,k: company i’s assessment of the innovation’s
profitability in cycle k. • Ii: company i’s individual assessment of the innovation’s
profitability – positive or negative.• A: experienced level of ambiguity. 0 < A < 1. • nk-1: proportion of adopters after cycle k-1.
Adapt the invention whenever Bi,k > 0
1, kiki AnIB

Bandwagon effect – advanced approach
• ri: the reputation of organization i.• Di,k: an indicator variable that is equal to 1 if
organization i has adopted the innovation by bandwagon cycle k and 0 otherwise.
• Pi: real profit achieved by organization i.• L: number of bandwagon cycles required to
transmit profitability information.
1
1,1,, )1(
Lk
Lkiikiiiki n
DPADrAIB

Parameters Some of the parameters need to be assessed before we can get useful results. These parameters are by their nature subjective.•Ii: company i’s individual assessment of the innovation’s profitability – positive or negative.•A: experienced level of ambiguity. 0 < A < 1. •ri: the reputation of organization i.
•L: number of bandwagon cycles required to transmit profitability information.

SPI – main principles • Keep it simple
The many advanced techniques and methods surely have their place in research but when running an SPI program in a company, they are counterproductive. The participant will not understand such methods and it is deeply rooted in human nature to distrust what we cannot understand.
• Goal orientedTo just try some improvements and see if it helps is a waste of resources.
• Risk drivenUnderstand our risks and how they compare to the expected benefits, what we can do to reduce them and how the cost of this reduction compares to the benefits that we gain.
• Cost – benefitUnderstand our costs and the benefits. This cost – benefit analysis must include both direct savings and future opportunities.
• Learn from experience If we use our experience to make decisions we must evaluate the decisions when we have the facts. If it was a smart decision we need to know how to reuse the experience, otherwise we need to learn how to avoid doing the same mistake the next time we are in a similar situation.
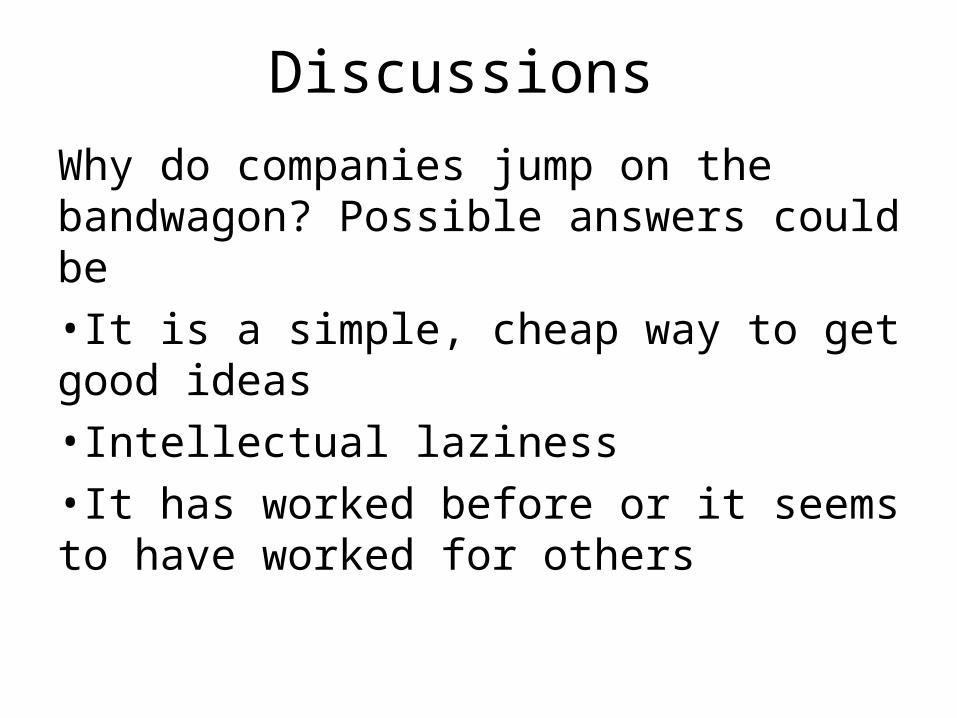
Discussions Why do companies jump on the bandwagon? Possible answers could be•It is a simple, cheap way to get good ideas•Intellectual laziness •It has worked before or it seems to have worked for others

To improve or not to improve
Tor StålhaneIDI / NTNU
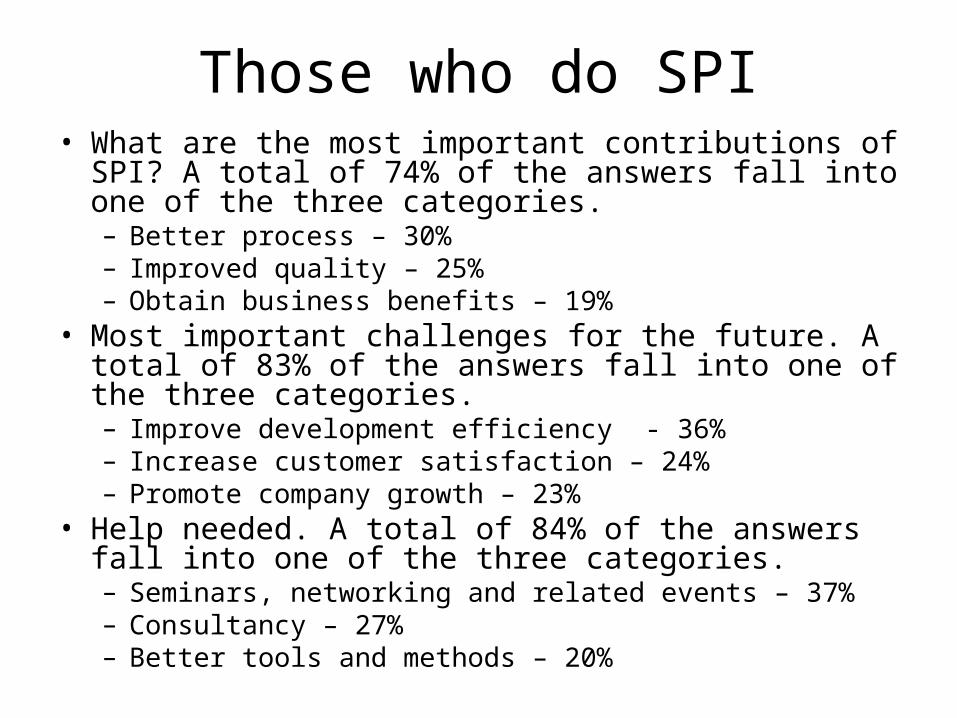
Those who do SPI• What are the most important contributions of SPI? A total
of 74% of the answers fall into one of the three categories.– Better process – 30%– Improved quality – 25%– Obtain business benefits – 19%
• Most important challenges for the future. A total of 83% of the answers fall into one of the three categories.– Improve development efficiency - 36%– Increase customer satisfaction – 24%– Promote company growth – 23%
• Help needed. A total of 84% of the answers fall into one of the three categories.– Seminars, networking and related events – 37%– Consultancy – 27%– Better tools and methods – 20%

Those who don’t do SPI• What are the most important reasons for not doing SPI? A
total of 70% of the answers fall into one of the two categories.– Do not have resources available – 40%– Cost too much – 30%
• Most important challenges for the future. A total of 74% of the answers fall into one of the three categories.– Increase customer satisfaction – 29%– Be more innovative – 26%– Promote company growth – 19%
• Help needed. A total of 80% of the answers fall into one of the four categories.– Consultancy – 24%– Networking – 24%– Formative help – 18%– Financial help – 14%

How are these companies equal?
Both groups (47% and 48%) prioritized:– Increase customer satisfaction – Promote company growth
•Both groups (64% and 48%) needed – Seminars, networking and related events – Consultancy

Five improvement goals • Cost reduction – constant output, reduced input.
“Mean and lean” is the archetype for this approach. • Controlled growth – large increase in output, smaller
increase in input. Most investment models are based on this idea, for instance when we want to improve by buying a new tool or hire more qualified people.
• Work smarter – increased output, constant input. Better ways to do things. This is the most important angel to SPI.
• Controlled reduction – small decrease in output, large decrease in input. We will not discuss this area.
• Work more efficient – increased output, decreased input. Some of the SPI activates, for instance reducing rework or improving requirements specification.
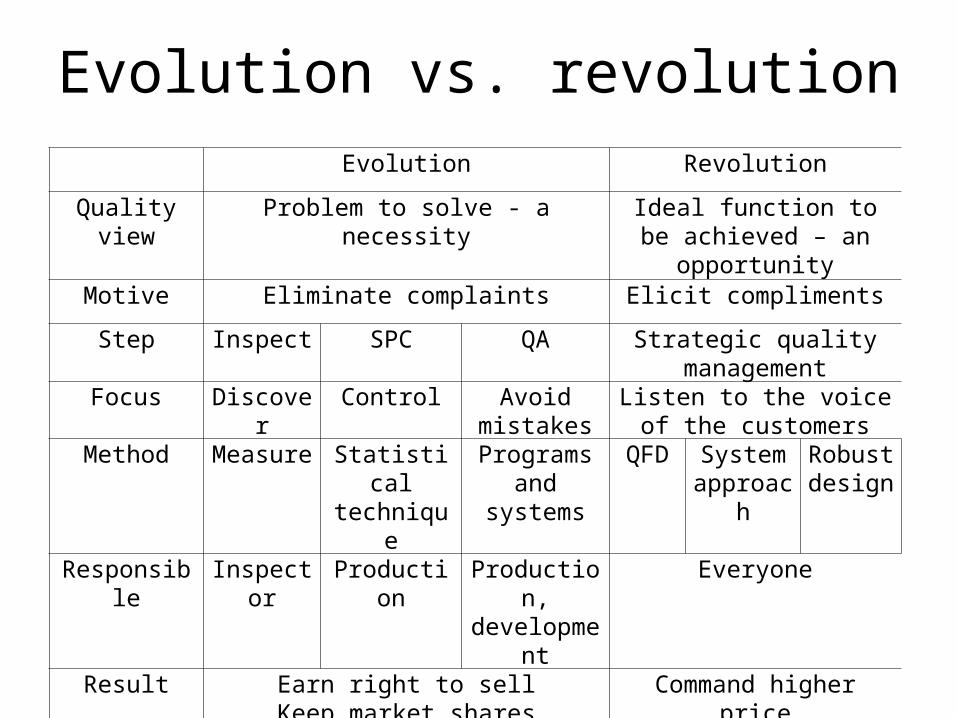
Evolution vs. revolution Evolution Revolution
Quality view Problem to solve - a necessity Ideal function to be achieved – an opportunity
Motive Eliminate complaints Elicit compliments
Step Inspect SPC QA Strategic quality management
Focus Discover Control Avoid mistakes
Listen to the voice of the customers
Method Measure Statistical technique
Programs and systems
QFD System approach
Robust design
Responsible Inspector Production Production, development
Everyone
Result Earn right to sellKeep market shares
Command higher priceGain market share

PDCA
We have seen the PDCA wheel earlier. We have added an extra wheel that may be needed before and during the planning session
Plan
Do Check
Act
Understand
Analyze
Select
Plan
Do Check
Act Plan
Do Check
Act
Understand
Analyze
Select
Understand
Analyze
Select

The Quality Improvement Paradigm – 1
The PDCA is quite general. We can get more insight by using the Quality Improvement Paradigm – QIP – as shown on the next slide.
• QIP separates – Project learning – what the project staff learns during
the project– Organization learning – what the organization as a
whole is able to learn from the project. • QIP is somewhat more detailed – e.g. “Plan” =>
– Characterize– Set goals
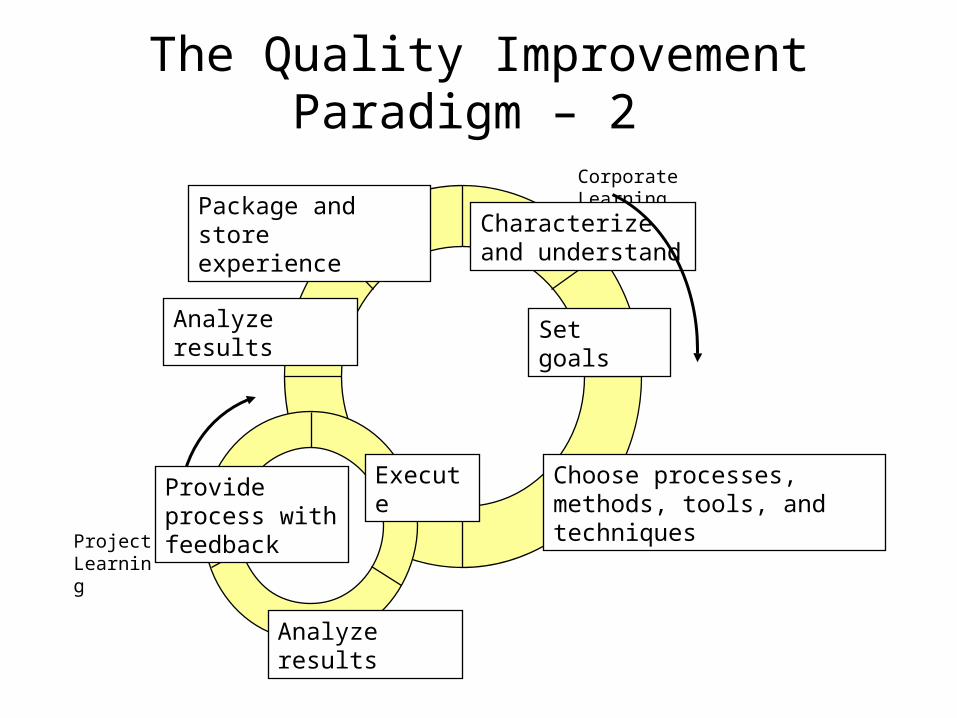
The Quality Improvement Paradigm – 2
Corporate Learning
Characterizeand understand
Set goals
Choose processes, methods, tools, and techniques
Analyze results
Package and store experience
ProjectLearning
Analyze results
Provide process with feedback
Execute

The Quality Improvement Paradigm – 3
Individual Collective
Tacit Personal experience
Common sense
Explicit Proprietary Open to everybody
In the project Transferred

The complete SPI process – 1
There are two ways to look at the SPI process:•An extended and detailed version of the PDCA wheel•The 4V model
We will give a short walkthrough of both of these models.

Detailed PDCA – 1
Identify opportunities
Analyse current process
Form team and scope
proejct
Define desired outcom of improved process
Identify root causes and proposed solutions
Prioritize, plan and test
proposed solutions
Refine and implement solutions
Measure progress and
hold gains
Aknowledge team and
communicate results
Identify opportunities
Identify opportunities
Analyse current process
Analyse current process
Form team and scope
proejct
Define desired outcom of improved process
Define desired outcom of improved process
Identify root causes and proposed solutions
Prioritize, plan and test
proposed solutions
Prioritize, plan and test
proposed solutions
Refine and implement solutions
Refine and implement solutions
Measure progress and
hold gains
Measure progress and
hold gains
Aknowledge team and
communicate results
Aknowledge team and
communicate results
Plan
Do
Check
Act

Detailed PDCA model – 2 • Analyse current process – flow charts, brain
storming and cause and effect diagrams.• Define desired outcome of improved process –
brainstorming in addition to such techniques as Pareto analysis.
• Identify causes and proposed solutions – brainstorming, Pareto analysis and root cause analysis.
• Priorities, plan and test proposed solutions – plotting techniques such as histograms and scatter plots, Pareto analysis and brainstorming.
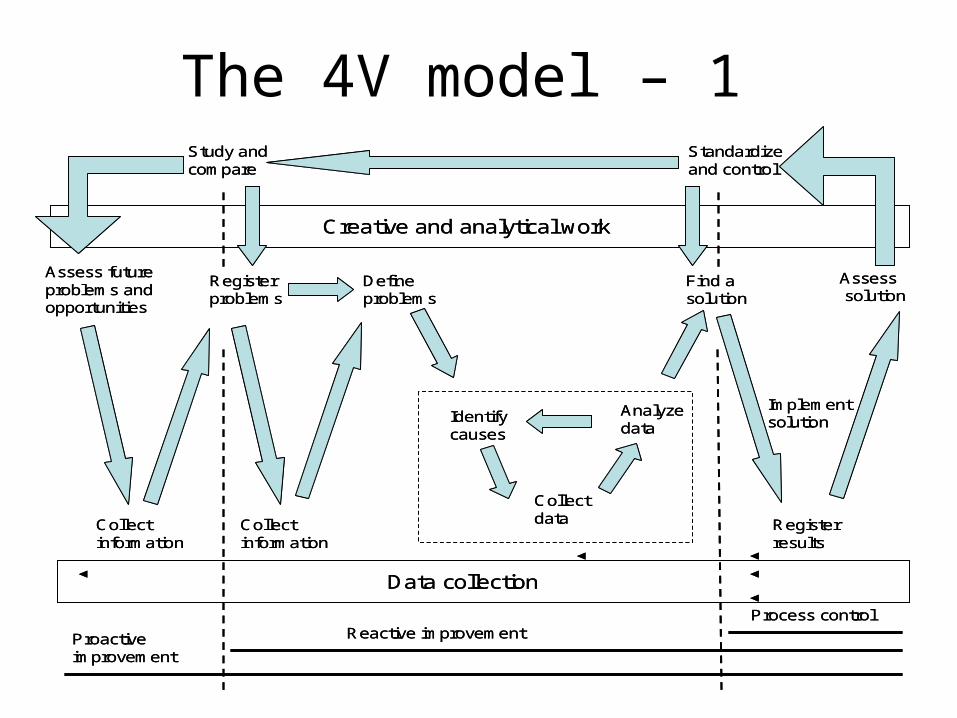
The 4V model – 1
Creative and analytical work
Data collection
Assess futureproblems and opportunities
Collectinformation
Registerproblems
Collectinformation
Define problems
Identifycauses
Analyze data
Collect data
Find a solution
Registerresults
Implementsolution
Assesssolution
Standardizeand control
Study and compare
Process controlReactive improvement Proactive
improvement

The 4V model – 2 The diagram contains three SPI approaches: •process control •reactive improvement•proactive improvement.
The diagram shows how SPI work moves between two levels of work – being creative / analytical and collecting data. As we can see on the top of the diagram, it also contains the two SPI phases freeze and unfreeze; here called standardize / control and study / compare respectively.

Discussion
About half of the companies in a survey stated that customer satisfaction and company growth are important. It seems that many developers are more concerned about making smart pieces of code than making their customers happy or making their company grow. Why?