Embed Size (px)
Citation preview

8/7/2019 What is Regression Model
http://slidepdf.com/reader/full/what-is-regression-model 1/15
What is Regression Model?
Suppose you have data of population (in hundred thousand) of a medium size city over 20 years
(based on every 5-year census) as shown table 1. You want to predict the population in the year 2005. How do you predict that population? There are many ways to predict the future based onthe previous data. We are going to learn one of the famous methods called regression model.
Table 1 data for regression analysis
Let us plot the data above into a graph. One point in the graph represents data of one year. Since
we have 5 data, thus we have five points.
From the figure above, we can see that the five points seems to have a linear relationship (could
be model by a straight line)! Can you guess a line that will pass around those points? That line isnot necessarily passed through any point of the data, but it should be the best model that we can
use to represent the five points.
We have several proposals here. I will plot three seems best proposal:
y Blue line (slash dot line)
y R ed line (solid line)y Green line (small dot line)

8/7/2019 What is Regression Model
http://slidepdf.com/reader/full/what-is-regression-model 2/15
If we could make that ³best line model´, we may use it to predict the next point of population inthe year 2005. The prediction point is just an intersection of vertical line that pass through year
2005 and the ³best line model´. Which one of the three proposals is the ³best line model´?
To determine the ³best´ line model, we need a criterion to say that it is the best. We can generatemany criteria. Can you think of any criteria that we can use to say that that line is the best one?
For example, some of you may suggest the following criteria
y The best line model should pass through the most point of the data
y The best line model should pass through the first point of the data (the blue line or slashdot line do that)
y The best line model should be in the middle of all points of the data (perhaps, the greenline or small dot line do)
All of those criteria above are good for each of you, but how do we know that the criteria aboveis the best? We need an objective criterion, rather than subjective criterion by saying ³It is the
best because I said so!´ Objective criterion needs measurement. Perhaps we can measure theerror (mistake) between the model (as prediction of the data) and the real data points. The
diagram below is showing how we measure the error. When the point data is above the linemodel, we say that the error is positive, while if the line model is above the data, we say the error
is negative.

8/7/2019 What is Regression Model
http://slidepdf.com/reader/full/what-is-regression-model 3/15
We need an agreement here that our best line model is really the optimum line. Some of you maysay that what we need to do is to sum all the error and the best line model is the line model that
minimizes the sum of error. That seems a great idea, but it does not work because some error is positive and some of the error is negative. The sum of error may be zero. If we sum all the error,
we may get many lines. How do we solve this problem?
The most common agreement among scientist and engineers, mathematician and statistician is a
criterion that the best line model should minimize the sum square error . When we square theerror, regardless it is positive or negative, the number become positive.
Now we come back to our data, we measure the sum of square error among the three proposal
lines and the results are shown in the table below. We may obtain that the red line give theminimum sum of square error (=0.09) among the three proposals.
year Population data (hundredthousand)
Blue line or slash dotline
(square error)
R ed line or solidline
(square error)
Green line or smalldot line
(square error)
1980 2.1 2.10 (0.00) 2.08 (0.00) 1.66 (0.19)1985 2.9 2.90 (0.00) 2.76 (0.02) 2.60 (0.09)1990 3.2 3.70 (0.25) 3.44 (0.06) 3.54 (0.12)
1995 4.1 4.50 (0.16) 4.12 (0.00) 4.48 (0.14)2000 4.9 5.30 (0.16) 4.80 (0.01) 5.42 (0.27)
SSE= Sum Square Error
( 0.57 ) ( 0.09 )(0.81)

8/7/2019 What is Regression Model
http://slidepdf.com/reader/full/what-is-regression-model 4/15
In above procedure we have proposed several best line models by guessing it and then we findthe best line model based on the criteria of minimizing sum square error. The problem is in the
g uessin g of the line. Can we obtain the best line model without guess it?
Fortunately, the answer is yes. The best line model can be computed using formula of linear
regression. We denote as the mean of . Notation is the estimated of , that isrepresented by the best line model. The linear regression formula is
Using above formula, we get best line model is
Now we can predict the number of population in the city for year 2005. By inputting 2005 to theyear we get population = 5.48 (x hundred thousand persons).
The purpose of modeling is to find the best model that can represent your data. Suppose you
have a regression formula as the best line model. How can we be surethat the best line is linear? In other words, how fit is the data to our model? There are unlimited
numbers of model combination aside from linear model. Our data may be represented bycurvilinear or non-linear model.
The first step is to see visually by plotting the data. Use independent variable as x-axis anddependent variable as y-axis. This plot will give you idea on what type of model you may use as
the best-fit model for your data. Modeling is quite an art that we need to µguess' what is the bestmodel. If the plot shows that the data is not linear, you must try to use other type of model or
other combination of variables. Do not force yourself to use linear model when your data is non-linear!
Several indices can be used to examine the goodness of fit of the model. These indices must be
used with care and understanding on the meaning. Most common indices are
1. R -squared, or coefficient of determination
2. Adjusted R -squared3. Standard Error
4. F statistics5. t statistics

8/7/2019 What is Regression Model
http://slidepdf.com/reader/full/what-is-regression-model 5/15
To say that your model is fit, you need to prove that all those indices should exceed the criteria.
Below is the brief discussion of these indices together with the criteria.
One of the indices to measure model goodness of fit is R -squared, or coefficient of
determination. It is the proportion of variation explained by the best line model. It depends on the
ratio of sum of square error from the regression model (SSE) and the sum of squares differencearound the mean (SST = sum of square total)
where and .
However, the SST and SSE are not measure of the variance. To use the proportion of variances,we need to average the sum of square. As the result we have
Where mean square error is and mean square total is for
is the number of sample and is the number of coefficients in the model. Obviously, the
relationship of R -squared and adjusted R -squared is .
F or g eneral rule of thumb, the R-squared or adjusted R-squared should be hi g her than 0.80 to
produce a g ood linear model . If your R -squared is less than 0.5, it is recommended that youconsider other type of model rather than linear model.
Standard Error is another index that often be used for goodness of fit of the model

8/7/2019 What is Regression Model
http://slidepdf.com/reader/full/what-is-regression-model 6/15
Another index for goodness of fit of the model is F-statistic,
Where Mean Square R egression is given as
The F statistics is often presented as ANOVA (analysis of Variance) table below
Degree of freedom
Sum of square Mean square F
R egression
R esidual (Error)
Total
If the R -squared approach one, the value of standard error will approach zero and the value of Fstatistic goes to infinity. The F statistic is compared with the F value from the F distribution with
degree of freedom ( , ).
You may allow some degree of error for your model to be quite small. This error degree is calledsignificant level, denoted by . For many practical purposes, we use = 5%. If the significant
level is less than 0.05, the model is said to be best fit. Since the three indices are related to
each other, for practical purposes, we often use only R -squared as the index to represent best fitof the model.
While the other four indices above represent the overall fitness of the model, t statistics explainthe fitness of individual model parameter. If the t-statistics of a parameter is less than t
distribution with degree of freedom n-2 at significant level , that parameter cannot explainthe model well. For practical purposes, when your data is more than n >30 samples, we can use
the value of Normal distribution to approximate the t distribution. For significant level = 0.05,you may use threshold of 1.96. Thus, if the t-statistics of a parameter is less than 1.96, that
parameter cannot be used to explain the model .

8/7/2019 What is Regression Model
http://slidepdf.com/reader/full/what-is-regression-model 7/15
In the next sections, you may see how to obtain our best line model using linear regressionformula by hand calculation or spreadsheet. You may apply that formula without worrying about
how to compute using the linear regression formula, check how you could do it with just a few
clicks and little typing using Microsoft Excel.
Suppose we have the following 5 data points and we want to predict the population data for the year
2005 using linear regression model. In this section, we will use hand calculation or spreadsheet using
linear regression formula.
The formula for linear regression is given below
To use that formula, we make a table consists of four columns. The first two columns are the
data Year as and Population as . The third column is multiplication of for each row and
the last column is square of . You can use MS Excel spreadsheet to ease your hand
computation.
x y xy x^2
Year Population square error sq. mean difference
1980 2.1 4158 3920400 0.0004 1.80
1985 2.9 5756.5 3940225 0.0196 0.29
1990 3.2 6368 3960100 0.0576 0.06
1995 4.1 8179.5 3980025 0.0004 0.44
2000 4.9 9800 4000000 0.01 2.13
sum 9950 17.2 34262 19800750 0.088 4.71
average 1990 3.44
count n = 5

8/7/2019 What is Regression Model
http://slidepdf.com/reader/full/what-is-regression-model 8/15
We sum all the five rows and for the first two columns, we calculate the average of year as
=1990 and the average of population as = 3.44. Since we have 5 data, then
Thus, we get the regression line
Using this regression line, we can predict the number of population in the city for year 2005. Byinputting 2005 to the year we get population = 5.48 (x hundred thousand persons).
The R -squared value can be computed as

8/7/2019 What is Regression Model
http://slidepdf.com/reader/full/what-is-regression-model 9/15
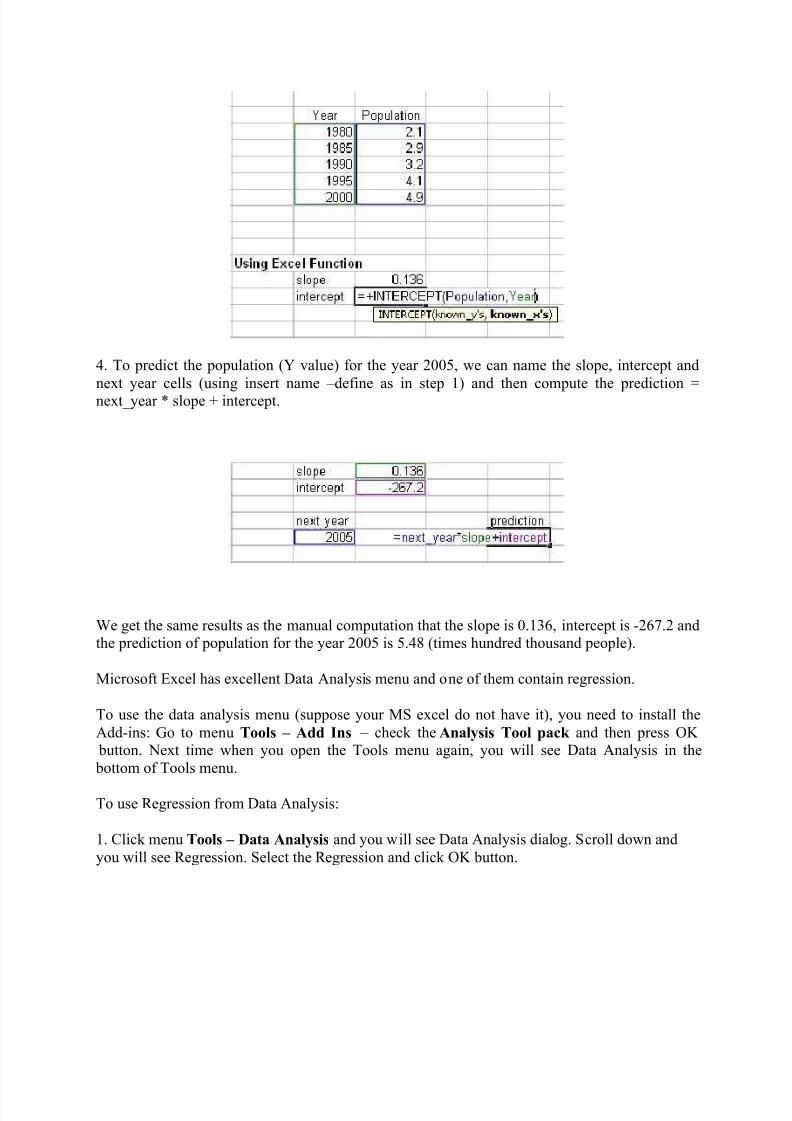
Microsoft Excel has built in function SLOPE and INTER CEPT to calculate linear regressionslope and intercept.
Suppose we have the following 5 data points and we want to predict the population data for the
year 2005 using linear regression model.
We put the independent variable Year as and dependent variable Population as . The
Systematic procedure is as follow
1. We put the data in two columns table in the spreadsheet as shown in the figure below. For each column, we put name of the array using MS excel menu Insert-Name-Define. For example,
the name is Year and Population
2. To compute the slope of linear regression line using MS excel function, type
=Slope(Population, Year) as shown in the figure below
3. To determine the intercept of the linear regression line, type = Intercept (Population, Year) asshown in the figure below
8/7/2019 What is Regression Model
http://slidepdf.com/reader/full/what-is-regression-model 10/15
4. To predict the population (Y value) for the year 2005, we can name the slope, intercept and
next year cells (using insert name ±define as in step 1) and then compute the prediction =next_year * slope + intercept.
We get the same results as the manual computation that the slope is 0.136, intercept is -267.2 andthe prediction of population for the year 2005 is 5.48 (times hundred thousand people).
Microsoft Excel has excellent Data Analysis menu and one of them contain regression.
To use the data analysis menu (suppose your MS excel do not have it), you need to install the
Add-ins: Go to menu Tools ± Add Ins ± check the Analysis Tool pack and then press OK button. Next time when you open the Tools menu again, you will see Data Analysis in the
bottom of Tools menu.
To use R egression from Data Analysis:
1. Click menu Tools ± Data Analysis and you will see Data Analysis dialog. Scroll down and
you will see R egression. Select the R egression and click OK button.
8/7/2019 What is Regression Model
http://slidepdf.com/reader/full/what-is-regression-model 11/15
2. R egression dialog will pop up and you can fill the Input Y range and input X range. If you
have defined the name of your data (e.g. Population and Year) using menu Insert ± Name ± Define, you can just type the name of your data instead of searching it. When you click the OK
button in the regression dialog, MS excel will automate the procedure to compute regression for you.
Suppose we have the following 5 data points and we want to predict the population data for theyear 2005 using linear regression model.
We put the independent variable Year as and dependent variable Population as .

8/7/2019 What is Regression Model
http://slidepdf.com/reader/full/what-is-regression-model 12/15
Here is the result of the Data Analysis of R egression. There are many numbers on it and I willtell you only what is important:
First, you need to examine the Coefficients. These are the intercept and the slope of the
regression analysis. The slope is 0.136, intercept is -267.2 for the 5 observations data above.
Thus, your regression model is
Next, your regression model needs to pass all the three criteria below
1. The R square must be bigger than 0.802. The significant F (from ANOVA) must be smaller than 0.05
3. The absolute value of t-statistics must be larger than 1.96 for =0.05 and must larger
than 1.645 for =0.10
If you cannot pass any of the three criteria above, you should plot your data and check whether your data is really a linear model (could be model by a straight line). If your data is not linear,you may transform it to linear model or you should you non-linear regression instead. The
explanation on why these criteria are important is quite long and I would rather ask you to readstatistical book for the explanation.
For our example, it seems all the criteria above could be passed by our model. Using this
regression model, we can predict the number of population in the city for year 2005. By inputting2005 to the year we get population = 5.48 (x hundred thousand persons).

8/7/2019 What is Regression Model
http://slidepdf.com/reader/full/what-is-regression-model 13/15
After you plot your data in say XY type graph, you can also get the regression line directly fromthe graph. Here is the procedure
1. I assume you already have the data and plot it in XY type. Suppose the data is only five points
of populations in 20 years gathered every 5 consecutive years as shown in the figure below.
2. Click on any data point. Then do R ight click and pop up menu will appear. Select Add
Trendline«
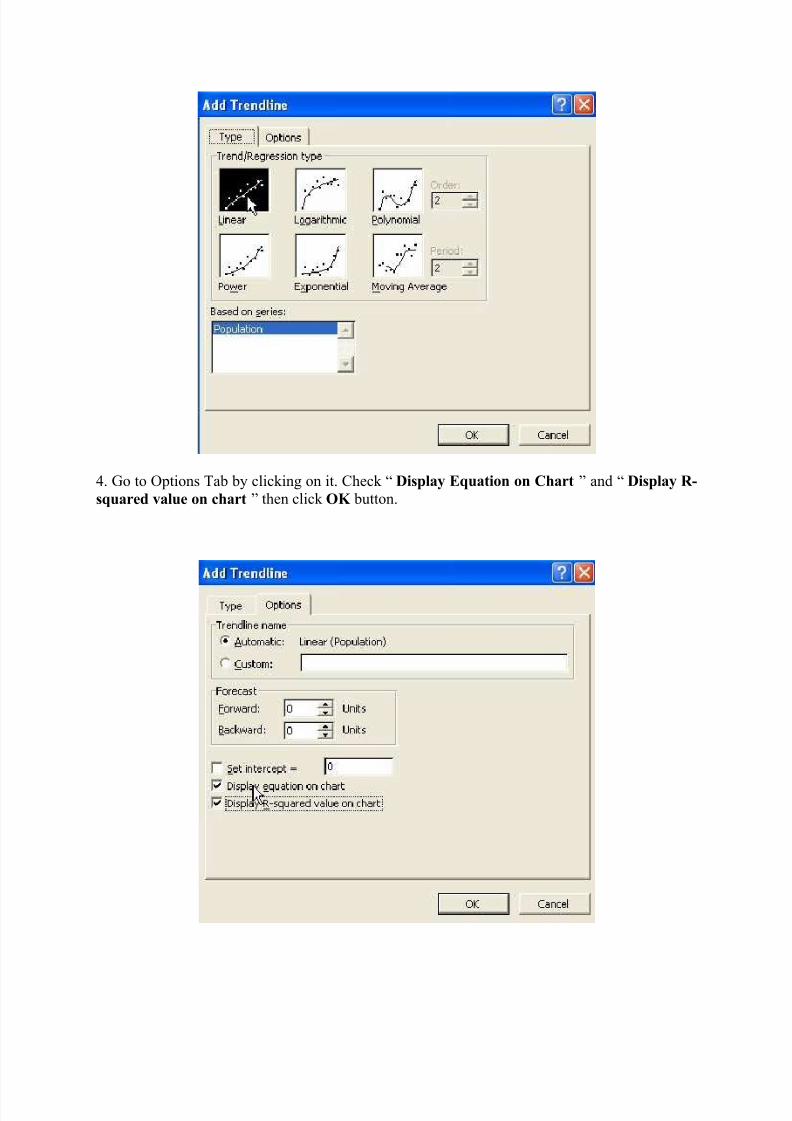
3. Add Trendline dialog will appear. Select Linear Trend/R egression type.
8/7/2019 What is Regression Model
http://slidepdf.com/reader/full/what-is-regression-model 14/15
4. Go to Options Tab by clicking on it. Check ³ Display Equation on Chart ´ and ³ Display R-
squared value on chart ´ then click OK button.

8/7/2019 What is Regression Model
http://slidepdf.com/reader/full/what-is-regression-model 15/15
5. The results of regression line as well as the regression equation model and the R -squared valuewill appear on the chart.
This trend line is quite dynamic. If you change your data, the trend line (and the regressionequation) will also change automatically.