Embed Size (px)
Citation preview
17 MAY 2021
LOCALISATION:
WHAT IS REALISTIC?
AN INDEPENDENT STUDY PREPARED BY INTELLIDEX
FOR BUSINESS UNITY SOUTH AFRICA & BUSINESS LEADERSHIP SOUTH AFRICA
About Intellidex
Intellidex was founded in 2008 by Stuart Theobald and is a leading research and consulting firm that specialises in financial services and capital markets as well as studying South
Africa’s political economy and policy environment. Its analysis is used by companies, investors, stockbrokers, regulators, lawyers and companies in South Africa and around the
world. It has offices in Johannesburg, London and Boston.
Intellidex is independent and not affiliated with any financial services company or media house. It takes pride in the integrity and independence of its research.
About Business Unity South Africa
As the apex organised business entity representing South African business, BUSA is the formally recognised representative of business at the National Economic Development and
Labour Council (NEDLAC). BUSA also represents business on bilateral processes and in the Presidential Business Working Groups. BUSA serves as a social partner in the national
policy development and social dialogue process and nominates representatives to sit on statutory and advisory bodies on behalf of business.
BUSA’s work is focused around influencing policy and legislative development for an enabling environment for inclusive growth and employment. As a member-driven
organisation, BUSA represents the cross-sectoral perspective of matters brought to its agenda by its members.
BUSA is committed to building an enabling environment to achieve a vibrant, diverse and globally competitive economy that harnesses the full economic and human potential
of South Africa.
About Business Leadership South Africa
BLSA is an independent association whose members include the leaders of some of South Africa’s biggest and most well-known businesses. Through this forum, South Africa’s
business leaders engage key players in South African society, including government, civil society and labour, to exchange ideas in our national interest and to create effective
dialogue. Business Leadership South Africa (BLSA) is the organisation through which members not only express this belief but take action to create a more prosperous and
inclusive South Africa.
BLSA’s purpose is to build an environment in which globally competitive and national responsible companies can prosper. By so doing, BLSA contributes to building strong
communities underpinned by job creation through sustained economic growth.
As an organisation BLSA is focusing on three core activities, which combined with our contract with South Africa, will help to facilitate a better and inclusive South Africa.
Disclaimer
This research report was issued by Intellidex (Pty) Ltd.
Intellidex aims to deliver impartial and objective assessments of securities, companies, and other subjects. The information contained in this report is based on sources that
Intellidex believes to be reliable, but Intellidex makes no representations or warranties regarding the completeness, accuracy or reliability of any information, facts, estimates,
forecasts or opinions contained in this document. The information and opinions could change at any time without prior notice. Intellidex is under no obligation to inform any
recipient of this document of any such changes.
No part of this report should be considered as a credit rating or ratings product, nor as ratings advice. Intellidex does not provide ratings on any sovereign or corporate entity for
any client.
Intellidex, its directors, officers, staff, agents, or associates shall have no liability for any loss or damage of any nature arising from the use of this document.
Disclosure
This research was commissioned by Business Unity South Africa and Business Leadership South Africa but was conducted independently by Intellidex. Intellidex retained full
editorial control and is solely responsible for the content of this report.
The lead analyst responsible for this report was Peter Attard Montalto, Head of Capital Markets Research
The opinions or recommendations contained in this report represent the true views of the analyst(s) responsible for preparing the report. The analyst’s remuneration is not affected
by the opinions or recommendations contained in this report, although his/her remuneration may be affected by the overall quality of their research, feedback from clients and
the financial performance of Intellidex group entities.
Intellidex staff may hold positions in financial instruments or derivatives thereof which are discussed in this document. Trades by staff are subject to Intellidex’s securities trading
policy which can be obtained by emailing [email protected].
Intellidex may have, or be seeking to have, a consulting or other professional relationship with the companies, sovereigns or individuals mentioned in this report. A copy of
Intellidex’s conflicts of interest policy is available on request by emailing [email protected].
Copyright
© 2021. All rights reserved. This document is copyrighted to Intellidex (Pty) Ltd. Prior written permission must be obtained before using the content of this report in other forms
including for media, commercial or non-commercial benefit, aside from quotations in line with fair use provisions.

LOCALISATION: WHAT IS REALISTIC? 17 MAY 2021
www.intellidex.co.za 2
Forward
The study on localisation undertaken by Intellidex for Business Unity SA (BUSA) and Business Leadership SA
(BLSA) is very opportune and serves as a touch point in the ongoing engagements on promoting local
manufacturing in SA. BUSA has been engaging the Minister of Trade, Industry and Competition on this issue
and we have identified localisation as a critical deliverable in the Economic Recovery Action Plan (ERAP).
We have identified CEOs as “champions” who will promote localisation in specific product categories and
we have also agreed to an indicative target of 20% import substitution of non-petroleum goods in the next
five years. We are committed to working with government and other social partners to enable localisation
but are cognisant of the environment that is essential for progress.
This study confirms our view that successful and sustainable localisation is dependent on a number of
factors, many of which are not yet in place. The study undertook a literature review, looked at evidence
from other countries, undertook a quantitative study on import, manufacturing and capacity data and
surveyed 125 firms across sectors.
All findings confirm that appropriate conditions must be put into place as we consider increasing
localisation in SA. These include an appropriate policy environment, necessary capacity to ensure quality
and increasing SA’s competitiveness. We must also ensure localisation efforts create jobs and do not lead
to increased prices in commodities manufactured locally. The localisation initiative cannot be considered
in isolation of the broader imperative of fundamental economic reforms that attract investment and
enhance growth.
BUSA has been representing the business sector in engagements with government and other social
partners on an economic growth strategy. We were instrumental, under the B4SA umbrella, in developing
a post-Covid Economic Recovery Strategy, in which localisation is an element, but within the context of a
fundamental re-positioning of the South African economy. We remain committed to working with all social
partners to attract investment and put the country onto a sustainable economic growth path. Localisation
is certainly an element of this but must be considered in the context of critical reforms for investment and
growth.
This study also provides important data and analysis of one element of our economic growth trajectory.
We believe the study is a critical instrument to contextualise our localisation efforts and ensure these are
informed by empirical data, so that we progress in a manner that ensures localisation is sustainable and
creates employment, increases competitiveness and produces quality product at competitiveness prices.
Cas Coovadia
CEO
Business Unity South Africa
Busi Mavuso
CEO
Business Leadership South Africa

LOCALISATION: WHAT IS REALISTIC? 17 MAY 2021
www.intellidex.co.za 3
Executive Summary Localisation has been highlighted by the government as a key policy aim during the recovery of the
economy from the Covid-19 crisis. Organised business in Nedlac has been asked to substitute 20% of
non-petroleum goods imports for domestically produced goods as soon as possible.
This study assesses whether such a target is realistic through three parts. First, we conduct a literature
review, placing such a policy aim within the context of South Africa’s own history of industrial policy
and with evidence from other countries. Second, a quantitative study looks at how the import,
manufacturing and capacity data can give us insights on such a target and whether it is possible to
reach it. Third, we survey 125 firms across sectors to understand views on localisation and how fast
they believe they can localise, what the constraints are and a range of related matters.
Broadly we draw the conclusion that localisation targets could well be achievable over the medium
term but that the right conditions do not exist in most sectors. It will take time and investment to
achieve the levels of onshore capacity, quality and appropriate price points – a timeline that cannot
be forced through central dictate. It could, however, be encouraged with policy certainty, clear
demand pipelines and a competitive export orientation.
Businesses seem positive and optimistic on the future potential for localisation from our survey but
comes from a place of deep scepticism about government’s understanding of business as well as
pessimism about existing localisation policies. We found strong majorities for the future optimism and
existing scepticism in our survey. Companies surveyed highlighted the price risk on pushing on with
localisation without capacity – prices could rise by around 20% if such a move is undertaken too fast.
Our literature review highlights the fact that while there were certainly successes (such as domestic
vehicle production), these were costly. Industrial policy had also failed to ensure export share
competitiveness or healthy levels of FDI while failing to avert high levels of unemployment. The REIPPP
programme showed how demand certainty can start to build local capacity. Conversely, it also
reflected the negatives as demand certainty fell away in 2014, resulting in capacity shrinkage. This
will be a key test industry going forwards with state mandated localisation targets that may push
beyond capacity.
Our quantitative study shows that under the right conditions, meeting localisation targets within the
next five years is possible for a number of key manufacturing sectors including paper, wood, motor
vehicles, ceramic products, glass, basic iron and steel, and food and beverages. Still, this is likely
longer than government is envisioning. Other manufacturing sectors are highly unlikely to meet
localisation targets without significant policy support and macroeconomic tailwinds. These sectors
include printing and publishing, textiles, clothing, footwear, rubber and machinery and electronic
equipment.
In our survey, goods-producing companies thought they could undertake substitution of 12.6% of
imports “right away” under the right conditions – but also highlighted that prices could rise by around
20% by pushing localisation now before the right conditions were in place. Companies labelled
capacity and government policies as the key impediments. They also expressed concern at the
amount government understood about capacity and industry and the challenges they faced.
The arc of policies shows how government is steadily moving further down the path of local content
and intertwining it more with B-BBEE and supplier development. Government should be cautious
about pushing too fast but rather lay the breadcrumbs that create certainty and demand in a faster
growing economy. Business should also be cautious about over-committing where capacity is not
available and lay out research and facts on capacity and realistic expansion paths.
Overall, we found that the 20% substitution target, in the short to medium term, is most likely not
realistic – taking the evidence from the three chapters in this report. However, these targets could
well be realistic over the longer term with broader reforms in place that stimulate domestic demand
and competitiveness.

LOCALISATION: WHAT IS REALISTIC? 17 MAY 2021
www.intellidex.co.za 4
Contents
Forward .......................................................................................................................................................................... 2
Executive Summary ...................................................................................................................................................... 3
Glossary.......................................................................................................................................................................... 6
Introduction ................................................................................................................................................................... 7
Recommendations ....................................................................................................................................................... 8
Chapter 1: Literature Review .................................................................................................................................... 10
Summary ...................................................................................................................................................................... 10
The need for localisation in global politics of increasing isolation and nationalism ............. 10
Localisation and industrial policy since 1994 .............................................................................. 10
History of industrial policy and localisation in South Africa .................................................................................. 12
The South African manufacturing sector before 1994 and the effects of rapid liberalisation
.......................................................................................................................................................... 12
Localisation and industrial policy from 1994 ............................................................................... 13
The drive to change the structure of the South African economy .......................................... 14
The National Industrial Participation Programme (NIPP) and the Defence Industrial
Participation (DIP) (1997) ............................................................................................................... 14
The Preferential Procurement Policy Framework Act (PPPFA) .................................................. 15
Broad-Based Black Economic Empowerment (B-BBEE) ............................................................ 16
Sectoral and targeted policies .................................................................................................... 17
Localisation and industrial policy for the future: 2020-2035 .................................................................................. 20
Literature evidence on localisation ......................................................................................................................... 21
Policy successes ................................................................................................................................. 22
Policy shortcomings and failures .................................................................................................. 24
Costs of industrial support ............................................................................................................. 25
Lessons for industrial policy............................................................................................................ 25
International case studies .......................................................................................................................................... 26
Vietnam ............................................................................................................................................... 26
Brazil ..................................................................................................................................................... 28
United States ....................................................................................................................................... 30
Bibliography ................................................................................................................................................................ 32
Chapter 2: Quantitative study .................................................................................................................................. 34
Summary ...................................................................................................................................................................... 34
Detailed breakdown .................................................................................................................................................. 36
Trends in imports of goods ......................................................................................................................................... 36
Trends in domestic manufacturing and exports ............................................................................. 37
Relationship between domestic output, exports, imports and localisation ............................... 41
Capacity constraints .................................................................................................................................................. 43
Underutilisation of manufacturing capacity ................................................................................... 43
Other constraints ................................................................................................................................ 48
Modelling capacity constraints and supply growth for selected sectors ................................... 50
Methodology .................................................................................................................................. 50
Recommended localisation path and expected timeframe ............................................................................. 55
Chapter 3: Localisation views of individual businesses .......................................................................................... 56
Methodology .............................................................................................................................................................. 56
Results – about the businesses .................................................................................................................................. 58
Results – imports .......................................................................................................................................................... 60
Results – current views ................................................................................................................................................ 64
Results – Policy opinions ............................................................................................................................................. 68
Results – looking forward ........................................................................................................................................... 70
Concluding Analysis ................................................................................................................................................... 76

LOCALISATION: WHAT IS REALISTIC? 17 MAY 2021
www.intellidex.co.za 5
List of Figures Note – where there is a link next to a figure title, clicking allows further detail and data to be downloaded.
Figure 1: Wordcloud of the vision for industrial policy from 1994 .............................................................................................................. 11
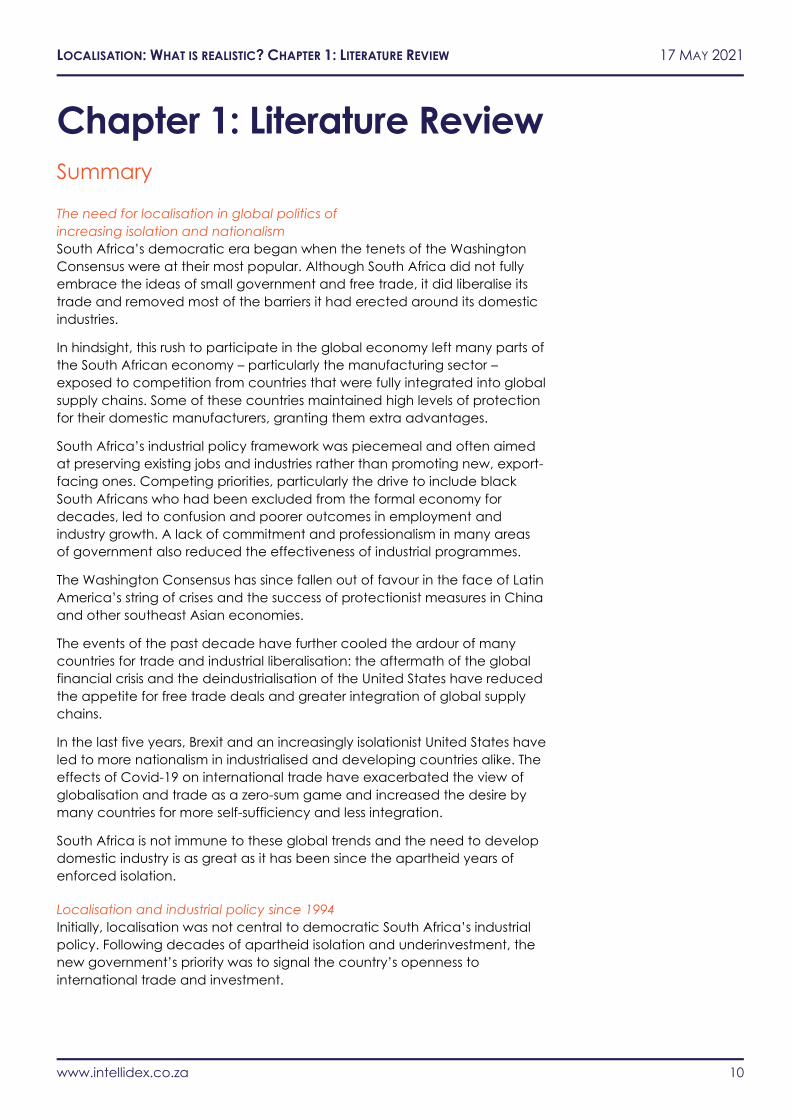
Figure 2: Industrial policy from 1994 to the present (Link to interactive timeline) .................................................................................. 13
Figure 3: Wordcloud of the new industrial policy master plans ................................................................................................................ 20
Figure 4: Passenger vehicle production 1995-2019 (link) ............................................................................................................................ 22
Figure 5: Light commercial vehicle (LCV) production 1995-2019 (link) .................................................................................................... 22
Figure 6: US manufacturing employment 1970-2020 (link) ......................................................................................................................... 30
Figure 7: Localisation growth implications by product ............................................................................................................................... 35
Figure 8: Imports 2020 (link) .............................................................................................................................................................................. 36
Figure 9: Localisation targets for top 10 import groups (link) ..................................................................................................................... 37
Figure 10: Total manufacturing output (2015 = 100) (link) .......................................................................................................................... 37
Figure 11: Manufacturing output: best-performing sectors (2015 = 100) (link) ....................................................................................... 38
Figure 12: Manufacturing sales: best-performing sectors (2015 = 100) (link) .......................................................................................... 38
Figure 13: Localisation targets and current size of domestic sectors (link) ............................................................................................. 39
Figure 14: Localisation targets and current growth of domestic sectors (link) ....................................................................................... 39
Figure 15: Localisation targets......................................................................................................................................................................... 40
Figure 16: Exports 2020 (link) ............................................................................................................................................................................ 41
Figure 17: Exports and import trends (link) .................................................................................................................................................... 42
Figure 18: Manufacturing capacity underutilisation: shortage of raw materials (link) ......................................................................... 44
Figure 19: Manufacturing capacity underutilisation: shortage of skilled labour (link) .......................................................................... 45
Figure 20: Manufacturing capacity underutilisation: shortage of semi- and unskilled labour (link) ................................................... 46
Figure 21: Manufacturing capacity underutilisation: insufficient demand (link) .................................................................................... 47
Figure 22: Manufacturing capacity underutilisation: other factors (link) ................................................................................................ 48
Figure 23: Key export groups ........................................................................................................................................................................... 51
Figure 24: Required growth by segment ....................................................................................................................................................... 52
Figure 25: Sector of respondents (number) .................................................................................................................................................. 58
Figure 26: Number of employees (% of group) ............................................................................................................................................ 58
Figure 27: Seniority of respondents ................................................................................................................................................................. 59
Figure 28: Company age (share of group) ................................................................................................................................................... 59
Figure 29: Company turnover per year ......................................................................................................................................................... 59
Figure 30: BBBEE related size ............................................................................................................................................................................ 59
Figure 31: Direct and ultimate (via supply chain) imports as a % share of input cost .......................................................................... 61
Figure 32: Impact of existing rules on input prices (%) ................................................................................................................................ 61
Figure 33: Comparison of price impact vs share of input costs imported ............................................................................................... 62
Figure 34: Change in price from local content per unit of local input .................................................................................................... 63
Figure 35: Results by size of respondent (%) .................................................................................................................................................. 63
Figure 36: Distribution of input costs impact (full sample, %) ..................................................................................................................... 63
Figure 37: Share of all respondents – shift in importance of factor in past five years ........................................................................... 63
Figure 38: Balance of view – shift in importance of factor in past five years ........................................................................................ 64
Figure 39: Shift in view of importance over five years on localisation ..................................................................................................... 64
Figure 40: Share of responses (%) for sources of localisation information .............................................................................................. 65
Figure 41: Other sources for localisation information – word cloud by number of responses ............................................................. 65
Figure 42: Ease for respondents to comply with requirements (%, balance score) .............................................................................. 66
Figure 43: Balance of ease to comply with local content rules by sector .............................................................................................. 66
Figure 44: Balance of ease to comply with rules on localisation by turnover of company ................................................................. 67
Figure 45: Sample views on localisation framework - % agreeing or disagreeing and balance ........................................................ 67
Figure 46: Approval rates (% of respondents, lhs) and balance of view score, (rhs) of current policy and future commitments
by government and organised business ....................................................................................................................................................... 68
Figure 47: Net approval rates of current policy and future commitments by government and organised business ...................... 69
Figure 48: Net approval rates of current policy and future commitments by government and organised business ...................... 69
Figure 49: Constraints to respondent using more local content (priority score) .................................................................................... 70
Figure 50: Perceived onshore supply chain constraints .............................................................................................................................. 70
Figure 51: Constraints to respondent using more local content (% ranking in top two priority) ......................................................... 71
Figure 52: Perceived onshore supply chain constraints (% ranking in top two priority) ........................................................................ 71
Figure 53: Word cloud for blockages and change required ..................................................................................................................... 72
Figure 54: Average rank by sector of constraint on own import substitution ......................................................................................... 72
Figure 55: Average rank by sector of perceived constraint on supply chain ........................................................................................ 73
Figure 56: Capacity to localise what share of imports over what timeframe (under the right conditions) – share of imports (%) 74
Figure 57: Capacity to localise over what time-frame (under the right conditions) ............................................................................. 74
Figure 58: Localisation potential as a share GDP (%) by industry ............................................................................................................. 75
Figure 59: Localisation potential as a share GDP (%) by group ................................................................................................................ 75
Figure 60: Price elasticity of attempted substitution of 20% of import prices ......................................................................................... 76
Figure 61: Comparison of price responses in survey.................................................................................................................................... 76
LOCALISATION: WHAT IS REALISTIC? 17 MAY 2021
www.intellidex.co.za 6
Glossary
AfCFTA African Continental Free Trade Area
AIA Automotive Investment Allowance
APDP Automotive Production and Development Programme
B-BBEE Broad-based Black Economic Empowerment
BEE Black Economic Empowerment
CTCIP Clothing Textiles Competitiveness Improvement programme
CTCP Clothing & Textile Competitiveness Programme
DIP Defence Industrial Participation
DoD Department of Defence
DTI Department of Trade and Industry
DTIC Department of Trade, Industry and Competition
EIP Enterprise Investment Programme
FIT Feed-in Tariff
IIO Investment and Infrastructure Office
IPP Independent Power Producer
IPAP Industrial Policy Action Plan
IPP Independent Power Producer
INES Integrated National Export Strategy
MIDP Motor Industry Development Plan
NIPP National Industrial Participation Programme
NIPF National Industrial Policy Framework
OEM Original Equipment Manufacturer
PBO The Parliamentary Budget Office
PPPFA Preferential Procurement Policy Framework Act
REIPPPP Renewable Energy Independent Power Producer
Procurement Programme
R-CTFL Retail-Clothing, Textile, Footwear & Leather
TCIDP Textile and Clothing Industry Development Programme
VALA Volume Assembly Localisation Allowance
WTO World Trade Organisation
LOCALISATION: WHAT IS REALISTIC? 17 MAY 2021
www.intellidex.co.za 7
Introduction Localisation is the topic of the moment in industrial policy in South Africa.
Indeed, the issue got 15 mentions in February’s state-of-the-nation address
from President Cyril Ramaphosa.
Is “maximum local content” the best policy aim, however? Is localisation an
unalloyed good?
Notionally, everyone’s knee-jerk reaction is that more local content is
always positive. However, such an idea needs to be balanced against the
competing priorities of capacity, cost and quality. All these factors can
sometimes pull in opposite directions.
The goal of business in an inclusive economy should be to maximise
“development” in the broadest sense which means, in the South African
context in particular, to maximise jobs growth. This implies low-cost, high-
quality inputs and working at parts of the value chain that are particularly
suited to the marginal member of the labour force in order to reduce
unemployment. This may well also be a point in the value chain that
coincided with maximal local content, but not by definition.
These questions have been crystalised by a request at the end of 2020 from
DTIC Minister Ebrahim Patel to organised business in Nedlac to target 20% of
non-petroleum imports to be substituted for locally produced goods. No firm
timeframe has been set but the indication has been given that this should
happen in short order.
What does such a target mean though in reality? Is it possible? Is it credible?
Is it realistic?
It is unclear that there is anything behind the choice of this target from a
research perspective or of evidence-based policy in the DTIC’s thought
processes on the issue – that we have found at least. Indeed, as part of this
research, the feedback from business was that companies thought it was
not clear that government understood the challenges involved in
localisation at all.
The issue is also very topical, as a “chicken and egg” problem of demand
versus (currently very limited) local supply in the REIPPP programme is
playing out in the months ahead.
The appropriate setting of localisation policy is crucial – too loose and status
quo thinking cannot be changed; too tight and price and quality outcomes
can be eroded, there will be delays to projects as capacity has to be built
and ultimately the consumer pays more and corporate profitability (and tax
take) falls.
To answer the question of how realistic this target is of 20% of non-petroleum
imports to be substituted, we lay our three spheres of evidence in three
chapters in this report.
First, we look at a literature review of existing localisation programmes and
place them in the context of such policy in recent times. We also then look
at examples of what has gone right and wrong from other countries and
lessons for South Africa.
LOCALISATION: WHAT IS REALISTIC? 17 MAY 2021
www.intellidex.co.za 8
Second, we look at a quantitative study – what the data tell us about the
historic growth rates of sectors; their current capacity to produce more; and
how long it might take to substitute 20% of imports.
Finally, we undertake a survey of 125 companies across all sectors of the
economy and ask them a range of questions about their import intensity,
their opinions on the potential to import substitute, the impact on prices and
what is holding them back.
Throughout the three sections the same themes keep coming up: potential
for further substitution; a readiness for business to support such a
programme under the right circumstances; but also the lack of the right
underlying conditions for meaningful substitution to occur.
The lessons in this report should be important for contextualising the
localisation debate and policy push within Nedlac and the South African
political economy – so business can constructively engage with these topics
to maximise localisation without hitting up against these buffers where
adverse consequences might result.
There is a substantial amount of further work to be done though. This, we
believe is one of the very few “macro” level studies of localisation in South
Africa that is cross-sectoral and takes a holistic, multipronged approach.
Further work on sector-specifics but also cross-sector and whole-economy
studies would enrich the debate further – to look in more detail at issues that
we start to delve into here such as price elasticity, quantifying the impacts
of constraints on more localisation, etc.
This report should then be a point of departure for introspection by social
partners, sector business organisations and others as South Africa finds this
optimal point for localisation that is evidence-based and outlines the
consequences.
Recommendations Several key issues come out from the three sections in this study that can
act as recommendations on the path forward for localisation.
• There is a great degree of business good will on maximising
sustainable localisation but, equally, there is scepticism on current
localisation policy. Both organised business and government (and
labour) can harness this but there must be transparency and
credibility to take individual businesses along the journey. This good
will should not be taken for granted.
• Localisation should not be a fundamental policy goal – it should be
a second order policy aim only where there is analysis that imported
cheaper, quality goods do not create a more positive jobs outcome
considering all upstream and downstream impacts. An honest
conversation should be had between all parties on the price
increases that are acceptable and the trade off between prices,
quality and jobs that may often exist (but not always). Jobs growth
should be the fundamental policy aim from a whole economy
(general equilibrium) perspective.
LOCALISATION: WHAT IS REALISTIC? 17 MAY 2021
www.intellidex.co.za 9
• One-size-fits-all commitments to localisation targets should not be
accepted. They are likely to see large companies with investment
and supply chain development capacity make commitments that
are large individually but small in the scale of the economy. Instead,
focus should be on widespread deepening of supply chain options
for all companies of all sizes – but particularly SMMEs, because they
can move the dial on a macro level more effectively.
• Government needs to offer up clearer roadmaps for the foundations
for sustainable localisation, in particular for skills education, reliable
electricity, interconnectedness of export markets, skills immigration
and cutting red tape (to allow faster local licensing of OEM
components and setting up of new businesses to produce onshore).
• Government should take a risk-averse stance on localisation
requirements where they may slow down or impede necessary rapid
investment – in particular in energy.
• The old canard of “policy predictability” in this context is important
for developing demand pipelines. But more than that it also means
that the endpoint is clear and sequenced and the trade-offs are
well understood by all. Businesses seem to have no problem
understanding what government wants at a high level but are
sceptical that there is an understanding of the consequences.
Business should be clear with government on the risks of a host of
policy changes to a steady, sustainable shift down a localisation
path – especially after the experiences of REIPPP.
• There needs to be a transparent and public exposition by business
and government on what local capacity currently is. This is a key
item for future work. While this study was a high-level, top down,
cross-sectoral view, individual business associations need to provide
more insights to DTIC and the public on capacity constraints and the
processes and timelines to establish cost competitive capacity. DTIC
needs to be more open about what it does and does not know on
capacity issues (a topic that has become especially apparent
regarding localisation for energy procurement).
• Individual businesses and sectoral associations, coordinated through
BUSA, should publish clear pathways to sustainable localisation,
showing the skills required, investment needed, blockages in place
(regulatory, credit, demand, quality) and realistic timelines to
achieve this. The needs of SMMEs here should not be forgotten.
• Localisation should be viewed as a step-by-step process that works
its way from the assembly of offshore-produced components, then
to local licensing for OEMs and through to pure local content
production. A greater understanding of this pathway should be
communicated in DTIC policies. The role of SMMEs in each step of
this chain should be considered.
• DTIC, as a key early win on the path to sustainable localisation,
should set up a unit within InvestSA that works with the Investment
Envoys and Investment and Infrastructure Office (IIO) in the
Presidency to map and target onshore licensing of production of
OEM components and assembly of larger goods.
LOCALISATION: WHAT IS REALISTIC? CHAPTER 1: LITERATURE REVIEW 17 MAY 2021
www.intellidex.co.za 10
Chapter 1: Literature Review
Summary
The need for localisation in global politics of
increasing isolation and nationalism
South Africa’s democratic era began when the tenets of the Washington
Consensus were at their most popular. Although South Africa did not fully
embrace the ideas of small government and free trade, it did liberalise its
trade and removed most of the barriers it had erected around its domestic
industries.
In hindsight, this rush to participate in the global economy left many parts of
the South African economy – particularly the manufacturing sector –
exposed to competition from countries that were fully integrated into global
supply chains. Some of these countries maintained high levels of protection
for their domestic manufacturers, granting them extra advantages.
South Africa’s industrial policy framework was piecemeal and often aimed
at preserving existing jobs and industries rather than promoting new, export-
facing ones. Competing priorities, particularly the drive to include black
South Africans who had been excluded from the formal economy for
decades, led to confusion and poorer outcomes in employment and
industry growth. A lack of commitment and professionalism in many areas
of government also reduced the effectiveness of industrial programmes.
The Washington Consensus has since fallen out of favour in the face of Latin
America’s string of crises and the success of protectionist measures in China
and other southeast Asian economies.
The events of the past decade have further cooled the ardour of many
countries for trade and industrial liberalisation: the aftermath of the global
financial crisis and the deindustrialisation of the United States have reduced
the appetite for free trade deals and greater integration of global supply
chains.
In the last five years, Brexit and an increasingly isolationist United States have
led to more nationalism in industrialised and developing countries alike. The
effects of Covid-19 on international trade have exacerbated the view of
globalisation and trade as a zero-sum game and increased the desire by
many countries for more self-sufficiency and less integration.
South Africa is not immune to these global trends and the need to develop
domestic industry is as great as it has been since the apartheid years of
enforced isolation.
Localisation and industrial policy since 1994
Initially, localisation was not central to democratic South Africa’s industrial
policy. Following decades of apartheid isolation and underinvestment, the
new government’s priority was to signal the country’s openness to
international trade and investment.

LOCALISATION: WHAT IS REALISTIC? CHAPTER 1: LITERATURE REVIEW 17 MAY 2021
www.intellidex.co.za 11
Figure 1: Wordcloud of the vision for industrial policy from 1994
Source: DTIC, Intellidex
Industrial policy in the 1990s focused on reducing trade barriers and
promoting exports. South Africa joined the World Trade Organisation (WTO)
in 1995, reduced import tariffs, and pursued free trade agreements with a
number of countries and blocs. In retrospect, the quick, sharp exposure to
international competition placed much pressure on long-protected
manufacturing sectors.
The first sector-specific policies (the MIDP in 1995 and the NIPP in 1997) were
targeted at increasing domestic production, creating jobs and increasing
exports. More universal policies followed prescribing rules and guidelines for
economic growth and transformation of the economy (the PPPFA in 2002
and B-BBEE in 2007). The annual IPAP was also introduced in 2007. In 2011
the REIPPPP was launched.
All of these policies, programmes and laws have been updated and
amended since their inception. They have enjoyed some success but have
not fully lived up to expectations or achieved all their targets: jobs have
been saved and even grown in certain targeted sectors but manufacturing
output has stagnated over the past 15 years and employment has fallen
since the 1990s.
The REIPPPP is arguably the most successful industrial policy of the
democratic era and there are many aspects of its design and
implementation that should be included in other localisation programmes.
Past industrial policy has cost the fiscus hundreds of billions of rands, and
criticism of policy design and efficacy has grown, not just from foreign

LOCALISATION: WHAT IS REALISTIC? CHAPTER 1: LITERATURE REVIEW 17 MAY 2021
www.intellidex.co.za 12
partners and domestic producers but also within government departments.
The new round of industrial policy has refocused on domestic production,
developing local supply chains and creating new black industrialists and
producers. However, employment and output have fallen compared with
the 2018 baseline numbers that have been used for the new industry
masterplan targets.
History of industrial policy and
localisation in South Africa
For most of the twentieth century the South African economy was insular
and inward-looking. The path dependency that resulted from mining-led
industrialisation meant that manufacturing output was heavily
concentrated in the extractive industries and their related supply chains.
The rapid liberalisation of the 1990s and the concentration on trade policy
rather than industrial policy led to job losses and increased imports in
certain manufacturing sectors, raising the need for localisation policies from
2000 onwards.
The South African manufacturing sector
before 1994 and the effects of rapid liberalisation South Africa’s industrial growth in the late nineteenth and early twentieth
centuries was driven by the discovery of gold and diamonds. Its industrial
and development policies, both before and during formal apartheid,
prioritised the social and economic development of white South Africans at
the expense of black South Africans.
The rapid growth of the mining sector and a raft of racially discriminatory
laws set in motion the path dependence of the South African economy.
From the 1920s until the dismantling of apartheid in the 1990s, the economy
was heavily influenced by the mining sector and the linkages to it.
Characteristics of the pre-1994 economy included: highly regulated and
distorted labour markets; increasing isolation and delinking from the global
economy; import substitution; and protected and inefficient manufacturing
industries.
South Africa was able to rapidly industrialise on the back of cheap black
migrant labour and global demand for its export commodities, particularly
gold. Although its inward-looking policies were ultimately unsustainable,
they were able to provide rapid development and support for white labour
and white-owned businesses for decades.
With the advent of democracy in 1994, South Africa was suddenly
reintroduced to the global economy. The shocks of trade liberalisation and
open markets, after years of isolation and protection, were felt most keenly
in the manufacturing sector. Large parts of it were uncompetitive and
unprepared for what was to come. Thousands of jobs were shed in the
textiles, clothing and automotive industries.
LOCALISATION: WHAT IS REALISTIC? CHAPTER 1: LITERATURE REVIEW 17 MAY 2021
www.intellidex.co.za 13
Localisation and industrial policy from 1994 Industrial policy from 1994 to 2018 had numerous objectives, sometimes
resulting in policy confusion and inefficiency. There was a strong drive to
transform the economy and include all South Africans in its benefits.
The PPPFA and B-BBEE focused on the overall structure of the economy and
sought to increase procurement, ownership, enterprise development and
employment of previously disadvantaged South Africans, among other
things. Sector-specific policies such as the MIDP and TCIDP wanted to
increase domestic output and employment through export-led growth.
Policymakers shifted focus from export growth to domestic output and
employment retention from 2009 mainly because the previous sectoral
policies had not yielded the expected results. Localisation outcomes
improved over the next 10 years but at a great cost to the fiscus. The value
of domestic output increased but so did imports, while job losses continued
in sensitive sectors.
A new round of industrial policy was proposed in 2017 and sectoral
masterplans were launched from 2019. Four were created for the
manufacturing sector while the poultry masterplan has already been
successful in increasing local production while reducing imports.
Figure 2: Industrial policy from 1994 to the present (Link to interactive timeline)
South Africa has been a member of the World Trade Organisation (WTO)
since 1995. Certain regulations stipulated under the WTO are against the
use of import substitution and partially restrict the implementation of local
content policies. However, there’s much legal uncertainty around such
regulations and developing countries like South Africa continue to search
for policy space to explore local content policies.
With South Africa being party to multilateral trade agreements such as the
WTO Agreement, some localisation policies would not be officially allowed.
In 1994 the new government began to establish localisation policies
specifically to make the economy more inclusive of previously
disadvantaged people. A number of political and social shifts occurred
took place including new policies aimed at addressing inequality.

LOCALISATION: WHAT IS REALISTIC? CHAPTER 1: LITERATURE REVIEW 17 MAY 2021
www.intellidex.co.za 14
The localisation policies came into fruition in 2002 when the government
enacted the Preferential Procurement Policy Framework Act (PPPFA) to
advance enterprises owned by historically disadvantaged people. The goal
was to ensure that those who had been discriminated against on the basis
of race and gender had an opportunity at fair competition in the economy.
In 2007, the Broad Based Black Economic Empowerment (BBBEE) Act was
introduced to redress race-based inequality in business and strive for fair
participation in the economy for all. It was designed specifically to focus on
the empowerment of black citizens in South Africa. Certain of its aims
intersect with the objectives of localisation and the development of
domestic industries – preferential procurement, ownership and
employment.
The first Industrial Policy Action Plan (IPAP) was introduced in August 2007 as
an implementation plan related the principles espoused in the National
Industrial Policy Framework (NIPF). The NIPF was introduced by the
Department of Trade and Industry (dti).
The initial objectives of the IPAP were to build industrialisation by increasing
manufacturing, so bolstering the economy through job creation and
diversification of existing trade through active localisation. There was
specific focus on ensuring the inclusion of marginalised people, as well as
investing in their communities.
The drive to change the structure of the South African
economy The majority black population of the country had been left
underdeveloped and impoverished by slavery, colonialism and, finally,
apartheid. Tackling these problems was a task for every government
department and the focus was on employment, ownership and
industrialisation of black South Africans.
At the same time there was a need to make the entire country competitive
and fully integrate it into the global economy. The DTI dismantled most of
the protective structures that had accreted over many years, reduced
import tariffs and removed much of the support to inward-focused and
uncompetitive industries.
Government policies and priorities were thus often in conflict with each
other and this led to confusion and a lack of focus at times.
The National Industrial Participation Programme (NIPP) and the
Defence Industrial Participation (DIP) (1997) The NIPP was promulgated in 1996 and endorsed by Cabinet in April 1997.
Its objective are to leverage economic benefits and increase investments
into the country. In addition, through the establishment of the NIPP, the
government demonstrated its commitment to industrial participation by
establishing the NIPP to support the development of South African industry.
When the government makes purchases from foreign companies of more
than US$10 million, an NIP obligation is placed on the recipient company to
reinvest a portion of the costs in South Africa. All government purchases of
imports and contracts with foreign competitors that amount to or exceed
US$10 million are also eligible for the NIP obligation. The NIP obligation is
calculated as 30% of the imported portion of the purchase contract and
LOCALISATION: WHAT IS REALISTIC? CHAPTER 1: LITERATURE REVIEW 17 MAY 2021
www.intellidex.co.za 15
can be fulfilled through local economic activities that have the potential to
make a positive impact on developing the local industry.
Before the government concludes and finalises a procurement agreement
with a foreign company, the company is required to sign an obligation
agreement with the DTI within a month of signing it. The purpose of the
obligation agreement is for both parties, the DTI and the supplier, to agree
to the stipulated NIP obligation value and requirements.
The Defence Industrial Participation (DIP) programme complements the
NIPP by focusing specifically on the South African defence industry and
playing a developmental role in the country’s defence industrial base.
Armscor managed all DIP activities while all non-military portions under the
DIP were managed by the dti.
Contracts with an imported value of between US$2 million and US$10 million
have a DIP obligation attached to them approximately equivalent to the
value of the purchase contract.
Prior to the supplier/potential DIP obligor being awarded the tender, they
need to submit a DIP proposal. These proposals are processed through
Armscor and assessed for their potential benefit against the strategic
requirements of the Department of Defence (DoD) and the local industry.
For the agreement to be concluded and the purchase contract to be
signed, the DIP proposal must have been assessed based on the extent to
which they support the capabilities required in the defence industry. These
include providing for a strategic design, development, manufacturing,
logistical support and upgrade capability for a technologically advanced
and modern defence force.
All proposals are, in addition, evaluated for their potential benefit against
the stated strategic requirements of the DoD and local industry. These are
formulated based on the strategic needs of the South African National
Defence Force (SANDF).
The Preferential Procurement Policy Framework Act (PPPFA) In 2002 the government enacted the Preferential Procurement Policy
Framework Act (PPPFA) to advance enterprises owned by historically
disadvantaged persons. This was to ensure that those who had been
discriminated against on the basis of race, gender and class had an
opportunity at fair competition in the economy. This would allow for the
liberalisation of the country’s economy through encouraging the entrance
of new and small businesses.
The PPPFA Regulations were promulgated in 2001, stipulating how the Act
would be a procurement policy through which preference in awarding
contracts would be given to previously disadvantaged persons.
The PPPFA prioritised the protection and/or advancement of women, black
people and people with disabilities, with a major emphasis also on small
and medium enterprises. The PPPFA would achieve this through prescribing
a preference point system to be followed in awarding tenders. The PPPFA
was aligned to the policy framework of the B-BBEE Act.
In 2011, the PPPFA was amended and local content regulations were
included. In addition to the Act’s empowerment objectives, the PPPFA also
LOCALISATION: WHAT IS REALISTIC? CHAPTER 1: LITERATURE REVIEW 17 MAY 2021
www.intellidex.co.za 16
set out Industrialisation objectives under Section 8 of the Act which looked
at “local production and content”.
Local content regulations in this section include that: (i) The DTI is
empowered to designate specific industries/sectors for local production to
meet a specified level of local content; (ii) Organs of state must include
local content in their bid invites; (iii) A bid that fails to meet the required
local content is unacceptable.
The PPPFA was revised in 2017 to align the 2017 revisions of the Act to the
revised B-BBEE Codes of Good Practice. Since the implementation of the
revised PPPFA in 2017, the DTI has designated approximately 100 products
across different sectors to develop the domestic manufacturing sector.
One of the major consequences of the PPPFA is the impact it had on South
Africa’s domestic production capacity. Over time, through the PPPFA
regulations, the DTIC has increased local content levels as well as the
production thresholds for some sectors.
Broad-Based Black Economic Empowerment (B-BBEE) In 2003, the initial Broad-based Black Economic Empowerment (B-BBEE) Act
was introduced. In 2007, the Codes of Good Practice were published. This
was a framework for measuring black economic empowerment (BEE) in
terms of seven elements: (i) ownership; (ii) management control; (iii)
employment equity; (iv) skills development; (v) preferential procurement;
(vi) enterprise development; and (vii) socioeconomic development.
In 2007, the B-BBEE Act was introduced to redress race-based inequality in
business so as to ensure fair participation in the economy for all. It was
designed specifically to focus on the empowerment of black citizens. The
enhancement of the economic participation of black people was directly
related to the objective of localisation, which is to develop domestic
industries to stimulate the economy and increase the country’s
competitiveness.
The B-BBEE Act is a government policy that was enacted to remedy the
wrongs of the past by prioritising the economic advancement of black
people and transforming the economy into a more inclusive one.
The B-BBEE Act does not promote local procurement directly but its
regulations incentivise local procurement. Under the B-BBEE codes for the
procurement element, a premium is awarded to procurement from
companies that are 50% black-owned and 30% black women-owned.

LOCALISATION: WHAT IS REALISTIC? CHAPTER 1: LITERATURE REVIEW 17 MAY 2021
www.intellidex.co.za 17
Sectoral and targeted policies Automotive sector: Motor Industry Development Plan (MIDP, 1995-2012);
and Automotive Production and Development Programme (APDP, 2013-
present)
Before 1994, South Africa’s automotive industry was characterised by high
levels of protection and low export volumes. From 1989 it began to
dismantle the protectionism and inward focus of previous decades,
exposing the industry to increased international competition. The lower
tariffs were coupled with import-export complementation arrangements,
providing import rebates to firms that exported a similar value of goods.
The liberalisation of the industry followed a period of stagnant domestic
demand in the 1980s, coupled with international isolation and shrinking
export markets. From 2002, domestic sales grew strongly on the back of
strong economic growth before falling in the wake of the global financial
crisis in 2008. Vehicle exports as a percentage of domestic production then
grew rapidly, but this was more a function of pedestrian domestic demand
and increased competition from imports than as a result of absolute growth
in exports.
The MIDP was established in 1995 with the objective to assist the local
automotive industry become internationally competitive over a short time
period. In addition, it focused on providing incentives to rationalise
production into a smaller range of products and achieve economies of
scale.
The implementation of the MIDP focused on reducing tariffs and increasing
exports. It was devised to help the industry transform from just vehicle
assembly to components production and ultimately full manufacturing.
The MIDP awarded export credits to vehicle and component
manufacturers. These credits could offset the import duty, thereby reducing
the costs of importing raw materials for the production process.
The APDP was established in 2013 to replace the MIDP. Unlike the MIDP’s
export-oriented focus, the APDP’s prioritised domestic production and
localisation of automotive components while simultaneously ensuring
incentives were maintained for OEMs to manufacture vehicles in South
Africa for export and domestic sales.
Another initiative, the Automotive Investment Allowance (AIA) provided a
20% benefit on the capital costs of the manufacturer’s assets. The AIA is
payable to vehicle assemblers and automotive component manufacturers
which are able to produce 50,000 units per year.
Through both the MIDP and APDP, the automotive sector has received
approximately R324.2 billion in 2015/16 in government support from 1994/95
to 2014/15. Through the APDP, the government also supported the
automotive industry by awarding tax rebates. The cost of these rebates rose
from R18.4 billion in 2013/14 to more than R28 billion in 2016/17.
Amendments were made to the first APDP which expired at the end of
2020. The new APDP will focus on value addition as it introduces the Volume
Assembly Localisation Allowance (VALA) formula. The new APDP will allow
vehicle manufacturers to be eligible for additional benefits should they wish
to build extra vehicle components for export.
LOCALISATION: WHAT IS REALISTIC? CHAPTER 1: LITERATURE REVIEW 17 MAY 2021
www.intellidex.co.za 18
Clothing and textile sector: Textile and Clothing Industry Development
Programme (TCIDP, 1995-2009); and Clothing & Textile Competitiveness
Programme (CTCP, 2009-2019)
Support for the sector has been ongoing since 1995. The TCIDP was
designed to assist clothing exporters but the majority of production in the
sector is designated for the domestic market. The programme design was
also not compliant with some of the WTO’s rules. The CTCP was
implemented to replace the TCIDP and correct some of its shortcomings.
The CTCP was in place from 2009 to 2019, with a focus to stabilise the
industry and prevent further loss of market share and jobs. It included the
following programmes:
- A capital upgrading programme available via the Enterprise
Investment Programme (EIP) with preferential loans via the IDC at
prime less 5%; and
- A firm and cluster level Clothing Textiles Competitiveness
Improvement programme (CTCIP).
The CTCP focused on creating industrial clusters where manufacturers
would work together within a single value chain or market sector, with the
aim of driving economies of scale and lower input costs.
The CTCP was replaced by the retail-clothing, textile, footwear & leather
(R-CTFL) masterplan in November 2019.
The Renewable Energy Independent Power Procurement Programme
(REIPPPP)
The REIPPPP is a public-procurement programme designed and
implemented to introduce and then keep increasing the supply of
renewable energy. In addition, the programme would play a significant role
in combating climate change.
The REIPPPP has gone further than the PPPFA and B-BBEE in its prioritisation of
local content and job creation. It has also supported specific
manufacturing industries at a far lower cost than other targeted industrial
policies.
It has been one of the most successful government programmes in the past
decade in terms of management and design, and it has also benefited
from very favourable market factors. Its achievements have not been
exclusively in the area of localisation, nor is its track record of local
procurement unambiguously positive. Still, there are many lessons in its
design and execution which can be applied to future localisation
programmes.
In 2009, the government explored feed-in tariffs (FITs) for renewable energy,
but they were rejected in 2011 in favour of competitive tenders. From its first
bid round in August 2011 the REIPPPP has attracted many international and
local private project developers and investors. In its second and third bid
rounds, the programme experienced consecutive, significant price
reductions.
The first three successful bidding rounds were held within three years and
were widely successful. New power plants were built and commissioned in
LOCALISATION: WHAT IS REALISTIC? CHAPTER 1: LITERATURE REVIEW 17 MAY 2021
www.intellidex.co.za 19
record time under a highly transparent and competitive process. In total,
four bid windows have been completed and the fifth is expected in 2021.
The tender scoring process is weighted 70% on price and 30% on other
development factors. These factors have changed across different bid
windows but are generally analogous to the B-BBEE elements: the emphasis
is on job creation, social upliftment, and economic transformation, primarily
through broader economic ownership.
However, in contrast to B-BBEE, the REIPPPP emphasises black job creation
over black economic empowerment and reclassifies enterprise and
socioeconomic development as local community development targets
rather than BEE targets. Overall, REIPPPP targets economy-wide jobs, local
content benefits and local community development over BEE.
The REIPPP also revised its local content target thresholds and targets over
time.
LOCALISATION: WHAT IS REALISTIC? CHAPTER 1: LITERATURE REVIEW 17 MAY 2021
www.intellidex.co.za 20
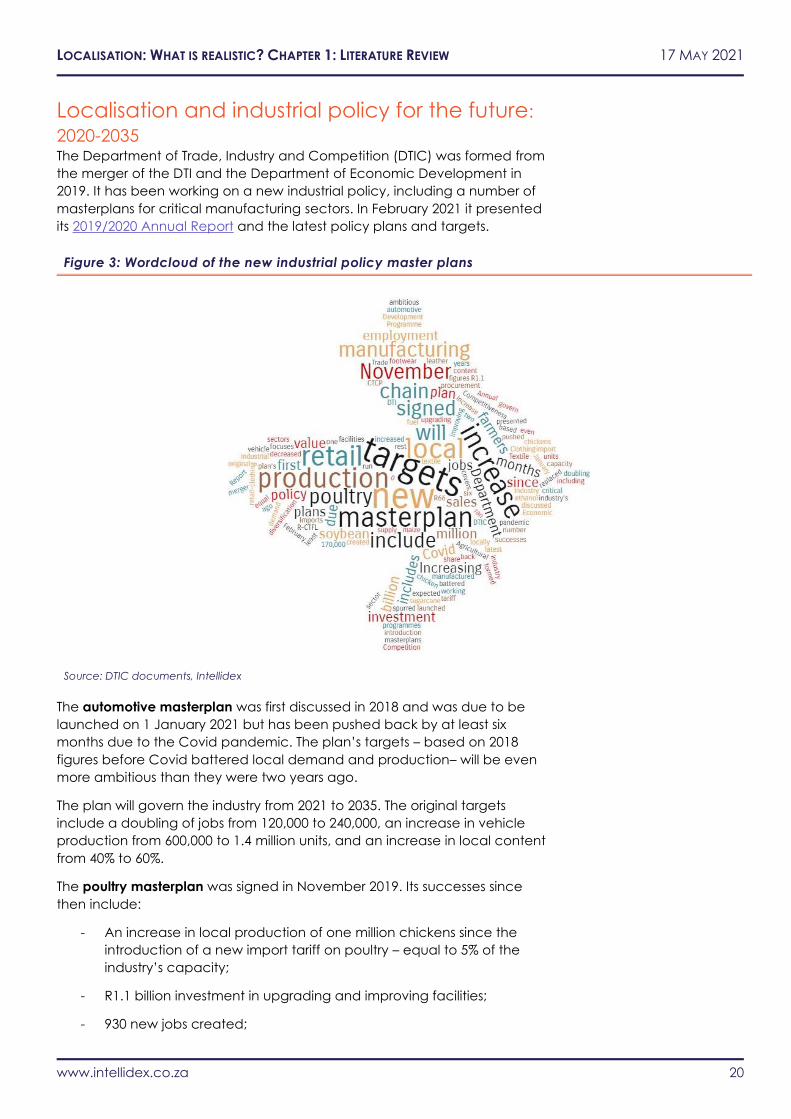
Localisation and industrial policy for the future:
2020-2035 The Department of Trade, Industry and Competition (DTIC) was formed from
the merger of the DTI and the Department of Economic Development in
2019. It has been working on a new industrial policy, including a number of
masterplans for critical manufacturing sectors. In February 2021 it presented
its 2019/2020 Annual Report and the latest policy plans and targets.
Figure 3: Wordcloud of the new industrial policy master plans
Source: DTIC documents, Intellidex
The automotive masterplan was first discussed in 2018 and was due to be
launched on 1 January 2021 but has been pushed back by at least six
months due to the Covid pandemic. The plan’s targets – based on 2018
figures before Covid battered local demand and production– will be even
more ambitious than they were two years ago.
The plan will govern the industry from 2021 to 2035. The original targets
include a doubling of jobs from 120,000 to 240,000, an increase in vehicle
production from 600,000 to 1.4 million units, and an increase in local content
from 40% to 60%.
The poultry masterplan was signed in November 2019. Its successes since
then include:
- An increase in local production of one million chickens since the
introduction of a new import tariff on poultry – equal to 5% of the
industry’s capacity;
- R1.1 billion investment in upgrading and improving facilities;
- 930 new jobs created;
LOCALISATION: WHAT IS REALISTIC? CHAPTER 1: LITERATURE REVIEW 17 MAY 2021
www.intellidex.co.za 21
- Imports of poultry decreased by 17% in the first 10 months of 2020
The plan has spurred investment in the rest of the supply chain: soybean
and maize production is expected to increase. Agricultural employment
has increased with 26 new soybean farmers and 13 new chicken farmers.
The retail-clothing, textile, footwear & leather (R-CTFL) masterplan was
signed in November 2019 and covers 2020 to 2030. It replaced the Clothing
& Textile Competitiveness Programme (CTCP) which ran from 2009 to 2019.
It focuses on the value chain from manufacturing to retail sales and
includes the retail sector in its programmes and targets. Its targets include:
- Increasing the locally manufactured share of retail sales from under
43% to 65% by 2030;
- Increasing employment from 210,000 to 330,000 (170,000 retail and
160,000 manufacturing);
- Increase local procurement to R66 billion.
The sugarcane value chain masterplan was signed in November 2020 and
will run until 2030. It includes diversification plans for fuel ethanol.
Literature evidence on localisation It is difficult to quantify all of the outcomes of industrial policy over the past
25 years. Firm-level figures are difficult to obtain and causal links between
policy support and industry outcomes (output, exports, employment) are
not always clear.
Support for the automotive and renewable energy sectors has yielded the
best results. Job retention and new investment has occurred in the
automotive sector, and the renewable energy programme has resulted in
rapid expansion of electricity supply at a low cost to the fiscus. Local
content targets for renewable energy inputs have been focused and
achieved for the most part.
Overall, industrial support has not been cheap and has still not been able to
prevent job losses and the growth of imports in targeted sectors. Foreign
partners have raised concerns over the compliance burden for some
elements of industrial policy, particularly the PPPFA and B-BBEE requirements
for ownership and supply chain development.
LOCALISATION: WHAT IS REALISTIC? CHAPTER 1: LITERATURE REVIEW 17 MAY 2021
www.intellidex.co.za 22
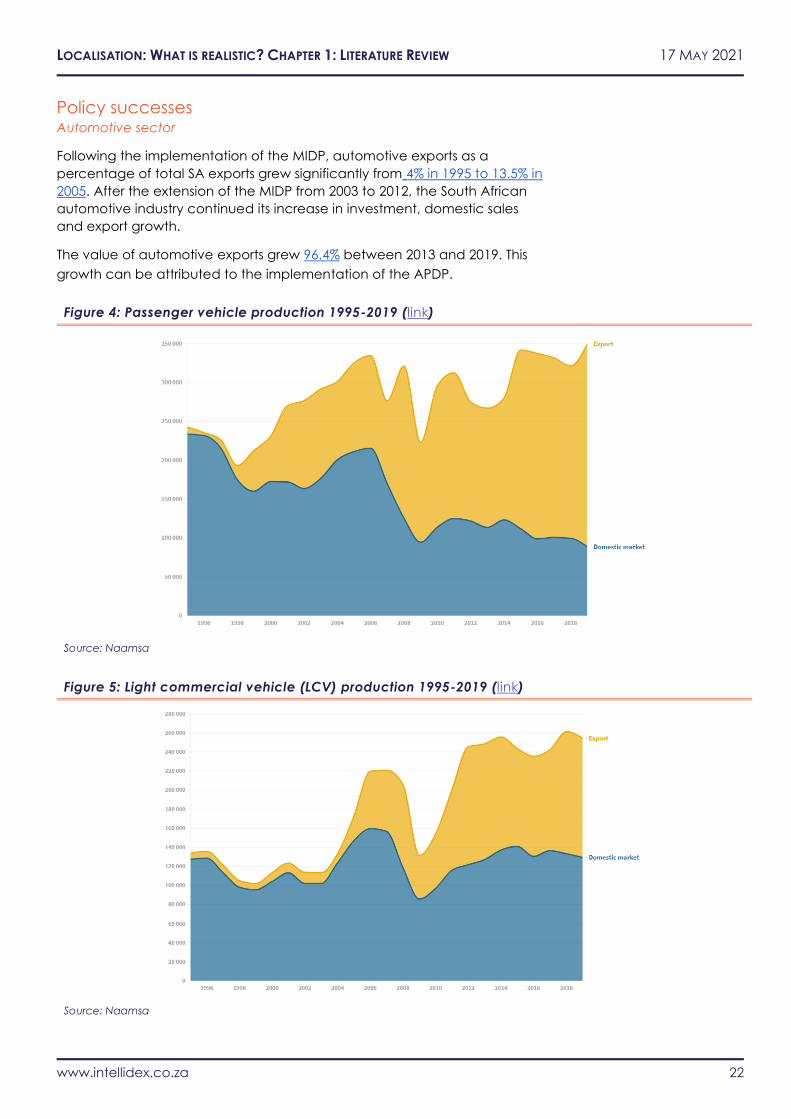
Policy successes Automotive sector
Following the implementation of the MIDP, automotive exports as a
percentage of total SA exports grew significantly from 4% in 1995 to 13.5% in
2005. After the extension of the MIDP from 2003 to 2012, the South African
automotive industry continued its increase in investment, domestic sales
and export growth.
The value of automotive exports grew 96.4% between 2013 and 2019. This
growth can be attributed to the implementation of the APDP.
Figure 4: Passenger vehicle production 1995-2019 (link)
Source: Naamsa
Figure 5: Light commercial vehicle (LCV) production 1995-2019 (link)
Source: Naamsa
LOCALISATION: WHAT IS REALISTIC? CHAPTER 1: LITERATURE REVIEW 17 MAY 2021
www.intellidex.co.za 23
B-BBEE
B-BBEE has resulted in a significant transfer of ownership of equity to
previously disadvantaged South Africans through a number of share
schemes. Evidence of successful localisation through local procurement is
harder to find.
Revisions to B-BBEE legislation have prioritised ownership and control over
job creation and local procurement. There have also been struggles with
“fronting”, or cosmetic transformation, which does not fundamentally
change the underlying composition of the economy.
REIPPP programme (2011)
From 2011 to 2018, 102 projects were procured with 51 already operational
by 2016. These are spread across the country, with locations determined by
where the resource is most available. There is thus a high concentration of
solar power plants in the Northern Cape due to the high levels of sunshine
while the majority of wind farms are in the coastal provinces such as the
Eastern Cape and Western Cape.
The REIPPPP has achieved great success in stimulating local and foreign
investment into the country’s energy sector. By the end of 2018, the REIPPP
had secured more than R209.4 billion in committed private sector
investment of which approximately R49 billion was from foreign direct
investment.
REIPPPP Success Factors
(i) Programme design
The programme design of the REIPPP enabled it to assist South Africa in
increasing its new generating capacity in a short time period. The REIPPP
was able to have multiple bid winners due to the size and structure of the
bidding process. This contributed to the support and engagement that the
programme received from the private sector through participation. The
potential project profitability that was possible for developers was clearly
visible from the tariffs with caps set, which stimulated the initial interest in the
programme and attracted larger numbers of bidders in later rounds.
(ii) Political support
Climate change has been a trending global issue that countries all over the
world seek to address with great urgency. South Africa’s efforts can be seen
from the long history of policy statements and the development of
strategies to utilise collaborative action between the public and private
sectors to explore renewable energy usage. A milestone for the renewable
energy agenda was achieved during South Africa’s hosting of the
Conference of the Parties (COP) to the UNFCCC in 2011 to assess progress
in dealing with climate change. It was at this conference that the South
African government’s Green Economy Accord was signed with the private
sector and other stakeholders.
(iii) Others
Management of the programme – there was a dedicated project unit, the
IPP Office, established in the Department of Energy which made the
facilitation of the programme more effective compared with the limited
LOCALISATION: WHAT IS REALISTIC? CHAPTER 1: LITERATURE REVIEW 17 MAY 2021
www.intellidex.co.za 24
attention the programme would have received if managed and
automatically facilitated through general government operational policies
and procedures.
Access to funding – by the end of 2018, R209.4 billion had been committed
by the private sector into the REIPPPP. This meant that the programme was
able to remain largely off the formal government’s budget for a certain
period, which alleviated pressure on fiscal resources. Some of the entities
that made up the majority of the investment into the REIPPPP included Old
Mutual, Red Cap, Phakwe and Pele Green.
Policy shortcomings and failures Automotive sector
Although the MIDP brought about a number of positive outcomes, some of
the negative outcomes included the provision of import credits, which
drove up imports. Total imports of vehicles and components have increased
rapidly since the inception of the MIDP, from R16.4 billion in 1995 to R 136.1
billion in 2012.
The APDP had a stated target of producing 1 million vehicles per annum by
2020, which the programme has failed to meet. Domestic production was
approximately 640,000 vehicles in 2019 and 608,000 in 2018.
Policy support was successful in increasing the value-add in the sector but
did not grow jobs: formal employment fell from 120,000 in 1995 to 90,000 in
2014.
Clothing and textiles sector
Following cumulative growth of about 33% between 2004 and 2010 under
the TCIDP, the sector shrank by about 5% over the next four years after the
implementation of the CTCIP. Exports did stabilise from 2010 to 2014 but this
came after a collapse of 60% in export values from 2001 to 2010.
Employment in the sector fared even worse: 230,000 people were formally
employed in clothing and textiles in 1998. This had fallen to 150,000 by 2004.
Under the TCIDP, employment fell further to 100,000 by 2010 and 85,000 in
2014.
NIPP and DIP
The 1999 arms deal, known formally as the Strategic Defence Package, has
been mired in controversy and accusations of corruption since its inception.
Most of the benefits of the NIPP/DIP were expected to be tied to the arms
deal through offsets programmes. These offsets, widely criticised at the time
for their design, were supposed to create 65,000 jobs. By 2006 only 13,000
had been created.
The interest payments on the arms deal increased as the rand depreciated
sharply. In 2001 these costs were estimated at R23 billion, representing a
substantial opportunity cost for the fiscus and for industrial policy.
LOCALISATION: WHAT IS REALISTIC? CHAPTER 1: LITERATURE REVIEW 17 MAY 2021
www.intellidex.co.za 25
PPPFA, B-BBEE and REIPPP: criticism from international partners
The EU Chamber of Commerce and Industry in Southern Africa produced a
2020 report entitled: The impact of local content policies on EU exports and
investment, and economic transformation in South Africa.
The report found that local content requirements increased the costs of
production in the renewable sector by about 10%. Protectionism and
industry concentration in the iron and steel and plastics sectors meant that
imports were often cheaper and of better quality than local suppliers,
limiting the options for localisation.
The higher costs associated with the PPPFA and B-BEEE compliance
discouraged foreign firms. Rather than investing in local capacity and
transferring equity to a domestic partner, many firms chose rather to sell
goods and services through a South African agent, raising the price of
domestic output.
Costs of industrial support The Parliamentary Budget Office (PBO) presented a report, The costs and
outcomes of industrial development initiatives 1994/95 -2014/15, to the
Standing Committee on Appropriations in August 2016.
The report summarised the financial costs and outcomes (changes in
manufacturing output, exports and employment) of 20 years of industrial
policy, focusing on the automotive and clothing/textiles manufacturing
sectors.
It found that the cost of programmes “[was] high relative to outcomes” and
that these “can be improved through better management or alternate
policies or means”.
The report calculated the constant (2015/16) rand value of industrial
support using data from National Treasury, Stats SA and Quantec. It found
that a total of R477 billion had been dedicated to industrial development.
Of this, 71% was in the form of tax expenditure (subsidies, rebates, tax breaks
and so on).
The motor vehicles and components sector had received R324 billion (tax
expenditure of R316 billion and expenditure of R8 billion). The clothing and
textiles sector had received R41 billion (R35 billion in tax expenditure and R6
billion in expenditure).
While both sectors had increased output and sales, employment numbers
fell despite the support. The clothing and textiles sector continued to lose
ground to imports, whose share of retail sales increased to over 55%.
Lessons for industrial policy There have been numerous criticisms and explanations for the failures of
industrial policy over the past 25 years, particularly the struggles to increase
local content.
Some policies have been criticised for being too overarching and general:
B-BBEE targets for employment, ownership and procurement have been
challenged and adapted by a number of sectors. The high costs of ensuring
compliance with the legislation have also been flagged, particularly by
foreign firms.
LOCALISATION: WHAT IS REALISTIC? CHAPTER 1: LITERATURE REVIEW 17 MAY 2021
www.intellidex.co.za 26
In contrast, some sector-specific policies have been seen as being too
focused on certain industries in isolation, ignoring the unintended
consequences for other sectors. For example, the prioritisation of the basic
iron and steel sector has been criticised for raising the costs of downstream
activities in the metal products and other sectors, raising the costs of inputs
for these sectors.
Similarly, the clothing and textiles industries sometimes adopted an
oppositional stance against each other despite the fact that both industries
were included under one sectoral policy. The trade protectionism sought by
the textiles industry was criticised by downstream clothing manufacturers for
raising their input costs.
The first round (1995-2012) of industrial policy was export-oriented, and some
of the policy instruments (eg, MIDP) included offsets in the form of import
rebates on imported components. This had a perverse effect on the
balance of trade in the automotive sector.
The successful policies (REIPPP and APDP) focused on domestic production
and supply chain integration. These two aspects of industrial policy have
remained the focus of the latest round of policy.
The successes of the REIPPP and international case studies point to the
successful components of industrial policy that should be prioritised in future.
These include: clear policy design; coordination and trust between the
public and private sectors; ensuring sufficient capacity in public monitoring:
and careful design of programmes and incentives.
International case studies
Vietnam
The evolution of Vietnamese industry began with the initiation of Doi Moi in
1986. Doi Moi is a set of economic reforms launched by Vietnam to
transition from a centrally-planned economy to a market-orientated one.
This meant that the country would limit state interference and state
intervention would mostly be at the planning phases of policies.
Free market incentives and regulations launched Vietnam’s economic
growth and consequently birthed a thriving open economy where private
businesses and foreign-owned enterprises were encouraged.
The implementation of the Doi Moi process entailed four main actions: (i)
Diversifying the country’s economy through developing multiple sectors; (ii)
forcing state-owned enterprises to become more self-reliant by removing
subsidies; (iii) abolishing price controls; and (iv) encouraging foreign
investment.
The initial step taken under the Doi Moi process was the shift from an import-
substitution to an export-orientation strategy. Vietnam’s development of its
domestic industries and the industrial output growth the country
experienced came as a result of its export-oriented policy.
The process of liberalisation in Vietnam was accelerated in the 1990s when
the country began entering into trade agreements such as the Textile-
Agreement with European Union in 1992, ASEAN Free Trade Agreement in
1995 and the World Trade Organization in 2007.
LOCALISATION: WHAT IS REALISTIC? CHAPTER 1: LITERATURE REVIEW 17 MAY 2021
www.intellidex.co.za 27
Vietnam has also entered into bilateral trade agreements with the United
States, China, India, Japan and Korea. The outcome of these agreements
was the lowering of tariffs on imports to and exports from Vietnam.
Upon transitioning into an open economy, the government prioritised
adopting a pro-investor approach by implementing domestic reforms such
as enabling Foreign Direct Investment. In 1986, Vietnam established the
country’s Law on Foreign Investment which detailed the country’s plans to
better facilitate foreign investment into the country.
From the 1980s to 1990s, Vietnam’s industry was dominated by the
production of steel, cement, electricity, zinc and coal. Thereafter, new
industries emerged after the discovery of oil. The top sub-industries with the
highest share in total industrial output between 1991 and 2005 included: (i)
food products; (ii) non-metallic mineral products; (iii) transport equipment
(motor vehicles and trailers); (iv) metal products; and (v) chemicals.
The manufacturing sector in Vietnam has experienced impressive growth for
the past three decades as a result of deepened integration over time with
other world economies. Focus areas for private businesses in Vietnam have
been the following: (i) processing (garments, leather, food and beverages,
wood and paper); (ii) chemicals and metallurgy (rubber, oil refinery, steel-
making); and (iii) engineering and consumer goods (electronics,
computers, automobiles, furniture, recycling).
Vietnam’s comparative advantages include:
Low wages: Perhaps Vietnam’s biggest advantage is its low cost of labour.
In 2010, manufacturing wages in Vietnam were just two-thirds of those in
China. Despite pressure from foreign clients and a series of increases in the
minimum wage, working conditions and remuneration in Vietnam are still
considered “harsh”.
A young and educated workforce: A quarter of Vietnam’s population is
between 21 and 34 years old, and half of the workforce is aged between
21 and 39. Public basic education has been prioritised by the government:
the adult literacy rate is above 98% and Vietnam placed 12th in the OECD’s
global education rankings in 2015.
Geographic proximity to major global supply chains: Vietnam is next door to
major manufacturers in the computing, automotive, and other high-tech
sectors. With pressure on thin margins in these countries, Vietnam is an
obvious choice for relocation by major manufacturing companies.
Lessons for South Africa
Implement export-orientated strategy
Through the Department of Trade and Industry, South Africa has developed
and implemented the Integrated National Export Strategy (INES). INES
comes after critical analysis of the SA’s export sector in order to identify
priority areas for enhanced export performance. Similar to Vietnam, SA
developed this strategy as a tool aimed to boost the capacity for value-
added goods. In order to achieve the 6% a year export growth target
prescribed in the INES by 2030, SA would have to increase domestic
manufacturing of exported goods. Unlike Vietnam, SA has not been
developing and implementing strategies to reinforce the development of its

LOCALISATION: WHAT IS REALISTIC? CHAPTER 1: LITERATURE REVIEW 17 MAY 2021
www.intellidex.co.za 28
manufacturing sector such as developing a model to unlock
entrepreneurial opportunities for emerging businesses.
Identify priority manufacturing subsectors and products
The government, through the Department of Trade and Industry, has been
successful in identifying focus areas (subsectors and products) where
increased local content may be possible. However, the government needs
to prioritise rigorous consultations with private businesses in order to extract
specific industry growth constraints. Collaborative action, through effective
communication, between the private and public sectors in Vietnam
ensured compliance and a cohesive effort towards increasing domestic
production in targeted sectors.
State-owned entities leading innovation and production in every sector
State-owned entities (SOE) are an avenue for launching economic growth.
The Vietnamese government created SOEs for this exact reason, which
resulted not only in an economic boost but also an eventual downturn in
growth through the stifling of competition in the market. The SA government
with its SOEs could similarly boost economic growth by ensuring a presence
in viable manufacturing subsectors. A limitation of the number of SOEs in
each subsector, along with partial private ownership, would avoid the
mistakes seen in Vietnam, ensuring a more sustainable model of growth in
changing markets.
Brazil Brazil pursued industrialisation in the early 1900s. Between 1930 and 1945,
Brazil started encouraging import substitution through a policy called
‘Import Substitution Industrialisation’ (ISI). This policy focused on promoting
domestic production of goods that were previously imported. The ISI policy
was implemented from 1930 to 1960 in Brazil with funds from the state,
private investors and foreign economies being used to finance the
implementation of this strategy. The focus industries during the process of
substitution were: (i) transportation; (ii) energy; (iii) minerals; and (iv)
extraction and transformation.
Brazil, like South Africa, is a country rich in minerals, biodiversity, solar energy,
and fertile soil. The country’s economic structure was historically attached
to agriculture and mining before it succeeded in transforming and
diversifying. It achieved this through fully developing domestic sectors to
manufacture goods that were being imported.
The implementation of import-substitution continued until the early 1980s
and its success was exhibited through the above-average growth rate the
Brazilian economy experienced from 1947 to 1980. However, the import
substitution industrialisation policy resulted in a scarcity of capital in Brazil
because it reduced the country's dependence on foreign products which
served as inputs in many manufacturing processes. This was one of the
policy’s biggest flaws – reducing dependence on developed countries
meant that Brazil failed to produce and export sufficient quantities of goods
due to the shortage of imported inputs to be used in the production
process.
From the 1990s, Brazil started implementing a set of liberalisation reforms
which included trade liberalisation. The successful industrialisation of Brazil
LOCALISATION: WHAT IS REALISTIC? CHAPTER 1: LITERATURE REVIEW 17 MAY 2021
www.intellidex.co.za 29
from the 1950s to 1970s can be attributed to the central role played by the
government. It was able to play a developmental actor role through the
establishment of state owned companies in the secondary sector with
particular focus on industries such as steel, minerals, petroleum and
chemicals. Foreign capital was invested in local production of
manufactured consumer products such as cars and electrical appliances.
Brazil’s comparative advantages include:
Access to raw materials: Brazil is the world's leading producer of tin, iron ore
and phosphate. It has large deposits of diamonds, manganese, chromium,
copper and bauxite. These commodities are important inputs into many
industrial processes.
Proximity to world markets: Brazil's location on the Atlantic Ocean and its
closeness to the Panama Canal greatly influence its trade with other
countries. Brazil's exports can be shipped through any of the seven major
seaports on the coast.
Labour supply: Until the early 1980s, Brazil’s labour costs were competitive
with many low-cost Asian countries; however rising labour costs through to
the early 2000s have greatly reduced the sector’s international
competitiveness. A large pool of relatively skilled labour in the Sao Paulo
Metropolitan Area has enabled employment in the area to remain fairly
stable.
Lessons for South Africa
Diversifying economic structure
Like Brazil, SA’s economic structure was historically attached to agriculture
and mining. Over time, SA has made progress in its attempts to diversify its
economic structure. From 1994-2012, SA has progressively increased its
export of non-fuel primary products and shifted towards medium-skill and
technology-intensive manufactured products. In diversifying sustainably,
South Africa needs to be careful of moving too far away from where the
country has comparative advantage as this may result in decreased overall
growth in the long term.
Import substitution
In pursuing an Import Substitution strategy, Brazil abandoned imports and
these included capital goods which were needed in building the country’s
domestic manufacturing sector. It is important for South Africa to not
neglect the necessity of importing certain equipment and raw materials
which serve as inputs in particular sectors in order for increased local
production to be possible. Pertinent to a successful export promotion
strategy for SA is increased large investments in the expansion of the
economic infrastructure. This strategy was effective in building domestic
capacity for Brazil. South Africa can finance this through developing,
similarly to Vietnam, a model aimed at better facilitating foreign direct
investment into the country.

LOCALISATION: WHAT IS REALISTIC? CHAPTER 1: LITERATURE REVIEW 17 MAY 2021
www.intellidex.co.za 30
United States The manufacturing sector has become less significant to the overall
economy since its late-1960s heyday, and it has declined sharply since
2001, firstly as a result of trade and tax policies that discouraged domestic
production, and secondly from the global financial crisis of 2008.
Three new industrial policies were created between 2009 and 2013, and the
sector did recover partly from the multi-decade lows of 2010. However, an
isolationist trade policy under the Trump administration and the COVID
lockdown of 2020 has reversed any recovery of the last ten years.
Fifty years ago, manufacturing made up a quarter of the US economy and
provided over 18 million jobs. Between 1970 and 2000 the sector’s
contribution to the economy fell from 25 percent to 15 percent while
employment remained steady, varying from 16.7 million to 19.6 million jobs.
From 2001 to 2010 the sector rapidly shed jobs, reaching a 70-year low of
11.5 million jobs in the first quarter of 2010. The global financial crisis in 2008
accelerated the fall in employment but more than half of the 5.5 million job
losses occurred before 2007.
Figure 6: US manufacturing employment 1970-2020 (link)
Source: Naamsa
American Recovery and Reinvestment Act 2009 (ARRA)
The ARRA was a stimulus package enacted in 2009 with two main
objectives: (i) to preserve and create jobs; (ii) and to promote economic
recovery. The ARRA was a massive round of government spending of
approximately $800 billion intended to create new jobs and to recover jobs
that were lost due to the 2008 financial crisis. ARRA was the largest fiscal
stimulus in American history and was considered one of the main
achievements of the Obama administration.
The Act was successful in meeting its first objective to preserve and create
jobs through quickly distributing funds in critical sectors such as energy,
health care, infrastructure and education to immediately stimulate job
creation. Literature evidence exists proving that state fiscal relief can have

LOCALISATION: WHAT IS REALISTIC? CHAPTER 1: LITERATURE REVIEW 17 MAY 2021
www.intellidex.co.za 31
a positive effect on employment figures. The ARRA included a ‘Buy
American’ provision prioritising the use of US domestic products. The ARRA
promoted localisation by prescribing that all iron, steel and manufactured
goods used in any ARRA funded project requiring the construction,
alteration, maintenance or repair of a public building, must have been
produced in the US.
Advanced Manufacturing Partnership 2011 (AMP)
The AMP was chartered in June 2011. The AMP focused on investing in
emerging technologies and creating high quality manufacturing jobs.
Emerging technologies that the US was looking to invest in included: (i)
information technology; (ii) biotechnology; (iii) nanotechnology. Prioritising
these focus areas. was meant to help reduce manufacturers’ costs,
improve quality and accelerate product development.
The following key focus areas for investment were identified: (i) building
domestic manufacturing capabilities in critical national security industries;
(ii) reducing the time needed to make advanced materials used in
manufacturing products; (iii) increasing the energy efficiency of
manufacturing processes; and (iv) developing new technologies that would
dramatically reduce the time required to design, build and test
manufactured goods.
The AMP was developed with the intent to provide a platform for
collaborative action between academia, US manufacturers and the US
government to invent and utilise new cutting-edge technologies that would
set the US apart as a leader in next-generation technologies.
National Network for Manufacturing Innovation 2013 (NNMI)
In 2013, President Obama proposed the creation of the NNMI. The purpose
of this initiative was to revitalise the US manufacturing sector by placing a
specific focus on manufacturing technologies and innovation. The NNMI
initiative’s objective was to strengthen the American manufacturing industry
while also driving innovation by encouraging collaborative action between
the public and private sectors.
The NNMI was successful in building a network of research institutes in the US
to focus on developing manufacturing technologies and subsequently
introduce new capabilities in the manufacturing sector.
Recovery and trade wars under President Trump
The manufacturing sector’s recovery was steady but slow in the last
decade. Manufacturing output and employment improved but by the first
quarter of 2020 was still below pre-crisis levels.
Trade policy under the Trump administration became increasingly
confrontational and isolationist as the US imposed import barriers on its main
trading partners, notably China and the EU. This resulted in retaliatory
action, sanctioned under WTO rules.
There is evidence that China’s countervailing duties were chosen to inflict
the maximum amount of political damage on the US; the largest barriers
were placed on exports of soybeans from the US to China, affecting farmers
in political swing states. Export markets that had been built up over years
LOCALISATION: WHAT IS REALISTIC? CHAPTER 1: LITERATURE REVIEW 17 MAY 2021
www.intellidex.co.za 32
were decimated within two years as China substituted imports from other
countries, including Brazil.
From March 2020, as the US entered Covid lockdown, output and
employment in manufacturing fell back to 2010 levels. Much of these losses
have been pared, but currently the sector’s levels of activity are close to
2013 levels, with barely 500,000 more jobs than at 2010’s lows.
Bibliography Industrial policy in South Africa
Localisation winners and losers in the South African automotive industry
(Barnes, Justin: 2005)
Implementing Localisation Programmes in South Africa (Strachan, G: 2017)
National Industrial Participation Programme: briefing by Department (Trade
and Industry, 2005)
The Department of Trade and Industry to give effect to the Customised
Sector Programme process (Trade and Industry, 2009)
Literature evidence on localisation
South Africa’s Renewable Energy IPP Procurement Programme: Success
Factors and Lessons (Eberhard, A: 2014)
Broad-Based Black Economic Empowerment Commission on its
establishment and progress (Trade and Industry, 2016)
The impact of local content policies on EU exports and investment, and
economic transformation in South Africa (EU Chamber of Commerce and
Industry in Southern Africa, 2020)
The arms deal: what you need to know (Corruption Watch, 2014)
The Motor Industry Development Programme 1995-2012: What have we
learned? (Barnes, J & Black, A, 2013)
Structural Transformation in the Auto Sector: Industrial Policy, State-Business
Bargaining and Supply Chain Development (Black, A, Barnes, J, Monaco, L,
IDTT 2018)
Department of Trade and Industry 2019/20 Annual Report; with Deputy
Minister (NCOP Trade & Industry, Economic Development, Small Business,
Tourism, Employment & Labour, 2021)
New-look APDP could change face of the local auto industry, says Naacam
(Engineering News, 2019)
The costs and outcomes of industrial development initiatives 1994/95 -
2014/15 (Parliamentary Budget Office, 2016)

LOCALISATION: WHAT IS REALISTIC? CHAPTER 1: LITERATURE REVIEW 17 MAY 2021
www.intellidex.co.za 33
Future industrial policy
SA postpones launch of automotive masterplan to July 2021 (Businesslive,
2021)
Poultry Industry Meets Government on Industry Masterplan Amid Optimism
About Sector Performance (DTIC, 2020)
Briefing on the Retail-Clothing, Textile, Footwear & Leather Masterplan
(DTIC, 2020)
International case studies
US Manufacturing Statistics and Outlook (Amadeo, K: 2021)
LOCALISATION: WHAT IS REALISTIC? CHAPTER 2: QUANTITATIVE STUDY 17 MAY 2021
www.intellidex.co.za 34
Chapter 2: Quantitative study A huge disparity in capacity and historic growth rates points to problems
meeting blanket targets, but sectoral improvements could well be feasible.
Summary South Africa’s manufacturing sector volumes has fared poorly over the past
15 years: output has remained unchanged since 2004.
Growth in the value of manufacturing has been better, with the largest
manufacturing sectors experiencing nominal sales growth of between 4%
and 12% over the same period.
Targeted industrialisation policies have been successful in some cases. The
motor vehicles, parts and accessories sector has benefited from targeted
and regularly updated policies, including significant subsidies and export
credits.
However, South Africa’s weak fiscal position and degraded bureaucratic
capacity militate against any new industrial support policies on a similar
scale. There is a low probability of successful replication of support in the
automotive sector across other struggling sectors.
Localisation targets have been modelled on the import values of 2020 and
the average growth in sectoral value of the past five years. These
assumptions are based on the nominal value of manufacturing and are
vulnerable to changes in the exchange rate and a general economic
recovery.
The localisation model does indicate a high probability of meeting
localisation targets within the next five years for a number of key
manufacturing sectors, including the paper, wood, motor vehicles, ceramic
products, glass, basic iron and steel, and food and beverages sectors.
Policymakers will need to decide how to structure localisation targets: it is
possible that targets can be met on an aggregate level (equivalent to a 2-
or 3-digit SIC code classification), while specific industries could fail to meet
targets. For example, the basic iron and steel group is likely to meet
localisation targets within a short time while the chemicals group is not.
Material risks remain for the metal products subsector yet certain subsectors
in the chemicals group may meet localisation targets within three years.
Other manufacturing sectors are highly unlikely to meet localisation targets
without significant policy support and macroeconomic headwinds
(including a recovery in domestic demand and a favourable exchange
rate). These sectors include the printing and publishing, textiles, clothing,
footwear, rubber and machinery and electronic equipment sectors.
The table below summarises the size of the localisation requirements for the
10 largest sectors (2- and 3-digit SIC classification) and the equivalent
annual growth rates needed to meet localisation targets within three, five
and 10 years:
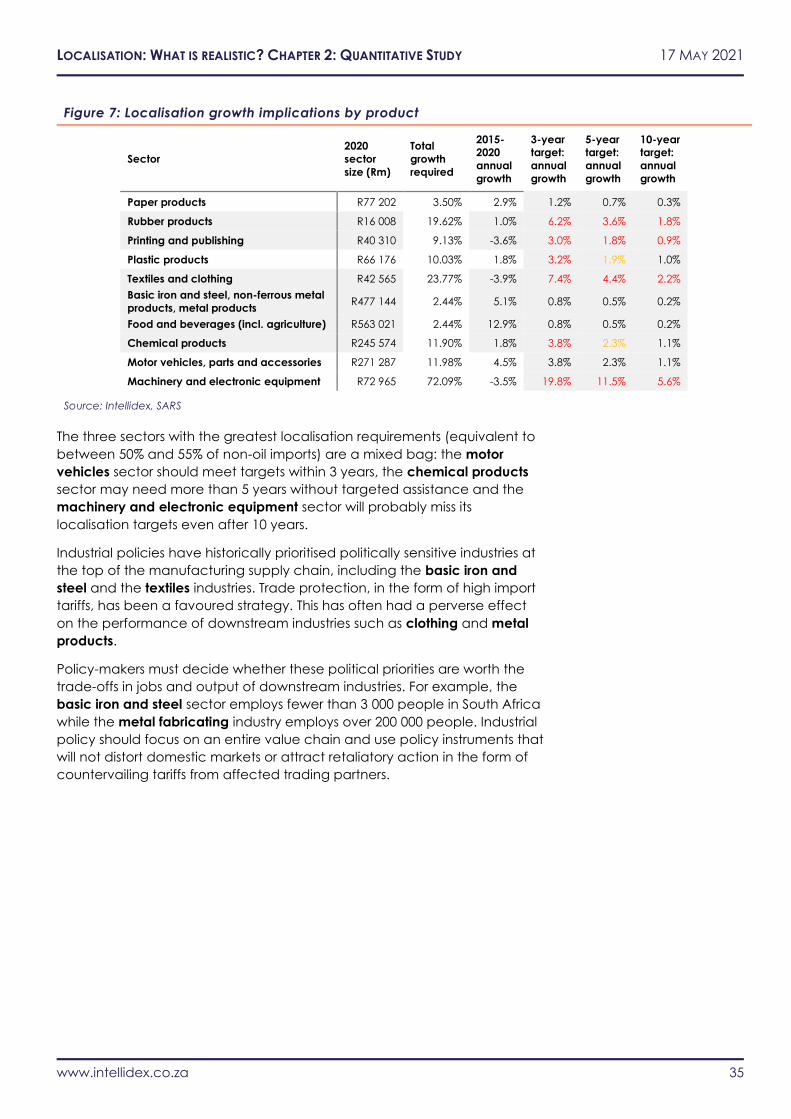
LOCALISATION: WHAT IS REALISTIC? CHAPTER 2: QUANTITATIVE STUDY 17 MAY 2021
www.intellidex.co.za 35
Figure 7: Localisation growth implications by product
Sector
2020
sector
size (Rm)
Total
growth
required
2015-
2020
annual
growth
3-year
target:
annual
growth
5-year
target:
annual
growth
10-year
target:
annual
growth
Paper products R77 202 3.50% 2.9% 1.2% 0.7% 0.3%
Rubber products R16 008 19.62% 1.0% 6.2% 3.6% 1.8%
Printing and publishing R40 310 9.13% -3.6% 3.0% 1.8% 0.9%
Plastic products R66 176 10.03% 1.8% 3.2% 1.9% 1.0%
Textiles and clothing R42 565 23.77% -3.9% 7.4% 4.4% 2.2%
Basic iron and steel, non-ferrous metal
products, metal products R477 144 2.44% 5.1% 0.8% 0.5% 0.2%
Food and beverages (incl. agriculture) R563 021 2.44% 12.9% 0.8% 0.5% 0.2%
Chemical products R245 574 11.90% 1.8% 3.8% 2.3% 1.1%
Motor vehicles, parts and accessories R271 287 11.98% 4.5% 3.8% 2.3% 1.1%
Machinery and electronic equipment R72 965 72.09% -3.5% 19.8% 11.5% 5.6%
Source: Intellidex, SARS
The three sectors with the greatest localisation requirements (equivalent to
between 50% and 55% of non-oil imports) are a mixed bag: the motor
vehicles sector should meet targets within 3 years, the chemical products
sector may need more than 5 years without targeted assistance and the
machinery and electronic equipment sector will probably miss its
localisation targets even after 10 years.
Industrial policies have historically prioritised politically sensitive industries at
the top of the manufacturing supply chain, including the basic iron and
steel and the textiles industries. Trade protection, in the form of high import
tariffs, has been a favoured strategy. This has often had a perverse effect
on the performance of downstream industries such as clothing and metal
products.
Policy-makers must decide whether these political priorities are worth the
trade-offs in jobs and output of downstream industries. For example, the
basic iron and steel sector employs fewer than 3 000 people in South Africa
while the metal fabricating industry employs over 200 000 people. Industrial
policy should focus on an entire value chain and use policy instruments that
will not distort domestic markets or attract retaliatory action in the form of
countervailing tariffs from affected trading partners.

LOCALISATION: WHAT IS REALISTIC? CHAPTER 2: QUANTITATIVE STUDY 17 MAY 2021
www.intellidex.co.za 36
Detailed breakdown
Figure 8: Imports 2020 (link)
Source: SARS trade data
Trends in imports of goods More than a quarter of South Africa’s non-oil imports by value are imports of
machinery: cellphones, computers, electrical equipment and other
appliances and machinery. The demand for these goods has increased
strongly over time, growing 7.5% year on year (yoy) from 2018 to 2019. In
contrast, exports of machinery have grown at an annualised rate of about
2%.
Motor vehicles, parts and accessories is the second-largest group of
imports. It includes imports of rail, shipping and air vehicles. The value of
these imports has grown by about 13% yoy from 2010 to 2020.
Chemicals is the third-largest group of imports by value and has seen strong
growth in the rand value of imports over the past 10 years. Pharmaceutical
products, organic chemical compounds, and inorganic chemical
compounds are the largest sub-groups.
Together, these three product groups make up over 55% of imports by
value. This share has remained consistent over 10 years.
While machinery imports (and pharmaceutical products) consist mostly of
finished goods, mineral products and other imports of chemicals are
important inputs into a range of manufactured goods. South Africa’s
reliance on these imports has a direct effect on the supply chains for
domestic manufacturing and important implications for future localisation
and diversification.
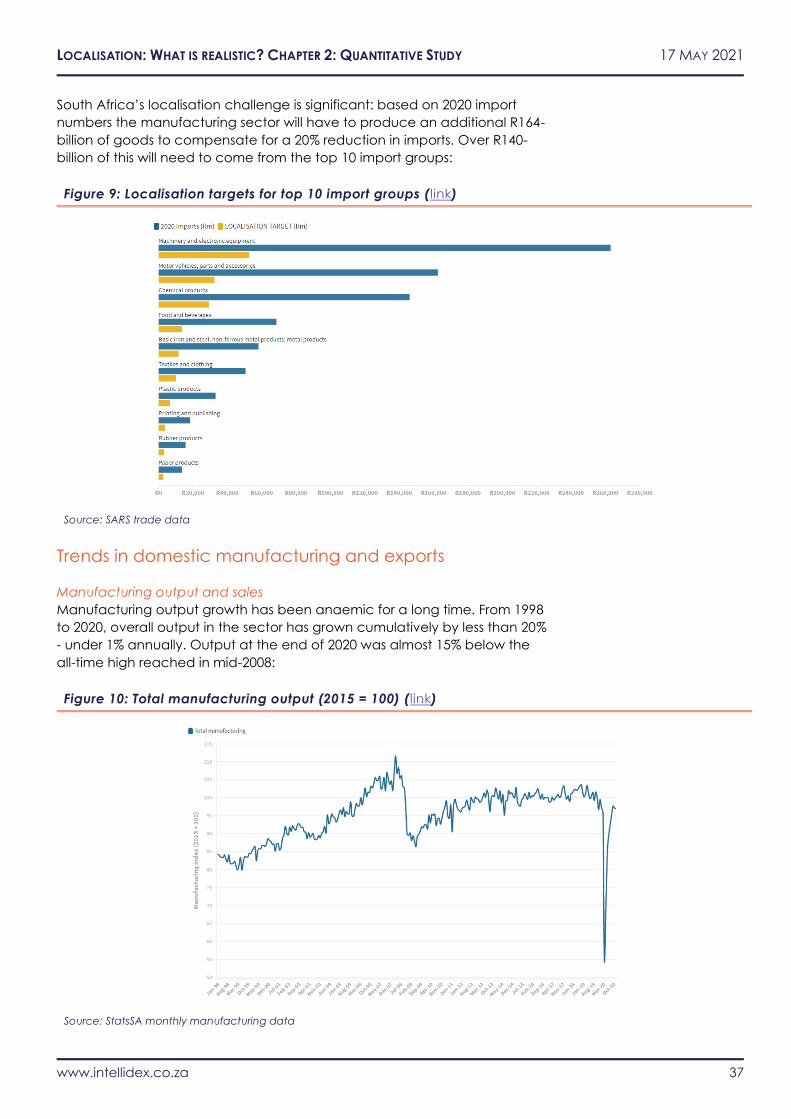
LOCALISATION: WHAT IS REALISTIC? CHAPTER 2: QUANTITATIVE STUDY 17 MAY 2021
www.intellidex.co.za 37
South Africa’s localisation challenge is significant: based on 2020 import
numbers the manufacturing sector will have to produce an additional R164-
billion of goods to compensate for a 20% reduction in imports. Over R140-
billion of this will need to come from the top 10 import groups:
Figure 9: Localisation targets for top 10 import groups ( link)
Source: SARS trade data
Trends in domestic manufacturing and exports
Manufacturing output and sales
Manufacturing output growth has been anaemic for a long time. From 1998
to 2020, overall output in the sector has grown cumulatively by less than 20%
- under 1% annually. Output at the end of 2020 was almost 15% below the
all-time high reached in mid-2008:
Figure 10: Total manufacturing output (2015 = 100) ( link)
Source: StatsSA monthly manufacturing data
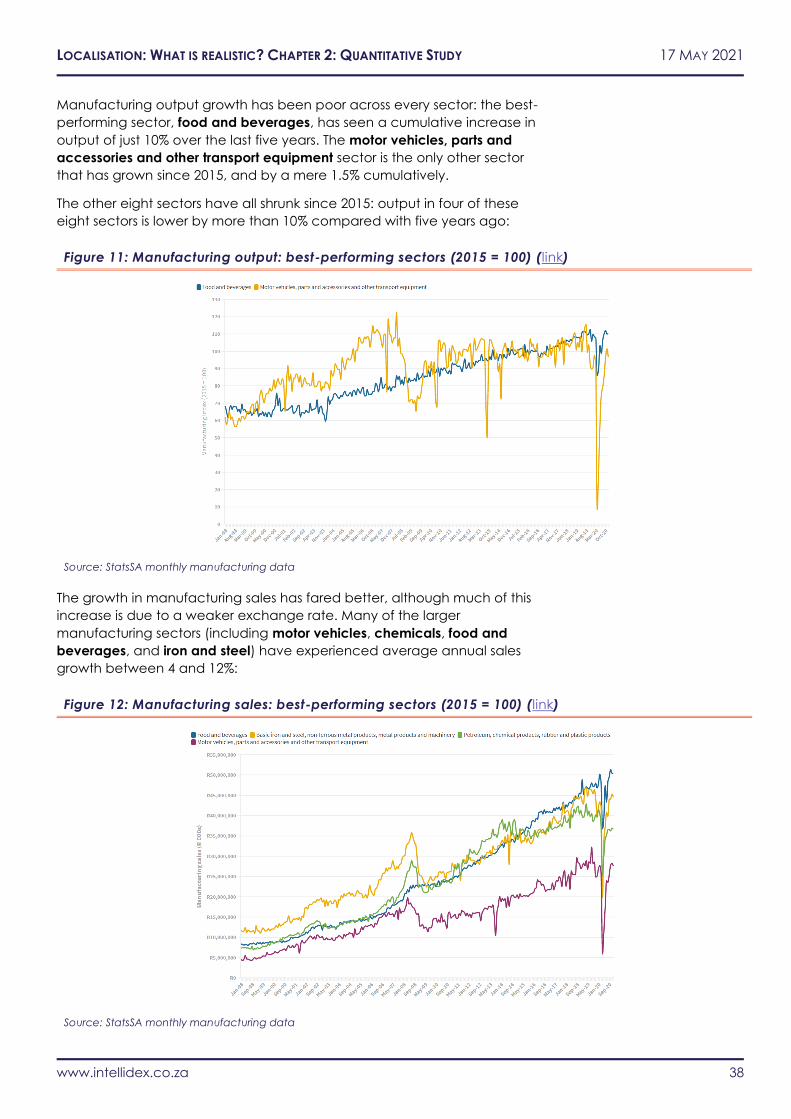
LOCALISATION: WHAT IS REALISTIC? CHAPTER 2: QUANTITATIVE STUDY 17 MAY 2021
www.intellidex.co.za 38
Manufacturing output growth has been poor across every sector: the best-
performing sector, food and beverages, has seen a cumulative increase in
output of just 10% over the last five years. The motor vehicles, parts and
accessories and other transport equipment sector is the only other sector
that has grown since 2015, and by a mere 1.5% cumulatively.
The other eight sectors have all shrunk since 2015: output in four of these
eight sectors is lower by more than 10% compared with five years ago:
Figure 11: Manufacturing output: best-performing sectors (2015 = 100) ( link)
Source: StatsSA monthly manufacturing data
The growth in manufacturing sales has fared better, although much of this
increase is due to a weaker exchange rate. Many of the larger
manufacturing sectors (including motor vehicles, chemicals, food and
beverages, and iron and steel) have experienced average annual sales
growth between 4 and 12%:
Figure 12: Manufacturing sales: best-performing sectors (2015 = 100) ( link)
Source: StatsSA monthly manufacturing data

LOCALISATION: WHAT IS REALISTIC? CHAPTER 2: QUANTITATIVE STUDY 17 MAY 2021
www.intellidex.co.za 39
The graph below shows the value of the 10 largest manufacturing sectors
compared with the required value of localisation:
Figure 13: Localisation targets and current size of domestic sectors ( link)
Source: StatsSA monthly manufacturing data, SARS trade data
The localisation requirement, expressed as a percentage of the size of the
domestic sectors, is under 10% for the food and beverages, basic iron and
steel, paper, and printing and publishing sectors. It is more sizeable
(between 10 and 20%) for the plastics, chemicals, motor vehicles, parts and
accessories, and rubber sectors. The requirement is significant for the
textiles, and machinery and electronic equipment sectors.
It is not just the size of the sectors but also the recent growth (or decline) in
these sectors that is relevant. The scatter plot below compares the
localisation requirements with growth in the relevant sectors:
Figure 14: Localisation targets and current growth of domestic sectors ( link)
Source: StatsSA monthly manufacturing data, SARS trade data
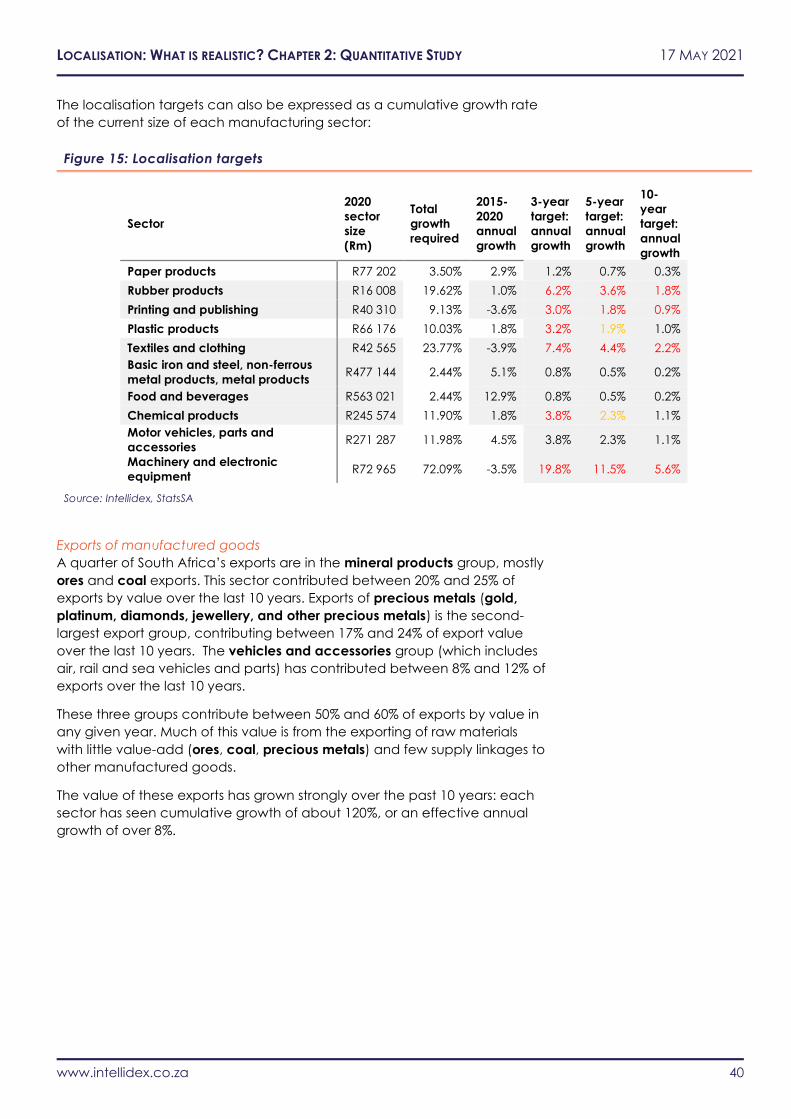
LOCALISATION: WHAT IS REALISTIC? CHAPTER 2: QUANTITATIVE STUDY 17 MAY 2021
www.intellidex.co.za 40
The localisation targets can also be expressed as a cumulative growth rate
of the current size of each manufacturing sector:
Figure 15: Localisation targets
Sector
2020
sector
size
(Rm)
Total
growth
required
2015-
2020
annual
growth
3-year
target:
annual
growth
5-year
target:
annual
growth
10-
year
target:
annual
growth
Paper products R77 202 3.50% 2.9% 1.2% 0.7% 0.3%
Rubber products R16 008 19.62% 1.0% 6.2% 3.6% 1.8%
Printing and publishing R40 310 9.13% -3.6% 3.0% 1.8% 0.9%
Plastic products R66 176 10.03% 1.8% 3.2% 1.9% 1.0%
Textiles and clothing R42 565 23.77% -3.9% 7.4% 4.4% 2.2%
Basic iron and steel, non-ferrous
metal products, metal products R477 144 2.44% 5.1% 0.8% 0.5% 0.2%
Food and beverages R563 021 2.44% 12.9% 0.8% 0.5% 0.2%
Chemical products R245 574 11.90% 1.8% 3.8% 2.3% 1.1%
Motor vehicles, parts and
accessories R271 287 11.98% 4.5% 3.8% 2.3% 1.1%
Machinery and electronic
equipment R72 965 72.09% -3.5% 19.8% 11.5% 5.6%
Source: Intellidex, StatsSA
Exports of manufactured goods
A quarter of South Africa’s exports are in the mineral products group, mostly
ores and coal exports. This sector contributed between 20% and 25% of
exports by value over the last 10 years. Exports of precious metals (gold,
platinum, diamonds, jewellery, and other precious metals) is the second-
largest export group, contributing between 17% and 24% of export value
over the last 10 years. The vehicles and accessories group (which includes
air, rail and sea vehicles and parts) has contributed between 8% and 12% of
exports over the last 10 years.
These three groups contribute between 50% and 60% of exports by value in
any given year. Much of this value is from the exporting of raw materials
with little value-add (ores, coal, precious metals) and few supply linkages to
other manufactured goods.
The value of these exports has grown strongly over the past 10 years: each
sector has seen cumulative growth of about 120%, or an effective annual
growth of over 8%.
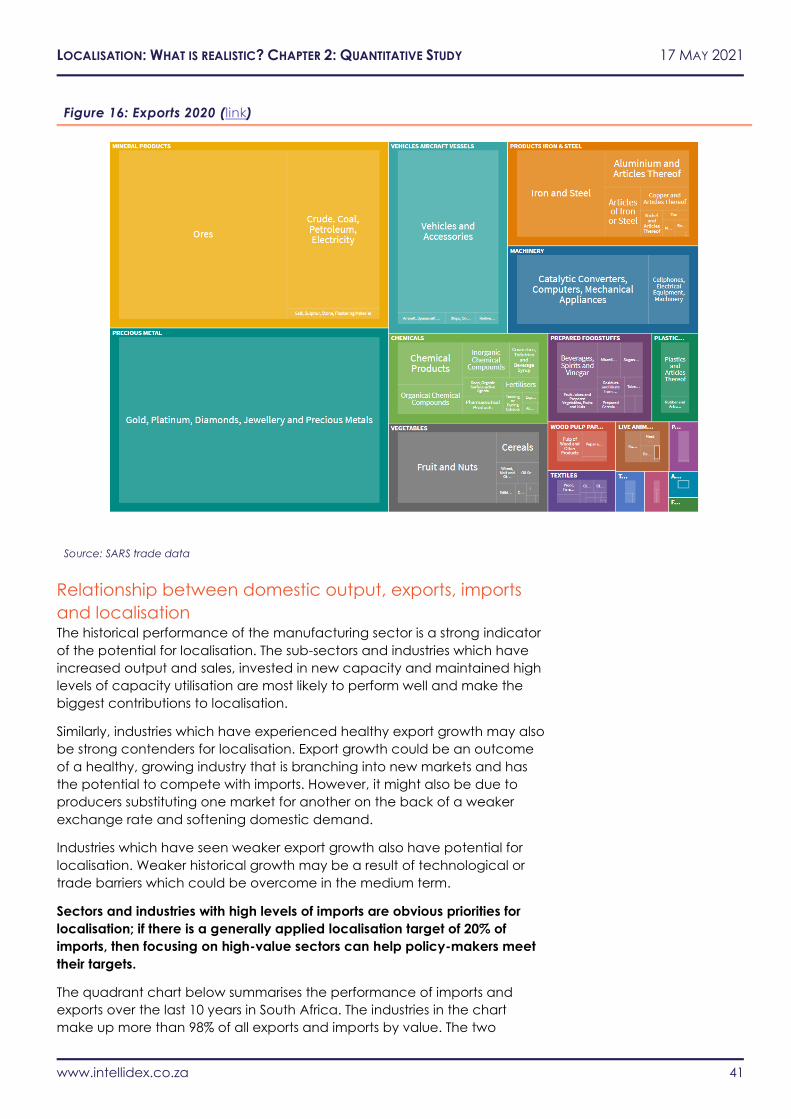
LOCALISATION: WHAT IS REALISTIC? CHAPTER 2: QUANTITATIVE STUDY 17 MAY 2021
www.intellidex.co.za 41
Figure 16: Exports 2020 (link)
Source: SARS trade data
Relationship between domestic output, exports, imports
and localisation The historical performance of the manufacturing sector is a strong indicator
of the potential for localisation. The sub-sectors and industries which have
increased output and sales, invested in new capacity and maintained high
levels of capacity utilisation are most likely to perform well and make the
biggest contributions to localisation.
Similarly, industries which have experienced healthy export growth may also
be strong contenders for localisation. Export growth could be an outcome
of a healthy, growing industry that is branching into new markets and has
the potential to compete with imports. However, it might also be due to
producers substituting one market for another on the back of a weaker
exchange rate and softening domestic demand.
Industries which have seen weaker export growth also have potential for
localisation. Weaker historical growth may be a result of technological or
trade barriers which could be overcome in the medium term.
Sectors and industries with high levels of imports are obvious priorities for
localisation; if there is a generally applied localisation target of 20% of
imports, then focusing on high-value sectors can help policy-makers meet
their targets.
The quadrant chart below summarises the performance of imports and
exports over the last 10 years in South Africa. The industries in the chart
make up more than 98% of all exports and imports by value. The two
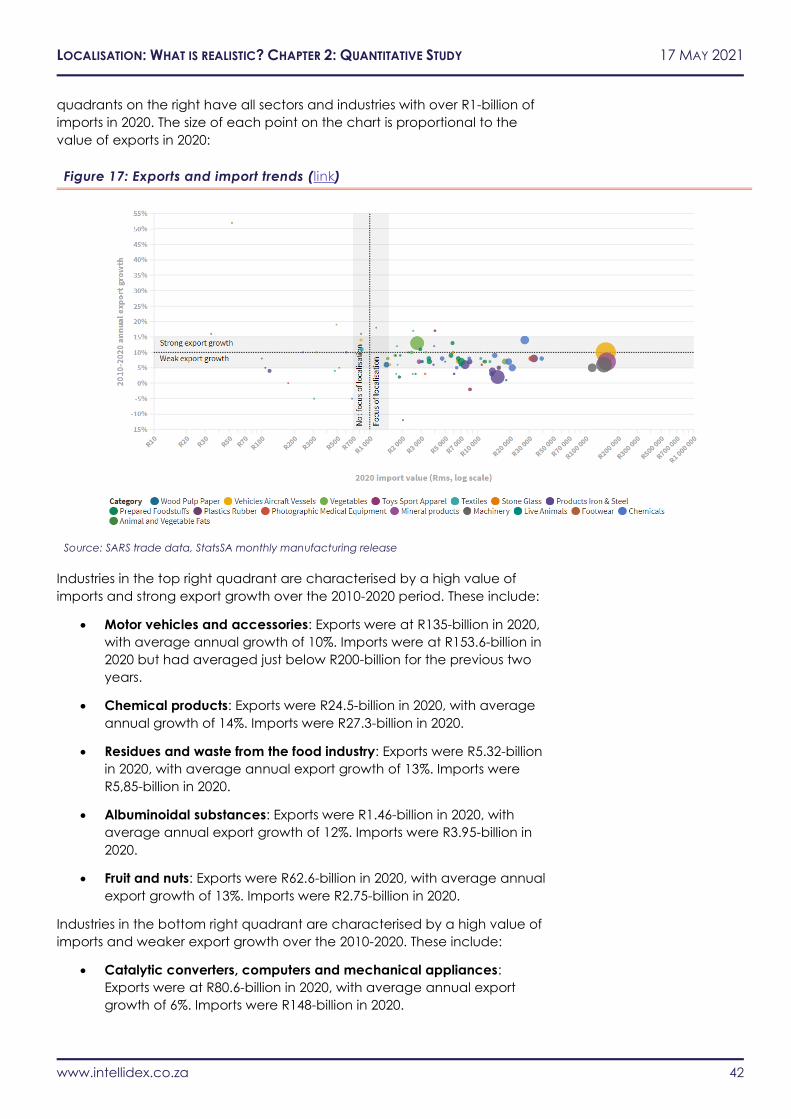
LOCALISATION: WHAT IS REALISTIC? CHAPTER 2: QUANTITATIVE STUDY 17 MAY 2021
www.intellidex.co.za 42
quadrants on the right have all sectors and industries with over R1-billion of
imports in 2020. The size of each point on the chart is proportional to the
value of exports in 2020:
Figure 17: Exports and import trends (link)
Source: SARS trade data, StatsSA monthly manufacturing release
Industries in the top right quadrant are characterised by a high value of
imports and strong export growth over the 2010-2020 period. These include:
• Motor vehicles and accessories: Exports were at R135-billion in 2020,
with average annual growth of 10%. Imports were at R153.6-billion in
2020 but had averaged just below R200-billion for the previous two
years.
• Chemical products: Exports were R24.5-billion in 2020, with average
annual growth of 14%. Imports were R27.3-billion in 2020.
• Residues and waste from the food industry: Exports were R5.32-billion
in 2020, with average annual export growth of 13%. Imports were
R5,85-billion in 2020.
• Albuminoidal substances: Exports were R1.46-billion in 2020, with
average annual export growth of 12%. Imports were R3.95-billion in
2020.
• Fruit and nuts: Exports were R62.6-billion in 2020, with average annual
export growth of 13%. Imports were R2.75-billion in 2020.
Industries in the bottom right quadrant are characterised by a high value of
imports and weaker export growth over the 2010-2020. These include:
• Catalytic converters, computers and mechanical appliances:
Exports were at R80.6-billion in 2020, with average annual export
growth of 6%. Imports were R148-billion in 2020.
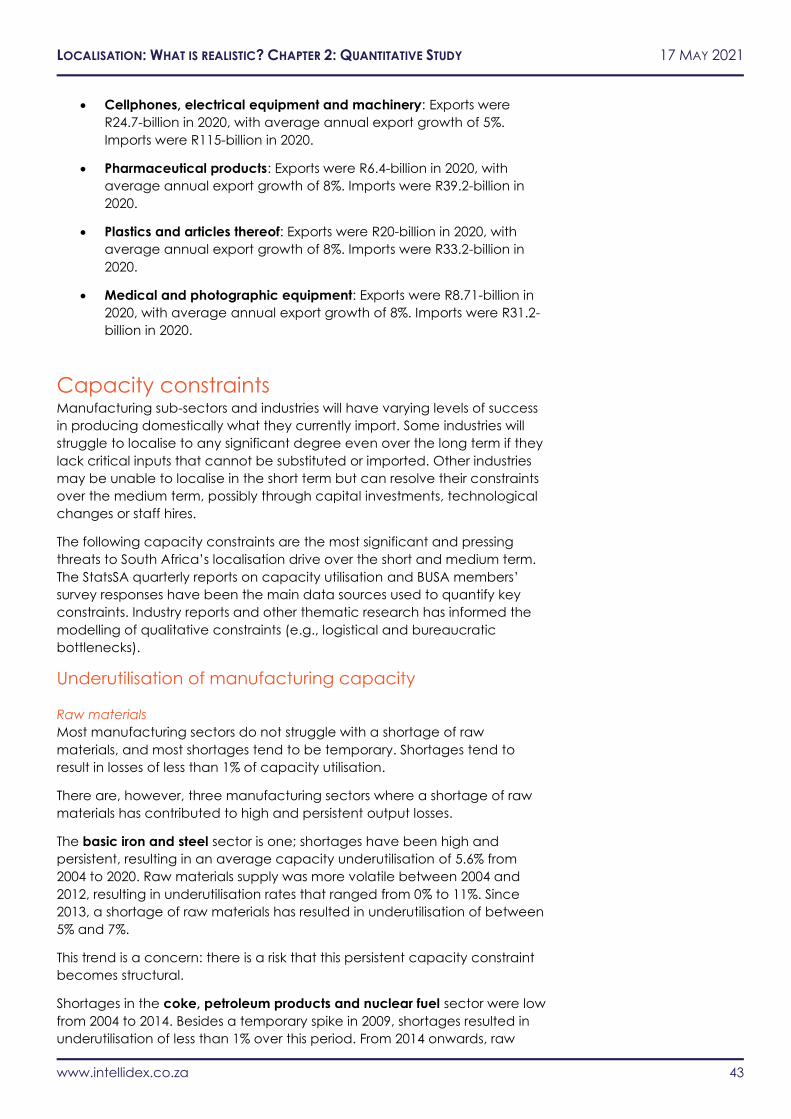
LOCALISATION: WHAT IS REALISTIC? CHAPTER 2: QUANTITATIVE STUDY 17 MAY 2021
www.intellidex.co.za 43
• Cellphones, electrical equipment and machinery: Exports were
R24.7-billion in 2020, with average annual export growth of 5%.
Imports were R115-billion in 2020.
• Pharmaceutical products: Exports were R6.4-billion in 2020, with
average annual export growth of 8%. Imports were R39.2-billion in
2020.
• Plastics and articles thereof: Exports were R20-billion in 2020, with
average annual export growth of 8%. Imports were R33.2-billion in
2020.
• Medical and photographic equipment: Exports were R8.71-billion in
2020, with average annual export growth of 8%. Imports were R31.2-
billion in 2020.
Capacity constraints Manufacturing sub-sectors and industries will have varying levels of success
in producing domestically what they currently import. Some industries will
struggle to localise to any significant degree even over the long term if they
lack critical inputs that cannot be substituted or imported. Other industries
may be unable to localise in the short term but can resolve their constraints
over the medium term, possibly through capital investments, technological
changes or staff hires.
The following capacity constraints are the most significant and pressing
threats to South Africa’s localisation drive over the short and medium term.
The StatsSA quarterly reports on capacity utilisation and BUSA members’
survey responses have been the main data sources used to quantify key
constraints. Industry reports and other thematic research has informed the
modelling of qualitative constraints (e.g., logistical and bureaucratic
bottlenecks).
Underutilisation of manufacturing capacity
Raw materials
Most manufacturing sectors do not struggle with a shortage of raw
materials, and most shortages tend to be temporary. Shortages tend to
result in losses of less than 1% of capacity utilisation.
There are, however, three manufacturing sectors where a shortage of raw
materials has contributed to high and persistent output losses.
The basic iron and steel sector is one; shortages have been high and
persistent, resulting in an average capacity underutilisation of 5.6% from
2004 to 2020. Raw materials supply was more volatile between 2004 and
2012, resulting in underutilisation rates that ranged from 0% to 11%. Since
2013, a shortage of raw materials has resulted in underutilisation of between
5% and 7%.
This trend is a concern: there is a risk that this persistent capacity constraint
becomes structural.
Shortages in the coke, petroleum products and nuclear fuel sector were low
from 2004 to 2014. Besides a temporary spike in 2009, shortages resulted in
underutilisation of less than 1% over this period. From 2014 onwards, raw
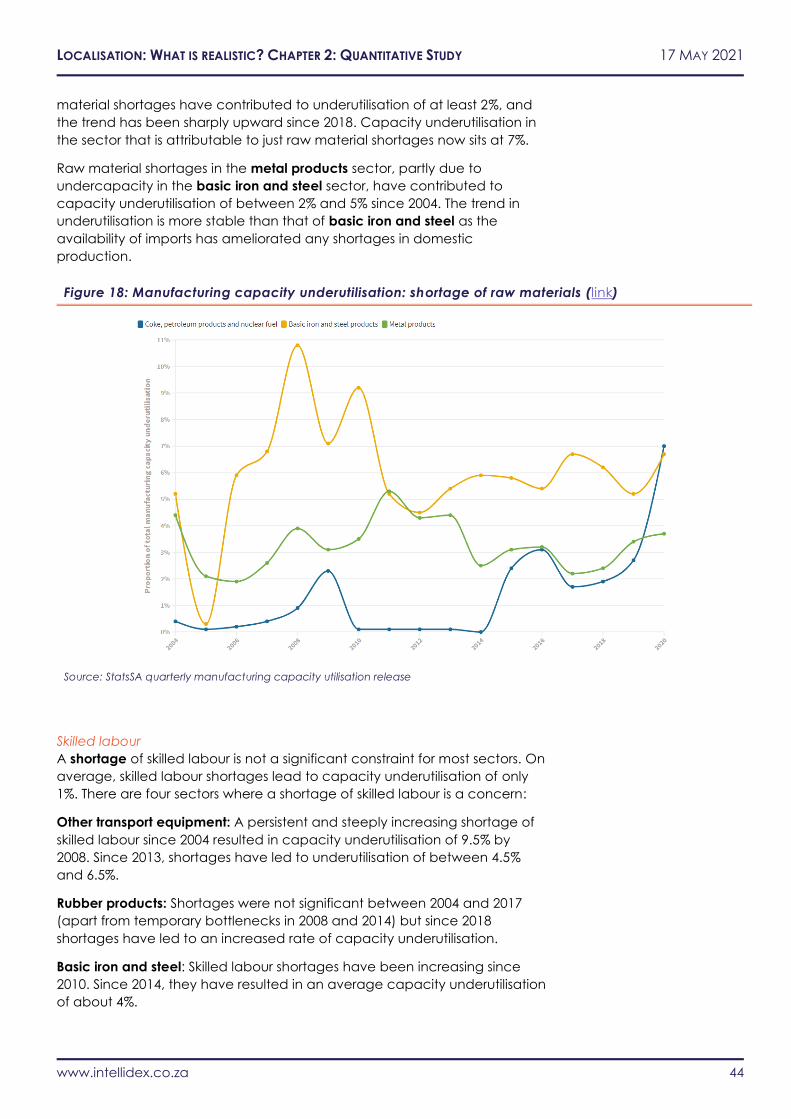
LOCALISATION: WHAT IS REALISTIC? CHAPTER 2: QUANTITATIVE STUDY 17 MAY 2021
www.intellidex.co.za 44
material shortages have contributed to underutilisation of at least 2%, and
the trend has been sharply upward since 2018. Capacity underutilisation in
the sector that is attributable to just raw material shortages now sits at 7%.
Raw material shortages in the metal products sector, partly due to
undercapacity in the basic iron and steel sector, have contributed to
capacity underutilisation of between 2% and 5% since 2004. The trend in
underutilisation is more stable than that of basic iron and steel as the
availability of imports has ameliorated any shortages in domestic
production.
Figure 18: Manufacturing capacity underutilisation: shortage of raw materials (link)
Source: StatsSA quarterly manufacturing capacity utilisation release
Skilled labour
A shortage of skilled labour is not a significant constraint for most sectors. On
average, skilled labour shortages lead to capacity underutilisation of only
1%. There are four sectors where a shortage of skilled labour is a concern:
Other transport equipment: A persistent and steeply increasing shortage of
skilled labour since 2004 resulted in capacity underutilisation of 9.5% by
2008. Since 2013, shortages have led to underutilisation of between 4.5%
and 6.5%.
Rubber products: Shortages were not significant between 2004 and 2017
(apart from temporary bottlenecks in 2008 and 2014) but since 2018
shortages have led to an increased rate of capacity underutilisation.
Basic iron and steel: Skilled labour shortages have been increasing since
2010. Since 2014, they have resulted in an average capacity underutilisation
of about 4%.
LOCALISATION: WHAT IS REALISTIC? CHAPTER 2: QUANTITATIVE STUDY 17 MAY 2021
www.intellidex.co.za 45
Metal products: The shortage of skilled labour saw underutilisation peak at
2.6% in 2013 but it has since declined. Underutilisation has been 1.5% for the
past two years.
Figure 19: Manufacturing capacity underutilisation: shortage of skilled labour ( link)
Source: StatsSA quarterly manufacturing capacity utilisation release
Unskilled and semi-skilled labour
Very few sectors are affected by a shortage of unskilled or semi-skilled
labour and the effect on those sectors is of a much smaller magnitude.
Manufacturing capacity utilisation fell by less than 0.3% on average since
2004. Only two sectors have seen capacity utilisation fall by more than 1%:
leather and furniture.
Capacity underutilisation in the leather sector has ranged from 0.4% to 1.3%
since 2009. Since 2016, it’s been stuck in a tight band between 1.2% and
1.3%.
After many years of zero underutilisation in the furniture sector, it shot up
suddenly to 2% between 2015 and 2017 before falling back to 0.8% in 2020.
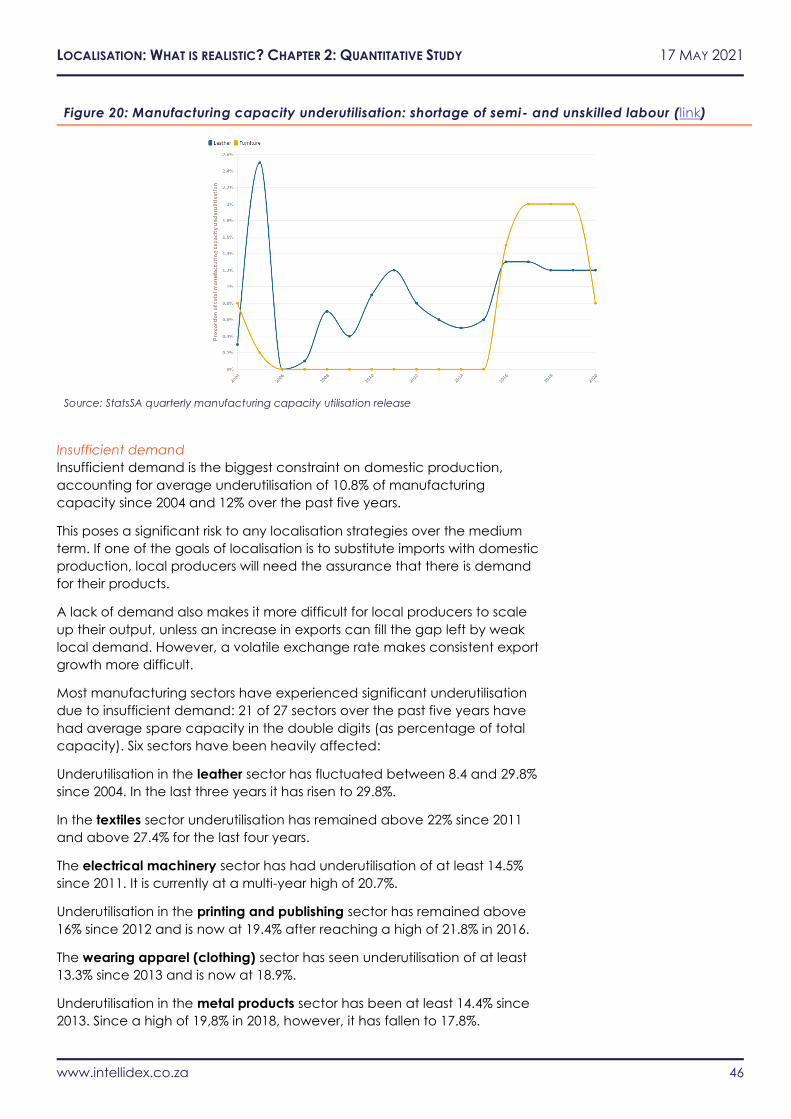
LOCALISATION: WHAT IS REALISTIC? CHAPTER 2: QUANTITATIVE STUDY 17 MAY 2021
www.intellidex.co.za 46
Figure 20: Manufacturing capacity underutilisation: shortage of semi- and unskilled labour (link)
Source: StatsSA quarterly manufacturing capacity utilisation release
Insufficient demand
Insufficient demand is the biggest constraint on domestic production,
accounting for average underutilisation of 10.8% of manufacturing
capacity since 2004 and 12% over the past five years.
This poses a significant risk to any localisation strategies over the medium
term. If one of the goals of localisation is to substitute imports with domestic
production, local producers will need the assurance that there is demand
for their products.
A lack of demand also makes it more difficult for local producers to scale
up their output, unless an increase in exports can fill the gap left by weak
local demand. However, a volatile exchange rate makes consistent export
growth more difficult.
Most manufacturing sectors have experienced significant underutilisation
due to insufficient demand: 21 of 27 sectors over the past five years have
had average spare capacity in the double digits (as percentage of total
capacity). Six sectors have been heavily affected:
Underutilisation in the leather sector has fluctuated between 8.4 and 29.8%
since 2004. In the last three years it has risen to 29.8%.
In the textiles sector underutilisation has remained above 22% since 2011
and above 27.4% for the last four years.
The electrical machinery sector has had underutilisation of at least 14.5%
since 2011. It is currently at a multi-year high of 20.7%.
Underutilisation in the printing and publishing sector has remained above
16% since 2012 and is now at 19.4% after reaching a high of 21.8% in 2016.
The wearing apparel (clothing) sector has seen underutilisation of at least
13.3% since 2013 and is now at 18.9%.
Underutilisation in the metal products sector has been at least 14.4% since
2013. Since a high of 19,8% in 2018, however, it has fallen to 17.8%.
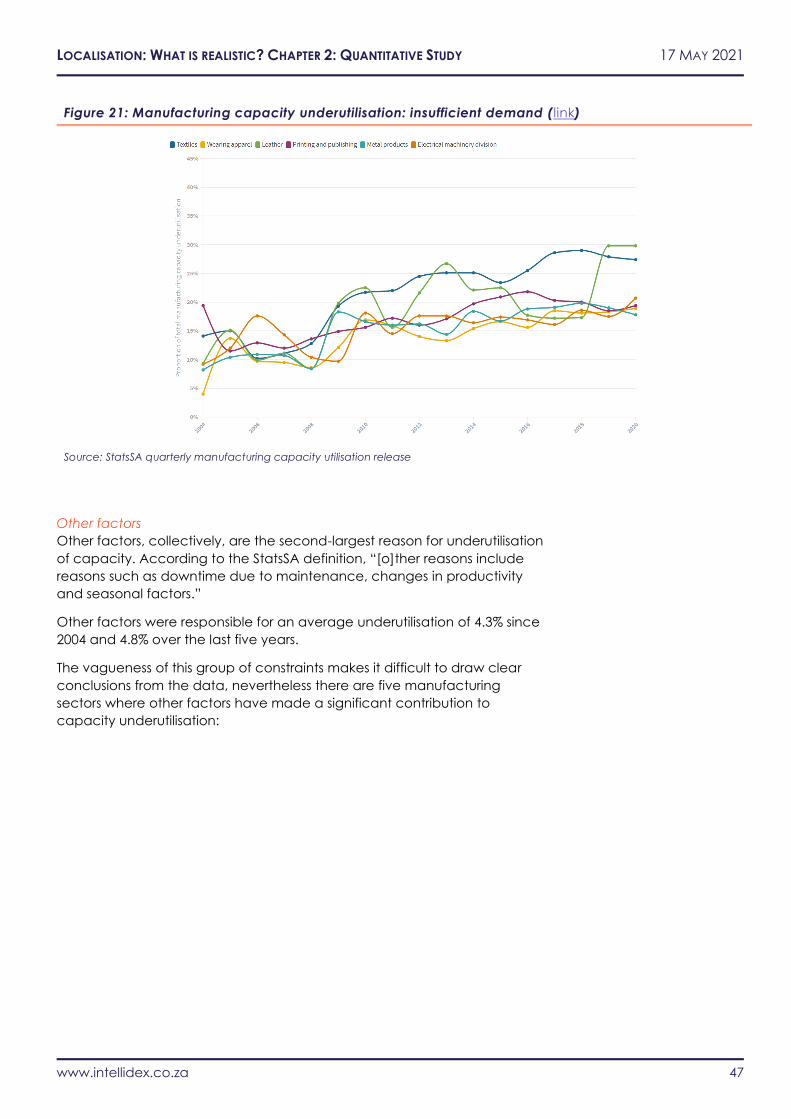
LOCALISATION: WHAT IS REALISTIC? CHAPTER 2: QUANTITATIVE STUDY 17 MAY 2021
www.intellidex.co.za 47
Figure 21: Manufacturing capacity underutilisation: insufficient demand ( link)
Source: StatsSA quarterly manufacturing capacity utilisation release
Other factors
Other factors, collectively, are the second-largest reason for underutilisation
of capacity. According to the StatsSA definition, “[o]ther reasons include
reasons such as downtime due to maintenance, changes in productivity
and seasonal factors.”
Other factors were responsible for an average underutilisation of 4.3% since
2004 and 4.8% over the last five years.
The vagueness of this group of constraints makes it difficult to draw clear
conclusions from the data, nevertheless there are five manufacturing
sectors where other factors have made a significant contribution to
capacity underutilisation:

LOCALISATION: WHAT IS REALISTIC? CHAPTER 2: QUANTITATIVE STUDY 17 MAY 2021
www.intellidex.co.za 48
Figure 22: Manufacturing capacity underutilisation: other factors (link)
Source: StatsSA quarterly manufacturing capacity utilisation release
Capacity underutilisation for the iron and steel sector has ranged from 2% to
14% since 2004. It reached a seven-year high of 8.6% in 2020.
Underutilisation in the paper and paper products sector has been in a tight
band of 5.1% and 6.5% since 2012. There is a concern that this trend
represents a structural problem, although the exact constraint is not clear.
In the basic precious and non-ferrous metal products sector, underutilisation
has been volatile, with a low of 0.3% in 2010 to highs of 9.2% in 2012 and
2015. It was at 4.2% in 2020.
Underutilisation in the non-metallic mineral products sector peaked at
11.6% in 2012 but has been trending downward since, falling to a 14-year
low of 3.9% in 2020.
Other constraints
Electricity supply
From 2008 to 2012, electricity prices more than doubled. Now in 2021,
electricity costs four times more than it did at the beginning of 2008, with a
further increase of 15% to come from April 2021.
The quadrupling of prices in just 13 years has led to significantly higher input
costs for electricity-intensive sectors. According to StatsSA’s Supply-Use
tables for 2014-2016, the most electricity-intensive sectors (electricity input
costs as a percentage of total input costs) are:
LOCALISATION: WHAT IS REALISTIC? CHAPTER 2: QUANTITATIVE STUDY 17 MAY 2021
www.intellidex.co.za 49
- Mining of gold and uranium ore (29.9% of total input costs)
- Nuclear fuel and basic chemicals (9.2%)
- Glass (4.9%)
- Other chemical products and man-made fibres (4.3%)
- Agriculture (3.6%)
- Mining of metal ores (3.0%)
Most of electricity-intensive sectors are primary producers and important
inputs for other sectors. The basic chemicals, textiles, agriculture, and
mining (of metal ores) sectors feed into many other sectors, including other
chemicals, clothing, rubber, plastics, leather, iron and steel, and metal
products sectors.
The shortage of electricity is the biggest threat to South Africa’s industrial
policy goals over the long term. The entire supply chains of the iron and
steel, textiles and clothing, and chemicals sectors are under threat unless
South Africa can establish a reliable and growing supply of generating
capacity.
Port, rail and freight capacity
Long-term underinvestment in transport and logistics capacity has created
bottlenecks that limit growth in exports and imports. In cases where sectoral
growth depends on the supply of critical inputs (eg, imports of metals and
plastics for the machinery and equipment sectors), this acts as a brake on
the growth of local production in key manufacturing sectors.
Bureaucratic capacity and co-ordination
Certain sectors have high regulatory hurdles to overcome before output
can be increased. For example, the chemicals sector has legislation on the
prohibition and control of operations involving hazardous substances. The
relevant laws include the National Environmental Management Act; the
Hazardous Substances Act; and the Occupational Health and Safety Act.
Labour legislation and the (sometimes competing) interests of the
Department of Labour may delay or even prohibit the creation of
development zones that would otherwise benefit from cheaper labour.
South Africa’s relatively high labour costs (compared with countries such as
Vietnam and Bangladesh) make it difficult to increase production in labour-
intensive sectors such as textiles, clothing, leather, footwear and furniture.
The overall bureaucratic confusion and lack of co-ordination between
departments may be the biggest challenge to expansion and growth in
underperforming sectors. Evidence from Asian countries and successful
industrialisation cases in the rest of Africa (e.g., the cut flower industry in
Ethiopia) point to the need for political champions of industrial policy. These
champions often come from the highest echelons of political office and
can mean the difference between successful or unsuccessful sectoral
growth strategies.
LOCALISATION: WHAT IS REALISTIC? CHAPTER 2: QUANTITATIVE STUDY 17 MAY 2021
www.intellidex.co.za 50
Modelling capacity constraints and supply growth for
selected sectors
Methodology
Historical output and export growth for key sectors
Manufacturing output growth has been weak since 2005 and particularly
poor since 2015. Only two of the 10 main manufacturing divisions (food and
beverages, and petroleum, chemical products, rubber and plastic
products) have seen positive growth over the last 15 years and only food
and beverages has expanded in the last five years.
At the disaggregated level (equivalent to the level 4 / 4-digit SIC code
classification) there are a handful of industries not in the food and
beverages division that have grown consistently and posted positive growth
over the last five years:
- Glass and glass products has grown by a cumulative 1% over
the last five years
- Accumulators, primary cells and primary batteries: 6.5%
- Bodies for motor vehicles, trailers and semi-trailers: 1.2% over
the last five years.
These are cumulative growth figures; the equivalent annual growth ranges
from 0.2 to 1.3%. This is insufficient to keep pace with the growth of imports
in these sectors.
Output growth over a 10- or 15-year horizon is better in almost every case
but the trends of the last five years are more relevant. They speak to the
prevailing macroeconomic and other structural problems in South Africa.
These include: falling rates of capital formation; a weak rand; a continuing
trend of deindustrialisation; high electricity prices; and a weak bureaucracy.
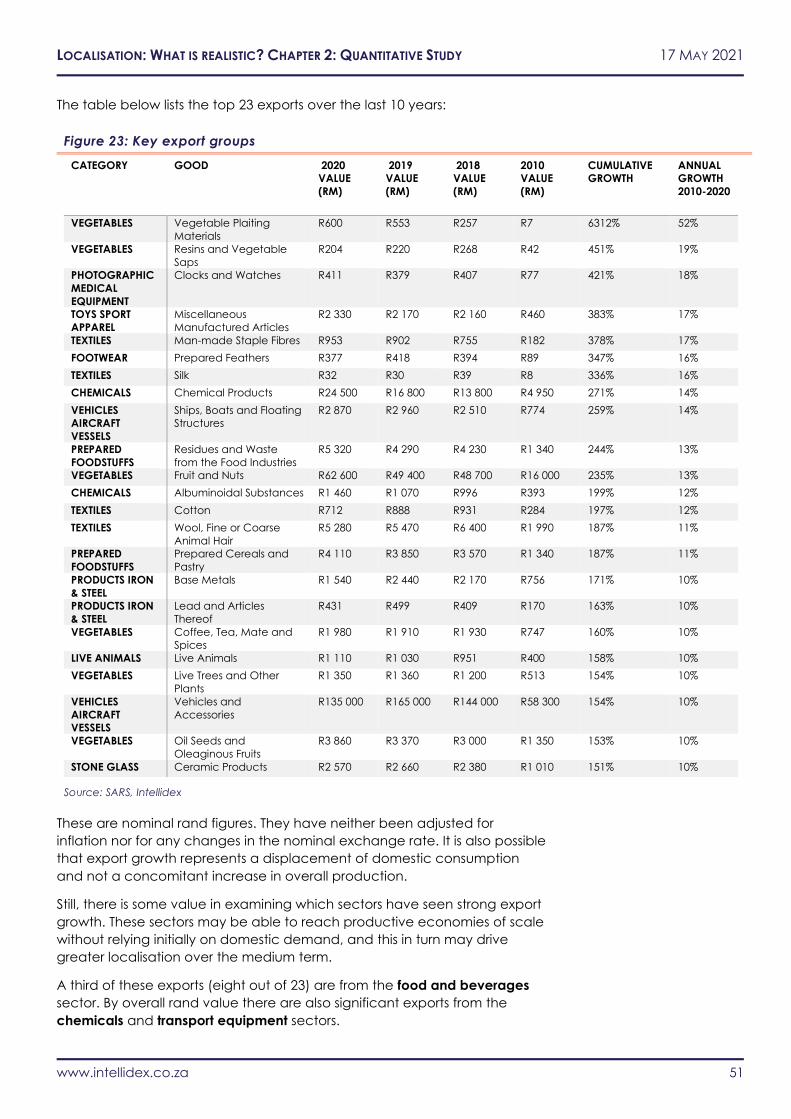
LOCALISATION: WHAT IS REALISTIC? CHAPTER 2: QUANTITATIVE STUDY 17 MAY 2021
www.intellidex.co.za 51
The table below lists the top 23 exports over the last 10 years:
Figure 23: Key export groups
CATEGORY GOOD 2020
VALUE
(RM)
2019
VALUE
(RM)
2018
VALUE
(RM)
2010
VALUE
(RM)
CUMULATIVE
GROWTH
ANNUAL
GROWTH
2010-2020
VEGETABLES Vegetable Plaiting
Materials
R600 R553 R257 R7 6312% 52%
VEGETABLES Resins and Vegetable
Saps
R204 R220 R268 R42 451% 19%
PHOTOGRAPHIC
MEDICAL
EQUIPMENT
Clocks and Watches R411 R379 R407 R77 421% 18%
TOYS SPORT
APPAREL
Miscellaneous
Manufactured Articles
R2 330 R2 170 R2 160 R460 383% 17%
TEXTILES Man-made Staple Fibres R953 R902 R755 R182 378% 17%
FOOTWEAR Prepared Feathers R377 R418 R394 R89 347% 16%
TEXTILES Silk R32 R30 R39 R8 336% 16%
CHEMICALS Chemical Products R24 500 R16 800 R13 800 R4 950 271% 14%
VEHICLES
AIRCRAFT
VESSELS
Ships, Boats and Floating
Structures
R2 870 R2 960 R2 510 R774 259% 14%
PREPARED
FOODSTUFFS
Residues and Waste
from the Food Industries
R5 320 R4 290 R4 230 R1 340 244% 13%
VEGETABLES Fruit and Nuts R62 600 R49 400 R48 700 R16 000 235% 13%
CHEMICALS Albuminoidal Substances R1 460 R1 070 R996 R393 199% 12%
TEXTILES Cotton R712 R888 R931 R284 197% 12%
TEXTILES Wool, Fine or Coarse
Animal Hair
R5 280 R5 470 R6 400 R1 990 187% 11%
PREPARED
FOODSTUFFS
Prepared Cereals and
Pastry
R4 110 R3 850 R3 570 R1 340 187% 11%
PRODUCTS IRON
& STEEL
Base Metals R1 540 R2 440 R2 170 R756 171% 10%
PRODUCTS IRON
& STEEL
Lead and Articles
Thereof
R431 R499 R409 R170 163% 10%
VEGETABLES Coffee, Tea, Mate and
Spices
R1 980 R1 910 R1 930 R747 160% 10%
LIVE ANIMALS Live Animals R1 110 R1 030 R951 R400 158% 10%
VEGETABLES Live Trees and Other
Plants
R1 350 R1 360 R1 200 R513 154% 10%
VEHICLES
AIRCRAFT
VESSELS
Vehicles and
Accessories
R135 000 R165 000 R144 000 R58 300 154% 10%
VEGETABLES Oil Seeds and
Oleaginous Fruits
R3 860 R3 370 R3 000 R1 350 153% 10%
STONE GLASS Ceramic Products R2 570 R2 660 R2 380 R1 010 151% 10%
Source: SARS, Intellidex
These are nominal rand figures. They have neither been adjusted for
inflation nor for any changes in the nominal exchange rate. It is also possible
that export growth represents a displacement of domestic consumption
and not a concomitant increase in overall production.
Still, there is some value in examining which sectors have seen strong export
growth. These sectors may be able to reach productive economies of scale
without relying initially on domestic demand, and this in turn may drive
greater localisation over the medium term.
A third of these exports (eight out of 23) are from the food and beverages
sector. By overall rand value there are also significant exports from the
chemicals and transport equipment sectors.
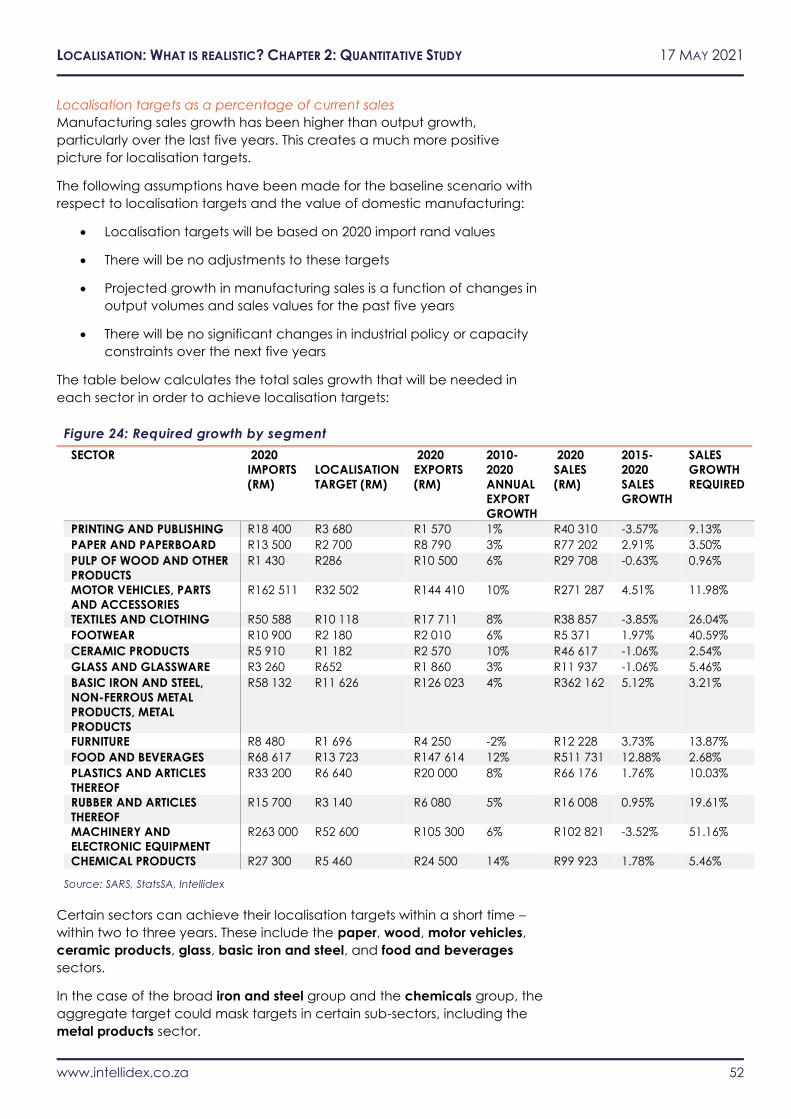
LOCALISATION: WHAT IS REALISTIC? CHAPTER 2: QUANTITATIVE STUDY 17 MAY 2021
www.intellidex.co.za 52
Localisation targets as a percentage of current sales
Manufacturing sales growth has been higher than output growth,
particularly over the last five years. This creates a much more positive
picture for localisation targets.
The following assumptions have been made for the baseline scenario with
respect to localisation targets and the value of domestic manufacturing:
• Localisation targets will be based on 2020 import rand values
• There will be no adjustments to these targets
• Projected growth in manufacturing sales is a function of changes in
output volumes and sales values for the past five years
• There will be no significant changes in industrial policy or capacity
constraints over the next five years
The table below calculates the total sales growth that will be needed in
each sector in order to achieve localisation targets:
Figure 24: Required growth by segment
SECTOR 2020
IMPORTS
(RM)
LOCALISATION
TARGET (RM)
2020
EXPORTS
(RM)
2010-
2020
ANNUAL
EXPORT
GROWTH
2020
SALES
(RM)
2015-
2020
SALES
GROWTH
SALES
GROWTH
REQUIRED
PRINTING AND PUBLISHING R18 400 R3 680 R1 570 1% R40 310 -3.57% 9.13%
PAPER AND PAPERBOARD R13 500 R2 700 R8 790 3% R77 202 2.91% 3.50%
PULP OF WOOD AND OTHER
PRODUCTS
R1 430 R286 R10 500 6% R29 708 -0.63% 0.96%
MOTOR VEHICLES, PARTS
AND ACCESSORIES
R162 511 R32 502 R144 410 10% R271 287 4.51% 11.98%
TEXTILES AND CLOTHING R50 588 R10 118 R17 711 8% R38 857 -3.85% 26.04%
FOOTWEAR R10 900 R2 180 R2 010 6% R5 371 1.97% 40.59%
CERAMIC PRODUCTS R5 910 R1 182 R2 570 10% R46 617 -1.06% 2.54%
GLASS AND GLASSWARE R3 260 R652 R1 860 3% R11 937 -1.06% 5.46%
BASIC IRON AND STEEL,
NON-FERROUS METAL
PRODUCTS, METAL
PRODUCTS
R58 132 R11 626 R126 023 4% R362 162 5.12% 3.21%
FURNITURE R8 480 R1 696 R4 250 -2% R12 228 3.73% 13.87%
FOOD AND BEVERAGES R68 617 R13 723 R147 614 12% R511 731 12.88% 2.68%
PLASTICS AND ARTICLES
THEREOF
R33 200 R6 640 R20 000 8% R66 176 1.76% 10.03%
RUBBER AND ARTICLES
THEREOF
R15 700 R3 140 R6 080 5% R16 008 0.95% 19.61%
MACHINERY AND
ELECTRONIC EQUIPMENT
R263 000 R52 600 R105 300 6% R102 821 -3.52% 51.16%
CHEMICAL PRODUCTS R27 300 R5 460 R24 500 14% R99 923 1.78% 5.46%
Source: SARS, StatsSA, Intellidex
Certain sectors can achieve their localisation targets within a short time –
within two to three years. These include the paper, wood, motor vehicles,
ceramic products, glass, basic iron and steel, and food and beverages
sectors.
In the case of the broad iron and steel group and the chemicals group, the
aggregate target could mask targets in certain sub-sectors, including the
metal products sector.
LOCALISATION: WHAT IS REALISTIC? CHAPTER 2: QUANTITATIVE STUDY 17 MAY 2021
www.intellidex.co.za 53
The 2020 manufacturing output in the basic iron and steel, non-ferrous
metal products, metal products and machinery (level 2 SIC) grouping was
R477 billion. The basic iron and steel products and non-ferrous metals
products subsectors contributed R260 billion to the grouping, 55% of the
total. The downstream subsectors in this grouping (including the metal
products and machinery subsectors) are smaller in value but arguably more
important for the success of long-term localisation and supply-chain
integration.
Some sectors will be able to achieve their targets over the medium term,
within five to eight years. These include the furniture and plastics sectors.
Other sectors will find it hard to achieve their localisation targets, even over
the medium term (five to 10 years). These include the printing and
publishing, textiles, clothing, footwear, rubber, and machinery and
electronic equipment sectors.
Current and future constraints on output
Weak domestic demand is the biggest constraint to localisation. This
suggests that certain manufacturing sectors will have to pursue a two-
pronged approach of increased production and the development of new
export markets in order to achieve their localisation goals.
A constrained electricity supply is a significant threat to the medium-term
growth of key industries, including the iron and steel, metal products, and
basic chemicals industries.
The protection of the iron and steel sector through high import tariffs and the
political prioritisation of a domestic producer is a major constraint on the
growth of downstream industries, including the metal products, machinery
and equipment sectors.
A lack of bureaucratic capacity and the lower prioritisation of a clear
industrial policy (including political backing at the highest level) could
prevent struggling sectors (textiles and clothing) from reversing years of
decline and/or achieving economies of scale through new export markets.
Iron and steel / Basic metals
The iron and steel sector is likely to meet its localisation targets within two
years, based on the size of the sector and the historical growth in sales.
Certain sub-sectors (such as zinc, tin, and certain metal products) may not
meet localisation targets in the medium term, or at all. However, these sub-
sectors make up a small percentage of the sector’s total value.
The long-term trajectory of this sector has direct implications for localisation
in downstream sectors (including metal products and machinery).
Machinery and equipment
This sector faces significant structural challenges. Many of the products that
are imported (cellphones, computers, precision equipment) will be difficult
to manufacture locally.
The localisation constraints include: a shortage of skilled labour and
technological transfer; limits on inputs (including metal products, plastics
and chemicals); and currency volatility.
LOCALISATION: WHAT IS REALISTIC? CHAPTER 2: QUANTITATIVE STUDY 17 MAY 2021
www.intellidex.co.za 54
Meeting the 20% targets would mean effective growth of over 72% in the
value of domestic production. This contrasts with an average annual
contraction in domestic sales of 3.5% over the last five years.
The sector will not meet its localisation targets over the medium term.
Certain targeted industries within the sector may meet localisation targets
but this requires more research and focus.
Food and beverages
This sector is the biggest manufacturing success story of the democratic era.
It has seen average export growth of 12% since 2010 and sales growth of
13% since 2015.
The sector requires growth of less than 3% to meet its localisation targets
and will almost certainly meet its targets within one year.
Policymakers can maximise the success of localisation in this sector by
ensuring that growth is broad-based across most (if not all) sub-sectors and
is focused on high-value products (ie, processed and niche agricultural
products).
Basic chemicals
The basic chemicals sector requires growth of 11.9% to meet its localisation
targets. Average annual growth in the sector has been 1.8% over the last
five years. The sector will not meet its localisation targets in the next five
years without targeted interventions and a removal of structural constraints
such as logistics bottlenecks.
Risks to localisation include a shortage of raw materials and a lack of
domestic demand. On a disaggregated level, it will be difficult to meet
localisation targets for pharmaceutical products, cosmetics and toiletries.
Motor vehicles, parts and accessories
The sector requires sales growth of 12% to meet its localisation targets while
average growth has been 4.5% over the last five years. It is likely to meet its
targets in the next three years.
Much depends on the recovery of local demand which fell sharply in 2019
and 2020.
Textiles and clothing
The sector requires sales growth of 24% to meet localisation targets. Sales
have shrunk by an average of 3.9% over the last five years.
The sector has experienced a long-term decline since 1994 and is unlikely to
meet localisation targets even over the next 10 years without a targeted
and coordinated sectoral strategy. The new master plan, which includes
the retail sector in the value chain, needs the support and buy-in of the
retail sector to succeed.
High labour costs, a shortage of inputs, weak domestic demand and a
volatile rand all post significant threats to localisation.
LOCALISATION: WHAT IS REALISTIC? CHAPTER 2: QUANTITATIVE STUDY 17 MAY 2021
www.intellidex.co.za 55
Recommended localisation path
and expected timeframe The motor vehicles, food and beverages, basic iron and steel and paper
products sectors are likely to meet localisation targets within the next five
years, if not three. These sectors have experienced healthy growth over the
last five years and are large and established.
Policymakers should focus on sub-sectors which are underperforming and
target these for growth.
There should be a special focus on the iron and steel sector which has
come under criticism for its high prices and monopolistic practices. There
are negative implications for downstream sectors, such as metal products, if
prices are not reduced.
There is an opportunity to push for greater supply chain integration since
there is less pressure on the sector to meet its targets. The industry is awaiting
the finalisation of the steel industry master plan. The draft was released in
October 2020
The chemical products, rubber and plastic products sectors may only meet
their targets over a 10-year period, and they will need particular focus if
localisation targets are to be met. Policymakers should look at the
disaggregated picture to see where there are weak supply chains and
infrastructure bottlenecks. It may be that certain sub-sectors can be
targeted for growth: the chemical products sector can meet localisation
targets within five years if it is properly enabled. The rubber products sector
will need help if it is to meet localisation targets within 10 years.
The textiles and clothing and printing and publishing sectors are likely to
miss their localisation targets. These sectors have experienced a long-term
decline in output. Focus in these sectors should be on preserving jobs and
stabilising employment and output.
The retail-clothing, textile, footwear & leather (R-CTFL) master plan is
targeting a 50% increase in employment and domestic output between
2020 and 2030. The buy-in and support of the retail sector is critical for the
success of the master plan.
The greatest concern is in the machinery and electronic equipment sector
which would need to grow by over 70% to meet its targets, compared with
an annual decline in output value of 3.5%. There is no clear path to
achieving localisation targets in this sector.
One preliminary approach may be to exclude those industries where South
Africa has little to know chance of localisation success, such as the cell-
phone industry. Imports of cell-phones are over R15 billion per year,
equivalent to a localisation target of at least R3 billion. If policy-makers
concentrate on a sub-group of this sector they are likely to set more realistic
localisation targets and to have a higher probability of success.
LOCALISATION: WHAT IS REALISTIC? CHAPTER 3: VIEWS OF INDIVIDUAL BUSINESSES 17 MAY 2021
www.intellidex.co.za 56
Chapter 3: Localisation views
of individual businesses Survey Results
We wanted to get the views of individual businesses within the BUSA and
BLSA membership orbits – to see what an on-the-ground assessment would
be of the ability to localise, the implications and potholes. Our survey of 125
companies showed a strong desire and willingness to localise but “usual
suspect” constraints were holding things back, while there’s concern over
the cost implications of moving too fast. In summary we found the following:
• A broad majority of firms are negative on current localisation policy
but are positive about the aims and commitments of future policy.
• Capacity onshore and price are the top ranked blockages for
companies buying more onshore. Technology availability and
government policies also featured as a concern.
• Businesses thought that government did not understand well the
challenges of trying to localise or the costs involved.
• Goods-producing companies thought they could undertake
substitution of 12.6% of import “right away” under the right
conditions. This rose to 32.3% of imports substituted after five years.
Service-producing companies only saw possible substitution of 5.5%
of imported inputs right away under the right conditions, rising slowly
then to 11.6% after five years.
We have seen what the literature has had to say and have dug into the
data and had a quantitative look at the ability to undertake localisation –
but what do South African businesses actually think? Given the complexity
of the issue, this is crucial. The data can only tell us so much about supply
chains and future change, given the political economy and sentiment-
related issues that stem from policy issues like this.
Methodology We conducted a survey of BLSA and BUSA member firms. Given that BUSA is
mainly a collection of industry organisations, the survey was forwarded by
them to their individual member companies themselves. The survey was
distributed widely within these structures and substructures.
The online survey ran for three weeks during February 2021. We asked
companies to ensure that the questionnaire be completed by the most
senior person who had the most knowledge of the firm’s supply chain
management and import content. Companies self-selected to respond to
the survey. Several reminders were sent through BLSA and BUSA structures
but individual companies themselves were not chased by us.
Most questions were optional except for sectoral identification and import
content questions. Apart from totally blank responses outside of the
required questions, generally we found a high rate of response to all
questions. We removed those that responded only to the required
questions.
LOCALISATION: WHAT IS REALISTIC? CHAPTER 3: VIEWS OF INDIVIDUAL BUSINESSES 17 MAY 2021
www.intellidex.co.za 57
The responses were then screened for possible duplicates from the same
companies by three methods. The first was where the same company was
clearly evident in email addresses or companies given – we found two pairs
and included only the response from the most senior person.
Then we screened via IP addresses and sector. We found five pairs and one
triple. In all cases we found the most senior respondent had answered the
most questions and took these into our sample.
There were 154 total responses. We had 125 clean responses after removing
(non-required questions) blanks (22 removed) and duplicates (seven
removed).
The survey was anonymous – respondents did not have to leave their
contact details or company name. However, the option did exist. While
respecting anonymity, we were pleased to see we had a very strong cross-
section of the largest companies and importers as well good SMME
representation. As we can see below, we also had a good cross section of
firm sizes.
In analysing the results, we use both raw averages across the sample and a
weighting system. Given that it is not possible (in any easy way at least) to
define what each sector in the economy imports in total, (because while
imports are broken down by item codes that correspond to some sectors by
name, sectors will import a variety of different item codes),so it is difficult to
define sectoral import weights. We therefore weight sectors by GDP. We use
2019 nominal GDP weights. This is not perfect, but we do not believe there is
a more reliable or robust way of defining such weightings.
While this larger study on localisation is about goods imports substitution,
clearly both goods-related sector companies and service-producing
companies import goods. The import intensity (as a share of output in real or
nominal terms) will however be very different. As such we split the sample
into service-producing companies and goods-producing companies (108
responses – manufacturing etc).
Note that the ICT sector falls awkwardly between these two categories.
Some ICT companies are purely service providers while others have to
import electronics, parts, etc. We have decided to include them in service-
producing companies on closer inspection of the respondents. Health
companies are also problematic. We decided, looking at their import
intensity, to include them with goods-producing companies, but they also
could fall into either. We therefore have 17 services responses overall.
Some results were manually altered where, for instance, the “other” field
saw free text added that was clearly one of the existing categories. Sector
selection allowed people to select multiple sectors and a small number did.
Most of these also provided their company and these were then manually
allocated to just one sector. A number of companies wrote in
”infrastructure” or “energy” which we have pulled out into a separate
category from what might otherwise be put into “construction”.
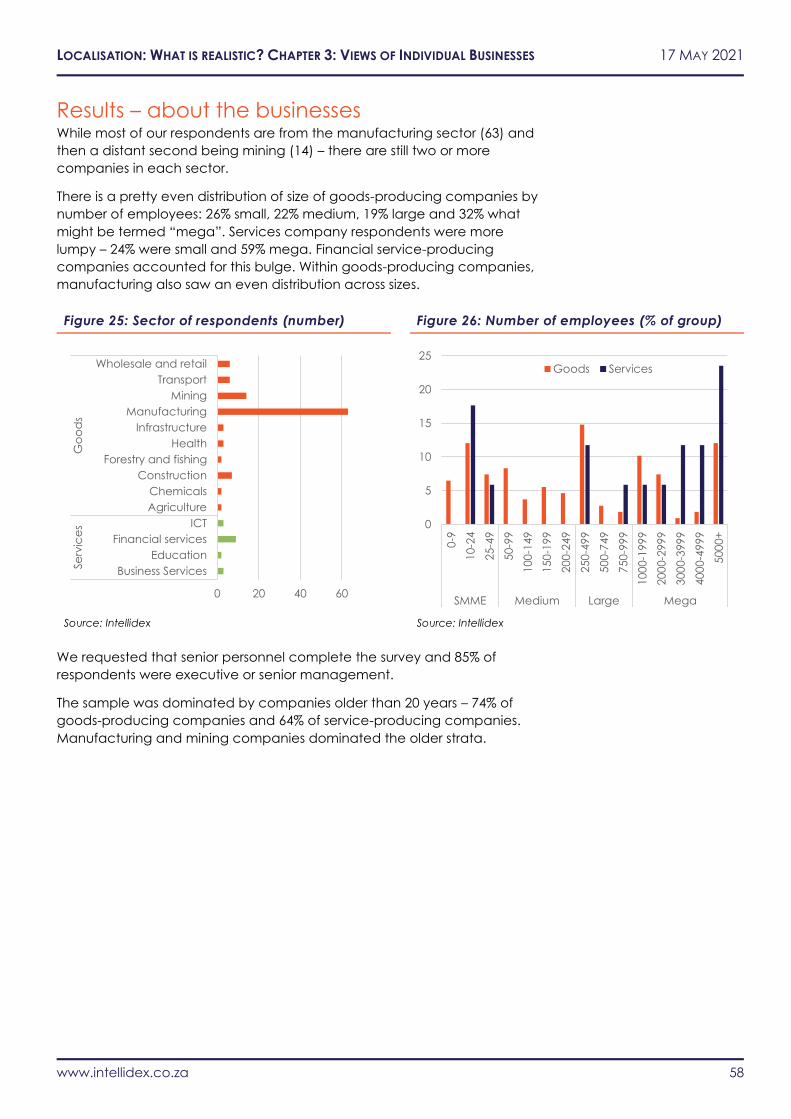
LOCALISATION: WHAT IS REALISTIC? CHAPTER 3: VIEWS OF INDIVIDUAL BUSINESSES 17 MAY 2021
www.intellidex.co.za 58
Results – about the businesses While most of our respondents are from the manufacturing sector (63) and
then a distant second being mining (14) – there are still two or more
companies in each sector.
There is a pretty even distribution of size of goods-producing companies by
number of employees: 26% small, 22% medium, 19% large and 32% what
might be termed “mega”. Services company respondents were more
lumpy – 24% were small and 59% mega. Financial service-producing
companies accounted for this bulge. Within goods-producing companies,
manufacturing also saw an even distribution across sizes.
Figure 25: Sector of respondents (number) Figure 26: Number of employees (% of group)
Source: Intellidex Source: Intellidex
We requested that senior personnel complete the survey and 85% of
respondents were executive or senior management.
The sample was dominated by companies older than 20 years – 74% of
goods-producing companies and 64% of service-producing companies.
Manufacturing and mining companies dominated the older strata.
0 20 40 60
Business Services
Education
Financial services
ICT
Agriculture
Chemicals
Construction
Forestry and fishing
Health
Infrastructure
Manufacturing
Mining
Transport
Wholesale and retail
Se
rvic
es
Go
od
s
0
5
10
15
20
25
0-9
10-2
4
25-4
9
50-9
9
100
-14
9
150
-19
9
200
-24
9
250
-49
9
500
-74
9
750
-99
9
100
0-1
99
9
200
0-2
99
9
300
0-3
99
9
400
0-4
99
9
500
0+
SMME Medium Large Mega
Goods Services
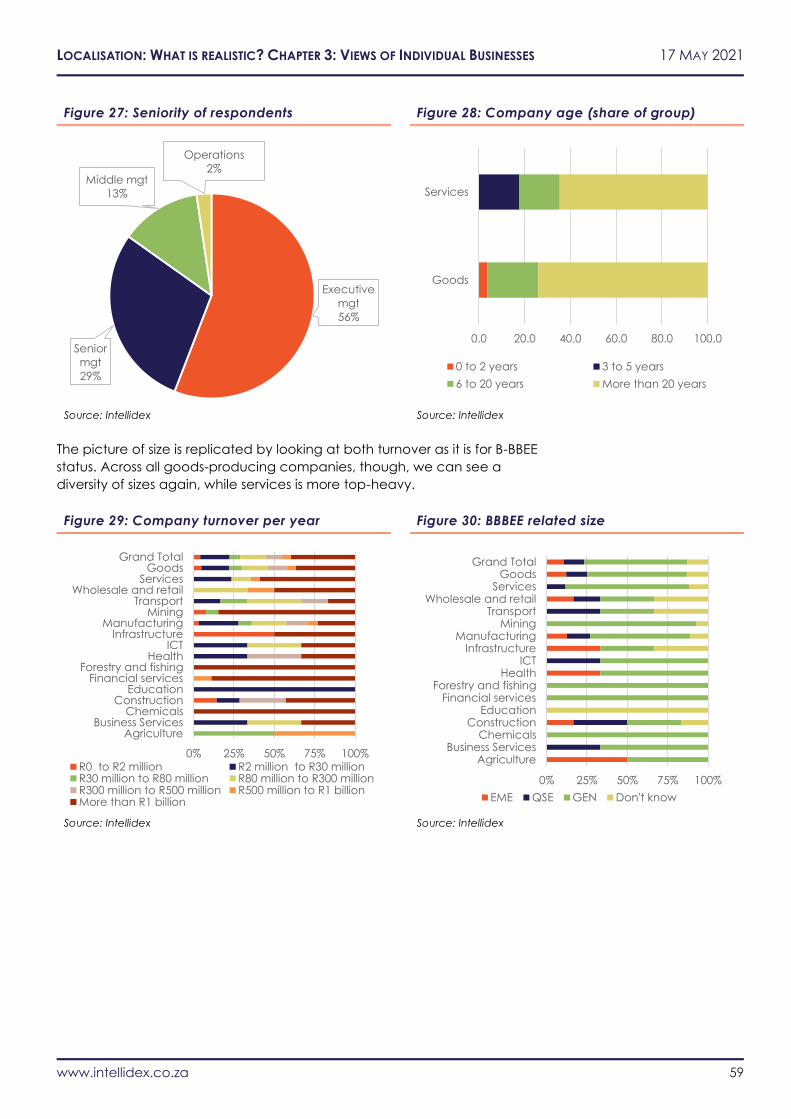
LOCALISATION: WHAT IS REALISTIC? CHAPTER 3: VIEWS OF INDIVIDUAL BUSINESSES 17 MAY 2021
www.intellidex.co.za 59
Figure 27: Seniority of respondents Figure 28: Company age (share of group)
Source: Intellidex Source: Intellidex
The picture of size is replicated by looking at both turnover as it is for B-BBEE
status. Across all goods-producing companies, though, we can see a
diversity of sizes again, while services is more top-heavy.
Figure 29: Company turnover per year Figure 30: BBBEE related size
Source: Intellidex Source: Intellidex
Executive
mgt
56%
Senior
mgt
29%
Middle mgt
13%
Operations
2%
0.0 20.0 40.0 60.0 80.0 100.0
Goods
Services
0 to 2 years 3 to 5 years
6 to 20 years More than 20 years
0% 25% 50% 75% 100%
AgricultureBusiness Services
ChemicalsConstruction
EducationFinancial services
Forestry and fishingHealth
ICTInfrastructure
ManufacturingMining
TransportWholesale and retail
ServicesGoods
Grand Total
R0 to R2 million R2 million to R30 millionR30 million to R80 million R80 million to R300 millionR300 million to R500 million R500 million to R1 billionMore than R1 billion
0% 25% 50% 75% 100%
AgricultureBusiness Services
ChemicalsConstruction
EducationFinancial services
Forestry and fishingHealth
ICTInfrastructure
ManufacturingMining
TransportWholesale and retail
ServicesGoods
Grand Total
EME QSE GEN Don't know
LOCALISATION: WHAT IS REALISTIC? CHAPTER 3: VIEWS OF INDIVIDUAL BUSINESSES 17 MAY 2021
www.intellidex.co.za 60
Results – imports We asked1 companies what their current share of direct goods imports was
– ie, which they received themselves directly from offshore, as a proportion
of input costs. Note that we asked these questions related to goods imports
to the service-producing companies as well as the goods-producing
companies – given that the framing of the current localisation discussion is
about substitution of goods imports, not services imports. We also asked
what their ultimate goods import share was, when looking down through
their entire supply chain. The first part of the question is easy enough for
companies to answer and they will often hold data on this, but the second
is tricky – but still useful and informative, we believe. It is hard for companies
to estimate the share of imports of their onshore suppliers and their suppliers.
Chemicals and construction companies came out clearly on top, well
ahead of others. Service-producing companies were lowest but also,
interestingly, transport (which has a well-developed onshore manufacturing
base of course). Overall, service-producing companies were at roughly half
the direct imports of goods-producing companies (19% vs 33%) though the
gap was slightly closer on ultimate imports at 37% vs 58%.
Most sectors saw 10-15% of input costs not directly imported as being
ultimately imported. However, health, mining and ICT all stood out for
having much larger gaps, suggesting the possibility of onshore
intermediation between imports and the companies and one might
question (though it is beyond the scope of this study) what the value added
would be of that “bridge”.
This data will be important later when we look at import substitution
responses from companies – to gain a sense of share of input costs that can
be substituted.
This import data does roughly correspond with import intensity of headline
GDP, which is a useful check.
1 The questions were: “As accurately as you can, what share (of ZAR value)
of your total South African firm’s inputs of goods are imported directly?”;
and: “As accurately as you can, looking through local intermediaries you
buy from, what share (of ZAR value) of your South African firm’s total inputs
of goods are ultimately imported?”
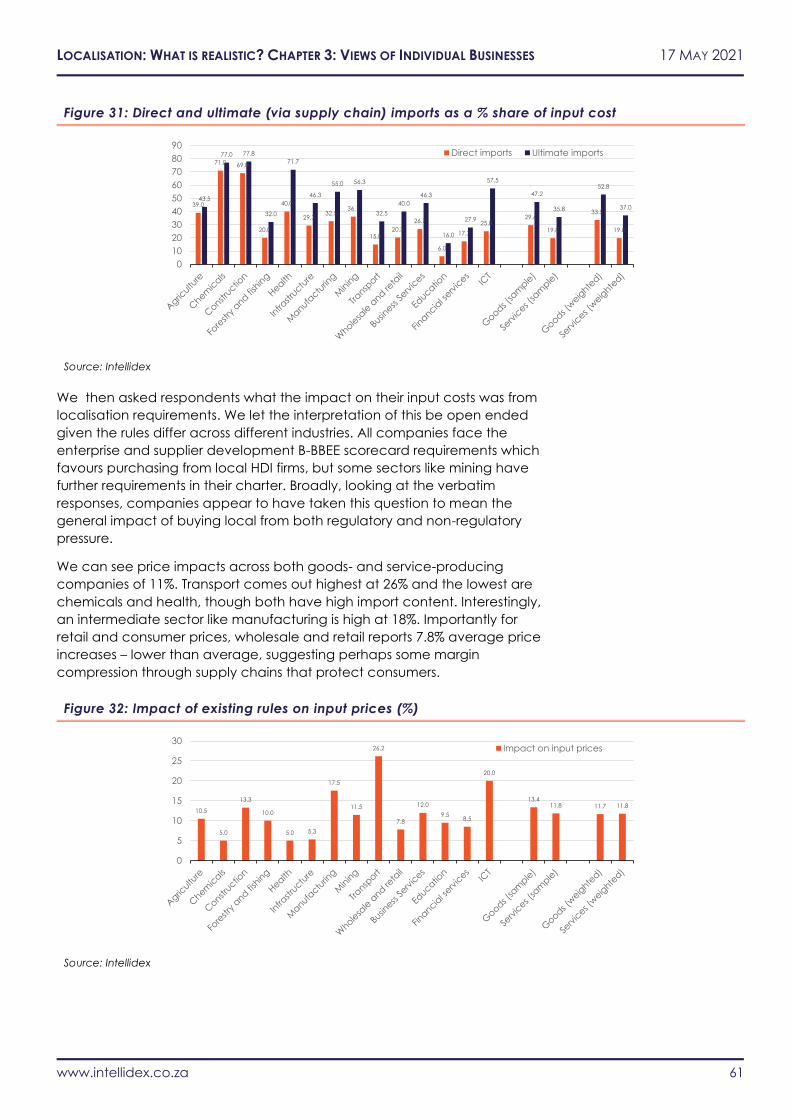
LOCALISATION: WHAT IS REALISTIC? CHAPTER 3: VIEWS OF INDIVIDUAL BUSINESSES 17 MAY 2021
www.intellidex.co.za 61
Figure 31: Direct and ultimate (via supply chain) imports as a % share of input cost
Source: Intellidex
We then asked respondents what the impact on their input costs was from
localisation requirements. We let the interpretation of this be open ended
given the rules differ across different industries. All companies face the
enterprise and supplier development B-BBEE scorecard requirements which
favours purchasing from local HDI firms, but some sectors like mining have
further requirements in their charter. Broadly, looking at the verbatim
responses, companies appear to have taken this question to mean the
general impact of buying local from both regulatory and non-regulatory
pressure.
We can see price impacts across both goods- and service-producing
companies of 11%. Transport comes out highest at 26% and the lowest are
chemicals and health, though both have high import content. Interestingly,
an intermediate sector like manufacturing is high at 18%. Importantly for
retail and consumer prices, wholesale and retail reports 7.8% average price
increases – lower than average, suggesting perhaps some margin
compression through supply chains that protect consumers.
Figure 32: Impact of existing rules on input prices (%)
Source: Intellidex
39.0
71.0 69.0
20.0
40.0
29.332.5
36.1
15.020.3
26.7
6.0
17.3
25.029.6
19.8
33.5
19.8
43.5
77.0 77.8
32.0
71.7
46.3
55.0 56.3
32.5
40.0
46.3
16.0
27.9
57.5
47.2
35.8
52.8
37.0
0
10
20
30
40
50
60
70
80
90Direct imports Ultimate imports
10.5
5.0
13.3
10.0
5.0 5.3
17.5
11.5
26.2
7.8
12.0
9.58.5
20.0
13.411.8 11.7 11.8
0
5
10
15
20
25
30Impact on input prices

LOCALISATION: WHAT IS REALISTIC? CHAPTER 3: VIEWS OF INDIVIDUAL BUSINESSES 17 MAY 2021
www.intellidex.co.za 62
To judge the price differential impact of localisation we can look at plotting
the price impact vs import content. For those with low import share and
high price impact like transport, but also a high-cost impact vs their import
share like construction, we can see that there is a high cost impact per unit
of domestic content. The following two figures show this. Construction
particularly stands out which could be due to the high cost of onshore raw
materials like cement, as well as import tariffs. This sees a 6% increase due to
local content rules for every 10% of local content. Manufacturing and
transport stand out for around a 4% increase in prices per 10% of local
content. On average for goods-producing companies, we see an increase
of 2.5% per 10pp of local rather than imported content.
Figure 33: Comparison of price impact vs share of input costs imported
Source: Intellidex Note: Label applies to direct imports – read directly to right for ultimate imports point for that sector
We should note these are NOT elasticities and need to be treated with
care. They are designed to show the context of price increases from local
content rules in relation to the size of non-imported goods (ie, local
content), not changes vs changes (which would be an elasticity).
We think it’s useful also to look at import content and price impact by firm
size. We find a poor correlation for change in input cost – though very large
companies do have the lowest price impact from local content rules which
may suggest pricing power. There is a weak negative correlation between
import share and direct inputs but this is stronger for ultimate inputs.
We might suppose some possible reasons for this are that firm size allows for
greater onshore supply chain enterprise development (required for larger
companies too in the B-BBEE scorecard), whereas these costs are too high
for smaller companies.
Agriculture
Chemicals
Construction
Forestry and fishing
HealthInfrastructure
Manufacturing
Mining
Transport
Wholesale and retail
Business Services
EducationFinancial services
ICT
Goods (weighted)Services (weighted)
0
5
10
15
20
25
30
0 10 20 30 40 50 60 70 80 90
Direct imports Ultimate imports
Import share
Price impact
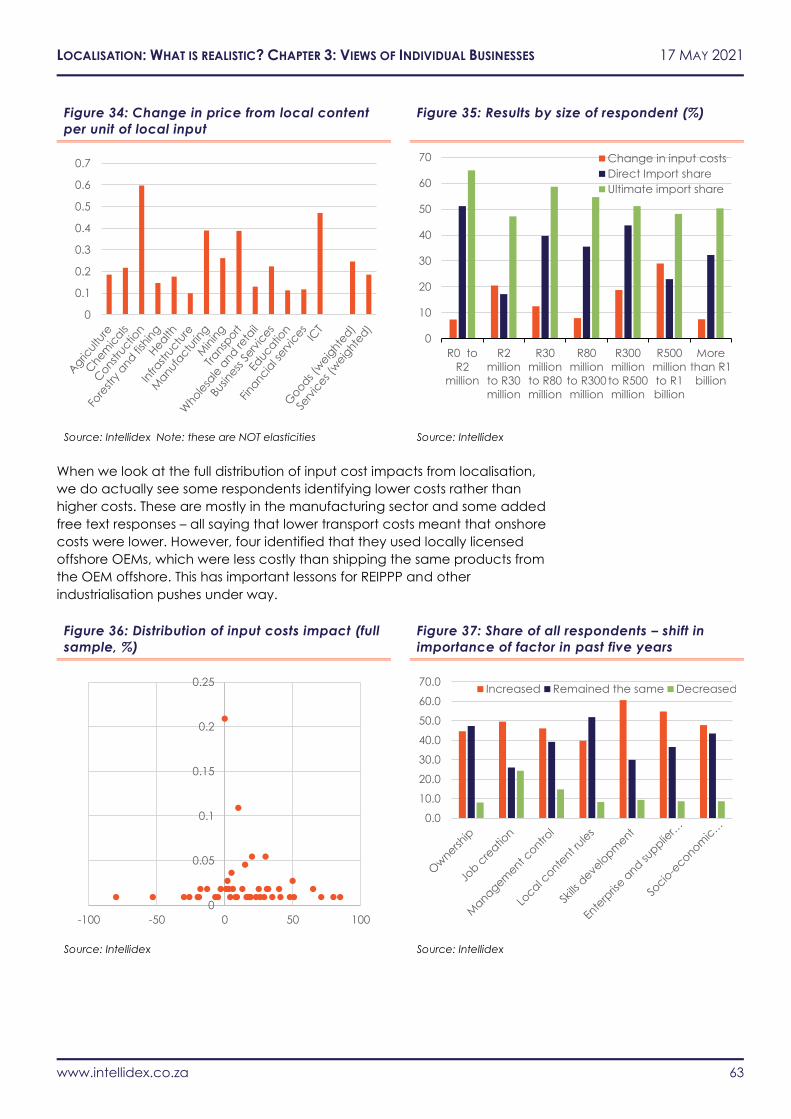
LOCALISATION: WHAT IS REALISTIC? CHAPTER 3: VIEWS OF INDIVIDUAL BUSINESSES 17 MAY 2021
www.intellidex.co.za 63
Figure 34: Change in price from local content
per unit of local input
Figure 35: Results by size of respondent (%)
Source: Intellidex Note: these are NOT elasticities Source: Intellidex
When we look at the full distribution of input cost impacts from localisation,
we do actually see some respondents identifying lower costs rather than
higher costs. These are mostly in the manufacturing sector and some added
free text responses – all saying that lower transport costs meant that onshore
costs were lower. However, four identified that they used locally licensed
offshore OEMs, which were less costly than shipping the same products from
the OEM offshore. This has important lessons for REIPPP and other
industrialisation pushes under way.
Figure 36: Distribution of input costs impact (full
sample, %)
Figure 37: Share of all respondents – shift in
importance of factor in past five years
Source: Intellidex Source: Intellidex
0
0.1
0.2
0.3
0.4
0.5
0.6
0.7
0
10
20
30
40
50
60
70
R0 to
R2
million
R2
million
to R30
million
R30
million
to R80
million
R80
million
to R300
million
R300
million
to R500
million
R500
million
to R1
billion
More
than R1
billion
Change in input costs
Direct Import share
Ultimate import share
0
0.05
0.1
0.15
0.2
0.25
-100 -50 0 50 100
0.0
10.0
20.0
30.0
40.0
50.0
60.0
70.0Increased Remained the same Decreased
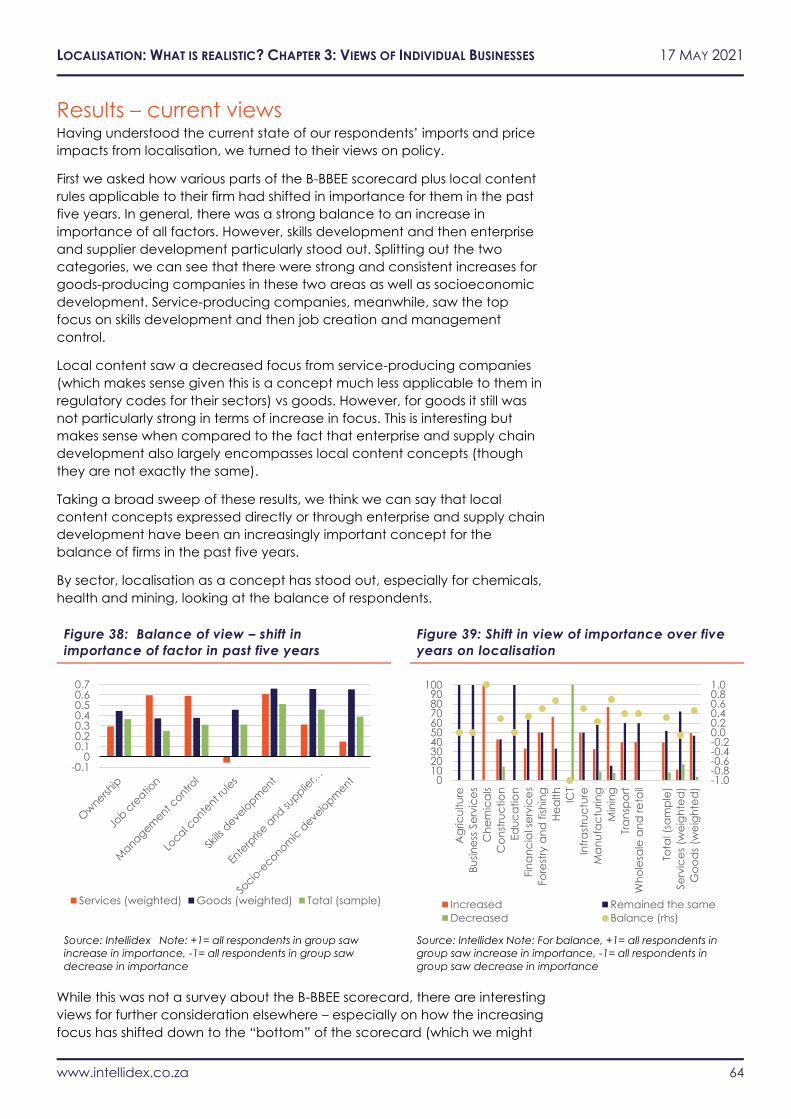
LOCALISATION: WHAT IS REALISTIC? CHAPTER 3: VIEWS OF INDIVIDUAL BUSINESSES 17 MAY 2021
www.intellidex.co.za 64
Results – current views Having understood the current state of our respondents’ imports and price
impacts from localisation, we turned to their views on policy.
First we asked how various parts of the B-BBEE scorecard plus local content
rules applicable to their firm had shifted in importance for them in the past
five years. In general, there was a strong balance to an increase in
importance of all factors. However, skills development and then enterprise
and supplier development particularly stood out. Splitting out the two
categories, we can see that there were strong and consistent increases for
goods-producing companies in these two areas as well as socioeconomic
development. Service-producing companies, meanwhile, saw the top
focus on skills development and then job creation and management
control.
Local content saw a decreased focus from service-producing companies
(which makes sense given this is a concept much less applicable to them in
regulatory codes for their sectors) vs goods. However, for goods it still was
not particularly strong in terms of increase in focus. This is interesting but
makes sense when compared to the fact that enterprise and supply chain
development also largely encompasses local content concepts (though
they are not exactly the same).
Taking a broad sweep of these results, we think we can say that local
content concepts expressed directly or through enterprise and supply chain
development have been an increasingly important concept for the
balance of firms in the past five years.
By sector, localisation as a concept has stood out, especially for chemicals,
health and mining, looking at the balance of respondents.
Figure 38: Balance of view – shift in
importance of factor in past five years
Figure 39: Shift in view of importance over five
years on localisation
Source: Intellidex Note: +1= all respondents in group saw
increase in importance, -1= all respondents in group saw
decrease in importance
Source: Intellidex Note: For balance, +1= all respondents in
group saw increase in importance, -1= all respondents in
group saw decrease in importance
While this was not a survey about the B-BBEE scorecard, there are interesting
views for further consideration elsewhere – especially on how the increasing
focus has shifted down to the “bottom” of the scorecard (which we might
-0.10
0.10.20.30.40.50.60.7
Services (weighted) Goods (weighted) Total (sample)
-1.0-0.8-0.6-0.4-0.20.00.20.40.60.81.0
0102030405060708090
100
Ag
ric
ultu
re
Bu
sin
ess
Se
rvic
es
Ch
em
ica
ls
Co
nst
ruc
tio
n
Ed
uc
atio
n
Fin
an
cia
l se
rvic
es
Fo
rest
ry a
nd
fis
hin
g
He
alth
ICT
Infr
ast
ruc
ture
Ma
nu
fac
turin
g
Min
ing
Tra
nsp
ort
Wh
ole
sale
an
d r
eta
il
Tota
l (sa
mp
le)
Se
rvic
es
(we
igh
ted
)
Go
od
s (w
eig
hte
d)
Increased Remained the same
Decreased Balance (rhs)
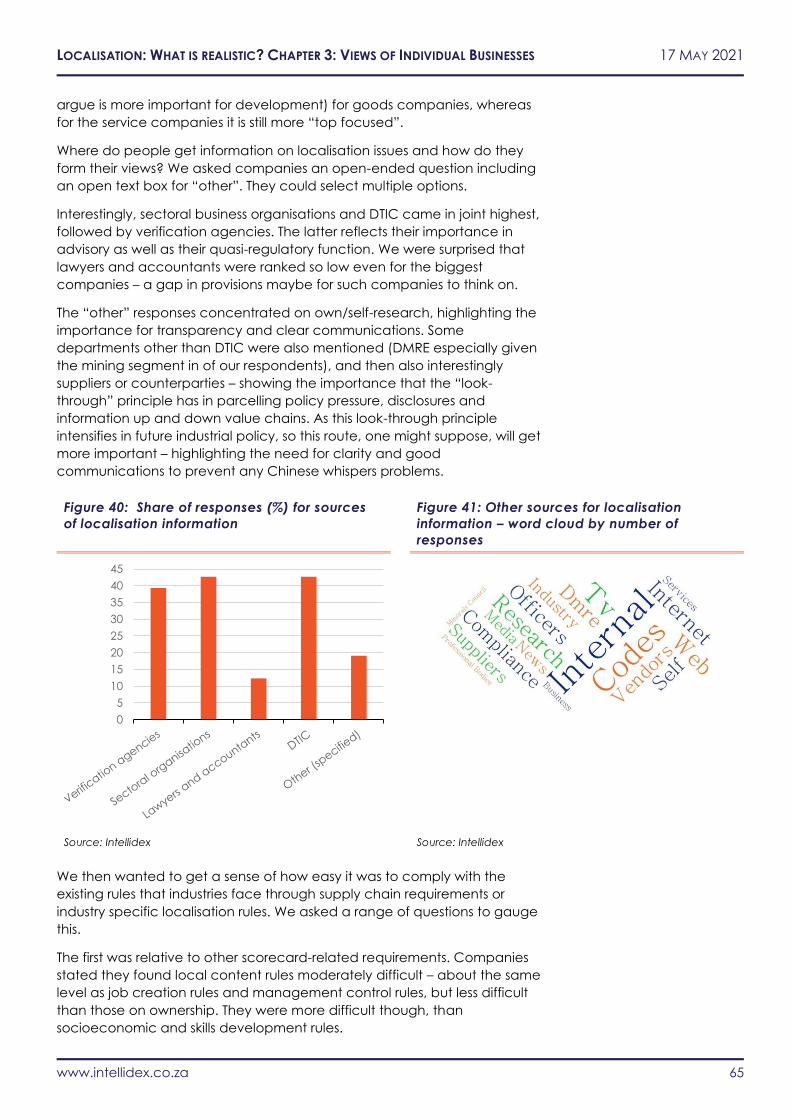
LOCALISATION: WHAT IS REALISTIC? CHAPTER 3: VIEWS OF INDIVIDUAL BUSINESSES 17 MAY 2021
www.intellidex.co.za 65
argue is more important for development) for goods companies, whereas
for the service companies it is still more “top focused”.
Where do people get information on localisation issues and how do they
form their views? We asked companies an open-ended question including
an open text box for “other”. They could select multiple options.
Interestingly, sectoral business organisations and DTIC came in joint highest,
followed by verification agencies. The latter reflects their importance in
advisory as well as their quasi-regulatory function. We were surprised that
lawyers and accountants were ranked so low even for the biggest
companies – a gap in provisions maybe for such companies to think on.
The “other” responses concentrated on own/self-research, highlighting the
importance for transparency and clear communications. Some
departments other than DTIC were also mentioned (DMRE especially given
the mining segment in of our respondents), and then also interestingly
suppliers or counterparties – showing the importance that the “look-
through” principle has in parcelling policy pressure, disclosures and
information up and down value chains. As this look-through principle
intensifies in future industrial policy, so this route, one might suppose, will get
more important – highlighting the need for clarity and good
communications to prevent any Chinese whispers problems.
Figure 40: Share of responses (%) for sources
of localisation information
Figure 41: Other sources for localisation
information – word cloud by number of
responses
Source: Intellidex Source: Intellidex
We then wanted to get a sense of how easy it was to comply with the
existing rules that industries face through supply chain requirements or
industry specific localisation rules. We asked a range of questions to gauge
this.
The first was relative to other scorecard-related requirements. Companies
stated they found local content rules moderately difficult – about the same
level as job creation rules and management control rules, but less difficult
than those on ownership. They were more difficult though, than
socioeconomic and skills development rules.
0
5
10
15
20
25
30
35
40
45
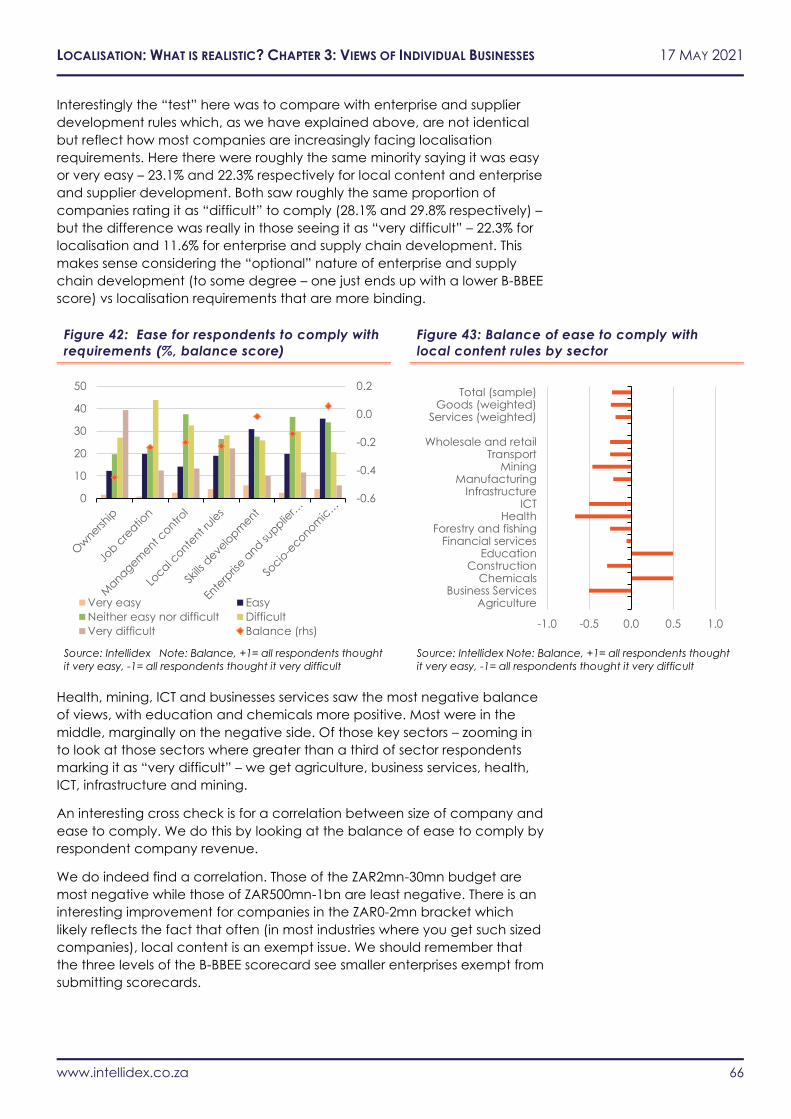
LOCALISATION: WHAT IS REALISTIC? CHAPTER 3: VIEWS OF INDIVIDUAL BUSINESSES 17 MAY 2021
www.intellidex.co.za 66
Interestingly the “test” here was to compare with enterprise and supplier
development rules which, as we have explained above, are not identical
but reflect how most companies are increasingly facing localisation
requirements. Here there were roughly the same minority saying it was easy
or very easy – 23.1% and 22.3% respectively for local content and enterprise
and supplier development. Both saw roughly the same proportion of
companies rating it as “difficult” to comply (28.1% and 29.8% respectively) –
but the difference was really in those seeing it as “very difficult” – 22.3% for
localisation and 11.6% for enterprise and supply chain development. This
makes sense considering the “optional” nature of enterprise and supply
chain development (to some degree – one just ends up with a lower B-BBEE
score) vs localisation requirements that are more binding.
Figure 42: Ease for respondents to comply with
requirements (%, balance score)
Figure 43: Balance of ease to comply with
local content rules by sector
Source: Intellidex Note: Balance, +1= all respondents thought
it very easy, -1= all respondents thought it very difficult Source: Intellidex Note: Balance, +1= all respondents thought
it very easy, -1= all respondents thought it very difficult
Health, mining, ICT and businesses services saw the most negative balance
of views, with education and chemicals more positive. Most were in the
middle, marginally on the negative side. Of those key sectors – zooming in
to look at those sectors where greater than a third of sector respondents
marking it as “very difficult” – we get agriculture, business services, health,
ICT, infrastructure and mining.
An interesting cross check is for a correlation between size of company and
ease to comply. We do this by looking at the balance of ease to comply by
respondent company revenue.
We do indeed find a correlation. Those of the ZAR2mn-30mn budget are
most negative while those of ZAR500mn-1bn are least negative. There is an
interesting improvement for companies in the ZAR0-2mn bracket which
likely reflects the fact that often (in most industries where you get such sized
companies), local content is an exempt issue. We should remember that
the three levels of the B-BBEE scorecard see smaller enterprises exempt from
submitting scorecards.
-0.6
-0.4
-0.2
0.0
0.2
0
10
20
30
40
50
Very easy Easy
Neither easy nor difficult Difficult
Very difficult Balance (rhs)-1.0 -0.5 0.0 0.5 1.0
AgricultureBusiness Services
ChemicalsConstruction
EducationFinancial services
Forestry and fishingHealth
ICTInfrastructure
ManufacturingMining
TransportWholesale and retail
Services (weighted)Goods (weighted)
Total (sample)
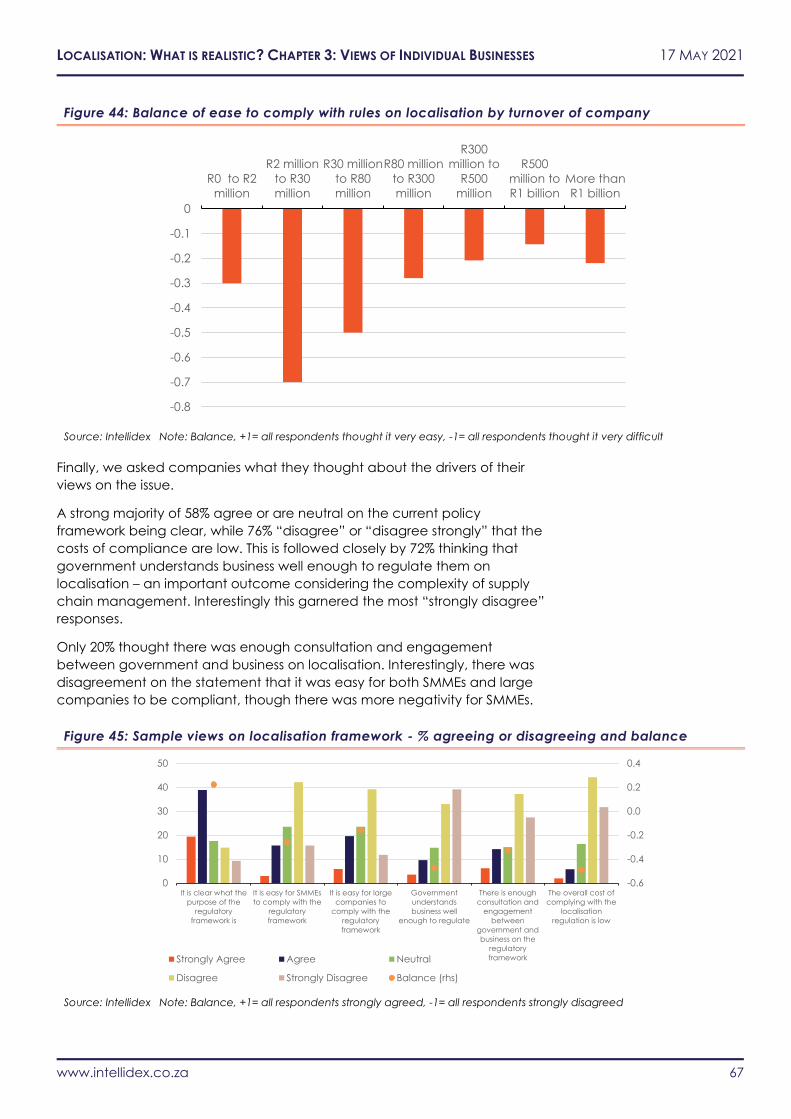
LOCALISATION: WHAT IS REALISTIC? CHAPTER 3: VIEWS OF INDIVIDUAL BUSINESSES 17 MAY 2021
www.intellidex.co.za 67
Figure 44: Balance of ease to comply with rules on localisation by turnover of company
Source: Intellidex Note: Balance, +1= all respondents thought it very easy, -1= all respondents thought it very difficult
Finally, we asked companies what they thought about the drivers of their
views on the issue.
A strong majority of 58% agree or are neutral on the current policy
framework being clear, while 76% “disagree” or “disagree strongly” that the
costs of compliance are low. This is followed closely by 72% thinking that
government understands business well enough to regulate them on
localisation – an important outcome considering the complexity of supply
chain management. Interestingly this garnered the most “strongly disagree”
responses.
Only 20% thought there was enough consultation and engagement
between government and business on localisation. Interestingly, there was
disagreement on the statement that it was easy for both SMMEs and large
companies to be compliant, though there was more negativity for SMMEs.
Figure 45: Sample views on localisation framework - % agreeing or disagreeing and balance
Source: Intellidex Note: Balance, +1= all respondents strongly agreed, -1= all respondents strongly disagreed
-0.8
-0.7
-0.6
-0.5
-0.4
-0.3
-0.2
-0.1
0
R0 to R2
million
R2 million
to R30
million
R30 million
to R80
million
R80 million
to R300
million
R300
million to
R500
million
R500
million to
R1 billion
More than
R1 billion
-0.6
-0.4
-0.2
0.0
0.2
0.4
0
10
20
30
40
50
It is clear what the
purpose of the
regulatory
framework is
It is easy for SMMEs
to comply with the
regulatory
framework
It is easy for large
companies to
comply with the
regulatory
framework
Government
understands
business well
enough to regulate
There is enough
consultation and
engagement
between
government and
business on the
regulatory
framework
The overall cost of
complying with the
localisation
regulation is low
Strongly Agree Agree Neutral
Disagree Strongly Disagree Balance (rhs)
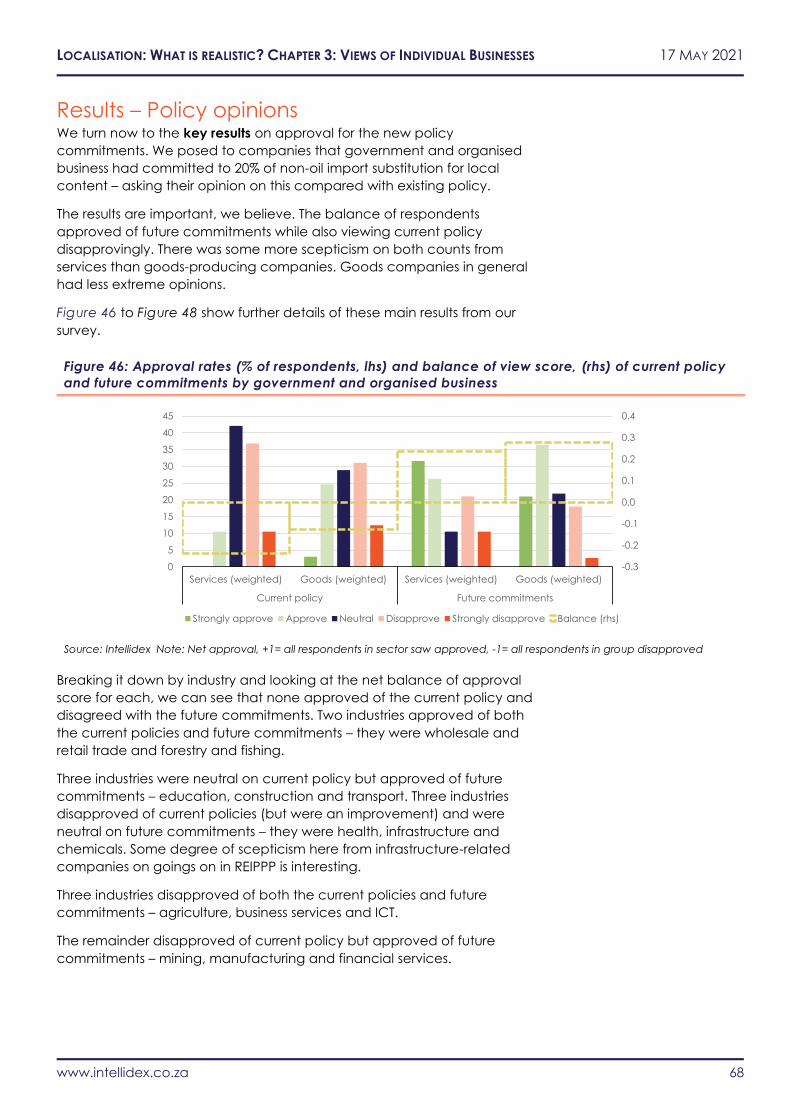
LOCALISATION: WHAT IS REALISTIC? CHAPTER 3: VIEWS OF INDIVIDUAL BUSINESSES 17 MAY 2021
www.intellidex.co.za 68
Results – Policy opinions We turn now to the key results on approval for the new policy
commitments. We posed to companies that government and organised
business had committed to 20% of non-oil import substitution for local
content – asking their opinion on this compared with existing policy.
The results are important, we believe. The balance of respondents
approved of future commitments while also viewing current policy
disapprovingly. There was some more scepticism on both counts from
services than goods-producing companies. Goods companies in general
had less extreme opinions.
Figure 46 to Figure 48 show further details of these main results from our
survey.
Figure 46: Approval rates (% of respondents, lhs) and balance of view score, (rhs) of current policy
and future commitments by government and organised business
Source: Intellidex Note: Net approval, +1= all respondents in sector saw approved, -1= all respondents in group disapproved
Breaking it down by industry and looking at the net balance of approval
score for each, we can see that none approved of the current policy and
disagreed with the future commitments. Two industries approved of both
the current policies and future commitments – they were wholesale and
retail trade and forestry and fishing.
Three industries were neutral on current policy but approved of future
commitments – education, construction and transport. Three industries
disapproved of current policies (but were an improvement) and were
neutral on future commitments – they were health, infrastructure and
chemicals. Some degree of scepticism here from infrastructure-related
companies on goings on in REIPPP is interesting.
Three industries disapproved of both the current policies and future
commitments – agriculture, business services and ICT.
The remainder disapproved of current policy but approved of future
commitments – mining, manufacturing and financial services.
-0.3
-0.2
-0.1
0.0
0.1
0.2
0.3
0.4
0
5
10
15
20
25
30
35
40
45
Services (weighted) Goods (weighted) Services (weighted) Goods (weighted)
Current policy Future commitments
Strongly approve Approve Neutral Disapprove Strongly disapprove Balance (rhs)

LOCALISATION: WHAT IS REALISTIC? CHAPTER 3: VIEWS OF INDIVIDUAL BUSINESSES 17 MAY 2021
www.intellidex.co.za 69
Figure 47: Net approval rates of current policy and future commitments by government and
organised business
Source: Intellidex Note: Net approval, +1= all respondents in sector saw approved, -1= all respondents in group disapproved
The splits here are interesting and we will look further into possible reasons
and analysis in the final section of this chapter.
Figure 48: Net approval rates of current policy and future commitments by government and
organised business
Source: Intellidex Note: Net approval, +1= all respondents in sector saw approved, -1= all respondents in group disapproved
AgricultureBusiness Services
Chemicals
Construction
Education
Financial services Forestry and fishing
Health
ICT
Infrastructure
ManufacturingMining
Transport
Wholesale and retail
Services (weighted)
Goods (weighted)
Sample
-0.6
-0.4
-0.2
0
0.2
0.4
0.6
-0.8 -0.6 -0.4 -0.2 0 0.2 0.4 0.6
Current policy net approval
Future commitment net approval
Approves of future commitment
/ Disapproves of current policy
Disapproves of future commitment
/ Disapproves of current policy
Approves of future commitment /
Approves of current policy
-0.8 -0.6 -0.4 -0.2 0 0.2 0.4 0.6
AgricultureBusiness Services
ChemicalsConstruction
EducationFinancial services
Forestry and fishingHealth
ICTInfrastructure
ManufacturingMining
TransportWholesale and retail
Services (weighted)Goods (weighted)
Sample
Future commitment Current policy
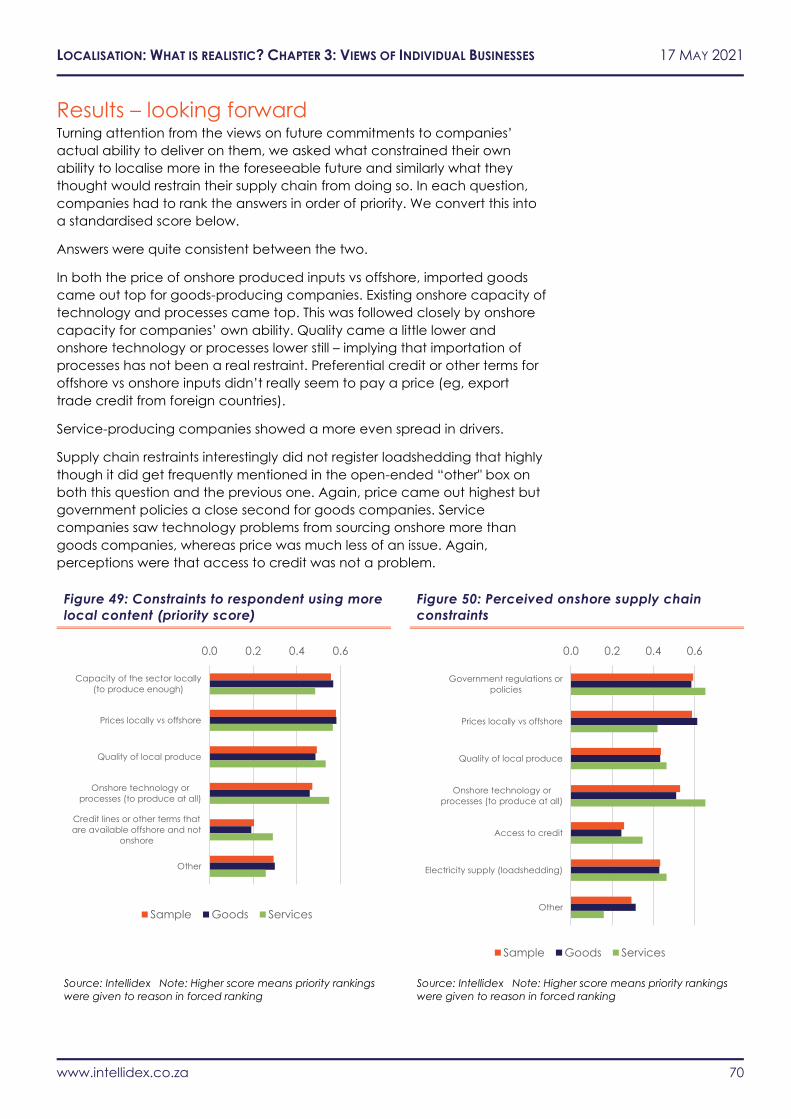
LOCALISATION: WHAT IS REALISTIC? CHAPTER 3: VIEWS OF INDIVIDUAL BUSINESSES 17 MAY 2021
www.intellidex.co.za 70
Results – looking forward Turning attention from the views on future commitments to companies’
actual ability to deliver on them, we asked what constrained their own
ability to localise more in the foreseeable future and similarly what they
thought would restrain their supply chain from doing so. In each question,
companies had to rank the answers in order of priority. We convert this into
a standardised score below.
Answers were quite consistent between the two.
In both the price of onshore produced inputs vs offshore, imported goods
came out top for goods-producing companies. Existing onshore capacity of
technology and processes came top. This was followed closely by onshore
capacity for companies’ own ability. Quality came a little lower and
onshore technology or processes lower still – implying that importation of
processes has not been a real restraint. Preferential credit or other terms for
offshore vs onshore inputs didn’t really seem to pay a price (eg, export
trade credit from foreign countries).
Service-producing companies showed a more even spread in drivers.
Supply chain restraints interestingly did not register loadshedding that highly
though it did get frequently mentioned in the open-ended “other" box on
both this question and the previous one. Again, price came out highest but
government policies a close second for goods companies. Service
companies saw technology problems from sourcing onshore more than
goods companies, whereas price was much less of an issue. Again,
perceptions were that access to credit was not a problem.
Figure 49: Constraints to respondent using more
local content (priority score)
Figure 50: Perceived onshore supply chain
constraints
Source: Intellidex Note: Higher score means priority rankings
were given to reason in forced ranking Source: Intellidex Note: Higher score means priority rankings
were given to reason in forced ranking
0.0 0.2 0.4 0.6
Capacity of the sector locally
(to produce enough)
Prices locally vs offshore
Quality of local produce
Onshore technology or
processes (to produce at all)
Credit lines or other terms that
are available offshore and not
onshore
Other
Sample Goods Services
0.0 0.2 0.4 0.6
Government regulations or
policies
Prices locally vs offshore
Quality of local produce
Onshore technology or
processes (to produce at all)
Access to credit
Electricity supply (loadshedding)
Other
Sample Goods Services
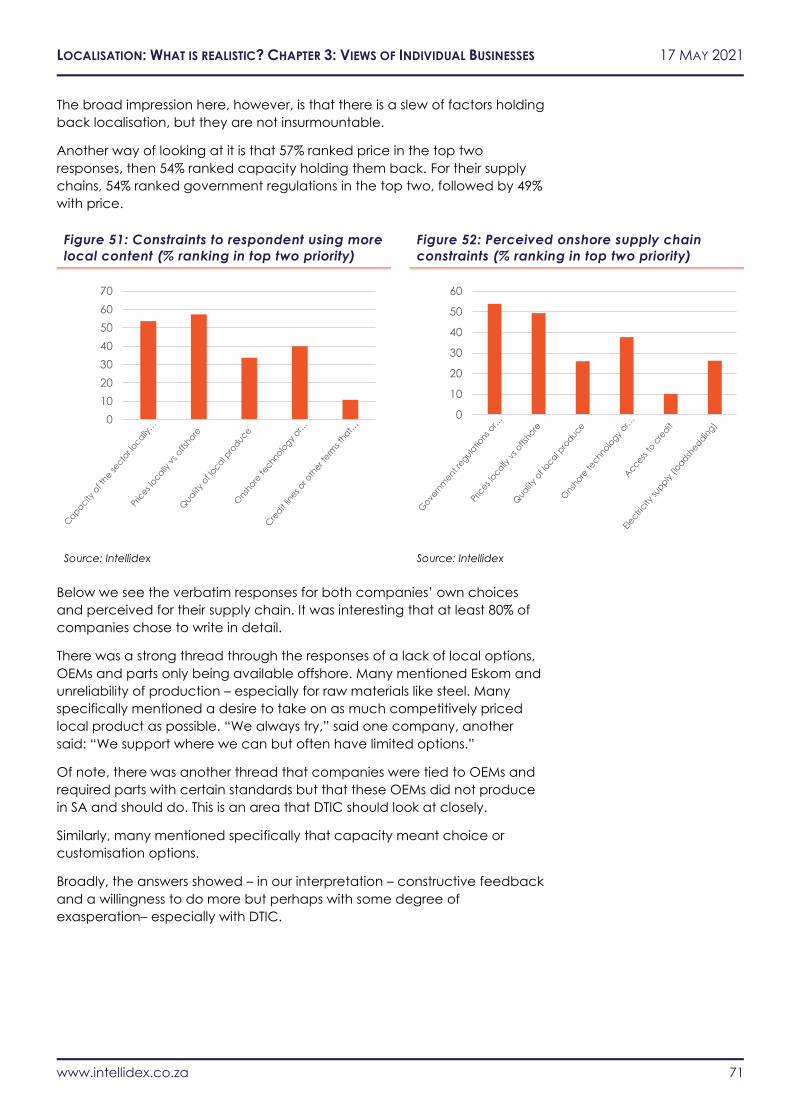
LOCALISATION: WHAT IS REALISTIC? CHAPTER 3: VIEWS OF INDIVIDUAL BUSINESSES 17 MAY 2021
www.intellidex.co.za 71
The broad impression here, however, is that there is a slew of factors holding
back localisation, but they are not insurmountable.
Another way of looking at it is that 57% ranked price in the top two
responses, then 54% ranked capacity holding them back. For their supply
chains, 54% ranked government regulations in the top two, followed by 49%
with price.
Figure 51: Constraints to respondent using more
local content (% ranking in top two priority)
Figure 52: Perceived onshore supply chain
constraints (% ranking in top two priority)
Source: Intellidex Source: Intellidex
Below we see the verbatim responses for both companies’ own choices
and perceived for their supply chain. It was interesting that at least 80% of
companies chose to write in detail.
There was a strong thread through the responses of a lack of local options,
OEMs and parts only being available offshore. Many mentioned Eskom and
unreliability of production – especially for raw materials like steel. Many
specifically mentioned a desire to take on as much competitively priced
local product as possible. “We always try,” said one company, another
said: “We support where we can but often have limited options.”
Of note, there was another thread that companies were tied to OEMs and
required parts with certain standards but that these OEMs did not produce
in SA and should do. This is an area that DTIC should look at closely.
Similarly, many mentioned specifically that capacity meant choice or
customisation options.
Broadly, the answers showed – in our interpretation – constructive feedback
and a willingness to do more but perhaps with some degree of
exasperation– especially with DTIC.
0
10
20
30
40
50
60
70
0
10
20
30
40
50
60
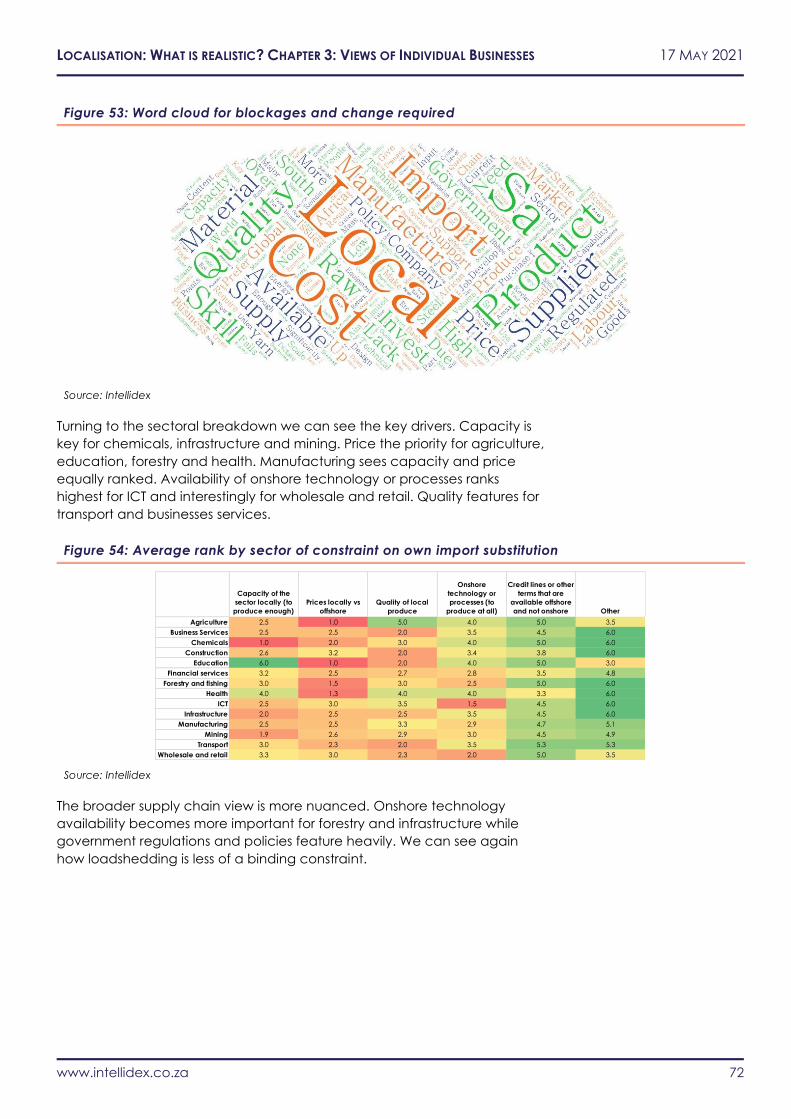
LOCALISATION: WHAT IS REALISTIC? CHAPTER 3: VIEWS OF INDIVIDUAL BUSINESSES 17 MAY 2021
www.intellidex.co.za 72
Figure 53: Word cloud for blockages and change required
Source: Intellidex
Turning to the sectoral breakdown we can see the key drivers. Capacity is
key for chemicals, infrastructure and mining. Price the priority for agriculture,
education, forestry and health. Manufacturing sees capacity and price
equally ranked. Availability of onshore technology or processes ranks
highest for ICT and interestingly for wholesale and retail. Quality features for
transport and businesses services.
Figure 54: Average rank by sector of constraint on own import substitution
Source: Intellidex
The broader supply chain view is more nuanced. Onshore technology
availability becomes more important for forestry and infrastructure while
government regulations and policies feature heavily. We can see again
how loadshedding is less of a binding constraint.
Capacity of the
sector locally (to
produce enough)
Prices locally vs
offshore
Quality of local
produce
Onshore
technology or
processes (to
produce at all)
Credit lines or other
terms that are
available offshore
and not onshore Other
Agriculture 2.5 1.0 5.0 4.0 5.0 3.5
Business Services 2.5 2.5 2.0 3.5 4.5 6.0
Chemicals 1.0 2.0 3.0 4.0 5.0 6.0
Construction 2.6 3.2 2.0 3.4 3.8 6.0
Education 6.0 1.0 2.0 4.0 5.0 3.0
Financial services 3.2 2.5 2.7 2.8 3.5 4.8
Forestry and fishing 3.0 1.5 3.0 2.5 5.0 6.0
Health 4.0 1.3 4.0 4.0 3.3 6.0
ICT 2.5 3.0 3.5 1.5 4.5 6.0
Infrastructure 2.0 2.5 2.5 3.5 4.5 6.0
Manufacturing 2.5 2.5 3.3 2.9 4.7 5.1
Mining 1.9 2.6 2.9 3.0 4.5 4.9
Transport 3.0 2.3 2.0 3.5 5.3 5.3
Wholesale and retail 3.3 3.0 2.3 2.0 5.0 3.5
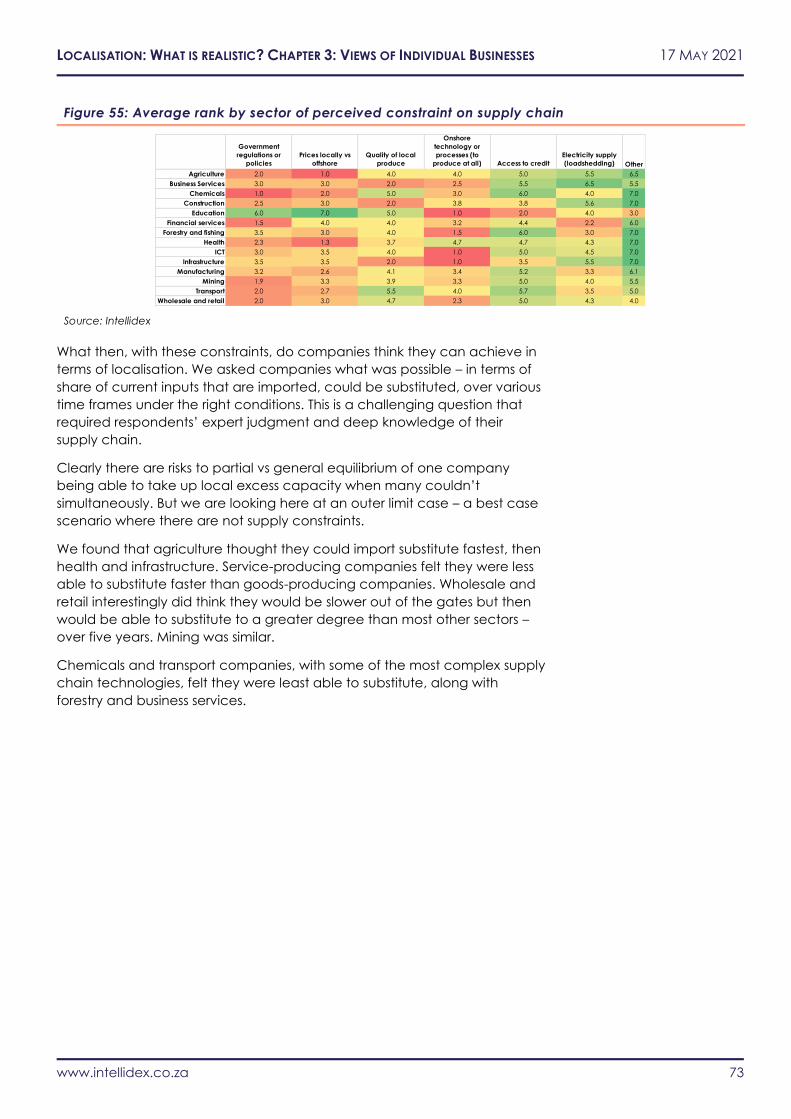
LOCALISATION: WHAT IS REALISTIC? CHAPTER 3: VIEWS OF INDIVIDUAL BUSINESSES 17 MAY 2021
www.intellidex.co.za 73
Figure 55: Average rank by sector of perceived constraint on supply chain
Source: Intellidex
What then, with these constraints, do companies think they can achieve in
terms of localisation. We asked companies what was possible – in terms of
share of current inputs that are imported, could be substituted, over various
time frames under the right conditions. This is a challenging question that
required respondents’ expert judgment and deep knowledge of their
supply chain.
Clearly there are risks to partial vs general equilibrium of one company
being able to take up local excess capacity when many couldn’t
simultaneously. But we are looking here at an outer limit case – a best case
scenario where there are not supply constraints.
We found that agriculture thought they could import substitute fastest, then
health and infrastructure. Service-producing companies felt they were less
able to substitute faster than goods-producing companies. Wholesale and
retail interestingly did think they would be slower out of the gates but then
would be able to substitute to a greater degree than most other sectors –
over five years. Mining was similar.
Chemicals and transport companies, with some of the most complex supply
chain technologies, felt they were least able to substitute, along with
forestry and business services.
Government
regulations or
policies
Prices locally vs
offshore
Quality of local
produce
Onshore
technology or
processes (to
produce at all) Access to credit
Electricity supply
(loadshedding) Other
Agriculture 2.0 1.0 4.0 4.0 5.0 5.5 6.5
Business Services 3.0 3.0 2.0 2.5 5.5 6.5 5.5
Chemicals 1.0 2.0 5.0 3.0 6.0 4.0 7.0
Construction 2.5 3.0 2.0 3.8 3.8 5.6 7.0
Education 6.0 7.0 5.0 1.0 2.0 4.0 3.0
Financial services 1.5 4.0 4.0 3.2 4.4 2.2 6.0
Forestry and fishing 3.5 3.0 4.0 1.5 6.0 3.0 7.0
Health 2.3 1.3 3.7 4.7 4.7 4.3 7.0
ICT 3.0 3.5 4.0 1.0 5.0 4.5 7.0
Infrastructure 3.5 3.5 2.0 1.0 3.5 5.5 7.0
Manufacturing 3.2 2.6 4.1 3.4 5.2 3.3 6.1
Mining 1.9 3.3 3.9 3.3 5.0 4.0 5.5
Transport 2.0 2.7 5.5 4.0 5.7 3.5 5.0
Wholesale and retail 2.0 3.0 4.7 2.3 5.0 4.3 4.0
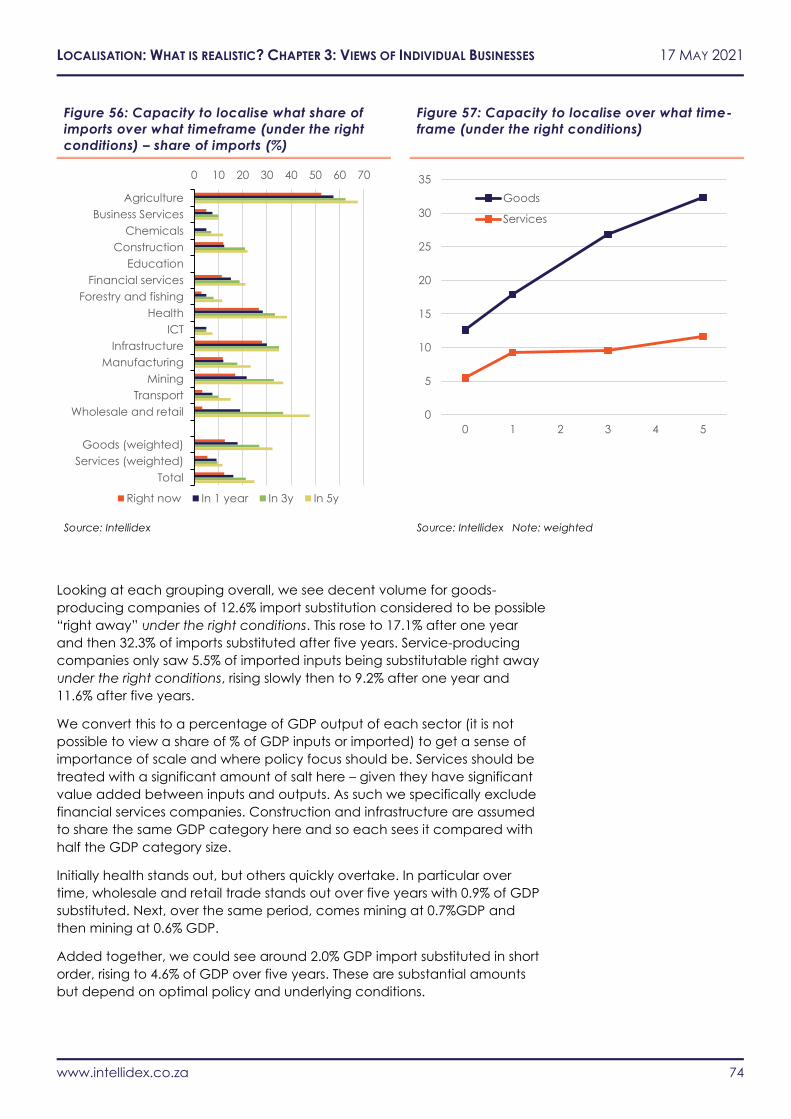
LOCALISATION: WHAT IS REALISTIC? CHAPTER 3: VIEWS OF INDIVIDUAL BUSINESSES 17 MAY 2021
www.intellidex.co.za 74
Figure 56: Capacity to localise what share of
imports over what timeframe (under the right
conditions) – share of imports (%)
Figure 57: Capacity to localise over what time-
frame (under the right conditions)
Source: Intellidex Source: Intellidex Note: weighted
Looking at each grouping overall, we see decent volume for goods-
producing companies of 12.6% import substitution considered to be possible
“right away” under the right conditions. This rose to 17.1% after one year
and then 32.3% of imports substituted after five years. Service-producing
companies only saw 5.5% of imported inputs being substitutable right away
under the right conditions, rising slowly then to 9.2% after one year and
11.6% after five years.
We convert this to a percentage of GDP output of each sector (it is not
possible to view a share of % of GDP inputs or imported) to get a sense of
importance of scale and where policy focus should be. Services should be
treated with a significant amount of salt here – given they have significant
value added between inputs and outputs. As such we specifically exclude
financial services companies. Construction and infrastructure are assumed
to share the same GDP category here and so each sees it compared with
half the GDP category size.
Initially health stands out, but others quickly overtake. In particular over
time, wholesale and retail trade stands out over five years with 0.9% of GDP
substituted. Next, over the same period, comes mining at 0.7%GDP and
then mining at 0.6% GDP.
Added together, we could see around 2.0% GDP import substituted in short
order, rising to 4.6% of GDP over five years. These are substantial amounts
but depend on optimal policy and underlying conditions.
0 10 20 30 40 50 60 70
Agriculture
Business Services
Chemicals
Construction
Education
Financial services
Forestry and fishing
Health
ICT
Infrastructure
Manufacturing
Mining
Transport
Wholesale and retail
Goods (weighted)
Services (weighted)
Total
Right now In 1 year In 3y In 5y
0
5
10
15
20
25
30
35
0 1 2 3 4 5
Goods
Services
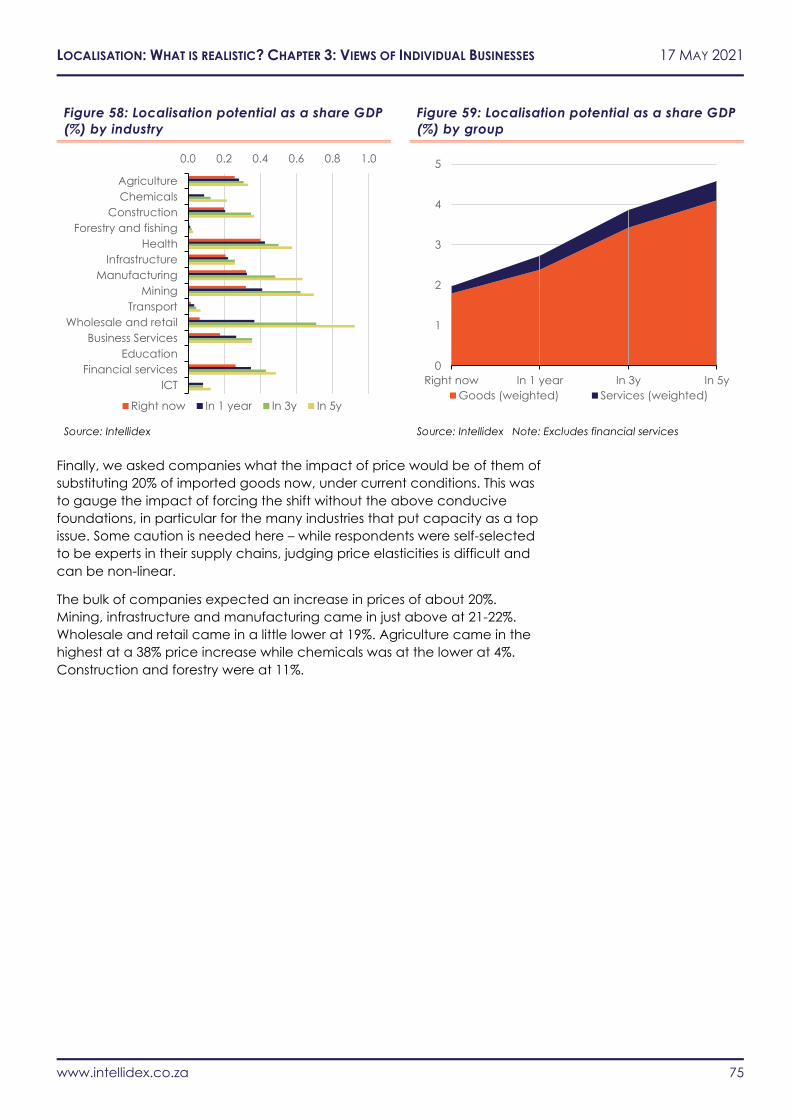
LOCALISATION: WHAT IS REALISTIC? CHAPTER 3: VIEWS OF INDIVIDUAL BUSINESSES 17 MAY 2021
www.intellidex.co.za 75
Figure 58: Localisation potential as a share GDP
(%) by industry
Figure 59: Localisation potential as a share GDP
(%) by group
Source: Intellidex Source: Intellidex Note: Excludes financial services
Finally, we asked companies what the impact of price would be of them of
substituting 20% of imported goods now, under current conditions. This was
to gauge the impact of forcing the shift without the above conducive
foundations, in particular for the many industries that put capacity as a top
issue. Some caution is needed here – while respondents were self-selected
to be experts in their supply chains, judging price elasticities is difficult and
can be non-linear.
The bulk of companies expected an increase in prices of about 20%.
Mining, infrastructure and manufacturing came in just above at 21-22%.
Wholesale and retail came in a little lower at 19%. Agriculture came in the
highest at a 38% price increase while chemicals was at the lower at 4%.
Construction and forestry were at 11%.
0.0 0.2 0.4 0.6 0.8 1.0
Agriculture
Chemicals
Construction
Forestry and fishing
Health
Infrastructure
Manufacturing
Mining
Transport
Wholesale and retail
Business Services
Education
Financial services
ICT
Right now In 1 year In 3y In 5y
0
1
2
3
4
5
Right now In 1 year In 3y In 5y
Goods (weighted) Services (weighted)

LOCALISATION: WHAT IS REALISTIC? CHAPTER 3: VIEWS OF INDIVIDUAL BUSINESSES 17 MAY 2021
www.intellidex.co.za 76
Figure 60: Price elasticity of attempted
substitution of 20% of import prices
Figure 61: Comparison of price responses in
survey
Source: Intellidex Source: Intellidex
Given the difficulty in answering this question, we can check it against the
historic price impact seen from existing policies – by looking at the price
changes seen scaled by current imports. This is not a perfect measure but
allows some giggle check of outliers. Transport comes in for future price
changes surprisingly low. Agriculture is surprisingly high. Infrastructure is also
rather high.
One explanation for these outliers is where capacity constraints are now
very close, for instance for agriculture and infrastructure (and in general,
most sectors are “above the line” in the figure above), compared with
transport which has a subsidy scheme in place that might enable capacity
to expand.
Concluding Analysis We think, from this substantive survey analysis of a broad cross-section of
company sizes and sectors, that there is a clear willingness and desire to
buy local as much as possible. Yet the constraints are quite clear and can
be addressed with policy certainty and demand as well as predictable
government policy.
These conflicting sentiments came across in the verbatim responses which
were constructive, yet also showed hints of pessimism and frustration. Many
wider macro issues were raised in terms of the ease of doing business,
including labour laws (four responses) and generalised policy certainty
(seven responses).
There were some calls for more local content designation and import tariffs
but generally respondents seemed to favour a more market-based
approach which saw the needs of various stakeholders balanced.
Enforcement came up in 12 of the responses – particularly SOE
procurement and the need to lead by example.
0
5
10
15
20
25
30
35
40Agriculture
Chemicals
Construction
Forestry and
fishing
Health
Infrastructure Manufacturing
Mining
Transport
Wholesale and
retail
Business Services
Education
Financial services
ICT
Goods (weighted)
Services
(weighted)
Total (sample)
0
5
10
15
20
25
30
35
40
0 5 10 15 20 25 30
Future policy
eleasticity
Historic price impact

LOCALISATION: WHAT IS REALISTIC? CHAPTER 3: VIEWS OF INDIVIDUAL BUSINESSES 17 MAY 2021
www.intellidex.co.za 77
The DTIC’s new local content portal, if it can be effective and user-friendly,
may provide some reassurance to a number of companies that stated that
it is not easy to bring local content production to the attention of the
department, though the new portal is meant more to bring it to the
attention of customers. Several responses said the DTIC needed to better
understand the local landscape and what was possible in production terms
and when.
A number of respondents posed interesting concerns around export and
AfCFTA: how can companies exporting from SA and building globally
competitive businesses be expected to import substitute when they should
be deepening global supply chains, particularly in the rest of Africa. Some
called for an exemption of export-led companies to ensure that there
would be jobs maximisation onshore interlinked to new global supply chains.
Currently there is an uneasy calm in sectors with compacts like car
manufacturing, but it would seem there is some cry from industry for a more
thoroughly thought-out policy in this area from DTIC.
Similarly, the need for OEMs or OEM-accredited locals manufacturing
“offshore” goods onshore was seen as a crucial area raised in verbatim
responses. This issue has come up in REIPPP-related procurement rules
increasingly and should – based on the number of responses – be a major
topic of interest to DTIC to promote. AfCFTA surely provides a new and
wider market for OEMs based onshore that DTIC should support.
Three respondents mentioned steel prices and four referred to concrete
and building materials as being prohibitive, and that prices of local input
goods made export businesses uncompetitive.
There is much food for thought and further research possible here.
Companies could be asked more detailed questions on the order of
addressing priorities, for instance, or about specific input costs like steel.
These however are better dealt with by sectoral-level surveys that can deal
with idiosyncrasies.
We think there is strong evidence from this, first of its kind, generalised
macro level localisation survey of South African companies that there is a
path that can be found. There is a willingness to think positively about future
options, but the foundations are clearly crucial and there are high levels of
scepticism based on current policies. This moment may not last, however,
and it should be grabbed –government could regain much credibility by
resolving the highlighted constraints.
The outcome of missteps is clearly large, with a price hike roughly of 20% as
procurers hit onshore capacity constraints, which will dent sentiment. The
survey also hints at this more negative outcome from being too aggressive
and ill prepared for a push to localisation.