Embed Size (px)
Citation preview

What is Hysteresis?
K. A. Morris∗
Hysteresis is a widely occuring phenomenon. It can befound in a wide variety of natural and constructed systems.Generally, a system is said to exhibit hysteresis when a char-acteristic looping behaviour of the input-output graph is dis-played. These loops can be due to a variety of causes. Fur-thermore, the input-output graphs of periodic inputs at differ-ent frequencies are generally identical. Existing definitionsof hysteresis are useful in different contexts but fail to fullycharacterize it. In this paper, a number of different situa-tions exhibiting hysteresis are described and analyzed. Theapplications described are: an electronic comparator, generegulatory network, backlash, beam in a magnetic field, aclass of smart materials and inelastic springs. The commonfeatures of these widely varying situations are identified andsummarized in a final section that includes a new definitionfor hysteresis.
1 IntroductionHysteresis occurs in many natural and constructed sys-
tems.The relay shown in Figures 1 is a simple example of
a system exhibiting hysteretic behaviour. The relay in theFigure is centered at s with an offset of r. When the signalu > s + r, the relay is at +1. As the input decreases, theoutput R remains at +1 until the lower trigger point s− r isreached. At this point the output switches to −1. When thesignal is increasing, the output remains at −1 until u = s+ r.At this point, the output switches to +1. For inputs in therange s−r < u< s+r the output can be +1 or−1, dependingon past history. Thus, the output may lag the input by 2r.This lag prevents devices such as thermostats from chatteringas the temperature moves just above or below the setpoint.Hysteretic behaviour is also apparent in many other contexts,such as play in mechanical gears and smart materials [1–6].Hysteresis also occurs naturally in a number of systems suchas genetic regulatory systems [2]. All these examples arediscussed in more detail later in this paper.
The first mention of hysteresis appeared in an 1885 pa-per on magnetism [7]. Ewing wrote
In testing the changes of thermoelectric qualitywhich a stretched wire underwent when succes-sively loaded and unloaded so as to suffer alternate
∗Dept. of Applied Mathematics, University of Waterloo, Waterloo, On-tario, Canada, ([email protected]).
application and removal of tensile stress, I foundthat during increment and decrement of the loadequal values of load were associated with widelydifferent values of thermoelectric quality; the differ-ence being mainly of this character, that the changesof thermoelectric quality lagged behind the changesof stress. This lagging is, however, a static phe-nomenon, for it is sensibly unaffected by the speedat which the load is changed; and again, when anystate of load is maintained constant, the thermoelec-tric quality does not change with lapse of time...Magnetic phenomena present many instances of asimilar action- some of which will be described be-low. Thus, when a magnetised piece of iron is al-ternately subjected to pull and relation of pull suffi-ciently often to make the magnetic changes cyclic,these lag behind the changes of stress in much thesame way as the changes of thermoelectric qualitydo. I found it convenient to have a name for thispeculiar action, and accordingly called it Hysteresis(from νστερεω, to lag behind).
This paragraph highlights two key aspects of hysteresis thatare still regarded as characteristic today: “lagging” and rate-independence.
Lagging is still generally regarded as a key componentof hysteresis. The online version of the Merriam-Websterdictionary defines hysteresis as
retardation of an effect when the forces acting upona body are changed (as if from viscosity or internalfriction) ; especially : a lagging in the values ofresulting magnetization in a magnetic material (asiron) due to a changing magnetizing force. [8]
In the simple relay shown in Figure 1, changes in the outputlag changes in input. However, the output of a linear delaysystem such as y(t) = u(t−1) also lags the input. Such sys-tems would not be described as hysteretic.
The second property mentioned by Ewing, rate inde-pendence, means that an input/output plot only depends onthe values of the input, but not the speed at which the in-put is changed. In a rate-independent system such as thoseshown in Figures 1 and 2 the input/output plot with inputu(t) = M sin(t) is identical to that with u(t) = M sin(10t).More formally, let a differentiable function ϕ : R+ → R+
be a time transformation if ϕ(t) is increasing and satisfies

ϕ(0) = 0 and limt→∞ ϕ(t) = ∞. For any interval I ⊂ R+, letMap(I) indicate the set of real-valued functions defined onI.
Definition 1. [9] An operator Γ : U⊂Map(I)→Map(I)is rate independent if for all time transformations ϕ, and allinputs v ∈ U,
(Γv)ϕ = Γ(vϕ).
In [10, pg. 13] hysteresis is defined as rate independencecombined with a memory effect, or dependence of previousvalues of the input.
True rate independence implies that the system is ableto transition arbitrarily quickly. For physical systems thisis an idealization. For instance, in the magnetic materialsdiscussed in the above quote, changes in magnetization arecontrolled by a characteristic time constant. Furthermore,thermal fluctuations means that magnetization can changeeven when the input doesn’t change. Thus, rate indepen-dence in magnetic materials is an approximation valid whenthermal effects are low and the input does not change ex-tremely fast. Similarly, it is not possible to vary the temper-ature of a shape memory alloy arbitrarily quickly, so from apractical point of view, the temperature-strain curves in thesematerials typically display rate independence. Rate indepen-dence/dependence in the context of various examples is dis-cussed later in this paper.
Definition 2. [1, 10]. An operator Γ : U ⊂ Map(I) →Map(I) that is both causal and rate-independent is said tobe a hysteresis operator.
This definition has been quite useful in analysis of sys-tems involving hysteresis - see for example, [12–15]. How-ever, there are a couple of difficulties with this approach.First, the definition is so general that it can include systemswhich would not typically be regarded as hysteretic. A trivialexample is y = u; another is y(t) = u(t−1). Furthermore, asmentioned above, many systems regarded as hysteretic havebehaviour that is rate-independent at low input rates but rate-dependent at high input rates.
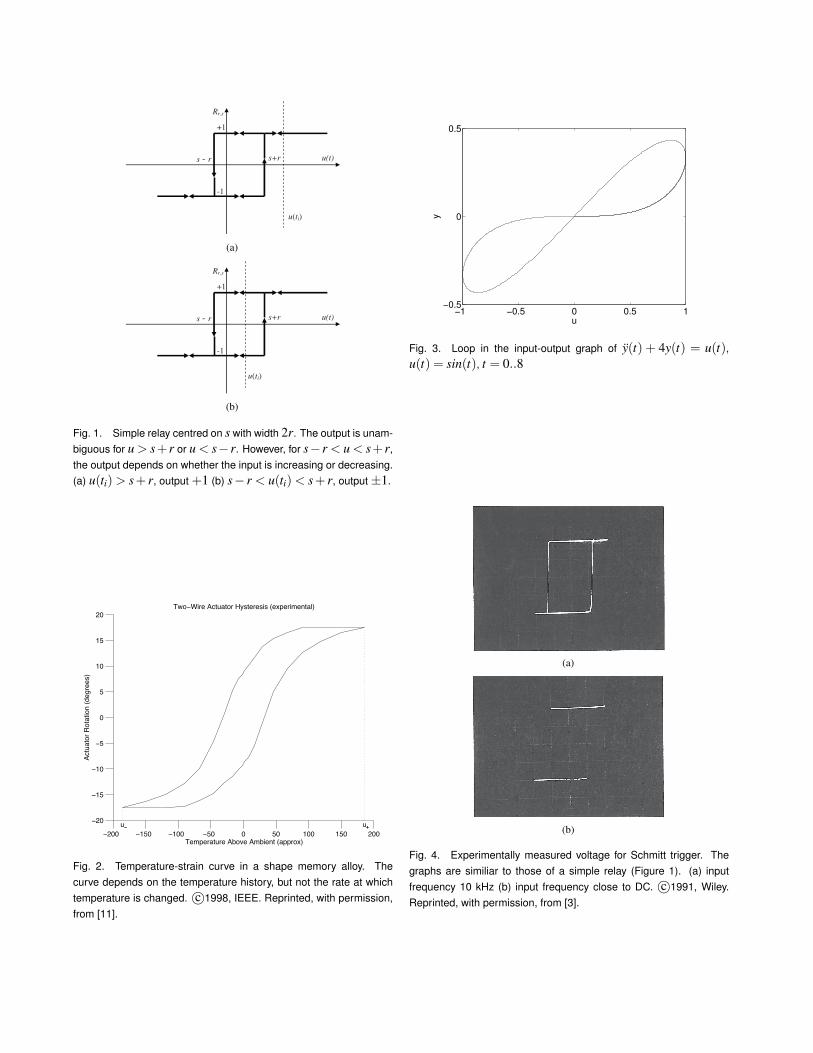
Another typical characteristic of hysteretic systems islooping behaviour, illustrated in Figures 1 and 2. One stan-dard text [1] writes: When speaking of hysteresis, one usuallyrefers to a relation between 2 scalar time-dependent quanti-ties that cannot be expressed in terms of a single value func-tion, but takes the form of loops. However, the loop shownin Figure 3 is produced by a system that would not be de-scribed as hysteretic. This linear system is clearly not rate-independent and the curves produced by a periodic input willconverge to a line as the frequency approaches zero. In fact,any loop in the input-output curve of a linear system witha periodic input degenerates to a single curve as the inputfrequency decreases. In [16], it is suggested that systems forwhich the input-output map has non-trivial closed curves that
persist for a periodic input as the frequency of the input sig-nal approaches zero be regarded as hysteretic. This is usefulas a test since it excludes systems (such as the linear systemin Figure 3) where the looping is a purely rate-dependentphenomenon. However, in magnetic materials, magnetismcan approach the single-valued anhysteretic curve as the rateof change of the applied field approaches zero [17]. Sincethe response of a system to an input is affected by the his-tory of the current input (see again the simple relay in Figure1), hysteretic systems are often described as having mem-ory. The state x in the familiar dynamical system descriptionx(t) = f (x, t) encodes the memory of a system. Knowledgeof the current state, and the inputs is sufficient to determinethe output. Consider a simple integrator:
x(t) = u(t)
y(t) = x(t).
The output y is the integral of the input u and the state x storesthe memory of the system, the current state of the integrator.This linear system would not be described as hysteretic.
In this paper a number of common examples of systemsthat are said to be hysteretic are examined in detail: an elec-tronic trigger, a biological switch, smart materials, mechani-cal play and inelastic springs. A model for a magneto-elasticbeam is also analysed and shown to display hysteretic be-haviour. The common features of these systems are analysedand used to formulate a definition of hysteresis. This paperis not intended to be a review of the extensive literature onhysteretic systems. Some previous works that do provide re-views are [1, 4, 10, 18].
2 Schmitt TriggerA comparator or switch changes its output from some
level y− to y+ when the input increases above a referencelevel. Conversely, the output is dropped from y+ to y− as theinput drops below the reference level. A familiar example isa household thermostat where the furnace is turned on whenthe room temperature falls below the set-point, and turnedoff when the temperature rises above the setpoint. The prob-lem with a simple switch is that there is a tendency to os-cillate about the setpoint as the input falls slightly above orbelow the setpoint. Such oscillations can be caused by noisealone. For this reason, more complicated comparators with aresponse similar to that of the simple relay shown in Figure1 are used.
A common way to implement such a device is a circuitknown as a Schmitt trigger [19]. The idea for this devicearose as part of Otto Schmitt’s doctoral work in the 1930’son developing an electronic device to mimic the generationand propagation of action potentials along nerve fibres insquid. Schmitt continued his work in biophysics and is cred-ited with developing the word biomimetics towards the endof his career. [20].
A Schmitt trigger is used today in many applications,such as thermostats and reduction of chatter in circuits [3].

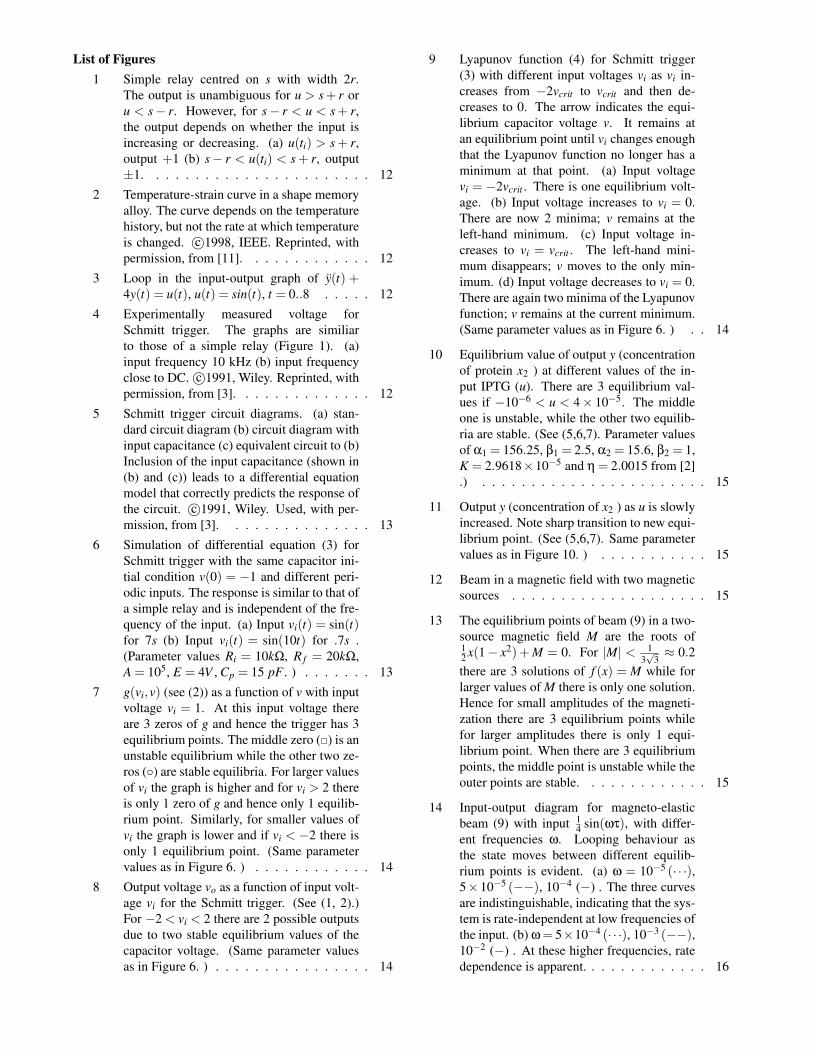
Experimental response of a Schmitt trigger is shown in Fig-ure 4. It is apparent that the response of a Schmitt trigger issimilar to that of the simple relay shown in Figure 1.
Although Schmitt’s original realization [19] used vac-uum tubes, current implementations use electronics, such asthe operational amplifier (op amp) shown in Figures 5. Intheory, an op amp multiples (amplifies) the input voltage vby a fixed amount, say A, to produce an output voltage Av.In practice, this amplification only occurs in a certain rangeof voltage and op amps saturate beyond a certain point. Themaximum and minimum voltages are contained within fixedlimits. Elementary descriptions of the behaviour of a Schmitttrigger, for example, that in [21] use the basic circuit diagramFigure 5a and rely on the fact that the op amp saturates be-yond a certain point. The analysis is separate for each oper-ating region and depends on whether the input is increasingor decreasing.
A better understanding of the trigger’s behaviour can beobtained by using a more accurate model for the op amp thatincludes its capacitance, as shown in Figure 5b. The stabilityanalysis on the differential equation that describes this circuitpredicts the behaviour of the Schmitt trigger [3]. Considerthe equivalent circuit shown in Figure 5c where the activeelement f describes a finite-gain op-amp. Let E− > 0 andE+ > 0 denote the lower and upper saturation voltages re-spectively, A 1 the op amp gain, and define
f (v) =
−E− v≤−E−
AAv −E−
A < v < E+A
E+ v≥ E+A
(1)
so that vo = f (v). For simplicity in this analysis we will as-sume the upper and lower saturation voltages are symmetric:E− = E+ = E.
The input in this case is the input voltage vi, while theoutput is the op amp output voltage vo. Defining
g(vi,v) = Gi(vi− v)+G f (vo− v) (2)
where vo = f (v) and Gi =1Ri
, G f =1
R f, application of Kir-
choff’s Current Law to the circuit in Figure 5c yields the dif-ferential equation for the capacitor voltage v,
Cpdvdt
= g(vi,v). (3)
The capacitance Cp is very small, about 10−11F ; see forexample, [21, chap. 11], although this value can be evensmaller in some op amp configurations. Typical values ofRi = 10kΩ, R f = 20kΩ, A = 105 and Cp = 15 pF yield asettling time of 40µs. Because of these fast transients, inpractice only the equilibrium values of the variables are ob-served. This is illustrated by the graphs in Figure 6. Note thesimilarity to the graph of a simple relay. Thus a quasi-static
analysis of the relationship of the output voltage vo to the ca-pacitor voltage v, with the input voltage vi regarded as fixedis appropriate.
The equilibrium values of v for any specific input volt-age vi are the zeros of g(vi,v). The function v→ g(vi,v) withvi = 1 and the above parameter values is plotted in Figure7. Note that since A is very large, the middle portion of thegraph, where g is increasing, appears vertical in comparisonto the other sections. The function g reaches a maximumvalue of
Imax = Givi +EA
((A−1)G f −Gi
)at v = E
A and a minimum value of
Imin = Givi−EA
((A−1)G f −Gi
)at −E
A . If Imin < 0 and Imax > 0 (as shown in Figure 7 ) theng(vi, ·) has 3 real roots and there are 3 equilibrium points.Defining v = G f
GiE, α = Gi
G f +Gi, these equilibrium points are
α(vi− v),Givi
G f +Gi−G f A, α(vi + v).
If either Imin = 0 or Imax = 0 then there are 2 equilibriumpoints. If the input voltage vi is such that Imin > 0 or Imax < 0then g(vi, ·) has only one real zero and so there is only 1equilibrium point.
The stability of the equilibria can be analysed by exam-ining ∂g
∂v . For |v| ≥ EA ,
∂g∂v
=−G f −Gi < 0
and the corresponding equilibrium is stable. On the otherhand for |v|< E
A ,
∂g∂v
= (A−1)G f −Gi > 0
since A >> 1. Thus, equilibria that occur in the linear regionof operation of the op amp are unstable, and are not observeddue to noise in the system. Equilibria in the saturation regionof the op amp are stable.
To understand further the behaviour of the system as theinput voltage varies, define
Evi(v) =
12 (v+αv)2−αviv v≤−E
A ,12 (αv− E
A )(αv− v2EA)−αviv |v|< E
A ,12 (v−αv)2−αviv v≥ E
A .
(4)

This function has minima at the stable equilibrium points veof the system. If it is shifted by a constant for each inputvoltage vi so that Evi(ve) = 0, it is a Lyapunov function forthe system. (See [22, e.g.] for a definition and discussionof Lyapunov functions.) This function is plotted for varyingvalues of vi in Figures 9. Suppose the system starts with alow input voltage vi so that there are 3 equilibrium pointsand the voltage v < −E
A is at the smallest equilibrium point:v = α(vi− v).The op amp is in negative saturation, with vo =−E, as shown on Figure 8 for the case E = 4. For low valuesof vi, the Figures 9a and 9b are appropriate. As vi increases,the smallest zero of g increases, and v increases slowly. Theoutput voltage remains at−E =−4. The 2 lower zeros movecloser together until there are only 2 zeros of g. This occurswhen the input voltage is equal to
vcrit = v− EαA
.
Since A >> 1, vcrit ≈ v. (The parameter values used herelead to vcrit ≈ 2.) At this point the only stable equilibriumpoint is the largest zero of g and the output value increasesrapidly to the new equilibrium point. This is shown in Figure9d. The op amp will be in positive saturation with vo =E, theupper value on Figure 8. Since in practice the input voltagechanges much slower than the settling time of the system,this change appears instantaneous. For large values of the in-put, there is only one stable equilibrium point and v increaseslinearly with further increases in the input. Since the op ampis saturated, there is no change in vo. A similar process hap-pens when vi decreases, but now v is maintained at the upperequilibrium point until this point coalesces with the middleunstable equilibrium point; that is at vi = −vi. This processis illustrated by Figures 9e-h. When v moves to the lowerequilibrium point, the output v becomes −E, the lower valueon Figure 8.
This analysis of the differential equation (3 ) modellingthe Schmitt trigger shows that the fact that two different out-put voltages are possible for a given input voltage is due tothe presence of two stable equilibrium points of the capacitorvoltage. The transition between different equilibrium valuesappears to be immediate due to the fast transients in this sys-tem. The combination of these properties lead to the relay-like behaviour that makes this device useful.
3 Cell SignalingThere exist biological “switches”, which analogously,
to an electronic switch such as the Schmitt trigger, havea steady-state value that is changed by an external signal.Moreover, this new value is maintained even when the signalis removed. Thus, the switch can be said to have a memoryof the previous input value.
One of the simplest examples of a such a switch consistsof a pair of two genes which repress each other by expressingprotein transcription factors. These switches occur in genetic
regulatory systems. A general model for such a network is
x1(t) = F(x2)−µ1x1,
x2(t) = G(x1)−µ2x2
where x1,x2 indicate two repressor proteins, F and G arefunctions to be determined and µ1, µ2 are positive constants.In [23] it is shown that F and G must have multiple equi-librium points in order for the system to display switchingbehaviour. A common family of models for a two-repressorsystem that does lead to a system that has multiple equilib-rium points and thus displays “memory” is
x1(t) =α1
1+ xβ12
− x1, (5)
x2(t) =α2
1+ xβ21
− x2 (6)
where αi,βi are positive constants. Equilibrium points aresolutions to the system of equations
x1 =α1
1+ xβ12
,
x2 =α2
1+ xβ21
.
Substituting the first equation into the second, and regardingthe repressor protein x2 as the output y of this system, equi-librium values of y correspond to fixed points of
F(y) =α2(1+ yβ1)β2
(1+ yβ1)β2 +α1β2.
For certain values of the parameters, the equation y = F(y)has 3 roots and hence the system has three equilibriumpoints. In [2] the above model is used to describe a genetictoggle switch. Parameter values of α1 = 156.25, β1 = 2.5,α2 = 15.6, β2 = 1 are used. These values yield three equi-librium points. Analysis of the linearization of (5,6) abouteach equilibrium point shows directly that two of these equi-librium points are stable while the third (the middle value ofx2 or y) is unstable.
If the concentration of one of the repressors is perturbedfrom one stable equilibrium point, the system will return tothis point if the perturbation is not large. A larger perturba-tion could move the system into a region around the otherstable equilibrium point. The system will then settle at thisnew equilibrium point.
Equations (5,6) can be rewritten as the feedback system
x1(t) =α1
1+uβ1− x1,
x2(t) =α2
1+ xβ21
− x2,
y = x2,
with the connection u = y. The first two equations are amonotone system [24,25]. In [25] the stable equilibria of thissystem are found using [25, Thm. 3]. This approach can beuseful for high-dimensional systems. It is argued in [26] thatbistability, along with hysteretic behaviour, is often found inbiological systems with feedback-connected monotone sys-tems.
In this system, the active form of the protein x1 isrepressed by isopropyl-β-D-thiogalactopyranoside (IPTG),and this leads to an increase in x2 (y). Letting u indicatethe level of IPTG, the model is modified [2] so that insteadof x1 in (6) is replaced by
x1
(1+u/K)η(7)
where K,η are positive constants. (Values of K = 2.9618×10⁻⁵ and η = 2.0015 are used in [2].) Figure 10 showsthe equilibrium values of y = x2 against u. For the range−10−6 < u < 4×10⁻⁵ there are 3 equilibrium values. Anal-ysis shows that the middle one is unstable, while the othersare stable.
In practice, the level of IPTG is changed over a num-ber of hours. Figure 11 shows a plot of y against u as uincreases. Little change is seen in y until u reaches a criticalvalue of 40µM. At that point, the level of y jumps sharply tothe second equilibrium value, as shown in Figure 11. Sincethe dynamics of the system are very fast compared to the rateat which IPTG can be changed, this transition appears instan-taneous. The upper value of y is maintained when the controlu is subsequently decreased. The predictions of this modelare shown in [2] to closely match experimental data. How-ever, due to natural fluctuations, as well as stochastic effectsin the system, the experimental transition is less abrupt thanshown here.
The opposite switch, that of lowering y, in theory can beaccomplished by lowering u to the point that the upper equi-librium point disappears. However, as illustrated in Figure 10the drop to a single equilibrium value occurs for negative val-ues of u. Since u, the amount of IPTG, must be non-negativethis is not possible in practice. The “off” switch, or loweringof y, is accomplished in this system by temperature modu-lation. The activity of the protein y is temperature sensitive.An increase in temperature shifts y to an inactive state. Tomodel this, (5,6) needs to be modified to include a depen-dence on temperature. A model for this not given in [2].However, experimental data is provided that shows that ydrops as temperature is increased and that this lower level ismaintained when the temperature is subsequently lowered.
Thus, bistability is the mechanism behind the memory,or hysteresis, in this 2-repressor genetic switch. Bistability isresponsible for switching and hysteretic behaviour in a num-ber of other biochemical systems; see for instance, examplesin [23, 26, 27].
4 Beam in a Magnetic FieldConsider a flexible beam or other structure operating
within a magnetic field. Examples include transformers, discdrives and magnetically levitated vehicles. If the structureis composed of a ferromagnetic material, the presence of themagnetic field affects its deformation. Although the structureitself does not become magnetized to a significant extent, themagnetic field exerts a force on the structure. Consider thesituation, shown in Figure 12, where there are two differentmagnetic sources. A nonlinear partial differential equationfor the beam deflection w(t) in the configuration shown inFigure 12 was developed in [5].
Since the first mode is dominant, it is relevant to exam-ine only the first mode. This leads to an ordinary differentialequation for the coefficient a(t) of the first mode:
a(t)+δa(t)−αa(t)+βa(t)3 +ηa(t)5 = f (t)
where f (t) is a forcing term. The effective stiffness of thebeam, α, includes both elastic and magnetic terms. The co-efficients β and η depend on the local magnetic field. In gen-eral, the highest order term ηa(t)5 does not affect the qualita-tive behaviour and is neglected in the analysis [5]. Convert-ing to dimensionless variables using the characteristic length√
α
βand time 1√
2α, yields the normalized equation
A(τ)+dA(τ)− 12
A(τ)(1−A(τ)2)= u(τ) (8)
where d = δ√2α
and u(τ) is the forcing term in the new vari-ables. Considering only the first mode of a complex systemmay seem to be a gross over-simplification. However, exper-imental results support the qualitative analysis [5, 28]. Moregenerally, this equation describes the motion of a unit masssubject to the non-convex potential
V (x) =x4
8− x2
4
as well as viscous damping and an external force u.Equation (8) is a type of Duffing oscillator [29, pg. 82-
91, e.g.]. It is often studied as a relatively simple illustrationof a chaotic system [5, 28, 30, 31]. However, we are inter-ested here in how the stability of the system changes as themagnetic field u varies.
Writing the equation (8) in standard first-order formwith x = [A, A] yields
x1(τ) = x2(τ)x2(τ) = −dx2(τ)+
12 x1(τ)
(1− x1(τ)
2)+u(τ).
(9)
For constant inputs u(τ) = M, the system has equilibriumpoints given by (xe,0) where xe solves
12
x(1− x2)+M = 0.

The unforced system, M = 0, has 3 equilibrium points, (1,0)and (−1,0) and (0,0). Analysis of the Jacobian shows that(1,0) and (−1,0) are stable while (0,0) is unstable. For|M| < 1
3√
3≈ 0.2, there are 3 real roots of this equation, and
hence 3 equilibria. The middle equilibrium point is unstablewhile the outer two are stable. However, for larger inputs|M| > 1
3√
3these reduce to one equilibrium point. This is
illustrated in Figure 13 .Suppose the system starts with a small value of u, so
the system is at the lowest equilibrium. As u is increased,this equilibrium value increases slowly. When u increasesabove 0.2, this equilibrium disappears and the system movesto the new equilibrium. This change is almost instantaneouscompared to the rate of change of u. When u is decreased,the system remains at this larger equilibrium point until u isdecreased below −0.2, at which point this equilibrium pointdisappears and the system moves rapidly to the new equilib-rium. For−0.2 < u < 0.2 there are several equilibria and thestate of the system can be at either of the stable equilibriumpoints.
For an input with magnitude in [0, .25], the characteris-tic frequency of the system linearized around a stable equi-librium point is between 1 and 1.27. Thus, for input fre-quencies ω << 1 we expect the system to display rate inde-pendent behaviour. This is illustrated in Figure 14a, whichshows input/output diagrams of the system under periodicinputs u(t) = 0.25sin(ωτ) where ω < 10−4. In Figure 14bthe response of the system to periodic inputs with larger fre-quencies is shown. Although the same looping behaviour isobserved as the system moves between different equilibriumpoints, the input-output diagrams are rate-dependent. This isexpected, since at frequencies closer to 1, the rate of changeof input becomes comparable to the system dynamics.
The curves shown in Figures 14 are very similar inappearance to those of the hysteretic systems examined inprevious sections. The looping behaviour characteristic ofhysteretic systems is apparent. As for the other examples,the current state, or history, of the system affects the out-put. At low input rates, the system moves to a new equilib-rium almost instantaneously compared to the rate of changeof the input. Thus, at slow rates, the curves appear rate-independent. However, at faster rates, approaching the fun-damental frequency of the system, rate-dependence becomesapparent.
5 BacklashOne of the simplest examples of a system exhibiting
hysteresis is backlash, sometimes called play [1, 10]. It oc-curs in many mechanical systems. For instance, it describesslippage in gears that do not perfectly mesh such as thoseshown in Figure 15.
A graphical description of the behaviour of a play op-erator is shown in Figure 16. The rod with position w(t) ismoved by a cart of width 2r with centre position u(t). Aslong as the rod remains within the interior of the cart, the roddoes not move. Once one end of the cart reaches w(t) = u(t),
the rod will move with the cart. For any piecewise monotoneinput function u(t) let 0 = t0 < t1 < t2 < .. . < tN = tE be thepartition of [0, tE ] such that the function u is monotone oneach of the subintervals [ti, ti+1]. On an interval where u(t)is increasing (u(τ1)> u(τ2) if τ1 > τ2), the behaviour of theplay operator can be written formally as
w(t) = w(ti), w(t)> u(t)− r= u(t)− r, w(t)≤ u(t)− r. (10)
If u(t) is decreasing on an interval,
w(t) = w(ti), w(t)< u(t)+ r= u(t)+ r, w(t)≥ u(t)+ r. (11)
Alternatively, the play operator can be described by [1,pg. 24-25]
w(0) = fr(u(0),0),w(t) = fr(u(t),w(ti)), ti ≤ t ≤ ti+1, 0≤ i≤ N−1, (12)
where
fr(u,w) = max
u− r,minu+ r,w.
This model is quite different from those discussed in theprevious sections in a number of respects. First, the mod-els discussed earlier displayed rate-independent behaviourfor input rates significantly faster than the system dynamics.However, this model has no dynamics and is actually rate-independent. Since it is also causal, it defines a hysteresisoperator.
Furthermore, since this model has no dynamics, any so-lution w is an equilibrium solution. In other words, any pointw with |u−w| ≤ r is an equilibrium point. Thus, there isa continuum of equilibrium points. The models describedabove have a discrete number of equilibrium points. Sincethe model is static, any equilibrium point can be regarded asstable.
By introducing an internal variable v(t) for the cart po-sition, the operator can be approximately described by a dif-ferential equation. Let a > 0 be a constant, large comparedto the rate of change of the input u(t) and define
v(t) = a(u(t)− v(t)
)w(t) = g
(u(t),v(t),w(t)
) (13)
where
g(u,v,w) =
a(u− v) , u− v > 0 and w− v≤−r,a(u− v) , u− v < 0 and w− v≥ r,0, otherwise.
.

This model can be thought of incorporating some dy-namics for the movement of the cart so that it does not in-stantaneously move to a new position v in response to thecontrol u. The state variable v is in equilibrium wheneverv = u. The other state variable, w, is also the output. It is inequilibrium whenever v = u or |v−w| ≤ r. The equilibriumvalue of w depends on v. Provided that a is chosen very largecompared to how quickly u is varied, the system will only beobserved in equilibrium.
Numerical integration of this equation for several peri-odic inputs of varying frequency are shown in Figure 17. Theoutput is identical to that of the static model. Thus, for thegiven range of frequencies, this dynamical system displaysthe rate-independent looping behaviour characteristic of hys-teretic systems. Although the differential equation (13) pro-vides insight into the nature of the system, and may be usefulfor calculations requiring a differential equation model, it isslower to solve than the static model (12).
6 Smart materialsSmart materials, such as piezo-electrics, shape memory
alloys and magnetostrictives, are becoming widely used in anumber of industrial and medical applications. A more accu-rate term for these materials would perhaps be transductiveactuators, since they all transform one form of energy intoanother. Piezo-electric materials transform electrical energyinto mechanical energy. Shape memory alloys transformthermal energy into mechanical and can replace mechanicalmotors in some applications. Magnetostrictives transformmagnetic into mechanical energy, in response to an appliedmagnetic field. This transductive quality means that smart-material-based actuators are generally lighter and more reli-able than traditional actuators with comparable power.
Although these materials involve quite different pro-cesses, they are all display typical hysteretic behaviour. Thereason for this is the existence of a non-convex energy po-tential. Consider, as an example, a magnetostrictive materialsuch as Terfenol-D. The material is considered to be com-posed of magnetic dipoles. The following simplified expla-nation is quite brief; for details see [6].
Letting M indicate the magnetization for the dipole, ε
total strain, MR, η, γ1 and Y physical constants, and defining
f (M) =
µ0η
2 (M+MR)2, M ≤−MI ,
µ0η
2 (M−MR)2, M ≥MI ,
µ0η
2 (MR−MI)(MR− M2
MI), |M|< MI ,
,
the Helmholtz free energy of each dipole can be describedby [6]
ψ(M,ε) =12
Y ε2−Y γ1εM2 + f (M). (14)
In the absence of strain ε, ψ has local minima at ±MR. Theparameter MI is the inflection point where the second deriva-tive of ψ changes sign.
Letting Ho indicate the magnetic field, the Gibbs energyfor each dipole is
G(Ho,M,σ,ε) = ψ(M,ε)−µ0H0M. (15)
Figure 19 shows the Gibbs energy versus magnetization atdifferent values of the magnetic field. The equilibrium mag-netization M of each dipole occurs at a minimum of theGibb’s energy and so the magnetization M for the dipole canbe obtained using the condition
(∂G(Ho,M,σ,ε)
∂M
)Ho,σ,ε
= 0. (16)
Thermodynamic equilibrium is obtained faster than the rateat which the magnetic field is changed. The system is ob-served only at equilibrium. As seen in Figure 19(a), ifHo = 0, two minima of G exist:
M∗− =Ho
η−MR, (17)
M∗+ =Ho
η+MR. (18)
For a small positive Ho as shown in Figure 19(b), still twominima exist, but if Ho is further increased, so that Ho > Hcwhere
Hc = η(MR−MI),
the left-hand minimum M∗− disappears as shown in Figure19(c). Similarly, for Ho < −Hc, the right-hand minimumdoes not exist. The critical magnetic field Hc is called thecoercive field.
Suppose the system is initially at a magnetization levelM∗− with Ho = 0. As Ho is increased, the magnetization isgiven by (17) until H = Hc. At this point the magnetizationis still given by (17), but as H is increased further, eventu-ally this equilibrium point disappears and there is only theequilibrium point M∗+ (18). At this time, dipole magnetiza-tion moves rapidly to the right-hand equilibrium, M∗+. Thistransition is shown with an arrow in Figure 19(c). If the fieldH is subsequently decreased the magnetization is given bythe right-hand equilibrium M∗+ until H < −Hc. At this fieldlevel, the right-hand minimum M∗+ disappears and the mag-netization moves rapidly to the left-hand equilibrium M∗−.
The above model can be improved in a number of re-spects; for instance by modifying the Gibb’s energy to in-clude a more accurate description of the effect of magne-tostriction [33, 34].
The macroscopic behaviour of a material is more diffi-cult to describe. Suppose we consider the material to be asum of dipoles. The parameter MR, known as the remanencemagnetization, is the same for all dipoles. However, the in-flection point MI varies. Also, since the local field Ho at each

dipole is affected by imperfections and non-homogeneties, itis not equal to the applied magnetic field H. Assume that theinteraction field HI = H−Ho between the external and localmagnetic fields is constant over time for each dipole. Theparameters HI and MI (as well as the history of H) determinethe magnetization at each dipole. However, it is convenientto use Hc instead of MI so that the 2 parameters are HI andHc.
The Gibb’s energy is minimized for each dipole. Thememory of the system is the state of each individual dipole,that is, whether it is in the left or right equilibrium. LetM∗(HI ,Hc;H) indicate the magnetization, M∗+ or M∗−, asso-ciated with dipoles with interaction field HI , coercive fieldHc and input history H. The variable H indicates that mag-netization depends on the applied magnetic field. Assuminga distribution of ν1 for the interaction field HI and ν2 for thecoercive field Hc yields an overall magnetization
M =∫
∞
0
∫∞
−∞
M∗(HI ,Hc;H)ν1(HI)ν2(Hc)dHIdHc. (19)
Since different dipoles have different transition points, thismodel leads to a smooth transition in the value of M as theapplied field H is changed. This aspect of the model is sup-ported by experimental results. Unlike a simple relay (Figure1) or Schmitt trigger (Figure 4), the input/output diagramsof smart materials (see Figures 2 and 18) do not possess asharp transition. As for magnetostrictives, the hysteretic be-haviour in shape memory alloys and piezo-electrics can beexplained by the fact that the equilibrium state minimizesa non-convex energy potential, yielding a model similar instructure to (19).
The above model is a special type of Preisach model [1],a popular class of models for smart materials. In a Preisachmodel, the model is considered to be composed of an infiniteset of simple relays such as that in Figure 1. The centre sand width r of the relays varies, and a weight function µ(r,s)incorporates the relative weighting of each relay R(r,s;H).This leads to a model of the form
M =∫
∞
0
∫∞
−∞
R(r,s;H)µ(r,s)dsdr (20)
where R =±1 is the output of a simple relay (Figure 1) cen-tred at s with width r and history H. By connecting r withHc and s with HI , there are clear similarities between (19)and (20). A comparision in the context of Terfonel-D can befound in [32].
In the model (20) (or (19)) relays (or dipoles) in the +1state are separated from the relays at−1 by a boundary curveψ(t,r) in the r− s plane. The operator (20) can be rewritten
M = 2∫
∞
0
∫ψ(t,r)
0µ(r,s)dsdr+w0 (21)
where
w0 =∫
∞
0
∫ 0
−∞
µ(r,s)dsdr−∫
∞
0
∫∞
0µ(r,s)dsdr.
It has been shown that the Preisch model (21) with theboundary ψ(t,r) as the state is a dynamical system [35]. Al-though there is no dynamics in this model, the state tran-sition operator associated with the state ψ(t,r) satisfies therequired axioms including causality and the semigroup prop-erty. However, unlike typical dynamical systems, this systemis always in equilibrium. Time-dependence only appears im-plicitly in the input variable H(t). For all constant inputs H,any solution is an equilibrium solution.
Alternatively, the boundary function can be writtenψ(t,r) = Fr[H](t) where F is the play operator with widthr [1]. Thus, the system can be written as an infinite-dimensional system where the state is the state of the familyof play operators obtained as width r varies.
Since the models (19) and (21) are static, it is straight-forward to show that they are rate-independent. Like theplay operator, these models are hysteresis operators. The factthat there are no dynamics and that all solutions are equilib-rium solutions reflects the assumption that magnetization isalways at its equilibrium value. Since thermodynamic equi-librium is reached much faster than the field can be varied,this assumption is accurate under certain conditions. Effi-cient methods using the static operator (19) or (21) are usedin simulations.
Rate dependence can often be observed in smart mate-rials. For instance, in magnetic materials, thermal activationcan lead to a dipole “jumping” from one equilibrium pointto another. Unless thermal effects are small and the cor-responding time constant small compared to the input fre-quency, this needs to be considered. This is the basis of thehomogenized energy model [6] and also the model in [17].See also [36] for a similar approach to modelling of shapememory alloys. Equation (19) is the limiting case of thismodel where these effects are neglected. Furthermore, othereffects such as heating dynamics and mechanical dynamicsinteract with the thermodynamics described above. For ex-ample, heating of shape memory alloys is generally accom-plished through applying a current. Heating of the materialleads to phase transition and an associated change in strain.The rate at which the material is heated affects the resultingphase change. In magnetostrictive materials, a quickly vary-ing current causes a moving magnetic field and can lead to aninduction of the current source into a surrounding conductoraround the magnetostrictive solid. This affects the magneticfield seen by the material and leads to observation of ratedependence. Including a model for the dynamics of this pro-cess, along with a static model for the hysteresis addressesthis effect; see for example, [37].
Another approach to modelling the behaviour of smartmaterials is to derive the dynamical equations using thermo-dynamic principles. One example of this is the Falk par-tial differential equation model for shape memory alloys [1].

There is little experimental verification available for thismodel. However, it does agree qualitatively with experimen-tal data [38], producing plots that display loops and rate in-dependence for standard inputs with low frequencies.
7 Inelastic springsIn the classic Hooke’s law, the force of a deformed
spring is linearly proportional to the displacement: F =−kx.However, many materials do not display this linear elasticbehaviour. The Bouc-Wen model [39] has been used to de-scribe inelastic behaviour [40] in a number of applications,including caissons [41], bridge pilings [42] and magnetorhe-ological dampers [43]. A version of the Bouc-Wen model,the Dahl model, has been used to describe friction in severalcontexts [44, 45].
The Bouc-Wen model, with input x and output Φ, is
z(t) = D−1(Ax(t)−β|x(t)||z|n−1z− γx(t)|z(t)|n
),
Φ(x,z) = αkx(t)+(1−α)Dkz(t),z(0) = z0.
(22)The variable z is an internal state that represents the “mem-ory” of the spring. The real parameters D > 0, A, γ, β, k > 0and 0≤ α < 1 and n≥ 1 are chosen to fit experimental data.If A > 0 and −β < γ ≤ β then the output Φ is bounded forbounded x [39]. As mentioned above, the Bouc-Wen modelis frequently used as a model for a nonlinear spring or fric-tion and is thus often found combined with a second-ordersystem that represents the structure or system involved; forinstance,
mx(t)+dx(t)+Φ(x,z) = f (t)
where m indicates mass, d damping, and f (t) represents anyexternal forces.
To determine equilibrium points for the Bouc-Wenmodel, consider a constant input (x(t) = 0). Then z(t) = 0for any value of z and there is a continuum of equilibriumpoints. This is similar to the situation for the play, Preisachand homogenized energy models discussed in sections 5 and6.
The input-output behaviour of a Bouc-Wen model is il-lustrated in Figures 20. The looping behaviour typical ofhysteretic systems is apparent in Figure 20b. The systemalso appears to be rate-independent, at least at the frequen-cies used in the simulations.
To determine whether the differential equations (22) de-scribe a rate-independent system, we use Definition 1. Letτ and t be two time-scales related by a time transformationτ = ϕ(t). Recall that for any time transformation, ϕ(t) > 0.Let the state and output of (22) with input x(t) be z(t) andΦ(t) respectively and similarly, let the state and output withinput x(ϕ(t)) be zϕ(t) and Φϕ(t). We need to show that
Φϕ(t) = Φ(ϕ(t)). For simplicity, we let D = 1 in (22).
zϕ(t) = A dxdτ
ϕ(t)−β| dxdτ|ϕ(t)|zφ(t)|n−1zϕ(t)− γ
dxdτ
ϕ(t)|zϕ(t)|n,=(A dx
dτ−β| dx
dτ||zϕ(t)|n−1zϕ(t)− γ
dxdτ|zϕ(t)|n
)ϕ(t)
= dzdτ
ϕ(t),zφ(0) = z0.
It follows that
zϕ(t) = z(ϕ(t)),
and so
Φϕ(t) = αkx(ϕ(t))+(1−α)kz(ϕ(t)),= Φ(ϕ(t)).
Thus, the Bouc-Wen model (22) describes a rate-independentoperator x→Φ. Since it is clearly causal, it describes a hys-teresis operator. Although the Bouc-Wen model is useful formodelling some types of friction, other situations are betterdescribed by different models [46–50, e.g.].
8 ConclusionsA number of examples from different contexts that dis-
play typical hysteretic behaviour have been discussed in thispaper. The examples come from quite different physicalapplications, but they all display the loops typical of hys-teretic behaviour in their input-output graphs. The modelsdiscussed here can be put into two groups.
The first group of models are the differential equationsused to model the Schmitt trigger, cellular signaling and abeam in a magnetic field. These systems all possess, for arange of constant inputs, several stable equilibrium points.Also, the rate at which the system moves to equilibrium isgenerally considerably faster than the rate at which the in-put is changed. Such systems will initially be in one equi-librium, and will tend to stay at that equilibrium point asthe input is varied. Varying the input to the point that thisequilibrium point disappears causes the system to move tothe second equilibrium point. When this move to the newequilibrium happens much faster than the time scale of thesystem, this change appears instantaneous and the system isonly observed in equilibrium. If the system is only observedin equilibrium changes in the input rate do not affect the out-put and such a system can be said to be rate-independent.If the input rate is increased to become comparable with thesystem time scale, or if there are other effects on the sys-tem, such as thermal dynamics, then rate dependence will beobserved.
The second group of models is truly rate-independent.This includes the play operator, the Preisach model for smartmaterials and the Bouc-Wen model for inelastic springs.These models rely on a equilibrium description of the sys-tem and have input-output maps that are independent of the

input rate. The validity of these models in describing the ac-tual physical situation relies on the underlying assumptionthat the internal dynamics in the system are much faster thanthe rate at which inputs are varied, and also that other tran-sient effects, such as thermal activation, can be neglected.Since the model is an equilibrium description, any solutionof the equations with a constant input is an equilibrium so-lution. These models possess a continuum of equilibriumpoints. The assumption that the system is always in equilib-rium is a simplification of the dynamics. However, in manysituations, this simplication is reasonable and allows for effi-cient simulations.
This analysis gives a reason for why hysteretic systemscan be difficult to control. Controllers for nonlinear systemsare often designed using a linearization of the system aboutan equilibrium point. This approach is useful in applicationswhere the system operates near an equilibrium point. How-ever, under normal conditions, where hysteresis is apparent,hysteretic systems are operated around different equilibriumpoints. Controllers based on a linearization around a partic-ular operating point will not generally be effective.
It should be clear now that hysteresis is a phenomenondisplayed by forced dynamical systems that have severalequilibrium points; along with a time scale for the dynam-ics that is considerably faster than the time scale on whichinputs vary. There may be other dynamic effects that lead toa hysteretic system displaying rate dependence under normaloperation; see for instance the discussion of smart materialsin section 6. However, the essential feature of movement toequilibrium on a time-scale faster than that of the input rateremains. This suggests the following definition.
Definition 3. A hysteretic system is one which has (1) mul-tiple stable equilibrium points and (2) dynamics that are con-siderably faster than the time scale at which inputs are var-ied.
Thus, hysteresis can be regarded as a property of a dy-namical system and its operation, rather than a particularclass of systems. An understanding of hysteretic systems canbe obtained by an analysis of the multistability displayed bythem.
AcknowledgementsThe author is grateful to Brian Ingalls and Ralph Smith
for useful suggestions on a draft of the manuscript.
References[1] Brokate, M., and Sprekels, J., 1996. Hysteresis and
phase transitions. Springer, New York.[2] Gardner, T. S., Cantor, C. R., and Collins, J. J., 2000.
“Construction of a genetic toggle switch in escherichiacoli”. Nature, 403, January, pp. 339–342.
[3] Kennedy, M. P., and Chua, L. O., 1991. “Hysteresis inelectronic circuits: A circuit theorist’s perspective”. In-ternational Journal of Circuit Theory and Applications,19, pp. 471–515.
[4] Mayergoyz, I., 2003. Mathematical Models of Hystere-sis and their Applications. Elsevier.
[5] Moon, F., and Holmes, P. J., 1979. “A magnetoelas-tic strange attractor”. Journal of Sound and Vibration,65(2), pp. 275–296.
[6] Smith, R. C., 2005. Smart material systems: model de-velopment. Frontiers in Applied Mathematics. Societyof Industrial and Applied Mathematics, Philadelphia.
[7] Ewing, J. W., 1885. “Experimental researches in mag-netism”. Transactions of the Royal Society of London,176, pp. 523–640.
[8] Merriam-Webster, 2012. online dictionary.http://www.merriam-webster.com/.
[9] Brokate, M., 1994. “Hysteresis operators”. In Phasetransitions and hysteresis, A. Visintin, ed. Springer-Verlag, pp. 1–38.
[10] Visintin, A., 1994. Differential Models of Hysteresis.Springer-Verlag, New York.
[11] Gorbet, R. B., Wang, D. W. L., and Morris, K. A., 1998.“Preisach model identification of a two-wire SMA ac-tuator”. In Proceedings of the IEEE International Con-ference on Robotics and Automation, Vol. 3, pp. 2161–7.
[12] Logemann, H., Ryan, E. P., and Shvartsman, I., 2007.“Integral control of infinite-dimensional systems inthe presence of hysteresis: an input-output approach”.ESAIM - Control, Optimisation and Calculus of Varia-tions, 13(3), pp. 458–483.
[13] Logemann, H., Ryan, E. P., and Shvartsman, I., 2008.“A class of differential-delay systems with hysteresis:asymptotic behaviour of solutions”. Nonlinear Analy-sis, 69(1), pp. 363–391.
[14] Ilchmann, A., Logemann, H., and Ryan, E. P., 2010.“Tracking with prescribed transient perfromance forhysteretic systems”. SIAM J. Control and Optimiza-tion, 48(7), pp. 4731–4752.
[15] Valadkhan, S., Morris, K. A., and Khajepour, A., 2010.“Stability and robust position control of hysteretic sys-tems”. Robust and Nonlinear Control, vol. 20, pp. pg.460–471.
[16] Oh, J., and Bernstein, D. S., 2005. “Semilinear duhemmodel for rate-independent and rate-dependent hystere-sis”. IEEE Transactions on Automatic Control, 50(5),pp. 631–645.
[17] Bertotti, G., 1998. Hysteresis in Magnetism. AcademicPress.
[18] Macaki, J. W., Nistri, P., and Zecca, P., 1993. “Math-ematical models of hysteresis”. SIAM Review, 35(1),pp. 94–123.
[19] Schmitt, O. H., 1938. “A thermionic trigger”. Journalof Scientific Instruments, 15(1), pp. 24–26.
[20] Harkness, J., 2002. “A lifetime of connections: OttoHerbert Schmitt, 1913-1998”. Physics in Perspective,4, pp. 456–490.
[21] Sedra, A. S., and Smith, K. C., 1982. MicroelectronicCircuits. Holt Rinehart and Wilson.
[22] Khalil, H. K., 2002. Nonlinear Control Systems.Prentice-Hall.

[23] Cherry, J. L., and Adler, F. R., 2000. “How to makea biological switch”. Journal of Theoretical Biology,2003, pp. 117–133.
[24] Angeli, D., and Sontag, E., 2003. “Monotone controlsystems”. IEEE Transactions on Automatic Control,48(10), pp. 1684–1699.
[25] Angeli, D., and Sontag, E., 2004. “Multi-stability inmonotone input/output systems”. Systems and ControlLetters, 51(3-4), pp. 185–202.
[26] Angeli, D., Ferrell, J. E., and Sontag, E. D., 2004.“Detection of multistability, bifurcations, and hystere-sis in a large class of biological positive-feedback sys-tems”. Proceedings of the National Academy of Sci-ence, 101(7), pp. 1822–1827.
[27] Laurent, M., and Kellershohn, N., 1999. “Multistabil-ity: a major means of differentiation and evolution inbiological systems”. Trends Biochem. Sci., 24, pp. 418–422.
[28] E.Kurt, 2005. “Nonlinear responses of a magnetoelas-tic beam in a step-pulsed magnetic field”. NonlinearDynamics, 45, pp. 171–182.
[29] Guckenheimer, J., and Holmes, P., 1983. NonlinearOscillations, Dynamical Systems, and Bifurcations ofVector Fields. Springer-Verlag.
[30] Bowong, S., Kakmeni, F. M., and Dimi, J. L., 2006.“Chaos control in the uncertain duffing oscillator”.Journal of Sound and Vibration, 292(3-5), pp. 869–880.
[31] Nijmeijer, H., and Berkhuis, H., 1995. “On Lyapunovcontrol of the Duffing equation”. IEEE Transactions onCircuits and Systems, 42(8), pp. 473–477.
[32] Valadkhan, S., Morris, K. A., and Khajepour, A., 2009.“A review and comparison of hysteresis models formagnetostrictive materials”. Journal of Intelligent Ma-terial Systems and Structures, 20(2), pp. 131–142.
[33] Smith, R. C., Dapino, M. J., and Seelecke, S., 2003.“Free energy model for hysteresis in magnetostrictivetransducers”. Journal of Applied Physics, 93(1), Jan-uary, pp. 458–466.
[34] Valadkhan, S., Morris, K. A., and Shum, A., 2010. “Anew load-dependent hysteresis model for magnetostric-tive material”. Smart materials and structures, 19(12),pp. 1–10.
[35] Gorbet, R. B., Morris, K. A., and Wang, D. W. L.,1998. “Control of hysteretic systems: a state-space approach”. In Learning, control, and hy-brid systems, Y. Yamamoto, S. Hara, B. A. Francis,and M. Vidyasagar, eds. Springer-Verlag, New York,pp. 432–451.
[36] Achenbach, M., 1989. “A model for an alloy withshape memory”. International Journal of Plasticity, 5,pp. 371–395.
[37] Tan, X., and Baras, J., 2004. “Modelling and control ofhysteresis in magnetostrictive actuators”. Automatica,40, pp. 1469–1480.
[38] Vainchtein, A., 2002. “Dynamics of non-isothermalmartensitic phase transitions and hysteresis”. Inter-national Journal of Solids and Structures, 39(13-14),pp. 3387–3408.
[39] Ikhouane, F., and Rodeller, J., 2007. Systems with Hys-teresis: Analysis, Identification and Control using theBouc-Wen model. Wiley.
[40] Sivaselvan, M. V., and Reinhorn, A. M., 2000. “Hys-teretic models for deteriorating inelastic structures”.Journal of Engineering Mechanics, 126(6), pp. 633–640.
[41] Gerolymos, N., and Gazetas, G., 2006. “Developmentof Winkler model for static and dynamic response ofcaisson foundations with soil and interface nonlinear-ities”. Soil Dynamics and Earthquake Engineering,26(5), pp. 363–376.
[42] Badoni, D., and Makris, N., 1996. “Nonlinear re-sponse of single piles under lateral inertial and seismicloads”. Soil Dynamics and Earthquake Engineering,15, pp. 29–43.
[43] Yi, F., Dyke, S. J., Caicedo, J. M., and Carlson, J., 2001.“Experimental verification of multi-input seismic con-trol strategies for smart dampers”. Journal of Engineer-ing Mechanics, 127(11), pp. 1152–1164.
[44] Awrejcewicz, J., and Olejnik, P., 2005. “Analysis ofdynamic systems with various friction laws”. AppliedMechanics Reviews, 58(6), pp. 389–410.
[45] Bastien, J., Michon, G., Manin, L., and Dufour, R.,2007. “An analysis of the modified Dahl and Masingmodels: application to a belt tensioner”. Journal ofSound and Vibration, 302, pp. 841–864.
[46] Campbell, S. A., Crawford, S., and Morris, K. A., 2008.“Friction and the inverted pendulum stabilization prob-lem”. Journal of Dynamic Systems, Measurement andControl, 130(5), pp. 054502–1–054502–7.
[47] Drincic, B., and Bernstein, D. S., 2011. “A Sudden-Release Bristle Model that Exhibits Hysteresis andStick-Slip Friction”. In 2011 American Control Con-ference, IEEE, pp. 2456–2461. San Francisco, USA.
[48] Freidovich, L., Robertsson, A., Shiriaev, A., and Jo-hansson, R., 2010. “LuGre-model-based friction com-pensation”. IEEE Transactions on Control SystemsTechnology, 18(1), pp. 194–200.
[49] Marton, L., and Lantos, B., 2009. “Control of mechan-ical systems with Stribeck friction and backlash”. Sys-tems Control Lett., 58(2), pp. 141–147.
[50] Padthe, A. K., Drincic, B., Oh, J., Rizos, D. D., Fas-sois, S. D., and Bernstein, D., 2008. “Duhem modelingof friction-induced hysteresis”. Control Systems Mag-azine, 28(5), pp. 90–107.
-1
Rr,s
u(t) s+r s - r
+1
u(ti)
(a)
-1
Rr,s
u(t) s+r s - r
+1
u(ti)
(b)
Fig. 1. Simple relay centred on s with width 2r. The output is unam-biguous for u > s+ r or u < s− r. However, for s− r < u < s+ r,the output depends on whether the input is increasing or decreasing.(a) u(ti)> s+ r, output +1 (b) s− r < u(ti)< s+ r, output±1.
!!"" !#$" !#"" !$" " $" #"" #$" !""
!!"
!#$
!#"
!$
"
$
#"
#$
!"
%&'(&)*+,)&-./01&-.'/2&3+-4*(()056
.7+,*+0)-80+*+203-49&:)&&;6
%<0!=2)&-.7+,*+0)->?;+&)&;2;-4&5(&)2'&3+*@6
, ,! !
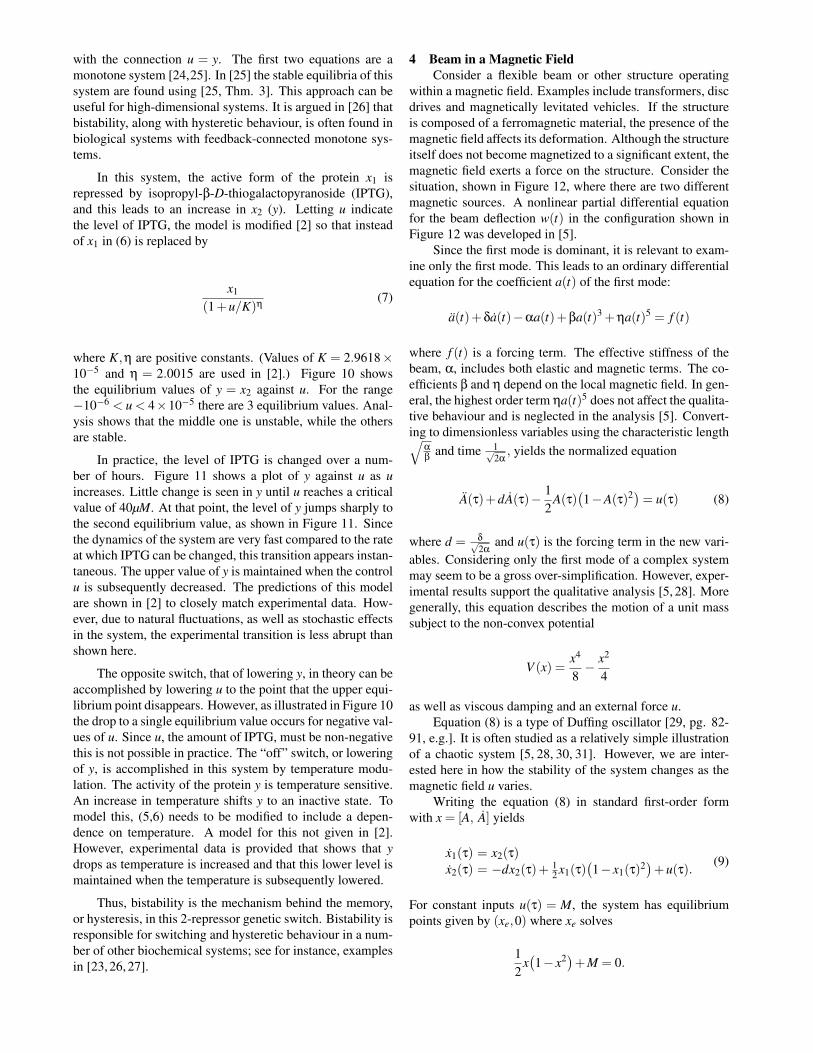
Fig. 2. Temperature-strain curve in a shape memory alloy. Thecurve depends on the temperature history, but not the rate at whichtemperature is changed. c©1998, IEEE. Reprinted, with permission,from [11].
−1 −0.5 0 0.5 1−0.5
0
0.5
u
y
Fig. 3. Loop in the input-output graph of y(t) + 4y(t) = u(t),u(t) = sin(t), t = 0..8
(a)
(b)
Fig. 4. Experimentally measured voltage for Schmitt trigger. Thegraphs are similiar to those of a simple relay (Figure 1). (a) inputfrequency 10 kHz (b) input frequency close to DC. c©1991, Wiley.Reprinted, with permission, from [3].

Ri
Rf
+ +
+
--
-
-
vi vo
(a)
Ri
Rf
+ +
--
-
vi vo
Cp
(b)
Ri
Rf
+
-
vi vo
Cp+
-
v+
-f(v)
(c)
Fig. 5. Schmitt trigger circuit diagrams. (a) standard circuit diagram(b) circuit diagram with input capacitance (c) equivalent circuit to (b)Inclusion of the input capacitance (shown in (b) and (c)) leads to adifferential equation model that correctly predicts the response of thecircuit. c©1991, Wiley. Used, with permission, from [3].
]−6 −4 −2 0 2 4 6−6
−4
−2
0
2
4
6
vi
vo
−6 −4 −2 0 2 4 6−6
−4
−2
0
2
4
6
vi
vo
(b)
Fig. 6. Simulation of differential equation (3) for Schmitt trigger withthe same capacitor initial condition v(0) =−1 and different periodicinputs. The response is similar to that of a simple relay and is inde-pendent of the frequency of the input. (a) Input vi(t) = sin(t) for 7s(b) Input vi(t) = sin(10t) for .7s . (Parameter values Ri = 10kΩ,R f = 20kΩ, A = 105, E = 4V , Cp = 15 pF . )

−3 −2 −1 0 1 2 3−2
−1
0
1
2
3
4x 10
−4
g
v
Fig. 7. g(vi,v) (see (2)) as a function of v with input voltage vi = 1.At this input voltage there are 3 zeros of g and hence the trigger has3 equilibrium points. The middle zero () is an unstable equilibriumwhile the other two zeros () are stable equilibria. For larger valuesof vi the graph is higher and for vi > 2 there is only 1 zero of g andhence only 1 equilibrium point. Similarly, for smaller values of vi thegraph is lower and if vi <−2 there is only 1 equilibrium point. (Sameparameter values as in Figure 6. )
−5 0 5−8
−6
−4
−2
0
2
4
6
8
vi
vo
Fig. 8. Output voltage vo as a function of input voltage vi for theSchmitt trigger. (See (1, 2).) For −2 < vi < 2 there are 2 possibleoutputs due to two stable equilibrium values of the capacitor voltage.(Same parameter values as in Figure 6. )
−10 −5 0 5 10−10
0
10
20
30
40
50
v
(a)
−10 −5 0 5 10−10
−5
0
5
10
15
20
25
30
v
(b)
−10 −5 0 5 10−10
−5
0
5
10
15
20
25
30
v
(c)
−10 −5 0 5 10−10
−5
0
5
10
15
20
25
30
v
(d)
Fig. 9. Lyapunov function (4) for Schmitt trigger (3) with differentinput voltages vi as vi increases from −2vcrit to vcrit and then de-creases to 0. The arrow indicates the equilibrium capacitor voltagev. It remains at an equilibrium point until vi changes enough that theLyapunov function no longer has a minimum at that point. (a) Inputvoltage vi = −2vcrit . There is one equilibrium voltage. (b) Inputvoltage increases to vi = 0. There are now 2 minima; v remainsat the left-hand minimum. (c) Input voltage increases to vi = vcrit .The left-hand minimum disappears; v moves to the only minimum.(d) Input voltage decreases to vi = 0. There are again two minimaof the Lyapunov function; v remains at the current minimum. (Sameparameter values as in Figure 6. )

Fig. 10. Equilibrium value of output y (concentration of protein x2) at different values of the input IPTG (u). There are 3 equilibriumvalues if−10−6 < u< 4×10⁻⁵. The middle one is unstable, whilethe other two equilibria are stable. (See (5,6,7). Parameter values ofα1 = 156.25, β1 = 2.5, α2 = 15.6, β2 = 1, K = 2.9618×10⁻⁵
and η = 2.0015 from [2] .)
0 0.2 0.4 0.6 0.8 1
x 10−4
0
2
4
6
8
10
12
14
16
u
y
Fig. 11. Output y (concentration of x2 ) as u is slowly increased.Note sharp transition to new equilibrium point. (See (5,6,7). Sameparameter values as in Figure 10. )
beam
magnets
u(t)
Fig. 12. Beam in a magnetic field with two magnetic sources
Fig. 13. The equilibrium points of beam (9) in a two-source mag-netic field M are the roots of 1
2 x(1− x2) +M = 0. For |M| <1
3√
3≈ 0.2 there are 3 solutions of f (x) = M while for larger val-
ues of M there is only one solution. Hence for small amplitudesof the magnetization there are 3 equilibrium points while for largeramplitudes there is only 1 equilibrium point. When there are 3 equi-librium points, the middle point is unstable while the outer points arestable.

−0.2 −0.1 0 0.1 0.2−1.5
−1
−0.5
0
0.5
1
1.5
u
A
−0.2 −0.1 0 0.1 0.2−1.5
−1
−0.5
0
0.5
1
1.5
u
A
Fig. 14. Input-output diagram for magneto-elastic beam (9) with in-put 1
4 sin(ωτ), with different frequencies ω. Looping behaviour asthe state moves between different equilibrium points is evident. (a)ω = 10−5 (· · ·), 5×10⁻⁵ (−−), 10−4 (−) . The three curves areindistinguishable, indicating that the system is rate-independent atlow frequencies of the input. (b) ω = 5×10⁻⁴ (· · ·), 10−3 (−−),10−2 (−) . At these higher frequencies, rate dependence is appar-ent.
Fig. 15. Gears, showing mechanical play(http://www.sfu.ca/adm/gear.html, used by permission, RobertJohnstone, SFU). Since the gears are not perfectly meshed, whenone gear turns there is a period of time when the driven gear isstationary before it engages and is turned by the first gear.
w(t)
u(t)-r
2r
Fig. 16. Backlash, or linear play. The rod with position w(t) ismoved by a cart of width 2r with centre position u(t). As long asthe rod remains within the interior of the cart, the rod does not move.Once one end of the cart reaches the rod, the rod will move with thecart.
−5 0 5−4
−3
−2
−1
0
1
2
3
4
u
w
(a)
0 2 4 6 8 10−5
0
5
t
(b)
Fig. 17. Play operator with play r = 2. (a) input-output diagram,static model (12) and dynamic model (13). (a = 1000 for dynamicmodel) The graphs of the dynamic and static models are indistin-guishable. (b) input u (· · ·) and output w (−) Note that w remainsconstant after a change in sign of u until the difference |w−u|= 2.

−40 −30 −20 −10 0 10 20 30 40−600
−400
−200
0
200
400
600
Magnetic Field H (kA/m)
Magnetization M
(kA
/m)
Fig. 18. Magnetization versus magnetic field for a magnetostrictiveactuator [32, used with permission]. The outer, or major, loop is ob-tained by increasing the input magnetic field to its maximum valueand then subsequently decreasing it. The inner loops are obtainedby increasing the input to an intermediate value and then decreasing.
G
M
(a) (a)
G G
MM
(b) (b)
G G
M M
(c) (c)
Fig. 19. Qualitative behaviour of Gibb’s energy for a magnetic dipoleas H is varied. (a) Gibbs energy when H0 = 0. There are two equi-librium points, M∗− and M∗+. In this diagram, the dipole is at M∗−.(b) Gibbs energy after increasing H0 where there are still two equi-librium points. The dipole remains at M∗−. (c) If H0 is further in-creased, eventually only one minimum exists. The dipole moves tothe remaining minimum, M∗+.
0 5 10 15
−10
−5
0
5
10
t
x
(a)
0 5 10 15−6
−4
−2
0
2
4
6
t
Φ
(b)
−10 −5 0 5 10−6
−4
−2
0
2
4
6
x
Φ
(c)
Fig. 20. Response of Bouc-Wen model (22). (a) Input x(t) withvarying frequency (b) output Φ(t) for input shown in (a) . Only thescale, not the shape of the curve, changes as the input frequencychanges. (c) Φ(t) versus input x(t) shown in (a) . The curveforms a single loop, reflecting rate independence of the model. (Pa-rameter values are those used in identification of a magnetorheo-logical damper in [43]: D = 1, n = 1, A = 120, γ = 300cm−3,β = 300cm−1, α = 0.001, k = 27.3Ns/cm. )
List of Figures1 Simple relay centred on s with width 2r.
The output is unambiguous for u > s+ r oru < s− r. However, for s− r < u < s+ r,the output depends on whether the input isincreasing or decreasing. (a) u(ti) > s + r,output +1 (b) s− r < u(ti) < s+ r, output±1. . . . . . . . . . . . . . . . . . . . . . . 12
2 Temperature-strain curve in a shape memoryalloy. The curve depends on the temperaturehistory, but not the rate at which temperatureis changed. c©1998, IEEE. Reprinted, withpermission, from [11]. . . . . . . . . . . . . 12
3 Loop in the input-output graph of y(t) +4y(t) = u(t), u(t) = sin(t), t = 0..8 . . . . . 12
4 Experimentally measured voltage forSchmitt trigger. The graphs are similiarto those of a simple relay (Figure 1). (a)input frequency 10 kHz (b) input frequencyclose to DC. c©1991, Wiley. Reprinted, withpermission, from [3]. . . . . . . . . . . . . . 12
5 Schmitt trigger circuit diagrams. (a) stan-dard circuit diagram (b) circuit diagram withinput capacitance (c) equivalent circuit to (b)Inclusion of the input capacitance (shown in(b) and (c)) leads to a differential equationmodel that correctly predicts the response ofthe circuit. c©1991, Wiley. Used, with per-mission, from [3]. . . . . . . . . . . . . . . 13
6 Simulation of differential equation (3) forSchmitt trigger with the same capacitor ini-tial condition v(0) = −1 and different peri-odic inputs. The response is similar to that ofa simple relay and is independent of the fre-quency of the input. (a) Input vi(t) = sin(t)for 7s (b) Input vi(t) = sin(10t) for .7s .(Parameter values Ri = 10kΩ, R f = 20kΩ,A = 105, E = 4V , Cp = 15 pF . ) . . . . . . . 13
7 g(vi,v) (see (2)) as a function of v with inputvoltage vi = 1. At this input voltage thereare 3 zeros of g and hence the trigger has 3equilibrium points. The middle zero () is anunstable equilibrium while the other two ze-ros () are stable equilibria. For larger valuesof vi the graph is higher and for vi > 2 thereis only 1 zero of g and hence only 1 equilib-rium point. Similarly, for smaller values ofvi the graph is lower and if vi < −2 there isonly 1 equilibrium point. (Same parametervalues as in Figure 6. ) . . . . . . . . . . . . 14
8 Output voltage vo as a function of input volt-age vi for the Schmitt trigger. (See (1, 2).)For −2 < vi < 2 there are 2 possible outputsdue to two stable equilibrium values of thecapacitor voltage. (Same parameter valuesas in Figure 6. ) . . . . . . . . . . . . . . . . 14
9 Lyapunov function (4) for Schmitt trigger(3) with different input voltages vi as vi in-creases from −2vcrit to vcrit and then de-creases to 0. The arrow indicates the equi-librium capacitor voltage v. It remains atan equilibrium point until vi changes enoughthat the Lyapunov function no longer has aminimum at that point. (a) Input voltagevi = −2vcrit . There is one equilibrium volt-age. (b) Input voltage increases to vi = 0.There are now 2 minima; v remains at theleft-hand minimum. (c) Input voltage in-creases to vi = vcrit . The left-hand mini-mum disappears; v moves to the only min-imum. (d) Input voltage decreases to vi = 0.There are again two minima of the Lyapunovfunction; v remains at the current minimum.(Same parameter values as in Figure 6. ) . . 14
10 Equilibrium value of output y (concentrationof protein x2 ) at different values of the in-put IPTG (u). There are 3 equilibrium val-ues if −10−6 < u < 4× 10⁻⁵. The middleone is unstable, while the other two equilib-ria are stable. (See (5,6,7). Parameter valuesof α1 = 156.25, β1 = 2.5, α2 = 15.6, β2 = 1,K = 2.9618×10⁻⁵ and η = 2.0015 from [2].) . . . . . . . . . . . . . . . . . . . . . . . 15
11 Output y (concentration of x2 ) as u is slowlyincreased. Note sharp transition to new equi-librium point. (See (5,6,7). Same parametervalues as in Figure 10. ) . . . . . . . . . . . 15
12 Beam in a magnetic field with two magneticsources . . . . . . . . . . . . . . . . . . . . 15
13 The equilibrium points of beam (9) in a two-source magnetic field M are the roots of12 x(1− x2) +M = 0. For |M| < 1
3√
3≈ 0.2
there are 3 solutions of f (x) = M while forlarger values of M there is only one solution.Hence for small amplitudes of the magneti-zation there are 3 equilibrium points whilefor larger amplitudes there is only 1 equi-librium point. When there are 3 equilibriumpoints, the middle point is unstable while theouter points are stable. . . . . . . . . . . . . 15
14 Input-output diagram for magneto-elasticbeam (9) with input 1
4 sin(ωτ), with differ-ent frequencies ω. Looping behaviour asthe state moves between different equilib-rium points is evident. (a) ω = 10−5 (· · ·),5×10−5 (−−), 10−4 (−) . The three curvesare indistinguishable, indicating that the sys-tem is rate-independent at low frequencies ofthe input. (b) ω= 5×10⁻⁴ (· · ·), 10−3 (−−),10−2 (−) . At these higher frequencies, ratedependence is apparent. . . . . . . . . . . . . 16

15 Gears, showing mechanical play(http://www.sfu.ca/adm/gear.html, usedby permission, Robert Johnstone, SFU).Since the gears are not perfectly meshed,when one gear turns there is a period of timewhen the driven gear is stationary before itengages and is turned by the first gear. . . . . 16
16 Backlash, or linear play. The rod with posi-tion w(t) is moved by a cart of width 2r withcentre position u(t). As long as the rod re-mains within the interior of the cart, the roddoes not move. Once one end of the cartreaches the rod, the rod will move with thecart. . . . . . . . . . . . . . . . . . . . . . . 16
17 Play operator with play r = 2. (a) input-output diagram, static model (12) and dy-namic model (13). (a = 1000 for dynamicmodel) The graphs of the dynamic and staticmodels are indistinguishable. (b) input u(· · ·) and output w (−) Note that w remainsconstant after a change in sign of u until thedifference |w−u|= 2. . . . . . . . . . . . . 16
18 Magnetization versus magnetic field for amagnetostrictive actuator [32, used with per-mission]. The outer, or major, loop is ob-tained by increasing the input magnetic fieldto its maximum value and then subsequentlydecreasing it. The inner loops are obtainedby increasing the input to an intermediatevalue and then decreasing. . . . . . . . . . . 17
19 Qualitative behaviour of Gibb’s energy for amagnetic dipole as H is varied. (a) Gibbs en-ergy when H0 = 0. There are two equilib-rium points, M∗− and M∗+. In this diagram,the dipole is at M∗−. (b) Gibbs energy afterincreasing H0 where there are still two equi-librium points. The dipole remains at M∗−.(c) If H0 is further increased, eventually onlyone minimum exists. The dipole moves tothe remaining minimum, M∗+. . . . . . . . . 17
20 Response of Bouc-Wen model (22). (a) In-put x(t) with varying frequency (b) outputΦ(t) for input shown in (a) . Only the scale,not the shape of the curve, changes as theinput frequency changes. (c) Φ(t) versusinput x(t) shown in (a) . The curve formsa single loop, reflecting rate independenceof the model. (Parameter values are thoseused in identification of a magnetorheologi-cal damper in [43]: D = 1, n = 1, A = 120,γ = 300cm−3, β = 300cm−1, α = 0.001, k =27.3Ns/cm. ) . . . . . . . . . . . . . . . . . 17