Embed Size (px)
Citation preview
What Do We Expect from Our Friends?∗
Stephen LeiderUniversity of Michigan
Markus M. MobiusHarvard University and NBER
Tanya RosenblatIowa State University
Quoc-Anh DoSingapore Management University
June 1, 2009
Abstract
We conduct a field experiment in a large real-world social network to examine how subjectsexpect to be treated by their friends and by strangers who make allocation decisions in modi-fied dictator games. While recipients’ beliefs accurately account for the extent to which friendswill choose more generous allocations than strangers (i.e. directed altruism), recipients are notable to anticipate individual differences in the baseline altruism of allocators (measured bygiving to an unnamed recipient, which is predictive of generosity towards named recipients).Recipients who are direct friends with the allocator, or even recipients with many commonfriends, are no more accurate in recognizing intrinsically altruistic allocators. Recipient be-liefs are significantly less accurate than the predictions of an econometrician who knows theallocator’s demographic characteristics and social distance, suggesting recipients do not haveinformation on unobservable characteristics of the allocator.
JEL Classification: C73, C91, D64Keywords: dictator games, beliefs, baseline altruism, directed altruism, social networks
∗This paper is partially based on our NBER working paper No. 13135, “How Much is a Friend Worth? DirectedAltruism and Enforced Reciprocity in Social Networks”, from May 2007. We split the NBER working paper intotwo parts – one paper, called “Directed Altruism and Enforced Reciprocity in Social Networks” that focuses onlyon allocators’ choices (including the differences between the anonymous and non-anonymous treatments), and thepresent paper which focuses on recipients’ beliefs. We are grateful to the editor, two anonymous referees, AntoniCalvo-Armengol, Muriel Niederle, Adam Szeidl and seminar participants at the 2004 Econometric Society Summermeetings, 2004 SITE, Max Planck Institute Ringberg Workshop on Social Networks, 2006 North American ESAmeetings, Boston University, New York University, University of Connecticut, Texas A&M, Columbia University,Institute for Advanced Study and University of Michigan for helpful comments. We are particularly indebted toRachel Croson and Al Roth for extremely helpful conversations during the design stage of our experiments. PaulNiehaus and Raphael Schoenle were excellent research assistants. Rosenblat thanks the Federal Reserve Bank ofBoston for its hospitality. We are grateful to the Social Security Administration and the Center for RetirementResearch at Boston College for financial support through a Sandell grant (Mobius, Rosenblat) and to the NSF(Leider).

1 Introduction
Recent research has shown that altruistic preferences are enormously heterogenous: some subjects
behave perfectly selfishly while other subjects aim for equitable or socially efficient allocations.1
In this paper, we analyze whether an agent’s altruistic preferences should be viewed as part of her
private information, or whether it is more appropriate to think of altruism as a publicly observed
characteristic such as gender or age.
Ample anecdotal evidence suggests that individuals invest considerable resources in revealing
altruistic preferences: for example, research institutes, charitable foundations, sport and cultural
facilities are frequently named after their founders. Non-profit organizations have developed vari-
ous mechanisms to allow donors to endow department chairs at universities, assign their names to
library books and other equipment such as chairs and desks or to be listed on a commemorative
plaque for a new building. It is an open question whether this technologies are successful in
revealing agents’ altruism. Should we think of all this ostensible signaling as a separating equilib-
rium of some signaling game as in Benabou and Tirole (2006)? If such a separating equilibrium
is present, then it must be the case that an individuals friends know whether he or she is in fact
altruistic. In particular, the individuals altruism should be reflected in beliefs about the kinds of
allocation decisions he or she would make. If instead people are not aware of which of their friends
are particularly altruistic or particularly selfish, this suggests that such attempts at signaling are
ineffective and that only a pooling equilibrium may be feasible where agents act generously at
times in order to not be revealed as a selfish type.
It is natural to expect that an agent can observe the altruistic preferences of a friend more
easily than the preferences of a stranger. We conduct a large field experiment within a real-world
social network where we measure subjects’ beliefs about the altruism of friends and strangers.2.
In Leider, Mobius, Rosenblat and Do (2009) we show that altruistic preferences in a social net-
work can be decomposed into a baseline altruism component and a directed altruism component.1Andreoni and Miller (2002) first documented that altruistic preferences towards strangers adhere to standard
revealed preference axioms and Fisman, Kariv and Markovits (2007) refine their methodology by increasing thenumber of observations per agent.
2A growing literature in economics has explored learning in social networks; see Calvo-Armengol and Jackson(2004) and DeMarzo, Vayanos and Zwiebel (2003) for recent theoretical contributions and Kremer and Miguel(2007) and Rao, Mobius and Rosenblat (2007) for examples of field experiments on social learning.
2

Baseline altruism describes the intrinsic niceness of a decision-maker. Directed altruism captures
the fact that conditional on the decision-maker’s baseline altruism she will tend to treat friends
better than strangers. In this paper we specifically analyze to what extent agents are aware of
other people’s baseline altruism - in particular, we are interested whether they are aware of the
baseline altruism of their close friends.
In our experiments, we first directly measure the social network of Harvard undergraduates
to identify, for each subject, socially close direct friends, less close friends-of-friends, and socially
distant strangers. We then conduct a series of modified dictator games where allocators make
unilateral allocation decisions for a nameless recipient (a randomly selected participant from the
subject’s dormitory) and, a few days later, for several types of named recipients. Participants
make multiple decisions but are paid for one decision selected at random. Our design allows us
to distinguish between baseline altruism towards nameless recipients and directed altruism that
favors friends over nameless recipients. We find that allocators pass, on average, about 50% more
tokens to friends compared to nameless recipients. Moreover, the amount sent to a nameless
recipient is an excellent predictor of how much the same allocator will send in the future to a
friend: each one-unit increase in nameless allocation translates approximately into a one-unit
increase in allocations to friends. We then measure recipients beliefs of how many tokens different
named allocators will pass to them.3
Our main finding is that subjects are remarkably unaware of the baseline altruism of people
they know – including their close friends. We find that recipients’ beliefs are, on average, very well
calibrated for the population as a whole: they correctly expect that friends pass more tokens than
strangers and the expected average amounts passed are close to the actual amounts. However,
recipients do not incorporate an allocator’s baseline altruism into their prediction: they expect
more tokens from friends than from strangers but they do not expect more tokens from generous
friends compared to selfish friends. For some allocator/recipients pairs we observe both the
allocator’s action for a particular recipient as well as that recipient’s belief for this particular
allocator. We again find that recipients have no private information about allocators’ decisions
except that, on average, they expect more tokens from friends compared to strangers. This is true3While we want to measure the effect of the network structure on beliefs, we never explicitly refer to social
distance in instructions, but rather prompt recipients by the names of allocators.
3

even if allocator and recipient are direct friends or even if they have many friends in common.
Therefore, it appears that recipients have no greater knowledge about allocators’ altruistic
preferences in the social network than the econometrician who has measured the social network
and demographic characteristics of allocators. While recipients correctly expect, on average, that
friends will treat them better than strangers they are unaware of the considerable and stable
heterogeneity in allocators’ preferences.
Our paper builds on a rich experimental literature on prosocial behavior. Most experi-
ments match randomly selected subjects anonymously in the lab4 and are therefore unsuitable
to study the recipient’s beliefs about socially close allocators. A number of studies measure be-
liefs after revealing certain demographic characteristics about allocators such as gender (Slonim
and Garbarino 2008, Aguiar, Branas-Garza, Cobo-Reyes, Jimenez and Miller 2009), ethnicity
(Fershtman and Gneezy 2001) and work place or address (Glaeser, Laibson, Scheinkman and
Soutter 2000). To the best of our knowledge, our study is the first to measure recipients’ beliefs
in a real-world social network. In Leider et al. (2009) we conduct other experiments with the
same subject pool to distinguish directed altruism between socially close subjects from norms of
reciprocity that are supported by the repeated super-game played between subjects in the social
network. In subsequent research, Goeree, McConnell, Mitchell, Tromp and Yariv (2008) use our
design to measure directed altruism in a school network of teenage girls (also see Branas-Garza,
Cobo-Reyes, Paz Espinosa, Jimenez and Ponti (2006) for experimental data with European uni-
versity students). While these studies confirm our findings of directed altruism, they do not
measure beliefs about expected generosity of others. In an important methodological advance,
our experiment was completely web-based. This ensured very high participation rate of 71%,
which was crucial for generating a good social network map, as well as a sufficient number of
matches between direct friends during the course of the experiment.
The rest of the paper is organized as follows. The experimental design is described in section 2.
Section 3 summarizes the main features of the data. In section 4 we show that recipients have no
knowledge of allocators’ altruistic preferences. Section 5 concludes by discussing the implications
of our results and avenues for future research.4See Camerer (2003) for an extensive survey.
4
2 Experimental Design
Our design has two stages: a network measurement stage, and a dictator game stage. Each
allocator in the dictator game stage made multiple allocation decisions for 6 different recipients
but was paid only for one randomly selected decision at the end of the experiment.5 Similarly,
each recipient submitted multiple beliefs for 7 different potential allocators but was paid only for
the accuracy of one of her predictions.
2.1 Network Measurement
To measure the social network, we used a coordination task to provide subjects incentives to
truthfully report their friendships. Each subject listed her 10 best friends and the average amount
of time per week she spends with each of them.6 For each listed friend who also listed the subject,
the subject was paid 50 cents with probability 0.5 if their answers about time spent together
disagree, or with probability 0.75 if they agree. We made the expected payoff (25 or 37.50 cents)
large enough to give an incentive to list their friends truthfully and small enough to discourage
“gaming”. The randomization was included to limit disappointment if a subject was only named
by a few people. To define the social network, we say that two subjects have a direct link if one
of them named the other person. We call this type of social network the “OR-network”.7
2.2 Allocators
After measuring the social network, we randomly assigned each subject the role of allocator or
recipient in the dictator games.8 Each allocator received an e-mail invitation with a link to a
website where she could play modified dictator games with a nameless recipient randomly selected
from the allocator’s dormitory.9 The allocator was asked to divide 50 tokens between herself and5The decisions were selected such that each recipient was also only paid once. This was explained to all
participants.6The choices were 0-30 minutes, 30 minutes to 1 hour, 1-2 hours, 2-4 hours, 4-8 hours or more than 8 hours.7We find similar results when we use the “AND-network”, where a link exists only if both subjects name each
other. The OR-network definition has desirable monotonicity properties: a subject with an above average numberof actual friends will have an above average number of friends in the measured network even when the networksurvey truncates his true network. This is not always true for the AND-network if truncation forces subjects torandomly select from a set of equally close friends.
8In the experimental instructions, we referred to two roles simply as player 1 and player 2.9The allocator is told in the instructions that the recipient was selected from her dormitory.
5
the recipient under three different token-money exchange rates (for the allocator and recipient
respectively). In the first condition giving is efficient, each token is worth 10 cents to the allocator,
but is worth 30 cents to the recipient (an exchange rate of 1:3); in the second condition giving is
neutral, each token is worth 20 cents to the allocator and 20 cents to the recipient (an exchange
rate of 1:1); lastly, in the third condition giving is inefficient, each token is worth 30 cents to the
allocator and only 10 cents to the recipient(an exchange rate of 3:1).
A few days later, all allocators were invited by e-mail to participate in a second round, in
which they are matched with five different named recipients listed using their full real first and
last names: (1) a direct friend (social distance SD = 1), (2) a friend of a friend (SD = 2), (3) a
friend of a friend of a friend (SD = 3), (4) a student in the same staircase/floor who is at least
distance 4 removed from the student (SD ≥ 4), and (5) a randomly selected student from the
same dormitory who falls into none of the above categories.10 In each case, the allocator was
asked to make allocation decisions under the three different exchange rates for each recipient. To
control for experimenter demand effects of presentation, we randomized both the order and the
grouping (by social distance) of subjects’ decisions.
Note that each allocator made 18 decisions (3 decisions for the nameless and 5 named recipi-
ents). All these decisions were anonymous: neither the recipient nor the allocator was told which
of the decisions was selected for payment. On top of this, allocators also made 18 non-anonymous
decisions: they were identical to the anonymous decisions except that both allocator and recipient
were informed if one of these decisions was selected for payment. In this paper we report only on
anonymous decisions, since we want to explain beliefs, and these are the decisions we have beliefs
for.11. The large number of decisions made it very difficult for participants to infer which of her
anonymous decisions was selected for payment.12
10Our selection algorithm used the “AND”-network definition for this step. Since social distance always (weakly)decreases when using the “OR”-social distance definition the number of observations for columns 1 to 4 in tables1 and 2 are not equal.
11In Leider et al. (2009) we examine (and compare) both the anonymous and non-anonymous decisions in orderto explain the determinants of allocator choices.
12While in principle the allocator could reveal her allocation to the recipient after the experiment in the anonymouscase, since the allocator was not told which decision was selected for payment, she would have had to make choiceswith unique payoffs so that she would know which recipient to inform, and remember those choices several weekslater when payments were made.
6

2.3 Recipients
We measured recipients beliefs of how many tokens 5 different named allocators would pass
to them in the anonymous treatment.13 Recipients in the network population received an e-mail
invitation to participate in a single web-based experiment where the recipient was asked to predict
how many tokens, out of 50 total tokens, 5 different allocators (whose real names were presented
to the recipient) would pass to the recipient under each of three exchange rates (1:3, 1:1, and
3:1) in the anonymous treatment. For each recipient we chose the 5 allocators in the same way
as we assigned recipients to allocators: one randomly selected direct friend, one friend of a friend
(SD = 2), one friend of a friend of a friend (SD = 3), a student in the same staircase/floor who
is at least distance 4 removed from the student, and a randomly selected student from the same
dormitory who falls into none of the above categories.14 The recipient was told that at most one
of these 15 decisions would be selected for payment.
For each token above or below the actual allocation, 10 cents were subtracted from the recipi-
ent’s earnings. Therefore, the recipient had incentives to report his median belief (see Mobius and
Rosenblat (2006)). In many lab experiments, beliefs are more commonly elicited using a quadratic
loss function which provides incentives for subjects to reveal mean beliefs (Costa-Gomes and
Weizsacker 2007, Huck 2002). For the sake of keeping the instruction for our online experiment
as simple as possible we opted for an absolute deviation loss function. Since we are primarily
interested in studying how recipients change their beliefs to account for the social distance and
the baseline altruism of different allocators, we are not concerned about this difference.
3 Data Description
3.1 Subject Pool
In December 2003, Harvard sophomores, juniors and seniors at two dormitories were recruited
through posters, flyers, and mail invitation. Experimental earnings were added to the students’13We also asked recipients how many tokens 2 named allocators would pass to 2 other named recipients. Therefore,
each recipients submitted beliefs for 7 different allocator/recipient pairs but only in 5 out of these 7 cases was therecipient himself. We are not using data from the other 2 pairs in this paper.
14Due to this selection procedure, if a recipient was asked to submit a belief for a particular allocator then theallocator did not necessarily submit a decision for that recipient (and vice versa).
7
electronic cash-cards.15 Subjects who logged onto the website were asked to (1) list their best
friends’ names using the coordination task and (2) fill in a basic demographic questionnaire.
Subjects were required to name friends from the two participating dormitories. Subjects were
paid their earnings from the coordination task, plus a flat payment of $10 for completing the
survey. They were also eligible to earn cash prizes in a raffle, adding $3 (on average) in earnings.
In those two dormitories, 569 of the 806 students, or about 71%, participated in the social
network survey. The survey netted 5690 one-way links. The resulting “OR”-network consists of
a single connected component with 802 subjects. Fifty-one percent of subjects in the baseline
survey were women; 49% were men. Thirty-one percent of the subjects were sophomores, 30%
were juniors and 39% were seniors.
The dictator game stage was conducted over a one-week period in May 2004. Half of all
subjects who participated in the coordination stage were randomly selected to be allocators. Out
of 284 eligible allocators invited, 193 participated in round 1 (decisions for nameless recipients)
and 181 participated in round 2 (decisions for named recipients). Participants were representative
of the coordination stage sample composition: 58% were women, 28% were sophomores, 28% were
juniors, and 44% were seniors. The corresponding statistics for recipients are similar.
3.2 Summary Statistics
Table 1 shows the average allocations in the three dictator games. It is apparent that across all
exchange rates allocators’ generosity towards the recipient decreases with social distance. With
a 1:3 exchange rate, allocators pass about 19.19 tokens to a direct friend versus 12.20 tokens to a
recipient at social distance 4. With an exchange rate of 3:1, the allocator passes only 8.03 versus
6.15 tokens, respectively.
We can interpret allocations to nameless recipients as allocators’ baseline or unconditional
generosity, since the allocator has no information about the recipient. Our data replicates the
well-known finding of Andreoni and Miller (2002) and Fisman et al. (2007) that individuals are
highly heterogenous in their unconditional altruism. In particular, we also find that many subjects
are perfectly selfish: in the three exchange rates 28, 46, and 64% of subjects pass zero tokens,15These cards are widely used on campus as a cash substitute, and many off-campus merchants accept the cards.
8
respectively.
Recipients’ beliefs are reported in table 2. Beliefs are fairly accurate and correctly anticipate
the effect of greater social distance16. Beliefs are most accurate when altruism is efficient (1:3
exchange rate). When altruism is inefficient, recipients expect allocators to be somewhat more
generous than they actually are.
4 Results
4.1 Allocator Altruism
We begin by examining the determinants of allocator’s decisions, to obtain an estimate of baseline
and directed altruism. This will provide a benchmark we can later use for comparison with the
recipients’ beliefs. We report the estimates for a simple linear empirical model of altruism in
social networks taken from our earlier paper on allocator decisions (Leider et al. 2009):17
Allocation = α∗demographic characteristics+γ1∗social distance+γ2∗nameless allocation+ε. (1)
The dependent variable is the number of tokens passed by the allocator. The parameter γ1
captures the importance of directed altruism while γ2 captures the importance of the nameless
decision (baseline altruism) in predicting allocations to named recipients.
We exploit the fact that we observe 5 decisions for each allocator which allows us to estimate
equation 1 using random effects. We also use Tobit regressions to take account of the fact that
allocations are bounded below by zero and above by 50.18 We control for the social distance
between allocator and recipient by including dummy variables SD1 (meaning a direct friend)
to SD4 with SD4 as omitted category. The estimated coefficient on SD1 should therefore be
interpreted as the number of extra tokens that the allocator passes to a direct friend compared to16Comparing recipient beliefs to actual allocations with a non-parametric signed-rank test we find significant
differences only for the 3:1 exchange rate with distance 3 (p = 0.007) and distance 4 (p = 0.021), as well asmarginal significance for the 1:1 exchange rate with distance 3 (p = 0.053). For all other comparisons p > 0.20.
17Our model is a natural extension of existing preferences-based altruism models: Andreoni (1990) model altruismas “warm glow”, while Fehr and Schmidt (1999), Bolton and Ockenfels (2000), and Charness and Rabin (2002)focus on preferences over payoff distributions.
18Our results are very similar when we estimate equation 1 using standard random effects or fixed effects GLS.
9

a distant recipient in the anonymous treatment, while the estimated coefficient on SD2 captures
directed altruism towards a friend of friend.
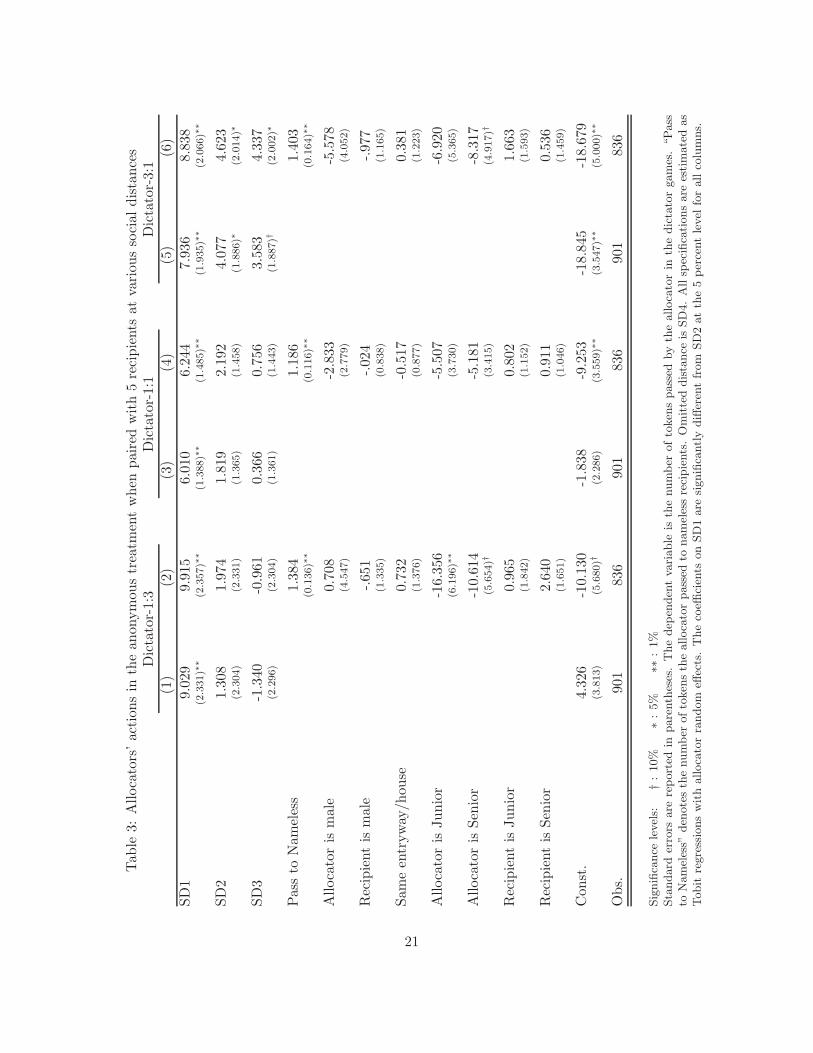
The estimates are reported in table 3. Odd-numbered columns show estimates where we
only control for social distance while even numbered columns include demographic controls for
participants’ age, gender, whether they live in the same entryway as well the allocator’s baseline
altruism to nameless recipients. The two variables that consistently and strongly predict how
generously an allocator treats a recipient in her social network are social distance and generosity
towards nameless recipients.
Observation 1 Allocators who give more to nameless recipients also give more to specific named
recipients. The pass-through is close to 1.
Across all three exchange rates, each one token increase in generosity towards a nameless recipient
is associated with a 1.19 to 1.40 token increase in generosity towards a named recipient. Since
the nameless and the named allocations were elicited several days apart, this continuity indicates
a substantial degree of stability in the heterogeneity of allocators’ altruistic preferences over time.
Moreover, the fact that estimated pass-through from nameless to named allocations is close to 1
vindicates our interpretation of an allocator’s nameless allocation as her baseline altruism.19
Observation 2 Close social ties induce directed altruism. Allocations to friends are at least 50%
higher than allocations to nameless recipients.
Moreover, social distance also matters greatly: allocators are substantially more generous to direct
friends than to less socially close recipients. Generosity decreases quickly and monotonically with
social distance, although the estimated coefficients on SD2 and SD3 are not significantly different
from each other for all games. In terms of magnitudes, allocators pass at least 50% more tokens
to friends than to nameless recipients.
Observation 3 Gender, years in college and geographic proximity do not predict allocation de-
cisions.19D’Exelle and Riedl (2008) find very similar results with a different subject pool and a modified definition of
baseline altruism. They consider village networks in Nicaragua and measure giving to strangers in another villageinstead of giving to a random person from the same social network (as in our paper). Additionally, as in our results,they find that the amount givent to strangers is similar to the amount given to friends-of-a-friend.
10
Interestingly, demographic characteristics have, for the most part, no significant effect: the allo-
cator’s and recipient’s gender, as well as their geographic proximity, have no significant effect on
generosity.20 However, the signs of the estimated gender coefficients of the allocator are consis-
tent with the work of Andreoni and Vesterlund (2001), who found that men are more likely to
exhibit social-surplus maximizing preferences: they are more generous in dictator games when
giving is efficient and less generous when giving is inefficient. College juniors are somewhat more
selfish than are sophomores and seniors; however, most of the coefficients on the class dummies
are insignificant.21
4.2 The Determinants of Recipient Beliefs
We next look to recipient beliefs to examine what factors determine recipient beliefs. Since we do
not observe both an allocator choice and a recipient belief for every pairing, we will first look at the
general pattern of beliefs. One way to consider the accuracy of recipient beliefs given the general
mechanisms that determine generosity is to reframe the previous section as the econometrician’s
predictions based on a model of the dictator game calibrated from allocation choices, knowledge
of the structure of the social network, and demographic characteristics. We can then ask whether
recipients’ beliefs correctly account for social ties and/or the intrinsic generosity of the allocator.
We also exmaine whether recipients are able to make better predictions than the econometrician
(due to any potential private information about unobserved characteristics of the allocator).
We assume that recipients use the same linear model of equation 1 as the econometrician but
we estimate it using recipients’ beliefs instead of allocators’ actions as dependent variable. We
also specify random effects on the recipient level (rather than on the allocator level), since our
experiment provides us with multiple observations for each recipient.
The odd- and even-numbered columns in table 4 report our estimates with and without ad-
ditional covariates. Recipient beliefs are significantly higher for direct friends (SD = 1) than for
strangers, and interestingly beliefs are also significantly higher for friends of friends (SD = 2)20Our experiment includes only a limited number of demographic variables. However, our results are consistent
with the results reported in Goeree et al. (2008) who include a much wider range of demographic variables.21We also ran a version of the even numbered specifications which included dummy variables if the number of
subjects who had listed the allocator or the recipient, respectively, as a friend was higher than the median. Thesewere not significant for any of the three dictator games.
11

when giving is efficient (as well as being marginally significant when giving is neutral or ineffi-
cient). Recipients do not, however, have different beliefs based on the baseline altruism of the
allocator. In order to compare the effect of social distance and allocator type on beliefs to the
effect on giving, we conduct a Wald test whether the coefficient estimates in the beliefs regression
(from table 4) are equal to the closest point in the 95% confidence interval for the corresponding
coefficient from the allocation regression (3).22
Result 1 Recipients beliefs are well calibrated to directed altruism.
The number of extra tokens that recipients expect from their direct friends (SD = 1) is quite
close to the actual number of extra tokens allocators pass to their direct friends - in all cases
the estimated coefficient is within the 95% confidence interval of the allocation estimate. While
recipients are in general too optimistic about friends of friends when giving is efficient or neutral
(expecting the generosity of allocators to increase by almost twice the actual amount), the beliefs
coefficients are within the allocation confidence interval for all six specification. Similarly, the
coefficient for SD = 3 is not significantly different from the allocation estimates (p > 0.65 in
all cases). Thus it appears that recipients are making approximately accurate adjustments to
their beliefs for the strength of the social tie they have with the allocator. In contrast, however,
recipients essentially ignore allocators’ baseline altruism.
Result 2 Recipients are unaware of allocators’ baseline altruism.
In all belief regressions the estimated coefficients on nameless decisions are not only quite close
to zero, they are also significantly different from the allocation estimates (p < 0.001 for all three
exchange rates). Thus, while each token given to a nameless recipient increases actual giving to
named recipients by nearly 1, recipients’ beliefs essentially do not differ at all between allocators.
Thus, while recipients’ do account for the aggregate effect of social distance, they do not seem to be
able to anticipate the individual heterogeneity in baseline altruism. Another way to demonstrate
that recipients are not making sufficient distinctions between their direct friends is to examine, for22We are not aware of another method to more directly test the equality of two coefficients from two Tobit
regressions with different dependant variables. We believe that considering the whole confidence interval is aconservative way of accounting for the precision of the choice estimates.
12
recipients that make predictions for more than one direct friend, whether the predicted allocations
differ as much as they ought to given the distribution of actual allocations. For each recipient
who made a prediction for two or more direct friends we calculate the difference between their
largest prediction and their smallest. Similarly, for each recipient where we observe more than one
allocation from a friend, we calculate the difference between the largest and smallest allocation.
While we do not observe enough recipients with both enough predictions and enough allocations,
we can compare the distributions. For all three dictator games the median difference in beliefs
is much smaller than the median difference in allocations, i.e. a recipients predictions for her
friends are too similar.23 In the 1:3 dictator game the median difference for beliefs was 5 while
the median for allocations was 20 (ranksum test: p < 0.01); for the 1:1 game the median for
beliefs was 5 and for allocations was 24 (p < 0.01) while in the 3:1 game the medians were 3.5 and
12 respectively (p = 0.07). Moreover, for all three games the distribution of differences for actions
first-order stochastically dominates the distribution of differences for beliefs, i.e. the differences
in beliefs are too small throughout the distribution.24
Lastly, as in the allocation estimates, none of the other demographic and geographic covariates
matter except for the allocator’s gender: recipients expect male allocators to be significantly less
generous when giving is neutral (1:1 exchange rate), and especially when giving is inefficient (3:1
exchange rate). Again, this result is consistent with Andreoni and Vesterlund’s (2001) findings.
Moreover, the estimated gender effect is not significantly different than the estimates from the
allocation regression (the estimates are contained in the confidence interval in all cases).
4.3 Accuracy of Recipient Beliefs
Having interpreted the allocation estimates as econometric predictions, one way that we can assess
the overall accuracy of recipient beliefs is to compare the mean squared error between predictions
and action for the econometrician and the recipient, since for 204 out of the 563 matches between23If instead recipients were aware of the allocators’ baseline altruism but simply did not believe that baseline
altruism would affect giving to named recipients, then we ought to observe recipients making substantially differentpredictions for different direct friends.
24We use the stochastic dominance test from Anderson (1996) using 10 equally spaced partitions. For the 1:3DG the test statistic is χ2(9) = 25.1 with p < 0.01; for the 1:1 DG χ2(9) = 24.2 with p < 0.01; for the 3:1 DGχ2(9) = 19.0 with p = 0.03.) Similar results obtain if we instead use the standard deviation in beliefs/allocationsas our measure of differentiation.
13
a specific recipient and an allocator we observe both a prediction and the allocator’s actual
choice. If the recipient were using some knowledge about the specific allocator to make her
prediction that was not available to the econometrician, then we may expect recipient predictions
to be more accurate than the econometrician. However, for all three exchange rates the mean
square error is approximately twice as large for the recipient beliefs as from our fitted model
of allocator behavior25 (MSE(1:3) 448 vs 758; MSE(1:1) 156 vs 280; MSE(3:1) 173 vs 351) - a
significant difference in all cases (p < 0.001 in a signed rank test).26 Moreover, even if we restrict
attention to allocations by direct friends (SD = 1), where the recipient is most likely to have
better information than the econometrician, the recipients still make significantly larger errors
(MSE(1:3) 549 vs 896, p = 0.02; MSE(1:1) 193 vs 297, p = 0.02; MSE(3:1) 238 vs 514, p < 0.01).
For the matches where we observe both a prediction and a choice, we can identify which
matches had the most inaccurate predictions. We regress the absolute difference between predic-
tion and actual choice on social distance and the number of tokens the allocator sent to a nameless
recipient, and report these results in the odd-numbered columns of table 5.
Result 3 Recipients made larger mistakes for highly altruistic allocators, underestimating their
choices.
Across all three dictator games, prediction errors were significantly increasing in the baseline
altruism of the allocator. That is, recipients were much more accurate in prediction the choices
of relatively selfish recipients than relatively altruistic recipients. In particular, when giving
was efficient or neutral subjects were significantly more likely to underestimate (rather than
overestimate) the choice of highly altruistic allocators (p < 0.01 for a signed-rank test of prediction
errors for allocators with the highest quartile of baseline altruism). Conversely, subjects were
significantly more likely to overestimate the allocations of the most selfish allocators in all three
dictator games (For allocators in the lowest quartile of baseline altruism p < 0.01 in all cases).
The effect of social distance on errors is mixed: low social distance leads to significantly larger
errors in the efficient and inefficient dictator games, while it leads to smaller errors when giving
is neutral.25We use the specifications reported in the even-numbered columns which include all the demographic information.26If instead we use the predictions from the odd-numbered columns, which include only social distance, the
recipient beliefs perform similarly poorly.
14
One might expect that recipients are better at observing the behavior, and thus inferring
the preferences, of direct friends compared to socially more distant allocators. Therefore, we
re-estimate our empirical model and include an interaction term between the allocator’s nameless
decision and the social distance dummy SD1. The results are reported in the odd-numbered
columns of table 5 (without demographic and geographic covariates).
Result 4 Stronger social connections do not increase recipients’ awareness of allocator’s baseline
altruism.
We do not find evidence that direct friends make significantly smaller mistakes in predicting
the actions of highly altruistic allocators than strangers do, in fact in two of the specifications the
interaction term is positive.27 Thus it seems that direct friends are not any better at avoiding
errors due to individual heterogeneity in the altruism of allocators.28
If being a direct friend is not a sufficient source of information to successfully identify highly
altruistic allocators, we consider whether other measures of social connection might identify sub-
jects who are aware of individual differences between allocators. As an alternative measure, we
consider maximum network flow, defined as the number of unique paths (of distance two or less)
between the allocator and recipient (Karlan, Mobius, Rosenblat and Szeidl 2009). This measure
captures the number of common friends the two subjects share (plus one if they are also direct
friends) and is also a measure of network closure (Coleman 1990). One may expect that subjects
may be most informed about individuals that they are more densely connected to in their circle
of friends. Therefore, we regress absolute prediction errors on network flow and allocator baseline
altruism; the results are presented in the odd-numbered columns of table 6. For ease in interpret-
ing an interaction between network flow and allocator altruism, in the even-numbered columns we
replace the continuous measure of flow with a dummy variable denoting subjects with a network27While the interaction term is negative (i.e. a smaller increase in errors for altruistic subjects), the large main
effect of being a direct friend means the total effect is positive for all allocators (and significant for allocators up tothe 65th percentile of altruism).
28We also considered whether recipients were more accurate in accounting for the altruism of direct friends whenboth subjects said they spent at least 2-4 hours a week together (compared to recipients who are direct friends ofthe allocator but spend less time together). However, when we regressed prediction errors on a dummy for timespent together, allocator altruism and term interacting time together with altruism, the interaction term was notsignificantly negative for any of the games. While the errors were significantly increasing in baseline altruism onlyfor who spent a lot of time together in the neutral and inefficient games, there was also a negative main effect onerrors of the time spent together. There overall effect was not consistent across games.
15
flow at least as large as the median flow (among pairs with non-zero flow). In all specifications
prediction errors are significantly increasing in the allocators’ baseline altruism. Errors do not
significantly differ based on the network flow between the allocator and recipient, nor are the
errors of high flow recipients affected less by the allocator’s baseline altruism.29 Thus it appears
that even subjects who have dense social connections with the allocator are not aware of which
allocators are highly altruistic.
5 Conclusion
In this paper we ask subjects how they expect to be treated by other specific individuals in their
social network who make allocation decisions in dictator games. In comparing these beliefs to
the actual decisions made by the allocator, subjects appear remarkably unaware of even their
direct friends’ altruism. While they take social distance into account when forming expectations
(correctly anticipating that friends are more generous than strangers) they ignore baseline altruism
(allocations to unnamed recipients) which is an excellent predictor of actual allocation choices
within the social network. Thus it may be more likely that individuals prefer to interact with
friends in anticipation of benefiting from directed altruism, rather than because they want to deal
with people they know to generally be very generous.
Additionally, our results put one piece of our motivating evidence in a different light: we ob-
served in the introduction that non-profits often allow donors to attach their name to scholarships,
endowments or buildings which might suggest that signaling is also a common phenomenon in
social networks. Instead, these organizations might provide this type of “signaling service” pre-
cisely because it is difficult for individuals to signal their altruistic preferences to other members
of their social network.
Our findings also provide some preliminary evidence against the notion that friends actively
seek out altruistic friends. Such a strategy would require knowledge about other peoples’ baseline
altruism. At the same, we document in Leider et al. (2009) that friends do cluster by baseline
altruism (i.e. subjects who are altruistic allocators are more likely to have friends who are altruistic29While the interaction term for the efficient dictator game is negative, the combined coefficient is still significantly
positive.
16
allocators, and selfish allocators are more likely to be friends with selfish allocators). These two
observations suggest an interesting question for future research: do our friends shape our social
preferences (treatment effect), or do we seek out friends with similar social preferences (selection
effect)? While the results of this paper point in the direction of the former, direct evidence for
the treatment effect could help explain to what extent the distribution of preferences, as observed
in the lab by Andreoni and Miller (2002) and Fisman et al. (2007), is endogenous.
References
Aguiar, Fernando, Pablo Branas-Garza, Ramon Cobo-Reyes, Natalia Jimenez, andLuis M. Miller, “Are women expected to be more generous?,” Experimental Economics,March 2009, 12 (1), 93–98.
Anderson, Gordon, “Nonparametric Tests of Stochastic Dominance in Income Distributions,”Econometrica, September 1996, 64 (5), 1183–1193.
Andreoni, James, “Impure Altruism and Donations to Public Goods: A Theory of Warm-GlowGiving,” Economic Journal, 1990, 100 (401), 464–477.
and John Miller, “Giving According to GARP: An Experiment on the Consistency ofPreferences for Altruism,” Econometrica, March 2002, 70 (2), 737–753.
and Lise Vesterlund, “Which is the Fair Sex? Gender Differences in Altruism,” QuarterlyJournal of Economics, February 2001, 116 (1), 293–312.
Benabou, Roland and Jean Tirole, “Incentives and Prosocial Behavior,” American EconomicReview, December 2006, 96 (5), 1652–1678.
Bolton, Gary and Axel Ockenfels, “ERC: A Theory of Equity, Reciprocity and Competition,”American Economic Review, March 2000, 90 (1), 166–193.
Branas-Garza, Pablo, Ramon Cobo-Reyes, Maria Paz Espinosa, Natalia Jimenez, andGiovanni Ponti, “Altruism in the (Social) Network,” DFAEII Working Paper, Universityof the Basque Country - Department of Foundations of Economic Analysis II 2006.
Calvo-Armengol, Antoni and Matthew Jackson, “The Effects of Social Networks on Em-ployment and Inequality,” American Economic Review, June 2004, 94 (3), 426–454.
Camerer, Colin, Behavioral Game Theory: Experiments in Strategic Interaction, Princeton,NJ: Princeton University Press, 2003.
Charness, Gary and Matthew Rabin, “Understanding Social Preferences with Simple Tests,”Quarterly Journal of Economics, August 2002, 113 (3), 817–869.
17
Coleman, James S., Foundations of Social Theory, Cambridge, MA: Harvard University Press,1990.
Costa-Gomes, Miguel A. and Georg Weizsacker, “Stated Beliefs and Play in Normal-formGames,” working paper, London School of Economics July 2007.
DeMarzo, Peter M., Dimitri Vayanos, and Jeffrey Zwiebel, “Persuasion Bias, SocialInfluence and Unidimensional Opinions,” Quarterly Journal of Economics, 2003, 118 (3),909–968.
D’Exelle, Ben and Arno Riedl, “Directed Generosity in Social and Economic Networks,”November 2008. mimeo.
Fehr, Ernst and Klaus Schmidt, “A Theory of Fairness, Competition and Cooperation,”Quarterly Journal of Economics, August 1999, 114 (3), 817–868.
Fershtman, Chaim and Uri Gneezy, “Discrimination in a Segmented Society: An Experi-mental Approach,” Quarterly Journal of Economics, February 2001, 116 (1), 351–377.
Fisman, Ray, Shachar Kariv, and Daniel Markovits, “Individual Preferences for Giving,”American Economic Review, December 2007, 97 (5), 1858–1876.
Glaeser, Edward L., David I. Laibson, Jose A. Scheinkman, and Christine L. Soutter,“Measuring Trust,” Quarterly Journal of Economics, August 2000, 115 (3), 811–846.
Goeree, Jacob K., Margaret A. McConnell, Tiffany Mitchell, Tracey Tromp, andLeeat Yariv, “Linking and Giving Among Teenage Girls,” working paper, California Insti-tute of Technology February 2008.
Huck, Steffen, “Do Players Correctly Estimate What Others Do? Evidence of Conservatism inBeliefs,” Journal of Economic Behavior and Organization, January 2002, 47 (1), 71–85.
Karlan, Dean, Markus Mobius, Tanya Rosenblat, and Adam Szeidl, “Trust and SocialCollateral,” forthcoming in the Quarterly Journal of Economics, November 2009, 124 (4).
Kremer, Michael and Ted Miguel, “The Illusion of Sustainability,” Quarterly Journal ofEconomics, August 2007, 122 (3), 10071065.
Leider, Stephen, Markus M. Mobius, Tanya Rosenblat, and Quoc-Anh Do, “DirectedAltruism and Enforced Reciprocity in Social Networks,” forthcoming in Quarterly Journalof Economics, June 2009.
Mobius, Markus and Tanya Rosenblat, “Why Beauty Matters,” American Economic Review,March 2006, 96 (1), 222235.
Rao, Neel, Markus M. Mobius, and Tanya S. Rosenblat, “Social Networks and VaccinationDecisions,” Working Paper No. 0712, Federal Reserve Bank of Boston, Boston, MA November2007.
18
Slonim, Robert and Ellen Garbarino, “Increases in trust and altruism from partner selection:Experimental evidence,” Experimental Economics, June 2008, 11 (2), 134–153.
19
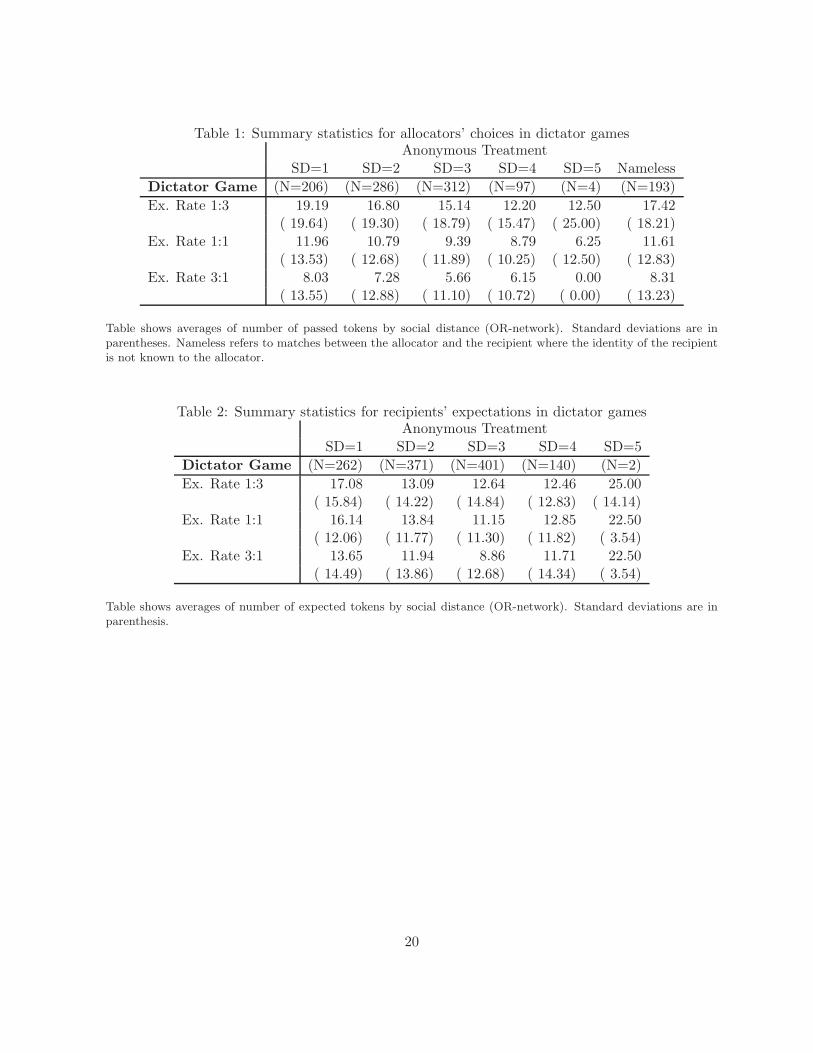
Table 1: Summary statistics for allocators’ choices in dictator gamesAnonymous Treatment
SD=1 SD=2 SD=3 SD=4 SD=5 NamelessDictator Game (N=206) (N=286) (N=312) (N=97) (N=4) (N=193)Ex. Rate 1:3 19.19 16.80 15.14 12.20 12.50 17.42
( 19.64) ( 19.30) ( 18.79) ( 15.47) ( 25.00) ( 18.21)Ex. Rate 1:1 11.96 10.79 9.39 8.79 6.25 11.61
( 13.53) ( 12.68) ( 11.89) ( 10.25) ( 12.50) ( 12.83)Ex. Rate 3:1 8.03 7.28 5.66 6.15 0.00 8.31
( 13.55) ( 12.88) ( 11.10) ( 10.72) ( 0.00) ( 13.23)
Table shows averages of number of passed tokens by social distance (OR-network). Standard deviations are inparentheses. Nameless refers to matches between the allocator and the recipient where the identity of the recipientis not known to the allocator.
Table 2: Summary statistics for recipients’ expectations in dictator gamesAnonymous Treatment
SD=1 SD=2 SD=3 SD=4 SD=5Dictator Game (N=262) (N=371) (N=401) (N=140) (N=2)Ex. Rate 1:3 17.08 13.09 12.64 12.46 25.00
( 15.84) ( 14.22) ( 14.84) ( 12.83) ( 14.14)Ex. Rate 1:1 16.14 13.84 11.15 12.85 22.50
( 12.06) ( 11.77) ( 11.30) ( 11.82) ( 3.54)Ex. Rate 3:1 13.65 11.94 8.86 11.71 22.50
( 14.49) ( 13.86) ( 12.68) ( 14.34) ( 3.54)
Table shows averages of number of expected tokens by social distance (OR-network). Standard deviations are inparenthesis.
20
Tab
le3:
Allo
cato
rs’ac
tion
sin
the
anon
ymou
str
eatm
ent
whe
npa
ired
with
5re
cipi
ents
atva
riou
sso
cial
dist
ance
sD
icta
tor-
1:3
Dic
tato
r-1:
1D
icta
tor-
3:1
(1)
(2)
(3)
(4)
(5)
(6)
SD1
9.02
99.
915
6.01
06.
244
7.93
68.
838
(2.3
31)∗
∗(2
.357)∗
∗(1
.388)∗
∗(1
.485)∗
∗(1
.935)∗
∗(2
.066)∗
∗
SD2
1.30
81.
974
1.81
92.
192
4.07
74.
623
(2.3
04)
(2.3
31)
(1.3
65)
(1.4
58)
(1.8
86)∗
(2.0
14)∗
SD3
-1.3
40-0
.961
0.36
60.
756
3.58
34.
337
(2.2
96)
(2.3
04)
(1.3
61)
(1.4
43)
(1.8
87)†
(2.0
02)∗
Pas
sto
Nam
eles
s1.
384
1.18
61.
403
(0.1
36)∗
∗(0
.116)∗
∗(0
.164)∗
∗
Allo
cato
ris
mal
e0.
708
-2.8
33-5
.578
(4.5
47)
(2.7
79)
(4.0
52)
Rec
ipie
ntis
mal
e-.6
51-.0
24-.9
77(1
.335)
(0.8
38)
(1.1
65)
Sam
een
tryw
ay/h
ouse
0.73
2-0
.517
0.38
1(1
.376)
(0.8
77)
(1.2
23)
Allo
cato
ris
Juni
or-1
6.35
6-5
.507
-6.9
20(6
.196)∗
∗(3
.730)
(5.3
65)
Allo
cato
ris
Seni
or-1
0.61
4-5
.181
-8.3
17(5
.654)†
(3.4
15)
(4.9
17)†
Rec
ipie
ntis
Juni
or0.
965
0.80
21.
663
(1.8
42)
(1.1
52)
(1.5
93)
Rec
ipie
ntis
Seni
or2.
640
0.91
10.
536
(1.6
51)
(1.0
46)
(1.4
59)
Con
st.
4.32
6-1
0.13
0-1
.838
-9.2
53-1
8.84
5-1
8.67
9(3
.813)
(5.6
80)†
(2.2
86)
(3.5
59)∗
∗(3
.547)∗
∗(5
.000)∗
∗
Obs
.90
183
690
183
690
183
6
Sig
nifi
cance
level
s:†:
10%
∗:5%
∗∗:
1%
Sta
ndard
erro
rsare
report
edin
pare
nth
eses
.T
he
dep
enden
tva
riable
isth
enum
ber
of
token
spass
edby
the
alloca
tor
inth
edic
tato
rgam
es.
“Pass
toN
am
eles
s”den
ote
sth
enum
ber
ofto
ken
sth
ealloca
tor
pass
edto
nam
eles
sre
cipie
nts
.O
mit
ted
dis
tance
isSD
4.
All
spec
ifica
tions
are
esti
mate
das
Tobit
regre
ssio
ns
wit
halloca
tor
random
effec
ts.
The
coeffi
cien
tson
SD
1are
signifi
cantl
ydiff
eren
tfr
om
SD
2at
the
5per
cent
level
for
all
colu
mns.
21

Tab
le4:
Rec
ipie
nts’
expe
ctat
ions
inth
ean
onym
ous
trea
tmen
tof
dict
ator
gam
ew
hen
pred
icting
the
action
sof
5al
loca
tors
atva
riou
sso
cial
dist
ance
sD
icta
tor-
1:3
Dic
tato
r-1:
1D
icta
tor-
3:1
(1)
(2)
(3)
(4)
(5)
(6)
SD1
10.9
0410
.840
5.73
75.
469
6.17
86.
365
(1.7
14)∗
∗(2
.362)∗
∗(1
.407)∗
∗(1
.927)∗
∗(2
.034)∗
∗(2
.573)∗
SD2
4.75
26.
263
3.12
33.
490
2.85
83.
863
(1.6
37)∗
∗(2
.258)∗
∗(1
.347)∗
(1.8
45)†
(1.9
47)
(2.4
87)†
SD3
1.73
62.
815
-0.8
04-.6
58-1
.006
0.05
8(1
.641)
(2.2
78)
(1.3
50)
(1.8
53)
(1.9
60)
(2.4
86)
Pas
sto
Nam
eles
s0.
031
0.06
20.
035
(0.0
35)
(0.0
43)
(0.0
57)
Allo
cato
ris
mal
e-2
.041
-2.7
69-4
.152
(1.2
38)†
(1.0
17)∗
∗(1
.352)∗
∗
Rec
ipie
ntis
mal
e4.
064
-0.4
08-0
.531
(2.9
84)
(2.0
66)
(3.0
34)
Sam
een
tryw
ay/h
ouse
-1.8
33-1
.174
-2.1
57(1
.354)
(1.1
26)
(1.5
23)
Allo
cato
ris
Juni
or-1
.065
-1.1
41-1
.436
(1.8
51)
(1.5
47)
(2.0
81)
Allo
cato
ris
Seni
or-0
.145
-0.7
492.
611
(1.7
37)
(1.4
29)
(1.9
28)
Rec
ipie
ntis
Juni
or-5
.712
-3.8
70-6
.620
(4.0
27)
(2.7
97)
(4.0
87)
Rec
ipie
ntis
Seni
or0.
717
-0.9
77-5
.133
(3.5
54)
(2.4
79)
(3.6
29)
Con
st.
6.14
84.
617
9.31
411
.928
3.36
38.
736
(1.9
70)∗
∗(3
.785)
(1.4
83)∗
∗(2
.830)∗
∗(2
.223)
(4.0
21)∗
Obs
.83
956
383
956
384
456
7
Sig
nifi
cance
level
s:†:
10%
∗:5%
∗∗:
1%
Sta
ndard
erro
rsare
report
edin
pare
nth
eses
.T
he
dep
enden
tva
riable
isth
enum
ber
of
token
sex
pec
ted
by
the
reci
pie
nt
inea
chdic
tato
rgam
e.“Pass
toN
am
eles
s”den
ote
sth
enum
ber
ofto
ken
sth
ealloca
tor
pass
edto
nam
eles
sre
cipie
nts
.O
mit
ted
soci
aldis
tance
isSD
4.
All
spec
ifica
tions
are
esti
mate
das
Tobit
regre
ssio
ns
wit
hre
cipie
nt
random
effec
ts.
The
coeffi
cien
tson
SD
1are
signifi
cantly
diff
eren
tfr
om
SD
2at
the
5per
cent
level
for
all
colu
mns.
22
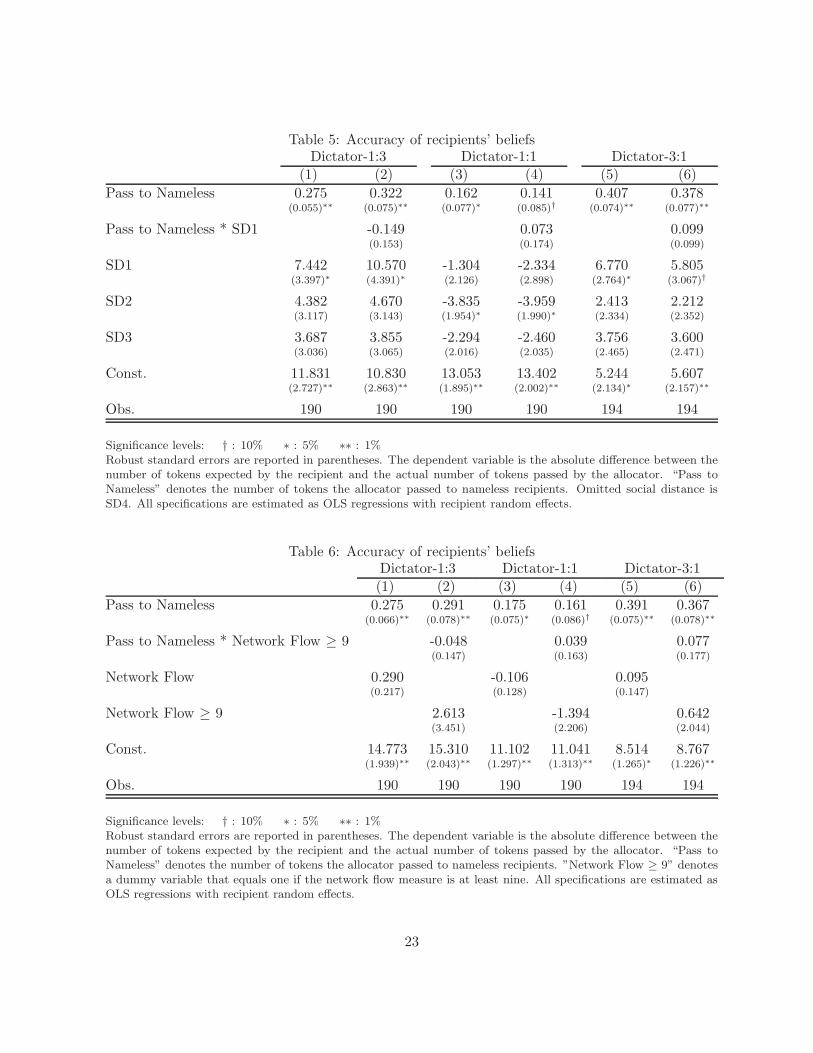
Table 5: Accuracy of recipients’ beliefsDictator-1:3 Dictator-1:1 Dictator-3:1
(1) (2) (3) (4) (5) (6)Pass to Nameless 0.275 0.322 0.162 0.141 0.407 0.378
(0.055)∗∗ (0.075)∗∗ (0.077)∗ (0.085)† (0.074)∗∗ (0.077)∗∗
Pass to Nameless * SD1 -0.149 0.073 0.099(0.153) (0.174) (0.099)
SD1 7.442 10.570 -1.304 -2.334 6.770 5.805(3.397)∗ (4.391)∗ (2.126) (2.898) (2.764)∗ (3.067)†
SD2 4.382 4.670 -3.835 -3.959 2.413 2.212(3.117) (3.143) (1.954)∗ (1.990)∗ (2.334) (2.352)
SD3 3.687 3.855 -2.294 -2.460 3.756 3.600(3.036) (3.065) (2.016) (2.035) (2.465) (2.471)
Const. 11.831 10.830 13.053 13.402 5.244 5.607(2.727)∗∗ (2.863)∗∗ (1.895)∗∗ (2.002)∗∗ (2.134)∗ (2.157)∗∗
Obs. 190 190 190 190 194 194
Significance levels: † : 10% ∗ : 5% ∗∗ : 1%Robust standard errors are reported in parentheses. The dependent variable is the absolute difference between thenumber of tokens expected by the recipient and the actual number of tokens passed by the allocator. “Pass toNameless” denotes the number of tokens the allocator passed to nameless recipients. Omitted social distance isSD4. All specifications are estimated as OLS regressions with recipient random effects.
Table 6: Accuracy of recipients’ beliefsDictator-1:3 Dictator-1:1 Dictator-3:1(1) (2) (3) (4) (5) (6)
Pass to Nameless 0.275 0.291 0.175 0.161 0.391 0.367(0.066)∗∗ (0.078)∗∗ (0.075)∗ (0.086)† (0.075)∗∗ (0.078)∗∗
Pass to Nameless * Network Flow ≥ 9 -0.048 0.039 0.077(0.147) (0.163) (0.177)
Network Flow 0.290 -0.106 0.095(0.217) (0.128) (0.147)
Network Flow ≥ 9 2.613 -1.394 0.642(3.451) (2.206) (2.044)
Const. 14.773 15.310 11.102 11.041 8.514 8.767(1.939)∗∗ (2.043)∗∗ (1.297)∗∗ (1.313)∗∗ (1.265)∗ (1.226)∗∗
Obs. 190 190 190 190 194 194
Significance levels: † : 10% ∗ : 5% ∗∗ : 1%Robust standard errors are reported in parentheses. The dependent variable is the absolute difference between thenumber of tokens expected by the recipient and the actual number of tokens passed by the allocator. “Pass toNameless” denotes the number of tokens the allocator passed to nameless recipients. ”Network Flow ≥ 9” denotesa dummy variable that equals one if the network flow measure is at least nine. All specifications are estimated asOLS regressions with recipient random effects.
23


![Handong Global UniversityHGU] Brochure.pdf · 2020-06-04 · Handong Global University 4 5 Come and expect the unexpected A true sense of belonging! Make life-long friends meeting](https://img.dokumen.tips/doc/110x75/5f038ef47e708231d409a583/handong-global-hgu-brochurepdf-2020-06-04-handong-global-university-4-5-come.jpg)