Embed Size (px)
Citation preview

WESTPAC FIXED INCOME INVESTORFIXED INCOME INVESTOR PRESENTATIONPRESENTATION FOR THE SIX MONTHS ENDED 31 MARCH 2014 UNLESS OTHERWISE STATED EUROPEAN ROADSHOW MAY 2014

Disclaimer
The material contained in this presentation is intended to be general background information on Westpac Banking Corporation (“Westpac”) and its activities. It does not constitute a prospectus, offering memorandum or offer of securities. It should not be reproduced, distributed or transmitted to any person without the consent of Westpac and is not intended for distribution in any jurisdiction in which such distribution would be contrary to local law or regulation.
This presentation is directed only at persons who (i) have professional experience in matters relating to investments; or (ii) are persons falling within Article 49(2)(a) to (d) (“high net worth companies, unincorporated associations etc.”) of the Financial Services and Markets Act 2000 (Financial Promotion) Order 2001 (as amended); or (iii) are outside the United Kingdom (all such persons together being referred to as “relevant persons”). This document must not be acted on or relied on by persons who are not relevant persons.
The information is supplied in summary form and is therefore not necessarily complete. Also, it is not intended that it be relied upon as advice to investors or potential investors, who should consider seeking independent professional advice depending upon their specific investment objectives, financial situation or particular needs. The material contained in this presentation may include information derived from publicly available sources that have not been independently verified. No representation or warranty is made as to the accuracy, completeness or reliability of the information.
All amounts are in Australian dollars unless otherwise indicated.
Financial information in this presentation may be presented on a cash earnings basis. Cash earnings is a non-GAAP measure. Refer to Westpac’s Interim 2014 Results (incorporating the requirements of Appendix 4D) for the half year ended 31 March 2014 available at www.westpac.com.au for details of the basis of preparation of cash earnings. Refer to Appendix 1 for a reconciliation of reported net profit to cash earnings.
I f ti t i d i th i ibl th h th b it ti d i thi t ti d t f t f th t ti l ifi ll t t th t th i f tiInformation contained in or otherwise accessible through the websites mentioned in this presentation does not form part of the presentation unless we specifically state that the information is incorporated by reference thereby forming part of the presentation. All references in this presentation to web sites are inactive textual references and are for information only.
Disclosure regarding forward-looking statements
This presentation contains statements that constitute “forward-looking statements” within the meaning of Section 21E of the US Securities Exchange Act of 1934. The forward-looking statements include statements regarding our intent, belief or current expectations with respect to our business and operations, market conditions, results of operations and financial condition, including, without limitation, future loan loss provisions, indicative drivers, forecasted economic indicators and performance metric outcomes.
We use words such as ‘will’, ‘may’, ‘expect’, 'indicative', ‘intend’, ‘seek’, ‘would’, ‘should’, ‘could’, ‘continue’, ‘plan’, ‘probability’, ‘risk’, ‘forecast’, ‘likely’, ‘estimate’, ‘anticipate’, ‘believe’, or similar words to identify forward-looking statements. These statements reflect our current views with respect to future events and are subject to change, certain risks, uncertainties and assumptions which are, in many instances, beyond our control and have been made based upon management’s expectations and beliefs concerning future developments and their potential effect upon us. Should one or more of the risks or uncertainties materialise, or should underlying assumptions prove incorrect, actual results may vary materially from the expectations described in this presentation. Factors that may impact on the forward-looking statements made include those described in the section entitled ‘Risk factors’ in Westpac’s Interim Financial Report for the half year ended 31 March 2014 available at www.westpac.com.au. When relying on forward-looking statements to make decisions with respect to us, investors and others should carefully consider such factors and other uncertainties and events We are under no obligation and do not intend to update any forward looking statementsinvestors and others should carefully consider such factors and other uncertainties and events. We are under no obligation, and do not intend, to update any forward-looking statements contained in this presentation.
Westpac Group | May 2014 | European Investor Roadshow 2

INDEXINDEX 1H14 HIGHLIGHTS 4 AUSTRALIAN HOME LENDING 20 ECONOMICS 28ECONOMICS 28SECURED FUNDING 40 ADDITIONAL INFORMATION 50 APPENDICES 60APPENDICES 60
Another quality financial performance from Westpac
1H14 Cash earnings results 1H14 % Change 1H14 – 1H13
Strong financial performance
Cash earnings ($m) NIM
Net interest margin (%)
Financial results (A$m)
Cash earnings 3,772 8
Reported net profit after tax 3,622 10
N t ti i 9 859 5
3,508 3,555 3,772
g ($ )
2.19 2.12 2.11
NIMNIM excl. Treasury and Markets
Net operating income 9,859 5
Expenses 4,065 6
Impairment charges 341 (22)
Financial metrics 1H13 2H13 1H14
2.06 2.06 2.01
1H10
2H10
1H11
2H11
1H12
2H12
1H13
2H13
1H14
73
Financial metrics
Cash earnings per share 121.3c 7
Net interest margin 2.11% (8bps)
Expense to income ratio 41.2% 35bps
Portfolio quality continues to improve
Impairment charges to average gross loans annualised (%)
1 2 1 2 1 2 1 2 1
33 31 23 19 17 19
31
73
30 19 22 24 24
17
Expense to income ratio 41.2% 35bps
Cash earnings return on equity 16.5% 43bps
Asset quality
Net write-offs to avg loans annualised 22bps 1bp 19 17 19 19 17 15 12
2002
2003
2004
2005
2006
2007
2008
2009
2010
1H11
2H11
1H12
2H12
1H13
2H13
1H14
Total impaired assets to gross loans 51bps (31bps)
Total provisions to gross loans 67bps (13bps)
Impairment provisions to impaired assets 46.4% large
Westpac Group | May 2014 | European Investor Roadshow 4

Westpac has clear strategic priorities...
Remain strong ...managed in a balanced way Remain strong
T t d th Strength A strong company
Capital within preferred range
Target stable funding
Return Maintain discipline Maintain strong ROE Maintain dividend path
Targeted growth
Target stable funding ratio >75%
Growth Investment driven
Productivity Sector leading
Customer relationships
Investment drivenHigher growth in target segments, including Deposits, Asia, SME, Trade and Natural Resources
Sector leadingMaintain expense to
income ratio below peers
Materially simplify
One team
Westpac Group | May 2014 | European Investor Roadshow 5

Strategy delivering growth in targeted areas
Customer deposits ($bn)
Westpac RBB St George
Customer numbers (#m) Aust. housing growth vs system (times)
348 360 383 389 6.13 6.17 6.22
3 22 3 26 3.55
Westpac RBB St.George
0.8x 0.7x
0.8x 0.9x
2H12 1H13 2H13 1H14
3.22 3.26
1H13 2H13 1H143Q13 4Q13 1Q14 2Q14
FUA FUM
2H12 1H13 2H13 1H14
FUA2 and FUM3 ($bn)
Life in-force premiums General gross written premiums
Insurance premiums ($m)
Asia Australia
WIB trade finance volumes ($bn)
1H13 2H13 1H143Q13 4Q13 1Q14 2Q14
89 97
104 108
68 76
86 93 601 635 685 734
General gross written premiums
3.3 3.9
5.5
7.1
2H12 1H13 2H13 1H14
186 198 218 227
2H12 1H13 2H13 1H14 2H12 1H13 2H13 1H14
Westpac Group | May 2014 | European Investor Roadshow 6
1 RBA Financial Aggregates March 2014. 2 Funds under administration. 3 Funds under management.

Strong portfolio of brands s
Westpac Retail & Business Banking Australian retail and business
• 1H14 cash earnings $1,251m • Up 10% on 1H13
Westpac Retail &
Contribution to Cash Earnings (%)
All comparisons to 1H13
ncia
l Ser
vice
s Australian retail and business banking for consumers, SMEs and commercial customers under the Westpac brand
• Strong franchise; lending up 4%, deposits up 8%, as the division tilts to growth
St.George Banking Group Australian retail and business
• 1H14 cash earnings $772m • Up 12% on 1H13
33
10
2 3
Westpac Retail & Business Banking St.George Banking Group BT Financial Group
Westpac Institutional
stra
lian
Fina
n banking under the St.George, BankSA, Bank of Melbourne and RAMS brands
p• Each brand contributing positively;
solid revenue growth; decline in impairment charges
BT Financial Group Wealth division with $82bn funds
d d $107b
• 1H14 cash earnings $438m • Up 21% on 1H13
20
12 20
Bank Westpac New Zealand
Westpac Pacific
Group (inc. Treasury)
nal
Au under management and $107bn funds under administration at 31 March 2014
p• Funds management earnings up 28%;
strong insurance flows in life and general insurance
Westpac Institutional Bank L di A t l i i tit ti l
• 1H14 cash earnings $752m D 4% 1H13
Market share at 31 March 2014 (%)
Australia
Inst
itutio
n Leading Australasian institutional bank, with branches and representative offices in Australia, NZ, US, UK and Asia
• Down 4% on 1H13• Underlying business continues to
perform well; customer revenue up 3%; strong contribution from markets businesses
Household deposit market share1 23%
Housing credit market share2 23%
Business credit market share2 19%
Wealth platforms market share3 20%
NZ
Westpac New Zealand Banking and wealth services to consumers, businesses and institutions in New Zealand
• 1H14 cash earnings NZ$432m • Up 17% on 1H13 • Improving asset quality driving lower
impairment charges; lending up 6%, deposits up 8%
Wealth platforms market share 20%
New Zealand
Household deposit market share4 21%
Consumer lending market share4 20%
Westpac Group | May 2014 | European Investor Roadshow 7
1 APRA Banking Statistics. 2 Reserve Bank of Australia. 3 Plan for Life December 2013, All Master Funds Admin. 4 Reserve Bank of New Zealand.

Improving balance sheet momentum
Net loans ($bn)
Housing Total credit Business
Australian private sector credit growth (% ann)
10
15
20
25 Housing Total credit Business
f/cs end '15
521 16 7 4
11 6 565
-10
-5
0
5
J 94 J 98 J 02 J 06 J 10 J 14
1H13 Aust. Housing
Aust. Business
Aust. Personal &
other
NZ (A$) Overseas 1H14
Up 8%
Customer deposits ($bn)
Sources: RBA, Westpac Economics Jan-94 Jan-98 Jan-02 Jan-06 Jan-10 Jan-14 other
Customer deposits at 1H14 (%)
15 % income
Australian household savings rate (% income)
360 383 389
U 8%
42
18
25
6
9
12
1H13 2H13 1H14
Up 8%15
Term deposits Savings
Online Transaction -3
0
3
Dec-89 Dec-93 Dec-97 Dec-01 Dec-05 Dec-09 Dec-13
Westpac Group | May 2014 | European Investor Roadshow 8
Sources: ABS, Westpac Economics

Setting Westpac apart – Domestic customer focus, efficiency and balance sheet strength, y g
Total income by geography1 (%)
Clear focus on Australia and New Zealand Brands supporting targeted growth
Australian Financial Services
Wealth penetration2 leads sector (%)
Brands rank #1 and # 3
10
15
9 8
2 17
4 15 Asia, Pacific,
Europe & Americas
New Zealand
Total income by geography (%) Australian Financial Services
21.9%
16 1%
19.5% WRBB
SGB
P 1
Brands rank #1 and # 3
88 67
87 76
Westpac Peer 1 Peer 2 Peer 3
Australia Westpac NZ WIB
16.1%
14.1% 14.3%
Mar-10 Mar-11 Mar-12 Mar-13 Mar-14
Peer 1
Peer 2
Peer 3
47 0
Westpac Peer 1 Peer 2 Peer 3
Expense to income ratio3 (%) Impairment charges to average loans annualised3 (bps)
Leader in efficiency Risk management a competitive advantage
Common equity ratio3 (APRA Basel III) (%)
Capital level strong relative to peers
Mar-10 Mar-11 Mar-12 Mar-13 Mar-14
41.2
44.3 42.6
47.0
12
21
16 20
( p )
8.8 8.3 8.5 8.6
Westpac Peer 1 Peer 2 Peer 3 Westpac Peer 1 Peer 2 Peer 3 Westpac Peer 1 Peer 2 Peer 3
Westpac Group | May 2014 | European Investor Roadshow
1 Source: Company Annual Reports. Westpac, Peer 1 and Peer 3 as at 30 September 2013. Peer 2 as at 30 June 2013. 2 See Appendix 4 for Wealth penetration metrics definition and provider details 3. Source: Company reports. Westpac , Peer 1 and Peer 3 as at 31 March 2014, Peer 2 as at 31 December 2013.
9

Fully harmonised common equity tier 1 capital ratio at the upper end of global peersupper end of global peers
Global peer comparison of Basel III pro-forma common equity tier 1 capital ratios1 (%)
15.0 14.7
13.9 13.6
12.8
11.9 11.9 11.8 11.4 11.3 11.1 10.9 10.7 10.5 10.5 10.5 10.4 10.4 10.4 10.3 10.3
10 010.0 9.8 9.7 9.7 9.5 9.5 9.3 9.3 9.1 9.0 8.9 8.8 8.8 8.6 8.6 8.3 8.1 8.3 8.1 7.9
SE
B
Ban
k
rdea
DnB
UB
S
DB
S
CB
C
Ban
k
CB
A
tpac
nley
nder
a H
K
AN
Z
roup
NA
B
atix
is
Ban
k
Ban
k
oyds
ribas
eral
e
argo
Ban
k
ank
BV
A
CIB
C
clay
s
treal
Nov
a …
BK
IR
Ban
k
ncia
l
corp
RB
S
bank
e S
A
pula
r
SU
N
pula
r
BE
N
S
Dan
ske
B
Nor D U D
OC
Mac
quar
ie B C
Wes
t
Mor
gan
Sta
San
tan
Bank
of C
hina
A
Citi
gr N
Na
Han
g Se
ng B
Dah
Sin
g B Llo
BN
P P
ar
Soc
iete
Gen
e
Wel
ls F
a
Deu
tsch
e B
Roy
al B
a
BB C
Barc
Ban
k of
Mon
t
Ban
k of
N B
TD B
PNC
Fin
an
US
Banc R
Com
mer
zb
Cre
dit A
gric
ole
Banc
o Po
p S
Banc
o Po
p B
Westpac Group | May 2014 | European Investor Roadshow 10
1 Company data, Credit Suisse estimates (based on latest reporting data as at April 2014. Australian banks based on 1H14 results.
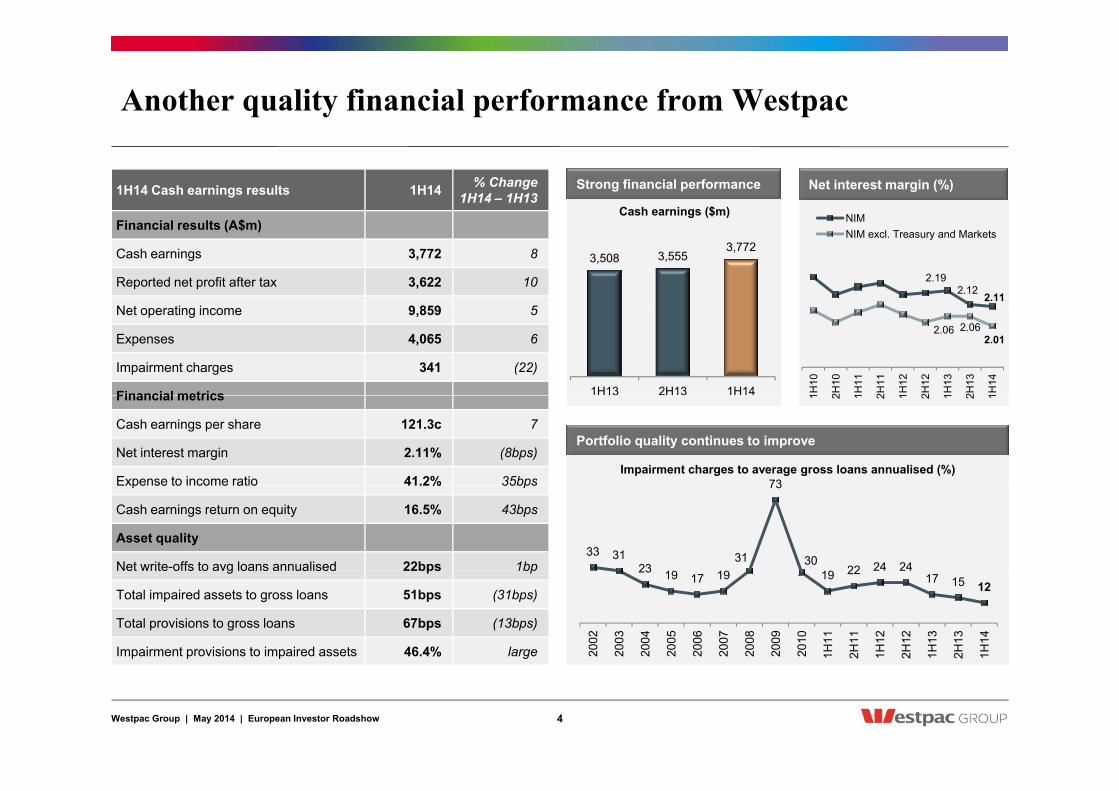
Capital strength maintained1
Key capital ratios (%) Mar-13 Sept-13 Mar-14
Common equity tier 1 capital ratio 8.7 9.1 8.8
Common equity tier 1 capital ratio (% and bps)
q y p
Additional tier 1 capital 2.1 1.6 1.5
Tier 1 capital ratio 10.8 10.7 10.3
Tier 2 capital 1.7 1.6 1.8 8.82
107 73 24 40 11.26
Total regulatory capital ratio 12.5 12.3 12.1
Risk weighted assets ($bn) 308 307 322
Common equity tier 1 capital ratio (BCBS2) 11.4 11.6 11.3
31 Mar 14 APRA Basel III
Concessional thresholds
Mortgage LGD floor (min 20%
v 10%)
IRRBB RWA Other 31 Mar 13 BCBS Basel III
244bps
2 4
(BCBS ) v 10%)
8 79.1
8 8
Common equity tier 1 capital ratio3 (%) Common equity tier 1 capital ratio (% and bps)
11.26
7.3 6 9
7.4 7.2
7.7 7.5
8.2 8.3 8.7
8.4 8.8
8.74 9.10 7
117
8.82 (37) (10)
(85) (18) (2)
6.7 6.9
Dec
-10
Mar
-11
Jun-
11
Sep-
11
Dec
-11
Mar
-12
Jun-
12
Sep-
12
Dec
-12
Mar
-13
Jun-
13
Sep-
13
Mar
-14
31 M
ar 1
3
B
asel
III
30 S
ep 1
3
B
asel
III
Lloy
ds
Spe
cial
di
vide
nd
SG
B ta
x co
nsol
idat
ion
bene
fit
Cas
h
Ear
ning
s
Fina
l ord
inar
y di
vide
nd
RW
A
mov
emen
t
Oth
er
31 M
ar 1
4 B
asel
III
31 M
ar 1
4
BC
BS
2
Westpac Group | May 2014 | European Investor Roadshow 11
1 All capital ratios and risk weighted assets disclosed in this presentation are calculated on a Westpac Level 2 consolidated basis. 2 BCBS is Basel Committee on Banking Supervision. 3 All numbers prior to March 2013 on a pro-forma Basel III basis. 4 Other includes the treatment of specialised lending.

Capital well positioned for D-SIB capital requirement
Westpac’s capital base • On 23 December 2013, APRA issued an information paper which
– Identified the four major Australian banks as domestic systemically important
12.1% Total regulatory
capital ratio
1 8% / $5 7b Ti 2
banks (D-SIB)
– Provided detail of the additional higher loss absorbency requirements for D-SIB as a buffer
• D-SIB requirement of 1% is to be met by common equity tier 1 capital (CET1)
I l t ti f th D SIB i th h t i f th it l ti
1.5% / $4.8bn AT1
1.8% / $5.7bn Tier 2
8.0 % Regulatory minimum (effective Jan 2016)
• Implementation of the D-SIB is through an extension of the capital conservation buffer (CCB) effectively increasing the buffer above regulatory minimums
• The CCB and D-SIB buffer will commence on 1 January 2016
• Westpac is currently reviewing its preferred capital range (effective Jan 2016)
8.8% $28.5bn
Common Equity Tier 1
3.5% D-SIB HLA + Capital
Conservation Buffer
Requirement Common Equity Tier 1 Total Capital APRA
Implementation
Minimum 4.5% 6.0% 8.0% 1 Jan 2013
Capital Conservation Buffer (CCB) 2.5% 1 Jan 2016
D-SIB requirement 1.0% 1 Jan 2016
Countercyclical Buffer 0% - 2.5% 1 Jan 2016
4.5% Common Equity
Tier 1
APRA regulatory minimums Westpac 1H14
Countercyclical Buffer 0% 2.5% 1 Jan 2016
Total Capital Requirement 8.0%-10.5% 9.5%-12.0% 11.5%-14.0%
Leverage Ratio 3% 1 Jan 2018
Westpac Group | May 2014 | European Investor Roadshow 12
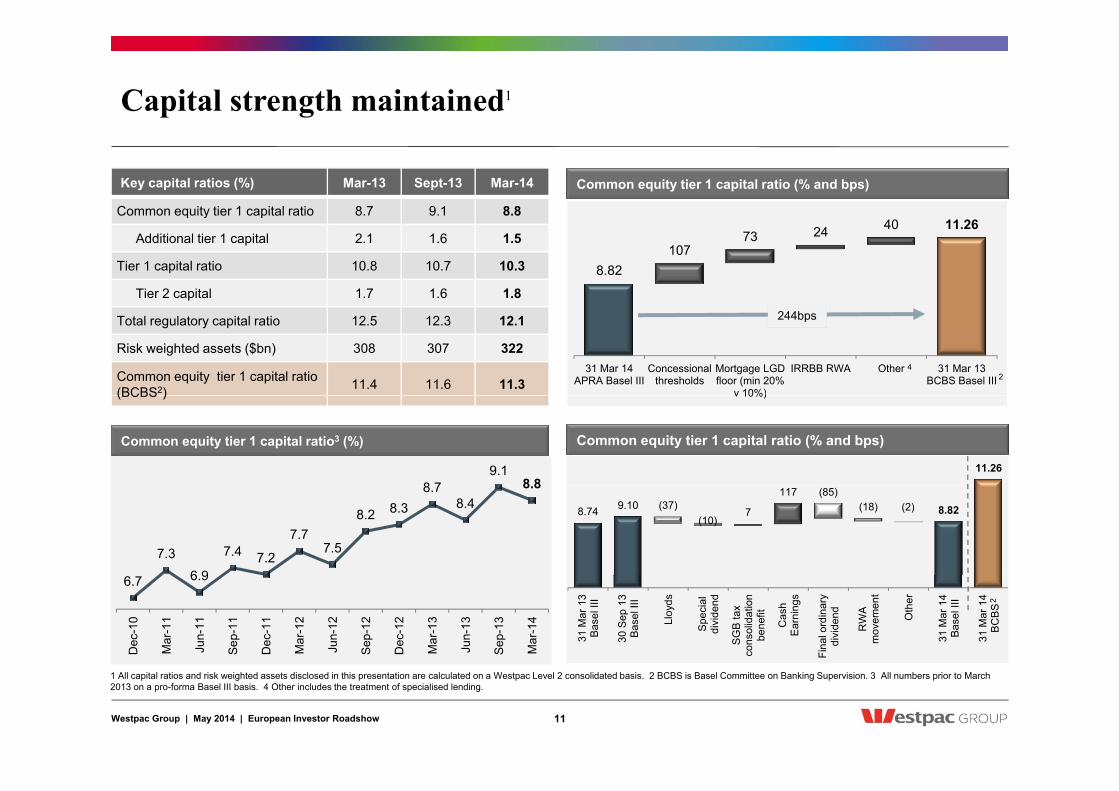
Asset growth funded through stable sources
Funding composition by residual maturity (%) • Stable Funding Ratio 83% at 1H14, down 45bps (up 24bps 1H13/1H14)
G th i f di th h t bl f t d it
7 7 7 Wholesale Onshore <1yr
Stable Funding Ratio 64% 83% 84% 83%
– Growth in funding through stable sources of customer deposits and term wholesale funding
– Average tenor of new term funding 4.9 years - a very stable source of funds for the bank
• Customer deposits increased $6bn, with the increase in term funding
95 5 5
20
10 9 10 16
Wholesale Onshore 1yr
Wholesale Offshore <1yr
Wholesale Onshore >1yr
Wholesale Offshore >1yr
p $ , gproviding scope to manage deposit quality
– Preferred household deposits up $7bn (4.4%) with growth in this segment 1.0x system1
• Short term funding increased $6bn
3
5
7 7 7
1
2 2 2
10
10 9 9
4
Securitisation
Equity
Customer deposits
3
– Supporting an increase in short dated assets, mainly growth in trade finance in Asia and Australian
– Weighted average maturity of the short term portfolio has remained around 141 days
• Balance sheet well positioned for start of Liquidity Coverage Ratio
44
59 61 60
5 • Balance sheet well positioned for start of Liquidity Coverage Ratio (LCR)
FY08 1H13 2H13 1H14 2
Westpac Group | May 2014 | European Investor Roadshow 13
1 APRA Banking Statistics March 2014. 2 2008 does not include St.George. 3 Equity excludes FX translation, Available-for-Sale Securities and Cash Flow Hedging Reserves.

Strong liquidity position maintained
Liquid assets ($bn) • $127bn in unencumbered liquid assets held at 31 March 2014
– Securities are eligible for repo with a central bank and proposed
45 54 58
Self securitisation
Private securities d t
127 126
111
Committed Liquidity Facility (CLF)
– Sufficient to cover all short term debt outstanding (including long term debt with a residual maturity less than one year)
• Westpac is well positioned for the introduction of the LCR
APRA ill l th LCR th h APS210 f 1 J 2015
36 44 43
108
38
30 28 26
and government guaranteed paper
Cash, government and semi-government bonds
45 1
– APRA will apply the LCR through APS210 from 1 January 2015
– The LCR is intended to improve the resilience of banks against potential short-term stress
– It requires banks to hold 100% of their net cash outflows over a 30-day horizon in High Quality Liquid Assets (HQLA)
7 FY08 1H13 2H13 1H14 Short term
outstanding debt 1H14 3
2
y g y q ( )
– In addition, APRA has stated that a suitable buffer would be in the range of 10-15% of net cash outflows
• As insufficient HQLA are available in Australia to meet the LCR requirement, a CLF will be provided by APRA and the RBA
– The CLF allows banks to access a specified amount of liquidity (approved by APRA) through repo arrangements with the RBA, for a 15bps fee
– The CLF is available only to address a shortage of HQLA in Australian dollars
– APRA has yet to finalise the CLF limit for Westpac
Westpac Group | May 2014 | European Investor Roadshow 14
1 Private securities include Bank paper, RMBS, and Supra-nationals. 2 2008 does not include St.George. 3 Includes long term wholesale funding with a residual maturity less than 1 year.

New term issuance well diversified
Covered Bond Hybrid Senior Govt Guaranteed Sub Debt
Term debt issuance and maturity profile1,2 ($bn)
Short term funding3,4 ($bn)
Lowest short term funding of peers
153 170
17 18 21
24
Covered Bond Hybrid Senior Govt Guaranteed Sub Debt
Issuance Maturities
24 23 2022
33
25 23 20
43 45
g ($ )Short term funding to total funding including equity3,4 (%)
108 119
Westpac Peer 1 Peer 2 Peer 3FY09 FY10 FY11 FY12 FY13 1H14 2H14 FY15 FY16 FY17 FY18 >FY18
15 2022
11
20
es pac ee ee ee 3
Issued ($bn)
Remaining capacity (8% cap &
Australian covered bond issuance5
% Capacity utilised
1H14 new term issuance composition1 (%)
By type By tenor By currency
16
26 25
29
Remaining capacity (8% cap & overcollateralisation) ($bn) 49
43 36
40
58 22
11 4 5
39
32
23 4 2
5
24
52
19
1 Based on residual maturity and FX spot currency translation. Includes all debt issuance with contractual maturity greater than 13 months, excluding US Commercial Paper. 2 Contractual maturity date for hybrids and callable subordinated instruments
15 20 14 19
16
Peer 1 Peer 2 Peer 3 Westpac Peer 1 Peer 2 Peer 3 Westpac
Senior unsecured Covered bonds RMBS ABS Subordinated debt
39
AUD USD EUR JPY Other 2 Years 3 Years
5 Years >5 years
Westpac Group | May 2014 | European Investor Roadshow 15
1 Based on residual maturity and FX spot currency translation. Includes all debt issuance with contractual maturity greater than 13 months, excluding US Commercial Paper. 2 Contractual maturity date for hybrids and callable subordinated instruments is the first scheduled conversion date or call date for the purposes of this disclosure. Perpetual sub-debt has been included in >FY18 maturity bucket. Maturities exclude securitisation amortisation. 3 Includes long term wholesale funding with a residual maturity less than 1 year. 4 Short term funding includes Central Bank deposits and long term wholesale funding with a residual maturity less than 1 year. Source: Westpac, Company reports. Westpac and Peer 1 as at 31 March 2014, Peer 2 as at 31 December 2013 and Peer 3 as at 30 September 2013. 5 Sources: Westpac, APRA Banking Statistics March 2014.
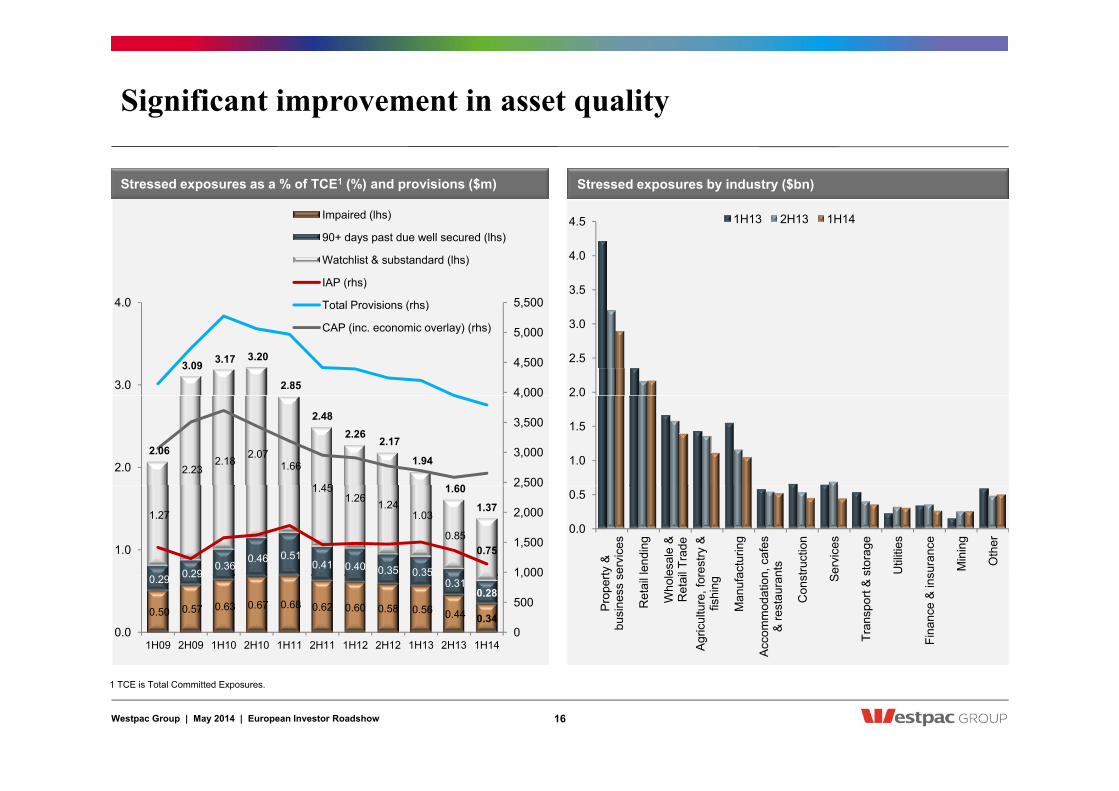
Significant improvement in asset quality
Impaired (lhs)
Stressed exposures as a % of TCE1 (%) and provisions ($m) Stressed exposures by industry ($bn)
1H13 2H13 1H14
5,5004.0
Impaired (lhs)
90+ days past due well secured (lhs)
Watchlist & substandard (lhs)
IAP (rhs)
Total Provisions (rhs)3.5
4.0
4.5 1H13 2H13 1H14
3.09 3.17 3.20
2.85 4,000
4,500
5,000
5,500
3.0
4.0 Total Provisions (rhs)
CAP (inc. economic overlay) (rhs)
2.0
2.5
3.0
2.23 2.18 2.07
1.66
1 45
2.06
2.48 2.26
2.17
1.94
1 60 2,500
3,000
3,500
4,000
2.0 1.0
1.5
2.0
0 29 0.36
0.46 0.51 0.41 0.40 0.35 0.35
1.27
1.451.26 1.24
1.03
0.85 0.75
1.60
1.37
1,000
1,500
2,000
2,500
1.0
0.0
0.5
ty &
se
rvic
es
lend
ing
esal
e &
il
Trad
e re
stry
&
actu
ring
n, c
afes
nt
s
truct
ion
Ser
vice
s
stor
age
Util
ities
sura
nce
Min
ing
Oth
er
0.50 0.57 0.63 0.67 0.68 0.62 0.60 0.58 0.56 0.44 0.34
0.29 0.29 0.35 0.31
0.28
0
500
1,000
0.0 1H09 2H09 1H10 2H10 1H11 2H11 1H12 2H12 1H13 2H13 1H14
Prop
ert
busi
ness
s
Ret
ail
Who
leR
etai
Agr
icul
ture
, for
fishi
ng
Man
ufa
Acc
omm
odat
ion
& re
stau
ran
Con
s S
Tran
spor
t & s
Fina
nce
& in
s
Westpac Group | May 2014 | European Investor Roadshow 16
1 TCE is Total Committed Exposures.

Australian mortgage delinquencies at low levels
Delinquencies
• Sustained period of low interest rates and a continued conservative h t d bt b b h t d t dit
90+ Past Due Total 90+ First Home Buyer
Australian mortgages delinquencies and loss rates (%)
approach to debt by borrowers has supported very strong credit quality
• 90+ days delinquencies remain low at 50bps, down 3bps (down 8bps 1H13/1H14)
• 30+ days delinquencies 128bps, up 8bps (down 15bps 1H13/1H14) 2.0
3.0
90+ Investor 30+ Past Due
Loss Rates
y q p , p p ( p )reflecting normal seasonal trends for the first half
Properties in possession
• Properties in possession 189 at March 2014, down from 353 at September 2013 (248 at March 2013)
-
1.0
Sep
-08
Dec
08
Mar
-09
Jun
09
Sep
-09
Dec
09
Mar
-10
Jun
10
Sep
-10
Dec
10
Mar
-11
Jun-
11
Sep
-11
Dec
-11
Mar
-12
Jun-
12
Sep
-12
Dec
-12
Mar
-13
Jun-
13
Sep
-13
Dec
-13
Mar
-14
• Represents <2bps of the portfolio
Loss rates
• Portfolio losses of $45m represent an annualised loss rate of 2bps (net of insurance claims1)
S S S S D S D S D
1.5 ALL NSW/ACT VIC/TAS
Australian mortgage 90+ days delinquencies (%)
• Loss rates remain very low by international standards due to sound underwriting standards, high levels of borrower equity, mortgage insurance and active collections strategies
0.5
1.0
QLD WA SA/NT
0.0 M
ar-0
9
Jun-
09
Sep
-09
Dec
-09
Mar
-10
Jun-
10
Sep
-10
Dec
-10
Mar
-11
Jun-
11
Sep
-11
Dec
-11
Mar
-12
Jun-
12
Sep
-12
Dec
-12
Mar
-13
Jun-
13
Sep
-13
Dec
-13
Mar
-14
Westpac Group | May 2014 | European Investor Roadshow 17
1 Mortgage insurance claims 1H14 $3m (2H13 $14m, 1H13 $10m).

High quality Australian mortgage portfolio
Australian housing portfolio 1H13 Balance
2H13 Balance
1H14 Balance
1H14 Flow1
T t l tf li ($b ) 321 9 328 5 338 0 33 1100 1H14 drawdowns LVR at origination
Australian housing loan-to-value (LVR) ratios (%)
Total portfolio ($bn) 321.9 328.5 338.0 33.1
Owner-occupied (%) 48.1 47.9 47.6 47.7
Investment property loans (%) 42.2 43.1 44.0 49.2
Portfolio loan/line of credit (%) 9.7 9.0 8.4 3.1
V i bl t / Fi d t (%) 85 / 15 81 / 19 84 / 16 76 / 2450 60 70 80 90 Portfolio LVR at origination
Portfolio dynamic LVR 2,3,4
Variable rate / Fixed rate (%) 85 / 15 81 / 19 84 / 16 76 / 24
Low Doc (%) 5.2 4.7 4.2 1.0
Proprietary channel (%) 58.2 58.0 55.3 55.7
First Home Buyer (%) 11.7 11.4 10.9 7.6
M t i d (%) 24 4 23 3 22 2 13 50
10 20 30 40
0<=60 60<=70 70<=80 80<=90 90<=95 95+Mortgage insured (%) 24.4 23.3 22.2 13.5
1H13 2H13 1H14
Average LVR at origination (%) 69 69 69
Average dynamic2,3,4 LVR (%) 48 46 47
0<=60 60<=70 70<=80 80<=90 90<=95 95+
50
Australian banking system Total portfolio (all brands)
8
Australian housing portfolio by State (%)
Average LVR of new loans5 (%) 70 72 72
Average loan size ($’000) 219 221 223
Customers ahead on repayments, including offset accounts2,6 (%)
70 71 73
20
30
40
50 Total portfolio (all brands)1H14 drawdowns (all brands)
( )
Actual mortgage losses (net of insurance)7 ($m) 52 43 45
Actual mortgage loss rate
annualised (bps) 3 3 2 -
10
20
NSW & ACT VIC & TAS QLD WA SA & NT
Westpac Group | May 2014 | European Investor Roadshow 18
1 Flow is all new mortgage originations total settled amount originated during the 6 month period ended 31 March 2014 and includes RAMS. 2 Excludes RAMS. 3 Dynamic LVR represents the loan-to-value ratio taking into account the current outstanding loan balance, changes in security value and other loan adjustments. 4 Property valuation source Australian Property Monitors. 5 Average LVR of new loans is based on rolling 6 month window for each half year period. 6 Customer loans ahead on payments exclude equity/line of credit products as there are no scheduled payments. 7 Mortgage insurance claims 1H14 $3m (2H13 $14m, 1H13 $10m). 8 ABA Cannex February 2014.

Mortgage customers continuing to repay ahead of schedule
• Australian mortgage customers continue to display a cautious approach to debt levels, taking advantage of historically low mortgage rates to pay down debt
Australian home loan customers ahead on repayments1,2 (%) Mar-13 rates to pay down debt
– Including mortgage offset account balances, 73% of customers are ahead of scheduled payments, with 21% of these being more than 2 years ahead
– Excluding mortgage offset account balances, 56% of Australian t t h d f h d l d t 30
40
50
Sep-13Mar-14 Mar-14 inc. mortgage offset accounts
Ahead on repayments
exc. mortgage offset accounts
mortgage customers are ahead of scheduled payments
• Sound underwriting criteria underpin the Group’s very low level of residential mortgage arrears and losses
• Credit policies are broadly aligned across brands and all credit decisions are made by the Westpac Group, regardless of the
0
10
20
Behind On Time < 1 Month < 1 Year < 2 Years > 2 Years y gorigination channel
• Loan serviceability assessments include an interest rate buffer, adequate surplus test and discounts to certain forms of income (e.g. dividends, bonus or rental income)
• Westpac has a minimum assessment rate often referred to as a floor 15 2 (6 7) 20 8
Aust. mortgage offset account balances ($bn) Australian mortgage1 balance growth ($bn)
• Westpac has a minimum assessment rate, often referred to as a floor rate, currently set at 6.80% p.a. across all brands
• In the current interest rate environment, the minimum assessment rate is at least 185bps higher than the standard lending rate
312.5 31.9
15.2
321.5
(6.7) (15.1) (12.8) (3.5)
20.8
2H13
New
lend
ing
Red
raw
/ In
tere
st/fe
es
Con
tract
re
paym
ents
Acc
eler
ated
re
paym
ents
Pro
perty
sal
es &
ot
her r
unof
f
Ext
erna
l re
finan
ce
1H14
1H09
2H
09
1H10
1H
11
2H11
1H
12
2H12
1H
13
2H13
1H
14
Westpac Group | May 2014 | European Investor Roadshow 19
1 Excludes RAMS. 2 Customer loans ahead on payments exclude equity loans/line of credit products as there is no scheduled principal payments. ‘Behind’ is more than 30 days past due. ‘On time’ includes up to 30 days past due.

AUSTRALIANAUSTRALIAN HOME LENDINGHOME LENDING

Housing activity responding to lower rates
'upgraders' ex refinancing investor finance first home buyers
Housing finance approvals: value of housing finance ($bn/mth)
current 2008 09 2001 02 1996 97
Housing credit: rate cut cycles compared (index)
8
10
12
8
10
12 AUDbn/mth AUDbn/mth
upgraders , ex-refinancing investor finance first home buyers
140
150
160
140
150
160
Index* Index* current 2008-09 2001-02 1996-97
1990-93 1987-88 1983-84
*index based to 100 in month prior to first rate cut last 5yrs
0
2
4
6
0
2
4
6
F b 92 F b 97 F b 02 F b 07 F b 1290
100
110
120
130
90
100
110
120
130
0 3 6 9 12 15 18 21 24 27 thSources: RBA, Westpac Economics.
Feb-92 Feb-97 Feb-02 Feb-07 Feb-12Sources: ABS, Westpac Economics.
0 3 6 9 12 15 18 21 24 27 months
140 140 index index Sydney Perth Melbourne Brisbane
40 40 % %
%income required to service mortgage of 75% median dwelling all regions
deteriorate
House affordability: all dwellings (%) Dwelling prices: Australia capital cities (index)
110
120
130
110
120
130
25
30
35
25
30
35
of 75% median dwelling, all regions
long run avg
improve
10yr avg
90
100
110
90
100
110
Dec-07 Dec-08 Dec-09 Dec-10 Dec-11 Dec-12 Dec-13 10
15
20
10
15
20
Mar-79 Mar-84 Mar-89 Mar-94 Mar-99 Mar-04 Mar-09 Mar-14
estimates based on capital cities prior to 1993
Westpac Group | May 2014 | European Investor Roadshow 21
Sources: RP Data-Rismark, Residex, ABS, RBA, Westpac Economics. Sources: RP Data-Rismark, Residex, Westpac.

Australian housing market fundamentals sound
Australia Sydney Melbourne
Rental vacancy rates (%)
population dwelling stock*
Population versus dwelling stock (annual average change ‘000)
6 6
Australia Sydney Melbourne
400
population dwelling stock
* net of demolitions – implied by Census data to 2006; Westpac
% ’000 %
4
5
4
5 investor housing
300
350
3 3 200
250
1
2
1
2
50
100
150
0 0 Mar-84 Mar-89 Mar-94 Mar-99 Mar-04 Mar-09 Mar-14
0
50
1950s 1960s 1970s 1980s 1990s 2000s last 3 years
Westpac Group | May 2014 | European Investor Roadshow 22
Sources: REIA, Westpac Economics.
Sources: ABS, Westpac Economics.

A more cautious approach to household leverage by Australian households by Australian households
accumulated savings since Jun 07
Australian households: debt to income ratio (%)
debt serv ratio (mortgagors lagged 6mths rhs) arrears rate (lhs)*
Pressure easing on existing borrowers (%)
160
180
160
180
% %
accumulated savings since Jun-07
total (gross) debt
housing debt
total debt net of deposits*
trend since Jun-07 2 0
2.2 24
% %
debt serv ratio (mortgagors, lagged 6mths, rhs) arrears rate (lhs)
*% of securitised loans in arrears, by value, including self-securitised loans WBC
forecasts
120
140
160
120
140
160
*direct holdings of cash and deposits
1.6
1.8
2.0
20
22 forecasts
60
80
100
60
80
100 –25pts since peak
1.2
1.4
16
18
20
40
20
40
= 52.9%
~20pts elsewhere? 0.8
1.0
12
14
-20
0
Mar-77 Mar-87 Mar-97 Mar-07 -20
0
0.4
0.6
Jan-96 Jan-99 Jan-02 Jan-05 Jan-08 Jan-11 Jan-14 10
12
Westpac Group | May 2014 | European Investor Roadshow 23
Sources: ABS, RBA, Westpac. Sources: ABS, RBA, Standard & Poor's, Westpac Economics.
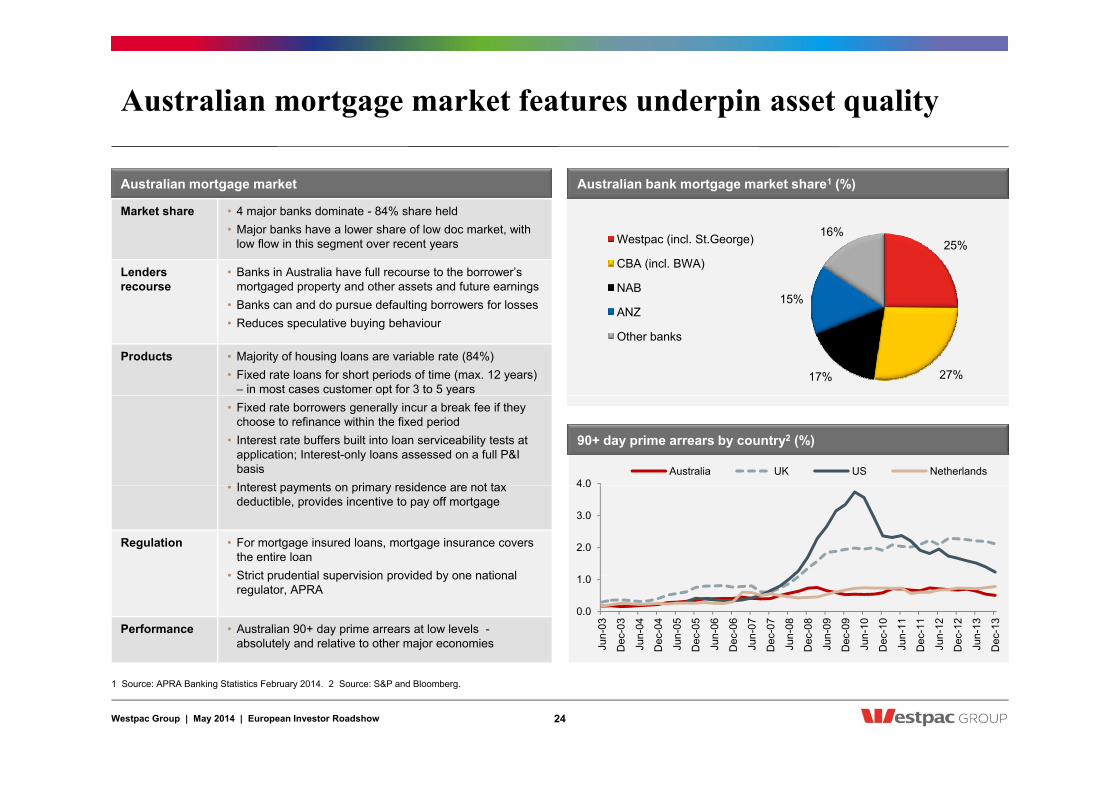
Australian mortgage market features underpin asset quality
Australian mortgage market
Market share • 4 major banks dominate - 84% share held
Australian bank mortgage market share1 (%)
j• Major banks have a lower share of low doc market, with
low flow in this segment over recent years
Lenders recourse
• Banks in Australia have full recourse to the borrower’s mortgaged property and other assets and future earnings
• Banks can and do pursue defaulting borrowers for losses
25%
15%
16% Westpac (incl. St.George)
CBA (incl. BWA)
NAB • Banks can and do pursue defaulting borrowers for losses• Reduces speculative buying behaviour
Products • Majority of housing loans are variable rate (84%) • Fixed rate loans for short periods of time (max. 12 years)
– in most cases customer opt for 3 to 5 years27% 17%
ANZ
Other banks
90+ day prime arrears by country2 (%)
• Fixed rate borrowers generally incur a break fee if they choose to refinance within the fixed period
• Interest rate buffers built into loan serviceability tests at application; Interest-only loans assessed on a full P&I basis Interest payments on primary residence are not tax 4 0
Australia UK US Netherlands • Interest payments on primary residence are not tax
deductible, provides incentive to pay off mortgage
Regulation • For mortgage insured loans, mortgage insurance covers the entire loan
• Strict prudential supervision provided by one national
2.0
3.0
4.0
• Strict prudential supervision provided by one national regulator, APRA
Performance • Australian 90+ day prime arrears at low levels - absolutely and relative to other major economies
0.0
1.0
Jun-
03
Dec
-03
Jun-
04
Dec
-04
Jun-
05
Dec
-05
Jun-
06
Dec
-06
Jun-
07
Dec
-07
Jun-
08
Dec
-08
Jun-
09
Dec
-09
Jun-
10
Dec
-10
Jun-
11
Dec
-11
Jun-
12
Dec
-12
Jun-
13
Dec
-13
Westpac Group | May 2014 | European Investor Roadshow 24
1 Source: APRA Banking Statistics February 2014. 2 Source: S&P and Bloomberg.

Australian investment property portfolio performing well
• Investment property loans (IPLs) 44% of Westpac’s Australian mortgage portfolio
• 46% of IPL loans originated at 75-80% LVR to 50 Owner Occupied IPL
Loan-to-value ratio at origination1 (%)
25 Owner Occupied IPL
Applicants by gross income band1 (%)
• 46% of IPL loans originated at 75-80% LVR, to maximise tax benefits and avoid mortgage insurance costs
• Majority of IPLs are interest-only, however the actual amortisation profile closely tracks the principal and interest portfolio 20
30
40
50 p
10
15
20
25 Owner Occupied IPL
IPL average dynamic LVR1 51%
– 41% of interest-only IPL customers ahead on repayments
• Compared to owner-occupied applicants, IPL applicants on average are older, have higher incomes and higher credit scores
S ifi di li i l IPL i
0
10
0-60
60-7
0
70-7
5
75-8
0
80-8
5
85-9
0
90-9
5
95-9
7
97+
0
5
0<=5
0
50<=
75
75<=
100
00<=
125
25<=
150
50<=
200
00<=
500
500<
=1m
1m+
• Specific credit policies apply to IPLs to assist risk mitigation, including
– Holiday apartments subject to tighter acceptance requirements
– Additional LVR restrictions apply to single industry towns
All Non IPL
90+ days delinquency by customer type1 (%) IPL1 portfolio (%)
By customer type
7 10 12 15 20 5
Loss rates1 (bps)
11.0 industry towns
• IPL delinquency performance historically better than portfolio average
– At 1H14, IPL 90+ days delinquencies were 39bps compared to 50bps for total portfolio
IPL losses $22m1 in 1H14 representing an 0.5
1.0
Non-IPLMix (IPL & Owner Occ.) Multi (More than 1 IPL) Single IPL
28
25
48 2.2 3.1 1.2
l o . o
2
• IPL losses $22m1 in 1H14, representing an annualised loss rate of 3bps
• Self-managed Super Fund balances a very small part of the portfolio, at <1% of Australian mortgage balances
0.0
0.5
Mar
-10
Sep
-10
Mar
-11
Sep
-11
Mar
-12
Sep
-12
Mar
-13
Sep
-13
Mar
-14
Single IPL Mix (IPL & Owner Occ.) Multi (>1 IPL)
1H14
tota
lpo
rtfol
io
1H14
IPL
portf
oli o
1H14
Ow
ner O
cc.
portf
olio
1992
tota
l por
tfolio
(last
rece
ssio
n)
Westpac Group | May 2014 | European Investor Roadshow 25
1 Excludes RAMS. 2 The average number of securities for multi-IPL customers is two.
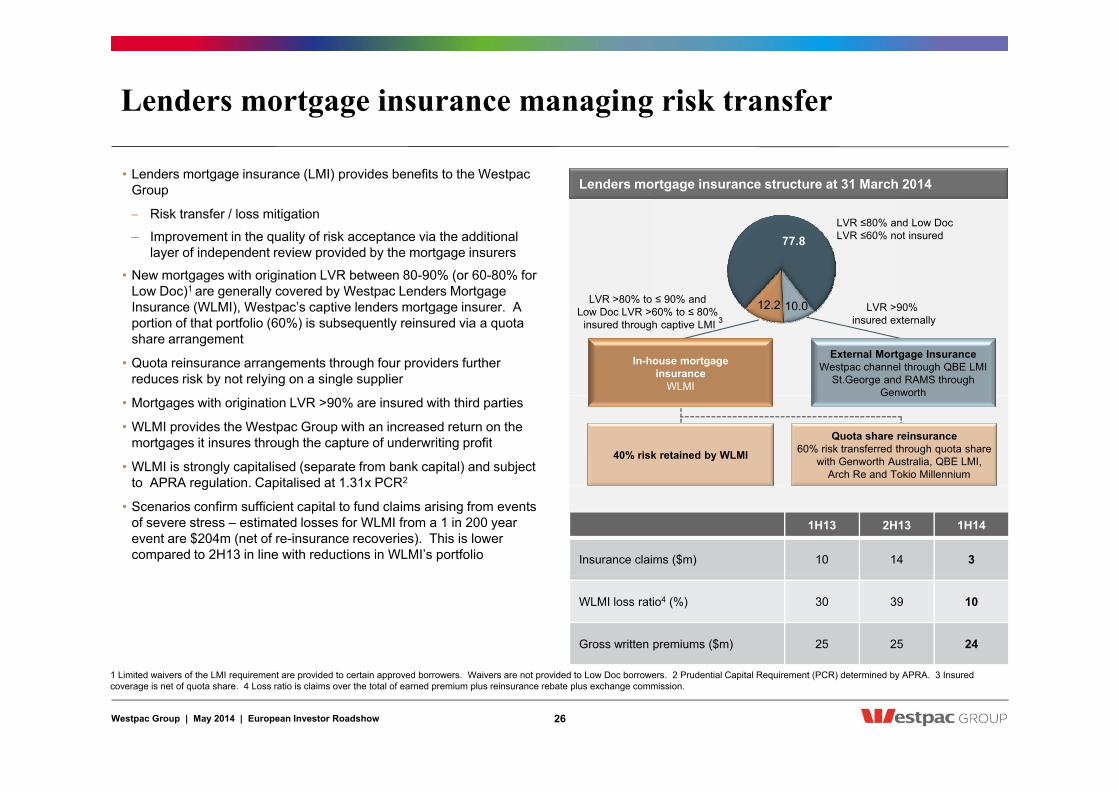
Lenders mortgage insurance managing risk transfer
Lenders mortgage insurance structure at 31 March 2014 • Lenders mortgage insurance (LMI) provides benefits to the Westpac
Group
– Risk transfer / loss mitigation
77.8
10 012 2LVR >80% to ≤ 90% and LVR >90%
LVR ≤80% and Low Doc LVR ≤60% not insured
Risk transfer / loss mitigation
– Improvement in the quality of risk acceptance via the additional layer of independent review provided by the mortgage insurers
• New mortgages with origination LVR between 80-90% (or 60-80% for Low Doc)1 are generally covered by Westpac Lenders Mortgage Insurance (WLMI) Westpac’s captive lenders mortgage insurer A 10.012.2Low Doc LVR >60% to ≤ 80%
insured through captive LMI LVR >90%
insured externally 3 Insurance (WLMI), Westpac s captive lenders mortgage insurer. A portion of that portfolio (60%) is subsequently reinsured via a quota share arrangement
• Quota reinsurance arrangements through four providers further reduces risk by not relying on a single supplier
In-house mortgage insurance
WLMI
External Mortgage Insurance Westpac channel through QBE LMI
St.George and RAMS through Genworth
40% risk retained by WLMI
• Mortgages with origination LVR >90% are insured with third parties
• WLMI provides the Westpac Group with an increased return on the mortgages it insures through the capture of underwriting profit
• WLMI is strongly capitalised (separate from bank capital) and subject to APRA regulation Capitalised at 1 31x PCR2
Quota share reinsurance 60% risk transferred through quota share
with Genworth Australia, QBE LMI, Arch Re and Tokio Millennium
Genworth
1H13 2H13 1H14
Insurance claims ($m) 10 14 3
to APRA regulation. Capitalised at 1.31x PCR
• Scenarios confirm sufficient capital to fund claims arising from events of severe stress – estimated losses for WLMI from a 1 in 200 year event are $204m (net of re-insurance recoveries). This is lower compared to 2H13 in line with reductions in WLMI’s portfolio
WLMI loss ratio4 (%) 30 39 10
Gross written premiums ($m) 25 25 24
Westpac Group | May 2014 | European Investor Roadshow 26
1 Limited waivers of the LMI requirement are provided to certain approved borrowers. Waivers are not provided to Low Doc borrowers. 2 Prudential Capital Requirement (PCR) determined by APRA. 3 Insured coverage is net of quota share. 4 Loss ratio is claims over the total of earned premium plus reinsurance rebate plus exchange commission.

Mortgage portfolio stress testing outcomes
Australian mortgage portfolio stress testing as at 31 March 2014
Key assumptions Stressed scenario
• Westpac regularly conducts a range of portfolio stress tests as part of its regulatory and risk management activities
Th A t li t tf li t t ti i t d Key assumptions Stressed scenario
Current Year 1 Year 2 Year 3
Portfolio size ($bn) 338 326 320 318
• The Australian mortgage portfolio stress testing scenario presented represents a severe recession and assumes that significant reductions in consumer spending and business investment lead to six consecutive quarters of negative GDP growth, resulting in a material increase in unemployment and nationwide falls in property and other asset prices
Unemployment rate (%) 5.8 11.6 10.6 9.4
Interest rates (cash rate, %) 2.5 1.25 1.25 1.25
House prices (% change cumulative) 0.0 -13.0 -22.4 -26.2
p
• Estimated Australian housing portfolio losses under stress conditions are manageable and within the Group’s risk appetite and capital base
– Cumulative total losses of $2.2bn over three years for the uninsured portfolio ( g )
Annual GDP growth (%) 2.8 -3.9 -0.2 1.7
Key outcomes
Stressed losses (bps) 2 26 32 7
uninsured portfolio
– Cumulative claims on LMI, both WMLI and external insurers, of $765m over the three years
• Westpac’s captive mortgage insurer, Westpac Lenders Mortgage Insurance (WLMI), separately conducts stress testing to ensure it is ( p )
(net of LMI recoveries)1,2 2 26 32 7sufficiently capitalised to cover mortgage claims arising from a stressed mortgage environment
• Preferred capital ranges incorporate buffers at the Westpac Group level that consider the combined impact on the mortgage portfolio and WLMI of severe stress scenarios
Westpac Group | May 2014 | European Investor Roadshow 27
1 Assumes 30% of LMI claims will be rejected in a stressed scenario. 2 Stressed loss rates are calculated as a percentage of mortgage exposure at default.

ECONOMICSECONOMICS
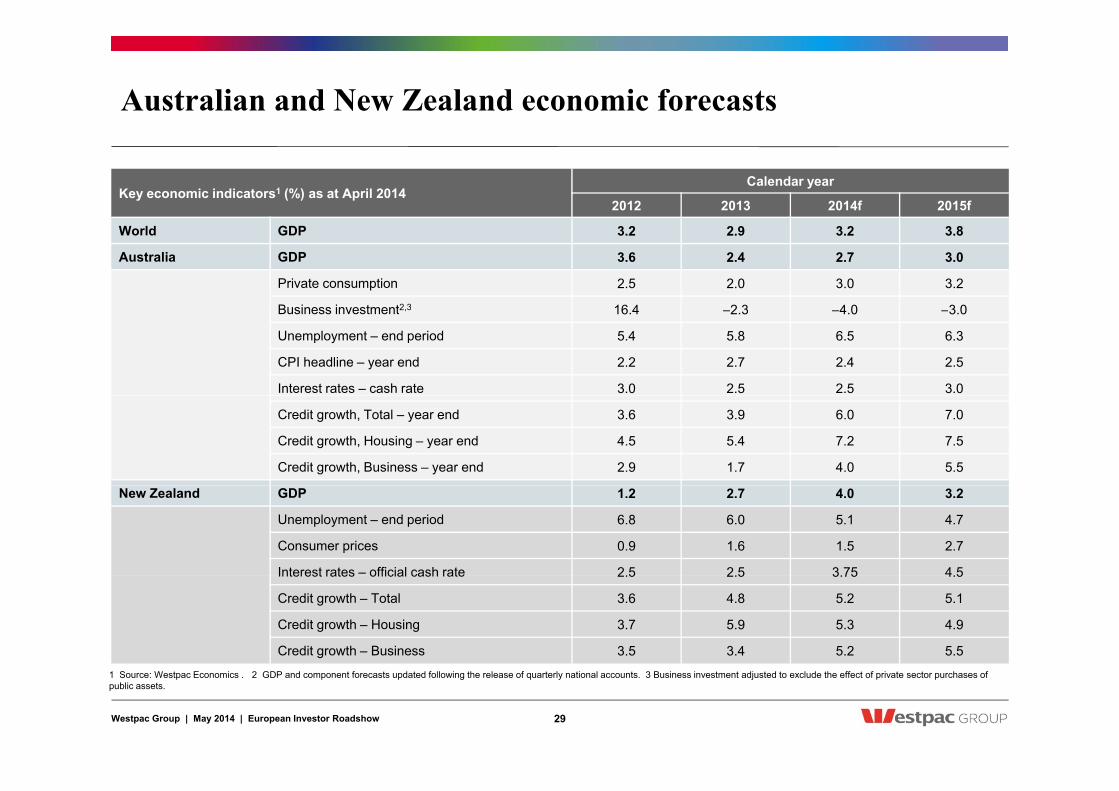
Australian and New Zealand economic forecasts
Key economic indicators1 (%) as at April 2014 Calendar year
2012 2013 2014f 2015f
World GDP 3.2 2.9 3.2 3.8
Australia GDP 3.6 2.4 2.7 3.0
Private consumption 2.5 2.0 3.0 3.2
B i i t t2 3 16 4 2 3 4 0 3 0Business investment2,3 16.4 –2.3 –4.0 –3.0
Unemployment – end period 5.4 5.8 6.5 6.3
CPI headline – year end 2.2 2.7 2.4 2.5
Interest rates – cash rate 3.0 2.5 2.5 3.0
Credit growth, Total – year end 3.6 3.9 6.0 7.0
Credit growth, Housing – year end 4.5 5.4 7.2 7.5
Credit growth, Business – year end 2.9 1.7 4.0 5.5
New Zealand GDP 1.2 2.7 4.0 3.2
Unemployment – end period 6.8 6.0 5.1 4.7
Consumer prices 0.9 1.6 1.5 2.7
Interest rates – official cash rate 2 5 2 5 3 75 4 5Interest rates official cash rate 2.5 2.5 3.75 4.5
Credit growth – Total 3.6 4.8 5.2 5.1
Credit growth – Housing 3.7 5.9 5.3 4.9
Credit growth – Business 3.5 3.4 5.2 5.5
Westpac Group | May 2014 | European Investor Roadshow 29
1 Source: Westpac Economics . 2 GDP and component forecasts updated following the release of quarterly national accounts. 3 Business investment adjusted to exclude the effect of private sector purchases of public assets.
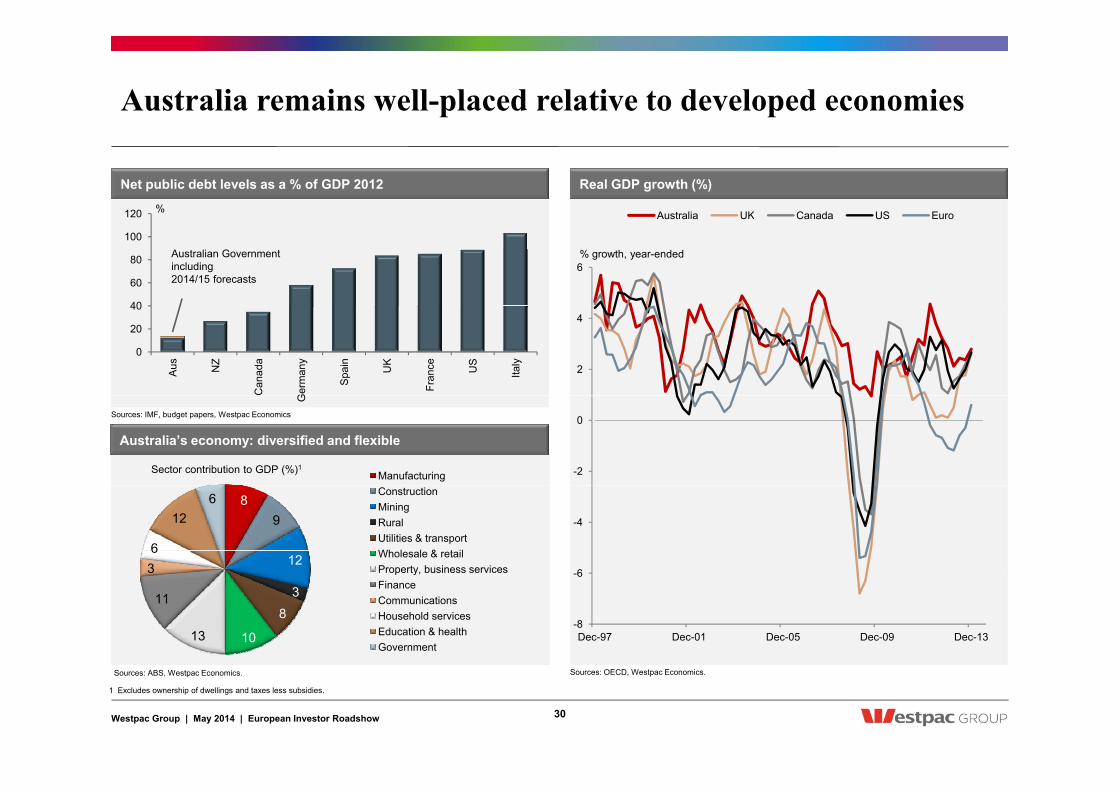
Australia remains well-placed relative to developed economies
Net public debt levels as a % of GDP 2012
120 % Australia UK Canada US Euro
Real GDP growth (%)
40
60
80
100
120
Australian Government including 2014/15 forecasts
6
Australia UK Canada US Euro
% growth, year-ended
0
20
40
Aus
NZ
Can
ada
Ger
man
y
Spa
in
UK
Fran
ce
US
Italy
2
4
Manufacturing
Australia’s economy: diversified and flexible
Sector contribution to GDP (%)1
Sources: IMF, budget papers, Westpac Economics .
G
-2
0
8 9
12 3 6
12 6 Construction
Mining Rural Utilities & transport Wholesale & retail Property, business services -6
-4
3 8
10 13
11 Finance Communications Household services Education & health Government
-8
6
Dec-97 Dec-01 Dec-05 Dec-09 Dec-13
Westpac Group | May 2014 | European Investor Roadshow
1 Excludes ownership of dwellings and taxes less subsidies.
30
Sources: ABS, Westpac Economics. Sources: OECD, Westpac Economics.

Australia’s economic transition from mining to non-mining
Australian growth mix: Contributions to GDP growth (%)
2012 2013 2014f 2015f mining CAPEX
Investment: share of Australian economy (% of GDP)
4 4
ppts
2012 2013 2014f 2015f
ann%
14 14 % of GDP % of GDP
mining, CAPEX
housing investment
business investment (ex mining)
f/cs end 2015
2
3
2
3
10
12
10
12 2015
1 1
6
8
6
8
-1
0
-1
0
* includes housing
2
4
2
4
-2 -2 Consumer* Mining inv. Business
investment Net Exports GDP
0
2
0
2
Dec-89 Dec-93 Dec-97 Dec-01 Dec-05 Dec-09 Dec-13
Westpac Group | May 2014 | European Investor Roadshow 31
Sources: ABS, Westpac Economics. Sources: ABS, Westpac Economics.

Commodity cycle evolves
itt d i t t (lh ) bulks* (lhs) exchange traded* (rhs)
Committed Australian projects and mining investment ($bn) Commodity prices (index)
120 300
$bn $bn
committed investment (lhs)
BREE* most likely projection
mining capital expenditure (rhs)
350
680
index index
bulks* (lhs) exchange traded* (rhs)
Westpac forecasts
80
100
200
250 *Bureau of Resources and Energy Economics
300
480
580
60 150 250
380
480
20
40
50
100
150
200
180
280
*b lk i l d i d l
0 0 2002/03 2006/07 2010/11 2014/15 2018/19
100 80 Apr-03 Apr-05 Apr-07 Apr-09 Apr-11 Apr-13
*bulks includes iron ore and coal. exchange traded includes rural, crude oil, base metals & gold.
Westpac Group | May 2014 | European Investor Roadshow 32
Sources: BREE, ABS, Westpac Economics. Sources: Westpac Economics, Bloomberg, ABS.

Cash rate expected to remain stable at 2.50%; AUD expected to trend lower over medium termAUD expected to trend lower over medium term
Australia UK Canada US Euro fair value band* AUD/USD actual & forecast
Australian dollar (AUD/USD) Major countries’ policy rates (%)
8
Australia UK Canada US Euro
%
1.20 1.20
USD USD
fair value band AUD/USD actual & forecast
*based on commodity prices, 2yr swap spread, and external debt
Fore-t
6
7
1.00
1.10
1.00
1.10 and external debt casts
4
5
0.80
0.90
0.80
0.90
latest: 0.92
1
2
3
0 50
0.60
0.70
0 50
0.60
0.70
0
1
Apr-07 Apr-08 Apr-09 Apr-10 Apr-11 Apr-12 Apr-13 Apr-14 0.40
0.50
0.40
0.50
Apr-91 Apr-95 Apr-99 Apr-03 Apr-07 Apr-11 Apr-15
Westpac Group | May 2014 | European Investor Roadshow
Sources: RBA, OECD, Westpac Economics. Sources: RBA, Westpac Economics.
33

Labour market showing some signs of improvement in early 2014
household services mining ‘000
in early 2014
Australia Canada UK US Euro
Unemployment rates (%) Cumulative change in industry employment (‘000)
200
300
400
500 construction goods distribution 000
14
Australia Canada UK US Euro
%
-200
-100
0
100
Mar 09 Mar 10 Mar 11 Mar 12 Mar 13 Mar 1410
12
Mar-09 Mar-10 Mar-11 Mar-12 Mar-13 Mar-14
8
business services public admin manufacturing other ‘000
Cumulative change in industry employment (‘000)
Sources: ABS, Westpac Economics
4
6
100
200
300
400
500
2 Mar-98 Mar-02 Mar-06 Mar-10 Mar-14 -200
-100
0
100
Mar-09 Mar-10 Mar-11 Mar-12 Mar-13 Mar-14
Westpac Group | May 2014 | European Investor Roadshow
Sources: OECD, Westpac Economics.
34
Sources: ABS, Westpac Economics

Credit growth picking up at a modest pace
Australian private sector credit growth (% ann)
Consumer (lhs) Business * (rhs) Housing Total credit Business
Business confidence and consumer confidence (net balance)
30 130
net bal. net bal.
Consumer (lhs) Business (rhs)
monthly 25 25
Housing Total credit Business
% ann % ann
f/cs end '1
10
20
110
120
15
20
15
20 '15
-10
0
90
100
5
10
5
10
30
-20
70
80
* rebased to avg 0 -5
0
-5
0
-40
-30
60
70
Apr-02 Apr-06 Apr-10 Apr-14 -10 -10
Jan-94 Jan-98 Jan-02 Jan-06 Jan-10 Jan-14
Westpac Group | May 2014 | European Investor Roadshow 35
Sources: Westpac MI, NAB, Westpac Economics. Sources: RBA, Westpac Economics

Chinese growth remains a positive for Australia
• As a $US7 trillion economy, China grew at 10%. As a $US10 trillion economy, Westpac expects China to grow at 7%
Represents an equivalent incremental contribution to global absorptive
Real GDP %ann 2012 2013 2014f 2015f
China 7.7 7.7 7.3 7.6 • Represents an equivalent incremental contribution to global absorptive
capacity, at higher levels of energy, protein, metal and consumer goods demand per head
• Were China to slow immediately to a 5% pace (a big downside shock that we do not envisage), it would still double its 2012 size by 2025
• Chinese authorities have shown a clear commitment to maintaining growth35 35
% of 2012 GDP % of 2012 GDP
8% CAGR
Chinese real GDP increments: 4 scenarios (% of 2012 GDP)
• Chinese authorities have shown a clear commitment to maintaining growth above 7% but will be less tolerant of strong credit driven expansions – the double digit growth rates that have featured regularly over the past 20 years are now unlikely to occur
• Australia’s economic linkages with China continue to grow, led by trade
– China now accounts for over 25% of Australia’s exports 25
30
25
30
8% CAGR
History & 7% CAGR
6% CAGR
5% CAGR
China now accounts for over 25% of Australia s exports
– Investment, tourism and migration flows also significant. Tourism arrivals from China are now 11% of all arrivals, with a CAGR of 13.1% between 2005 and 2013, against total arrivals growing at 1.9%. China was Australia's third largest source of foreign direct investment in the latest financial year. 15
20
15
20
• Australia will continue to benefit as Chinese households progressively expand their living standards and their consumption basket
5
10
5
10
0 0 1993 1998 2003 2008 2013 2018 2023 2028
Westpac Group | May 2014 | European Investor Roadshow 36
Source: Westpac Economics.

Chinese growth remains a positive for Australia
% 1980 2000 2010
China’s share of selected elements of world activity (%)
10
15
20
25 1980 2000 2010
0
5
10
Household consumption
Gross fixed capital formation
Exports Imports Manufacturing value added
Construction value added
Services value added
PPP GDP Nominal USD GDP
CO2 emissions Energy use 1 1 2 3
60 % GDP 2000 2007 2011 Ex China, nominal national
accounts basis for goods and
Sources: UN, IMF, IEA, Westpac Economics. All national accounts related shares are in 2005 constant US dollars. 1 Goods & services. 2 From fossil fuel combustion. 3 Total primary energy supply.
800 800 index index Total imports
Crude oil
Chinese imports – total and key primary products (index) Major countries nominal export shares (% GDP)
30
40
50
accounts basis for goods and services. For China, goods only, value-added estimates.
300
400
500
600
700
300
400
500
600
700 Crude oilIron ore Food
Value of total imports and food and volume of non-food raw materials.
0
10
20
AUD FRA DEU JPY KRW SEK TKL GBP USD BRL INR CNY 0
100
200
300
0
100
200
300
Jan-01 Jan-03 Jan-05 Jan-07 Jan-09 Jan-11 Jan-13
Westpac Group | May 2014 | European Investor Roadshow 37
Source: CEIC, Westpac Economics. Source: CEIC, OECD, Westpac Economics, Dragonomics.

A strong economic picture in New Zealand
• The New Zealand economy is experiencing a strong upturn driven by earthquake-related construction activity, last year’s rise in house prices a four decade high in the terms of trade and buoyant % %
New Zealand GDP growth and forecast (%)
prices, a four decade high in the terms of trade, and buoyant business investment activity. Annual economic growth is expected to peak at around 4%.
• Post-earthquake reconstruction in Canterbury is now in full swing, and residential construction activity is also ramping up in Auckland.
Th t i t ti t k d ti i fl ti 23 4 5 6 7
23 4 5 6 7
Westpac forecast
• The strong economy is starting to provoke domestic inflation pressures – construction costs in particular are starting to rise.
• Rising interest rates and the unwind of the Canterbury rebuild are expected to cause slower economic growth over the second half of this decade. -3
-2 -1 0 1 2
-3 -2 -1 0 1 2
1999 2001 2003 2005 2007 2009 2011 2013 2015 20171999 2001 2003 2005 2007 2009 2011 2013 2015 2017Source: Statistics NZ, Westpac Economics
1.6 1.6 $bn $bn
Earthquake-related construction activity in Christchurch ($bn)
0.8
1.0
1.2
1.4
0.8
1.0
1.2
1.4 Residential
Commercial
Infrastructure
Estimate Forecast
0.0
0.2
0.4
0.6
0.0
0.2
0.4
0.6
2011 2012 2013 2014 2015 2016 2017 2018 2019 2020 2021 2022
Westpac Group | May 2014 | European Investor Roadshow 38
Source: Westpac Economics

New Zealand housing market beginning to slow
• House price inflation peaked at 10% in 2013, but is now slowing. Westpac is forecast 5.5% house price inflation in 2014, and 1% in 2015 3030
ann % ann %
New Zealand house price inflation (annual %)
2015.
• Since 1 October 2013 the Reserve Bank has required banks to limit high-LVR lending to just 10% of total new mortgage lending. Turnover of smaller houses fell sharply, and house prices stagnated in early-2014. However, there is tentative evidence that prices have subsequently resumed their upward trajectory.
10
20
30
10
20
30
Westpac forecast
subsequently resumed their upward trajectory.
• Higher fixed mortgage rates are also affected the housing market. Financial markets moved last year to price in a substantial OCR hiking cycle.
• Offsetting these negative forces, net immigration is booming. The rate of population growth is expected to rise to rise to 1 6% in 2014
-20
-10
0
-20
-10
0
1999 2001 2003 2005 2007 2009 2011 2013 2015 2017rate of population growth is expected to rise to rise to 1.6% in 2014, up from 0.7% in 2012.
1999 2001 2003 2005 2007 2009 2011 2013 2015 2017Source: QV, Statistics NZ, Westpac Economics
9%
New Zealand Official Cash Rate (%)
4 5 6 7 8
Westpac forecast
0 1 2 3
1999 2001 2003 2005 2007 2009 2011 2013 2015 2017
Westpac Group | May 2014 | European Investor Roadshow 39
Source: RBNZ, Westpac Economics

SECURED FUNDINGSECURED FUNDINGCOVERED BONDS AND SECURITISATION
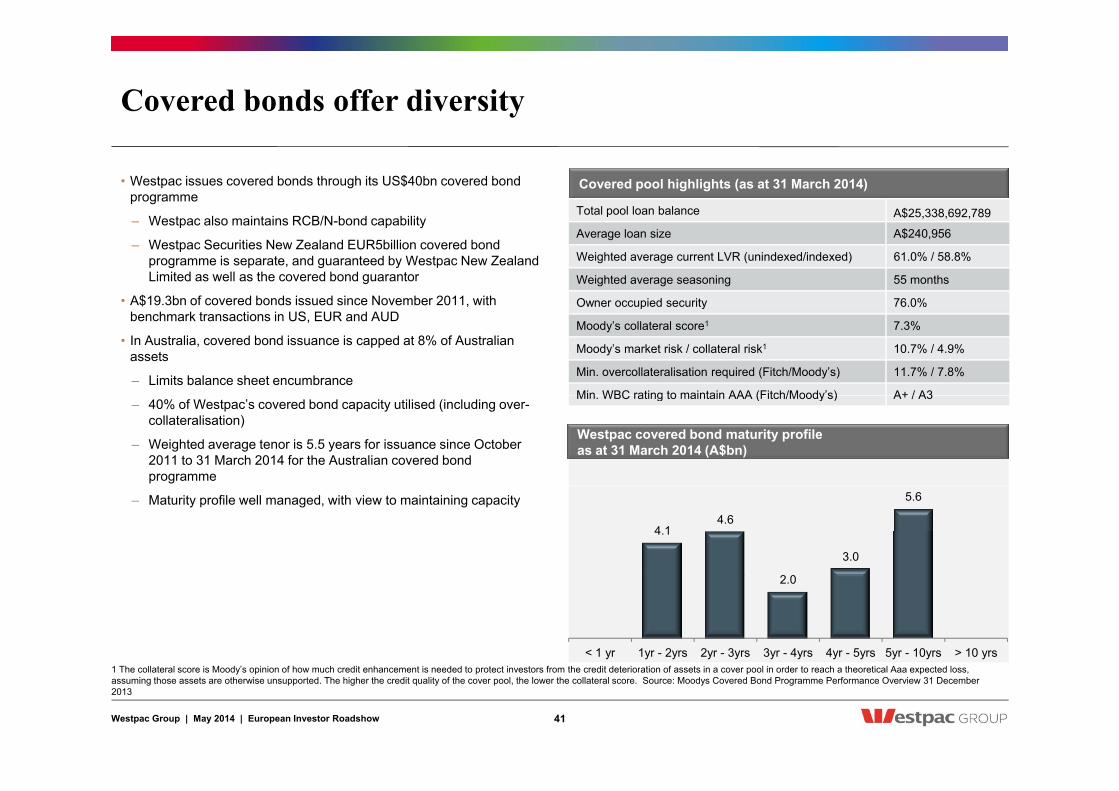
Covered bonds offer diversity
• Westpac issues covered bonds through its US$40bn covered bond programme
W t l i t i RCB/N b d bilit
Covered pool highlights (as at 31 March 2014)
Total pool loan balance A$25,338,692,789– Westpac also maintains RCB/N-bond capability
– Westpac Securities New Zealand EUR5billion covered bond programme is separate, and guaranteed by Westpac New Zealand Limited as well as the covered bond guarantor
• A$19.3bn of covered bonds issued since November 2011, with
p A$25,338,692,789
Average loan size A$240,956
Weighted average current LVR (unindexed/indexed) 61.0% / 58.8%
Weighted average seasoning 55 months
Owner occupied security 76.0%$ ,benchmark transactions in US, EUR and AUD
• In Australia, covered bond issuance is capped at 8% of Australian assets
– Limits balance sheet encumbrance
Owner occupied security 76.0%
Moody’s collateral score1 7.3%
Moody’s market risk / collateral risk1 10.7% / 4.9%
Min. overcollateralisation required (Fitch/Moody’s) 11.7% / 7.8%
Min WBC rating to maintain AAA (Fitch/Moody’s) A+ / A3– 40% of Westpac’s covered bond capacity utilised (including over-
collateralisation)
– Weighted average tenor is 5.5 years for issuance since October 2011 to 31 March 2014 for the Australian covered bond programme
Min. WBC rating to maintain AAA (Fitch/Moody s) A+ / A3
Westpac covered bond maturity profile as at 31 March 2014 (A$bn)
– Maturity profile well managed, with view to maintaining capacity
4.1 4.6
2 0
3.0
5.6
2.0
< 1 yr 1yr - 2yrs 2yr - 3yrs 3yr - 4yrs 4yr - 5yrs 5yr - 10yrs > 10 yrs
Westpac Group | May 2014 | European Investor Roadshow 41
1 The collateral score is Moody’s opinion of how much credit enhancement is needed to protect investors from the credit deterioration of assets in a cover pool in order to reach a theoretical Aaa expected loss, assuming those assets are otherwise unsupported. The higher the credit quality of the cover pool, the lower the collateral score. Source: Moodys Covered Bond Programme Performance Overview 31 December 2013

Westpac Covered Bond Programme
Issuer Westpac Banking Corporation
Issuer rating AA-/Aa2/AA- by S&P / Moody’s / Fitch
Format Legislative Covered Bond
Covered Bond rating Aaa / AAA by Moody’s / Fitch
Programme size US$40 billion
M t it ti S ft d H d B ll tMaturity options Soft and Hard Bullet
Covered Bond Guarantor Westpac Covered Bond Trust, a special purpose vehicle (trust)
Covered Bond Guarantee Covered Bond Guarantor has guaranteed payments of interest and principal under the Covered Bonds Covered Bond Guarantee secured over the Mortgage Loans and its other assets (limited in recourse to its assets)
LVR cap in asset coverage test 80% (subject to indexation)
Asset percentage Subject to rating agency requirements programme maximum 95%Asset percentage Subject to rating agency requirements, programme maximum 95%
Collateral Prime Australian residential mortgages
Listing London Stock Exchange
Westpac Group | May 2014 | European Investor Roadshow 42

Programme features
Structure Covered Bonds are issued by Westpac, backed by an unconditional and irrevocable guarantee by the Covered Bond Guarantor (the “CBT Guarantor”), which is limited in recourse to the assets in the Westpac Covered Bond T tTrust
Security
Security comprises a pool of Australian residential mortgages which meet the eligibility criteria (the “cover pool”). It also includes certain other assets such as cash and investments (subject to legislative and rating agency limits). Mortgages in the cover pool sold to the CBT Guarantor to ensure that covered bondholders have a priority claim over the cover pool in the event of Issuer insolvencyover the cover pool in the event of Issuer insolvency
Prior to service of a Notice to Pay on the CBT Guarantor, an Asset Coverage Test will be run monthly to ensure the CBT Guarantor has sufficient assets to support the outstanding covered bonds. Defaulted loans will have nil value applied to them and remaining loans adjusted by the Asset Percentage. The Asset Percentage will be confirmed by
Overcollateralisation pp g j y g g y
the rating agencies quarterly and is subject to a maximum of 95%, which represents a minimum level of overcollateralisation of just over 5%.
Following service of a Notice to Pay on the CBT Guarantor, an Amortisation Test is run monthly to ensure the CBT Guarantor has sufficient assets to meet the covered bond obligations
Asset Monitor
PricewaterhouseCoopers monitors the calculation of the Asset Coverage Test and the Amortisation Test on at least an annual basis.
They also provide the asset monitor reporting requirements in relation to the legislation on at least a six monthly basis This includes verification of the asset register and provision of any other information APRA requiresbasis. This includes verification of the asset register and provision of any other information APRA requires
Hedging The Total Return Swap and Covered Bond Swap will be used to hedge any exposure of the CBT Guarantor to interest rate and currency risks
Westpac Group | May 2014 | European Investor Roadshow 43

Westpac cover pool
At the time of sale, each loan: Total pool loan balance1 A$25 338 692 789
Covered Bond Pool eligibility criteria Covered pool loan statistics as at 31 March 2014
• Is denominated and payable only in AUD in Australia
• Is secured by a mortgage that constitutes a first ranking Australian mortgage (second allowed as long as first held with the CBT Guarantor)
• Is secured by a mortgage over a property which has erected on it a residential dwelling
Total pool loan balance1 A$25,338,692,789
Number of loans 105,159
Average loan size A$240,956
residential dwelling
• Was approved and originated by the seller in the ordinary course of business
• Is a loan under which the outstanding principal balance owed by the borrower is not more than AUD$2,000,000
• Is a loan under which the relevant borrower is required to repay the loan
Max loan size A$2,000,000
Weighted average current LVR (unindexed) 61%
Weighted average current LVR (indexed) 58.8%
within 30 years of the relevant cut-off date
• Is not a delinquent mortgage or a defaulted loan and no legal demand has been served on the relevant borrower in respect of a payment on the loan
• The sale of an interest in, or the sale of an interest in any related security, does not contravene or conflict with any law
Mortgage Insured 14.8%
90 day + arrears 0.01%
Weighted average seasoning 55 months• The relevant borrower is a resident of Australia
• Not a loan with an interest only payment period of >10 years
• The related mortgage has been or will be stamped
• Where applicable, all progress drawings have been made by the borrower d th id ti l d lli h b l t d d
g g g
Weighted average remaining term to maturity 274 months
Weighted average interest rate 5.3%
and the residential dwelling has been completed; and
• The borrower has made at least one monthly payment or two fortnightly payments in respect of the loan
Fixed / floating split (by bal) 18.6% / 81.4%
Interest only (by bal) 26.9%
Owner occupied security 76.0%
Westpac Group | May 2014 | European Investor Roadshow 44
1 Pool loan balance excludes cash balances of A$4,661,307,211. Loans included in the cover pool are currently only originated by Westpac Retail and Business Banking.

Cover pool statistics as at 31 March 2014
Loan to value ratio by balance (%)
40 Current LVR (unindexed) Current LVR (indexed)
Geographic distribution by state
Northern20
30
40 Current LVR (unindexed) Current LVR (indexed)
Queensland $3,466.0m, 13.6%
Western Australia $3,309.8m, 13.1% South Australia
$1,256.6m, 5.0%
NorthernTerritory $258.0m,
1.0%
0
10
0 50% 50 55% 55 60% 60 65% 65 70% 70 75% 75 80% 80 100% > 100%
Portfolio seasoning
Victoria $6 839 9m
New South Wales $9,227.7m, 36.4%
$1,256.6m, 5.0%
Australian Capital Territory
$676.0m, 2.7%
0-50% 50-55% 55-60% 60-65% 65-70% 70-75% 75-80% 80-100% > 100%
18 00020,000 30 % of pool by balance (lhs)
$6,839.9m 27%
Di t ib ti b i V l f l (A$ ) % of pool by
Tasmania $304.5m, 1.2%
6,000 8,000 10,00012,00014,00016,00018,000
10
15
20
25 Number of loans (rhs)
Distribution by region Value of loans (A$m) % of pool by value
Metropolitan 19,835 78.3%
Non-Metropolitan 5,503 21.7%
0 2,000 4,000
-
5
< 6Mth
6 mths -
1yr
1yr - 2yrs
2yrs - 3yrs
3yrs - 4yrs
4yrs - 5yrs
5yrs - 6yrs
6yrs - 7yrs
7yrs - 8yrs
8yrs - 9yrs
9yrs - 10yrs
> 10 yrs
Westpac Group | May 2014 | European Investor Roadshow 45

Cover pool statistics as at 31 March 2014 (cont.)
% of pool (lhs) Number of loans (rhs)
Mortgage principal balance distribution Interest rate split (%)
10 000
15,000
20,000
25,000
30,000
10
15
20
25
30 % of pool (lhs) Number of loans (rhs)
18.6
Fixed
-
5,000
10,000
-
5
10
0-10
0K
00-2
00k
200-
300k
300-
400k
400-
500k
500-
750k
750k
-1m
m -
1.5m
> 1.
5m
81.4
Floating
Years to maturity (legal) Interest only expiry date remaining period
1 2 3 4 5 7 1m
100 000100% of pool by balance (lhs) Number of loans (rhs) % of interest only loans by balance (lhs) Number of loans (rhs)
30 00040,000 50,000 60,000 70,000 80,000 90,000 100,000
30 40 50 60 70 80 90
100
4,000
6,000
8,000
10,000
20
30
40
0 10,000 20,000 30,000
- 10 20 30
< 1 yr 1yr - 5yrs 5yrs - 10yrs > 10 yrs 0
2,000
-
10
< 6 mths 6 mths - 1yr
1yr - 2yrs 2yrs - 3yrs 3yrs - 4yrs 4yrs - 5yrs > 5 yrs
Westpac Group | May 2014 | European Investor Roadshow 46

Securitisation an important part of the Group’s funding
• Securitisation is an important part of the Group’s funding
A$11 5bn in outstanding issuance at 31
Westpac has been a consistent RMBS issuer
Original RMBS and ABS issuance by calendar year (A$bn)– A$11.5bn in outstanding issuance at 31 March 2014, represents 2% of the Group’s total funding, mostly RMBS issuance
– Provides additional diversity to funding and investor base
8.3 7 8 9
10 WST Crusade
Westpac re opensWestpac re opens
A$1.2bn Auto ABS in Dec 2012 - first for a major Australian bank
A$1.2bn Auto ABS in Dec 2012 - first for a major Australian bank
WST Trust Series 2013-1, A$2.1bn in Feb 2013, and WST Trust 2013-2 in Oct
WST Trust Series 2013-1, A$2.1bn in Feb 2013, and WST Trust 2013-2 in Oct
Original RMBS and ABS issuance by calendar year (A$bn)
and investor base
– Only major Australian bank to have an active Auto ABS capability
– Westpac’s RMBS and Auto ABS transactions have been well supported b th A t li d ti k t 1 9
7.0
2.0
4.4 4.4
5.7 5.7 5.9
1 2 3 4 5 6
Westpac re-opens domestic RMBS market with first major bank deal since 2009
Westpac re-opens domestic RMBS market with first major bank deal since 2009
2013 $A2.252013 $A2.25
by the Australian domestic market, as well as offshore investors
• Westpac has outstanding securitisation transactions under both the WST and Crusade programmes
1.9 2.01.11.0 1.2 1.0
- 1
2004 2005 2006 2007 2008 2009 2010 2011 2012 2013
Minimal changes to Lloyd’s Bella securitisations Minimal changes to Lloyd’s Bella securitisations Post St.George merger Post St.George merger – Westpac Securitisation Trust (WST)
Programme is Westpac’s programme for securitising Westpac-originated residential mortgages
– Crusade Programme is Westpac’s
Following the completion of the acquisition of Capital Finance Australia Limited ("CFAL") and the Bella securitisations on 31 December 2013 as part of acquisition of Lloyds Banking Group’s Australian business, it is intended that the only changes to the existing Bella securitisations will be: • The interest rate swaps have been novated to Westpac Banking
Following the completion of the acquisition of Capital Finance Australia Limited ("CFAL") and the Bella securitisations on 31 December 2013 as part of acquisition of Lloyds Banking Group’s Australian business, it is intended that the only changes to the existing Bella securitisations will be: • The interest rate swaps have been novated to Westpac Banking
• Securitisation management and execution integrated into one team
• Crusade RMBS Programme is currently in run off
• Crusade ABS platforms and
• Securitisation management and execution integrated into one team
• Crusade RMBS Programme is currently in run off
• Crusade ABS platforms and gvehicle for securitising St.George originated residential mortgages and auto loans
– Bella securitisation programme acquired 31 December 2013
The interest rate swaps have been novated to Westpac Banking Corporation
• The Trust Manager has been replaced with Westpac Securitisation Management Limited ("WSM"). WSM also manages Westpac's WST RMBS programme, the Crusade ABS (auto) programme and Westpac's covered bond programme
The interest rate swaps have been novated to Westpac Banking Corporation
• The Trust Manager has been replaced with Westpac Securitisation Management Limited ("WSM"). WSM also manages Westpac's WST RMBS programme, the Crusade ABS (auto) programme and Westpac's covered bond programme
pinfrastructure utilised for Auto ABS
• New securitisation RMBS pools currently sourced solely from Westpac originated mortgage pools
pinfrastructure utilised for Auto ABS
• New securitisation RMBS pools currently sourced solely from Westpac originated mortgage pools
Westpac Group | May 2014 | European Investor Roadshow 47

WST RMBS performance
Key pool comparison statistics (issuance)
WST WST WST WST WST WST WST
High quality product
All WST transactions backed by prime residential mortgages
Consistently outperforms both the Australian Prime SPIN Index
Consistent pool characteristics and
2013-2 2013-1 2012-1 2011-3 2011-2 2011-1 2009-1
Pricing Date Sep-13 Feb-13 May-12 Oct-11 Jun-11 Feb-11 Dec-09
Tranche A A A A A A A
WAL (yrs) 3.0 3.0 3.0 3.0 2.9 2.9 2.6 Consistent pool characteristics and transaction structures
Low LVRs
Long seasoning
Price (bps) 85 85 140 125 100 100 130
Notes Issued A$m 2,070 1,932 1,058 1,472 2,024 920 1,840
Average Loan Size A$'000 256 245 211 251 243 270 198
Wtd Avg LVR 62% 61% 63% 63% 63% 64% 58%
LVR > 80% 10.8% 6.4% 3.1% 1.9% 2.3% 1.4% 0.5%
Max LVR 95% 94.6% 94.4% 95% 95% 95% 93%
Wtd Avg Seasoning mths 37.1 45.4 42.0 37.0 35.8 30.2 39.7
Low Doc Loans 0.0% 0.0% 0.0% 0.0% 0.0% 0.0% 0.0% 3
4 WST Arrears SPIN Major Bank SPIN
Performance of Avg WST vs the Major Bank Prime SPIN
Interest Only Loans 24.3% 9.6% 5.1% 6% 5% 4% 25%
NSW & ACT 35.2% 36.2% 37.6% 40% 39% 43% 41%
VIC 26.6% 25.0% 25.5% 25% 25% 28% 24%
Metro / Non-metro 78%/22% 76%/24% 76% / 24% 77% / 23% 77% / 23% 86% / 14% 78% / 22% 1
2
Major Bank SPINRegional Bank SPIN
LMI Coverage 13% 16% 19% 14% 16% 5% 6%
S&P Credit Support Pre-LMI (Old Criteria) - - - 3.6% 3.7% 3.2%
S&P Credit Support Pre-LMI (New Criteria / RFC) 5.0% 4.3% 4.3% 4.4% 7.2% - -
Credit Support Provided 8.0% 8.0% 8.0% 8.0% 8.0% 8.0% 8.0%
0
Mar
-06
Sep-
06
Mar
-07
Sep-
07
Mar
-08
Sep-
08
Mar
-09
Sep-
09
Mar
-10
Sep-
10
Mar
-11
Sep-
11
Mar
-12
Sep-
12
Mar
-13
Sep-
13
Mar
-14
Westpac Group | May 2014 | European Investor Roadshow 48
Source: Presales, Bloomberg, Westpac ABS Strategy Source: Standard and Poor’s RMBS Performance Watch

Crusade ABS transaction comparison
• Credit enhancement in excess of minimum required by rating agencies • 12 month revolving period
• Crusade ABS – 100% auto receivables • Long seasoning
Deal Crusade ABS 2013-1 Crusade ABS 2012-1 SMART 2013-3 REDS 2013-1 EHP Bella 2012-1 (Issue Date) (Dec 13) (Dec 12) (Sep 13) (May 2013) (May 2012) Size $1.0bn $1.2bn $500m $900m $453m ‘AAA’ Credit Enhancement 16% 15% 16 5% 20% 23%AAA Credit Enhancement 16% 15% 16.5% 20% 23%
Collateral Auto: 100% Auto: 100% Motor Vehicles: 83% Other: 17%
Cars, Trucks, Buses: 53% Other: 47%
Cars, Trucks, Buses: 64% Other: 36%
Number of Contracts 52,309 59,609 15,410 16,199 13,048 W.A. Yield 11% 11% 8% 8% 9% W.A. Seasoning (mth) 22 19 9 18 15 W.A. Remaining term (mth) 39 41 44 34 37 W.A. Balloon 8% 8% 14% 13% 15% % of Pool with Balloon 31% 32% 49% 40% 53% New vs. Used New: 70% New: 69% New: 59% New: 62% New: 70%1 Used: 30% Used: 31% Used: 41% Used: 38% Used: 30%1
Average Loan Size A$ 19 117 20 131 32 122 54 864 34 344Average Loan Size A$ 19,117 20,131 32,122 54,864 34,344Max Loan Size A$ 240,946 262,970 901,527 867,594 780,586 Receivable Contracts Finance Lease 12% Finance Lease 12% Finance Lease 11% Finance Lease 7% Finance Lease 11% Goods Loan 15% Goods Loan 14% Goods Loan 49% Hire Purchase 22% Goods Loan 43%
Hire Purchase 5% Hire Purchase 8% Hire Purchase 7% Specific Security Agreement 70% Hire Purchase 35%
C Fi 68% C Fi 66% C L / L 22% N t d L 12% Consumer Finance 68% Consumer Finance 66% Consumer Loan / Lease 22% Novated Lease 12%
Lease Gov Status 11%
Adverse Credit History 0% 0% 0% 0% 0% Novated receivables 12% 12% 21% 0% 12%
Westpac Group | May 2014 | European Investor Roadshow 49
1 Denotes the split of new and used Cars and Light Commercial Vehicles only (57% of the collateral pool)
ADDITIONAL INFORMATIONINFORMATION

Limited asset encumbrance
Westpac’s asset encumbrance • Westpac has limited asset encumbrance
• Covered bond capacity has legislated cap
80.0%
90.0%
100.0%
80%
90%
100% in Australia and New Zealand
– In Australia, capped at 8% of Australian assets, providing $48bn total capacity (including overcollateralisation)
40.0%
50.0%
60.0%
70.0%
40%
50%
60%
70%– In NZ, capped at 10% of Westpac New Zealand Ltd assets, providing $7bn total capacity
• RMBS and ABS are primarily issued at tenors that match the underlying assets
10.0%
20.0%
30.0%
40.0%
10%
20%
30%
0%
Total 6.8 %
Total 11.0% (inc remaining covered bond
capacity)
y g(i.e. match funded)
• Covered bonds used mainly to access longer dated funding, with average issue tenor around 5 years
0.0% Westpac Encumbered Assets 1H14
Australia & NZ covered bond pools
Securitised mortgages
0% Westpac Total Assets (1H14)
Loans - housing and personal
Loans - business
Cash and balances with central banks Securitised mortgages
Auto loans
Assets purchased under agreement to resell
Remaining covered bond capacity (Aust. & NZ)
Cash and balances with central banks
Receivables due from other financial institutions
Trading securities, other financial assets at fair value & available-for-sale securities Derivative financial instruments
Life insurance and other assets
Westpac Group | May 2014 | European Investor Roadshow 51
Life insurance and other assets

Tier 2 Capital comparison
Characteristic Basel III compliant Tier 2 Old-style Tier 2 (specifically Lower Tier 2)
Ab b l "Absorb losses on a "gone concern" basis Gone concern capital Gone concern capital
Non-discretionary, cumulative payments
Must pay securities subject to solvency tests; deferred payments accumulate with compounding
Must pay securities subject to solvency tests; deferred payments accumulate with compounding
Minimum Term Minimum term of at least 5 years; straight line amortisation
Minimum term of at least 5 years; straight line amortisation Minimum Term over final four years over final four years
Call Right Can call after a minimum of five years with APRA's approval Can call after a minimum of five years with APRA's approval
Incentive to redeem No step-ups or other incentives to redeem early Step-up in margin permitted
Ranking in a Winding Up Rank ahead of claims of ordinary shareholders and Additional Tier 1 capital holders1
Rank ahead of claims of ordinary shareholders and hybrid Tier 1 capital holders
C i W it Off t
• Conversion or permanent write-off in contractual terms • Conversion or write-off only after Additional Tier 1 (some
or all as necessary to return to viability) Not applicable. However APRA has powers under the Conversion or Write-Off at Point of Non Viability (PONV)
o a as ecessa y to etu to ab ty)• Conversion is most likely principal loss absorption
mechanism due to tax inefficiencies of write-off alternative • If Conversion is not possible, rights of Holders will be
terminated
ot app cab e o e e as po e s u de t e
Banking Act to direct banks not to make payment on Lower Tier 2 instruments
• APRA notifies Westpac that it believes conversion or write off or a public sector injection of capital (or
PONV Trigger Event
write-off or a public sector injection of capital (or equivalent support), is necessary because, without it, Westpac would become non-viable
• No explicit APRA guidance regarding likely triggers. Non viability could be expected to include serious impairment of financial position, insolvency, capital ratios and liquidity
N/a
Westpac Group | May 2014 | European Investor Roadshow 52
1 APRA requires that new Basel III compliant Tier 2 instruments must be the most subordinated claim in a winding-up after Common Equity Tier 1 and Additional Tier 1 instruments. As Westpac has old-style perpetual "Upper Tier 2" instruments on issue that rank behind "old style" Lower Tier 2 instruments, any new Basel III Tier 2 instruments must rank equally with "old-style" Upper Tier 2 instruments. Once all "old style" Lower Tier 2 instruments have been redeemed all Tier 2 instruments will rank equally.

Tier 2 Capital comparison1,2
US Canada UK Scandinavia Australia
Ranking Senior to Tier 1 Capital
Senior to Additional Tier 1 Capital
Senior to Additional Tier 1 Capital
Senior to Additional Tier 1 Capital
Senior to Additional Tier 1 Capital
Step-ups Not permitted Not permitted Not permitted Not permitted Not permitted
Capital amortisation
20% p.a. beginning 5 years prior to
maturity (no credit in final year)
20% p.a. beginning 5 years prior to
maturity (no credit in final year)
20% p.a. beginning 5 years prior to
maturity (no credit in final year)
20% p.a. beginning 5 years prior to
maturity (no credit in final year)
4 years prior to maturity on a straight-line
amortised basis
Early redemption Tax Event / Regulatory Event
Tax Event / Regulatory Event
Tax Event / Regulatory Event
Tax Event / Regulatory Event
Tax Event / Regulatory Event
Point of Non-Viability
R l t R l t R l t R l tDefinition n.a. RegulatoryDiscretion
Regulatory Discretion
Regulatory Discretion
Regulatory Discretion
Approach n.a Contractual Statutory Statutory Contractual
Di l T & C diti Ri k f t Ri k f t T & C ditiDisclosure n.a Terms & Conditions Risk factor Risk factor Terms & Conditions
Primary loss absorption mechanism
n.a Conversion into ordinary shares Write-down Write-down Conversion into
ordinary shares
Westpac Group | May 2014 | European Investor Roadshow 53
1 Source UBS. 2 For Westpac, the rating for a Basel III compliant Tier 2 instrument is anticipated to be A3 (Moody’s)/BBB+ (S&P).
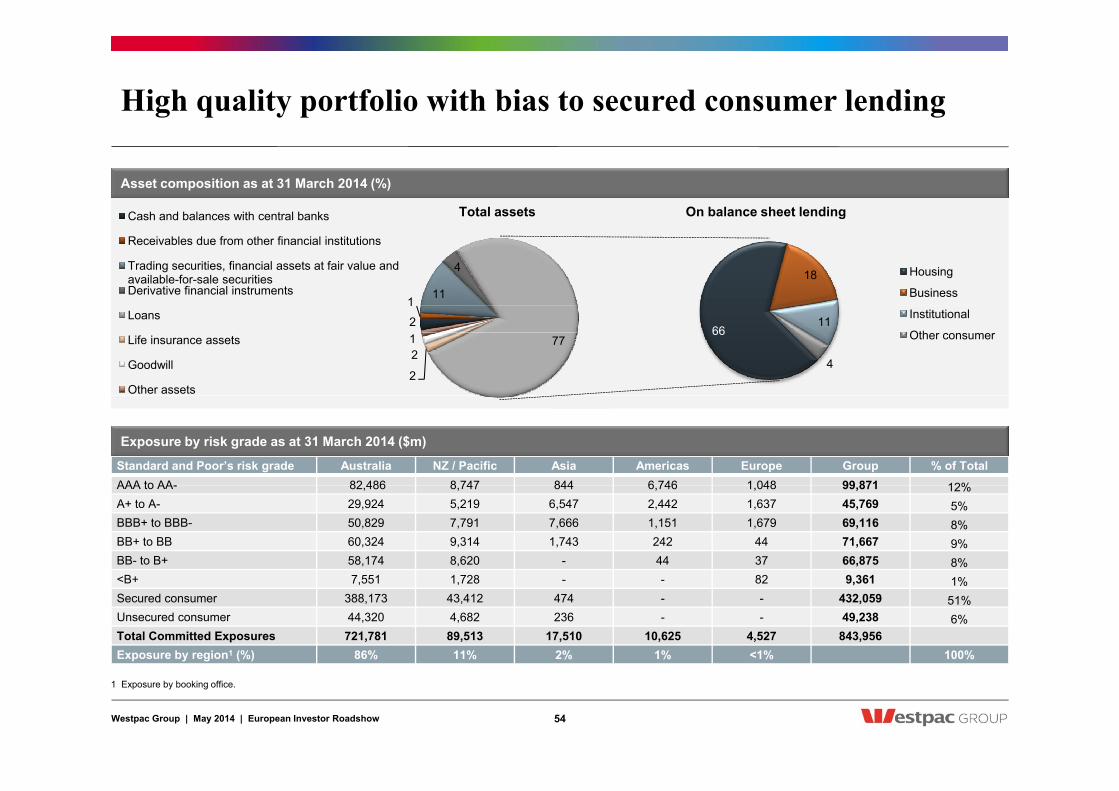
High quality portfolio with bias to secured consumer lending
Cash and balances with central banks
Asset composition as at 31 March 2014 (%)
On balance sheet lendingTotal assets
18 Housing
Business 1
11
4
Cash and balances with central banks
Receivables due from other financial institutions
Trading securities, financial assets at fair value and available-for-sale securities Derivative financial instruments
On balance sheet lendingTotal assets
66 11
4
Institutional
Other consumer 2
1
77
2
2 1
Loans
Life insurance assets
Goodwill
Other assets
Standard and Poor’s risk grade Australia NZ / Pacific Asia Americas Europe Group % of Total AAA to AA- 82 486 8 747 844 6 746 1 048 99 871 12%
Exposure by risk grade as at 31 March 2014 ($m)
AAA to AA- 82,486 8,747 844 6,746 1,048 99,871 12%A+ to A- 29,924 5,219 6,547 2,442 1,637 45,769 5% BBB+ to BBB- 50,829 7,791 7,666 1,151 1,679 69,116 8% BB+ to BB 60,324 9,314 1,743 242 44 71,667 9% BB- to B+ 58,174 8,620 - 44 37 66,875 8%
B 7 551 1 728 82 9 361<B+ 7,551 1,728 - - 82 9,361 1%Secured consumer 388,173 43,412 474 - - 432,059 51% Unsecured consumer 44,320 4,682 236 - - 49,238 6% Total Committed Exposures 721,781 89,513 17,510 10,625 4,527 843,956 Exposure by region1 (%) 86% 11% 2% 1% <1% 100%
Westpac Group | May 2014 | European Investor Roadshow 54
1 Exposure by booking office.

Diversification across industries and large exposures
Exposures at default1 by sector ($m) Top 10 exposures to corporations and NBFIs6 as a % of TCE5 (%)
Wholesale & Retail Trade
Property
Finance & insurance
2.0 2.0 1.9
1 4 1 3
Largest corporation/NBFI single name exposure represents less than 0.2% of TCE
3
2
Property & business services
Government admin. & defence
Manufacturing 1.4 1.3
1.1 1.2 1.31.1
FY06 FY07 FY08 FY09 FY10 FY11 FY12 FY13 1H14
Transport & storage
Agriculture, forestry & fishing
Services
1H13 2H13 1H14
FY06 FY07 FY08 FY09 FY10 FY11 FY12 FY13 1H14
AA-
Top 10 exposures to corporations & NBFIs6 as at 31 March 2014 ($m)
Accommodation, cafes & restaurants
Construction
Utilities
BBBA
A- A
A+ A
g or
equ
ival
ent
4
0 20,000 40,000 60,000 80,000 100,000
Other
Mining
0 300 600 900 1,200 1,500
A- BBB
BBB- BBB-
S&P
ratin
g
Westpac Group | May 2014 | European Investor Roadshow 55
1 Exposures at default represents an estimate of the amount of committed exposure expected to be drawn by the customer at the time of default. Chart excludes consumer lending. 2 Finance and insurance includes banks, non-banks, insurance companies and other firms providing services to the finance and insurance sectors. 3 Property includes both residential and non-residential property investors and developers, and excludes real estate agents. 4 Construction includes building and non-building construction, and industries serving the construction sector. 5 Includes St.George from 2009 onwards. 6 Non-Bank Financial Institutions.

Commercial property portfolio performing well
18 Commercial property exposure ($bn)
Commercial property exposures size ($bn) and % of TCE Commercial property portfolio by sector and region (%)
55 19
17 9
12
7
40
Update pie charts for 30 Sept 2013
9.6 9.1
8.0 7.7 7.1 6.5 6.9 6.8 6.7 6.6 6.7
10
Commercial property exposure ($bn)Commercial Property as % of TCE 16
10 8
6 5 9
46 54 19
17 10
Commercial offices & diversified groups
Retail
Residential
Industrial
7
7 7 9
NSW & ACT VIC QLD SA & NT WA NZ & Pacific
63 61 54 53 50 48 51 51 52 54 56
-2 10
1H09 2H09 1H10 2H10 1H11 2H11 1H12 2H12 1H13 2H13 1H14
NSW & ACT VIC
QLD SA & NT
WA NZ & Pacific
Institutional
Commercial offices & diversified groups
Retail
Residential
Industrial
• Improvement in the commercial property market has been underpinned by improved liquidity in the sector
Institutional1H09 2H09 1H10 2H10 1H11 2H11 1H12 2H12 1H13 2H13 1H14
15 2 15 5
Commercial property portfolio TCE classified as stressed (%) Commercial property markets
by improved liquidity in the sector• Investment market has remained very active over 1H14, with strong
interest in properties offering secure, long term cash flows from a variety of buyers
• Leasing market has been more subdued, although signs of improving demand are expected from mid 2014
12.5
15.2 15.5 13.7
11.7 9.7
7.7 6.4 p
• While investment activity has been strong and there is some evidence of prime yields firming, capital growth overall remains low, with total returns continuing to be driven by income
• While the availability of debt finance for commercial property has improved, underwriting standards have remained diligent
4.5 3.0
2H09 1H10 2H10 1H11 2H11 1H12 2H12 1H13 2H13 1H14
Westpac Group | May 2014 | European Investor Roadshow 56

Australian unsecured lending portfolio performing well
• Unsecured consumer asset quality has remained strong as continuing low interest rates have assisted debt serviceability and C dit d P l l ( l A t L )
Australian unsecured lending 90+ days delinquencies (%)
rates have assisted debt serviceability and the Group’s sound approach to credit decisioning has been maintained
• Overall Australian consumer unsecured delinquencies increased 9bps to 115bps (down 17bps 1H13/1H14) 1.55
1 50
2.00
2.50
3.00 Credit cards Personal loans (excl Auto Loans)
Total unsecured lending Auto loans
( p )
• Changes in delinquencies in 1H14 reflect normal seasonal trends
• Australian credit card 90+ days delinquencies were up 6bps to 99bps (down 13bps 1H13/1H14)
1.15
0.93
-
0.50
1.00
1.50
Sep 10 Mar 11 Sep 11 Mar 12 Sep 12 Mar 13 Sep 13 Mar 14
0.99
13bps 1H13/1H14)
– Average payments to balance ratio continued to trend upwards, increasing 99bps to 48.7%, reflecting ongoing consumer caution towards debt
Credit cards Personal Loans Auto Loans 48.7
Australian credit card average payments to balance ratio1 (%)
Australian unsecured lending portfolio as at 31 March 2014 ($bn and %)
Sep-10 Mar-11 Sep-11 Mar-12 Sep-12 Mar-13 Sep-13 Mar-14
• Australian personal loan portfolio (including auto loans) 90+ days delinquencies were up 11bps to 117bps (down 15bps 1H13/1H14)
– Auto loan portfolio increased to $7.4bn following acquisition of Lloyds 45
34 4.5
7.4
21.7
– Australian auto loan 90+ days delinquencies were up 17bps to 93bps (down 7bps 1H13/1H14)
21
1H07
2H07
1H08
2H08
1H09
2H09
1H10
2H10
1H11
2H11
1H12
2H12
1H13
2H13
1H14
9.8
4.5
1H14
Westpac Group | May 2014 | European Investor Roadshow 57
1 Cards average payments to balance ratio is calculated using the average payment received compared to the average statement balance at the end of the reporting month.

Wholesale funding portfolio
• Westpac’s wholesale funding strategy is focused on diversity and flexibility
Abl t i i b d f f t t d i 0
Wholesale funding composition1 as at 31 March 2014 (%)
• Able to issue in a broad range of formats, tenors and currencies, including covered bonds
• Westpac is the only Australian bank that is SEC registered
− A comparative advantage over peers
SEC i t d d l i l d d i th i d h t
15
5
2 1 9
2 3
0
− SEC registered deals are included in the index; have greater reach into investor base, including retail investors; deliver greater liquidity for investors and have a higher level of disclosure requirements
− Westpac also maintains its ability to issue in US 144A format
23 11
5
15 14
2 6
Term wholesale funding by currency2 as at 31 March 2014 (%)
Domestic Certificates of deposits
Commercial Paper Medium term notes
Covered bonds Securitisation
32
16
8 6
AUD USD
EUR JPY
Hybrids 144A
SEC Registered Samurai
Interbank deposits Other 35
GBP Other
Westpac Group | May 2014 | European Investor Roadshow 58
1 At FX spot currency translation. 2 Based on spot FX currency translation. Includes all debt issuance with contractual maturity greater than 13 months, excluding US Commercial Paper. USD issuance includes issuance in the US, Asia and other regions where USD buyers are located.

Westpac – Australia’s First Bank
Westpac balance sheet as at 31 March 2014 (A$)
Total assets $734.2bn
Westpac’s leading suite of brands and divisions
A t li Fi i l S iNet loans $564.6bn
Customer deposits $388.9bn
Equity $48.0bn
Westpac market share as at 31 March 2014 (%)
Westpac Retail & Business Banking
St.George Banking Group
BT Financial
Group
Westpac Institutional
Bank
Westpac New
Zealand
Westpac Pacific and
Group
Australian Financial Services
p ( )
Australia
Household deposit market share1 23%
Housing credit market share2 23%
Business credit market share2 19%
Wealth platforms market share3 20%
Westpac Retail &Westpac Pacific
2%
Group (inc. Treasury)
0% Australian Financial
Services, 66%
p
New Zealand Household deposit market share4 21%
Consumer lending market share4 20%
Top 10 banks in Australia by total resident assets5 (A$)
WestpacWestpac Retail & Business Banking
34%
St.George Banking Group
Westpac Institutional
Bank
Westpac New Zealand
11%
Suncorp-Metway Macquarie Bank
ANZ NAB CBA
Westpac
Westpac: Contribution to 1H14 NPAT b di i i (%)
p20%
BT Financial Group 12%
21%
0 200,000 400,000 600,000 800,000
HSBC Bank Australia Bank of Queensland ING Bank (Australia)
Bendigo and Adelaide Bank by division (%)
Westpac Group | May 2014 | European Investor Roadshow 59
1 APRA Banking Statistics 2 Reserve Bank of Australia. 3 Plan for Life June December 2013. 4. Reserve Bank of New Zealand 5. APRA Banking Statistics February 2014

Appendix 1: Cash earnings adjustments
Cash earnings adjustment (A$m) 1H14 2H13 1H13
R t d NPAT 3 622 3 464 3 287Reported NPAT 3,622 3,464 3,287
TPS revaluations - 1 8
Treasury shares 13 13 29
Ineffective hedges 17 3 (23)
Fair value gain/(loss) on economic hedges 46 (36) 57
Buyback of government guaranteed debt (30) - 43y g g ( )
Fair value amortisation of financial instruments 9 35 32
Amortisation of intangible assets1 70 75 75
Acquisition transaction and integration expenses 25 - -
Cash earnings 3,772 3,555 3,508
1. The merger with St.George and the acquisition of JO Hambro Capital Management (JOHCM) and select businesses of Lloyds Banking Group (Lloyds) resulted in the recognition of identifiable intangible assets These assets include intangibles related to core deposits customer relationships management of contracts and distribution relationshipsidentifiable intangible assets. These assets include intangibles related to core deposits, customer relationships, management of contracts and distribution relationships.
Westpac Group | May 2014 | European Investor Roadshow 60

Appendix 2: Cash earnings adjustments by segment
1H14 Segment Results (A$m)
Westpac Retail &
Business
St.George Banking Group
BT Financial
Group
Westpac Institutional
Bank
New Zealand
Pacific Banking
Group Businesses Group
Banking Group (Australia) Bank
Reported NPAT 1,251 713 427 752 393 65 21 3,622
TPS revaluations - - - - - - - -
Treasury shares - - - - - - 13 13
Ineffective hedges - - - - - - 17 17
Fair value gain/(loss) on economic hedges and own credit - - - - - - 46 46
Buyback of government guaranteed debt - - - - - - (30) (30)
Fair value amortisation of financial instruments1 - - - - - - 9 9
Amortisation of intangible assets2 - 59 11 - - - - 70g
Acquisition transaction and integration expenses - - - - - - 25 25
Cash earnings 1,251 772 438 752 393 65 101 3,772
1 A ti ti f f i l dj t t i d ith St G 2 Th ith St G d th i iti f JO H b C it l M t (JOHCM) d1 Amortisation of fair value adjustments recognised on merger with St.George. 2 The merger with St.George and the acquisition of JO Hambro Capital Management (JOHCM) and select businesses of Lloyds Banking Group (Lloyds) resulted in the recognition of identifiable intangible assets. These assets include intangibles related to core deposits, customer relationships, management of contracts and distribution relationships.
Westpac Group | May 2014 | European Investor Roadshow 61

Appendix 3: CET1 APRA to BCBS Basel III reconciliation
• APRA has maintained the conservative stance adopted under its Basel II capital standards, resulting in a significant variance between capital measured under APRA and fully harmonised Basel III
• Key differences in the calculation of CET1 capital ratios between APRA’s Basel III and fully harmonised Basel III under BCBS are detailed below• Key differences in the calculation of CET1 capital ratios between APRA s Basel III and fully harmonised Basel III under BCBS are detailed below
• In March 2014 the BCBS released a report on its assessment of Basel III regulations in Australia. No changes have been made to the fully harmonised Basel III calculations compared to prior periods. Any required changes will be made once APRA have clarified outstanding questions arising from this report
Common Description equity tier 1
ratio
Westpac’s common equity tier 1 capital ratio under APRA Basel III 8.82%
Under BCBS, supervisors have the option of applying concessional thresholds when determining the capital requirements of deferred tax assets, investments in non-consolidated subsidiaries (NCS) and equity investments in commercial entities held in the banking book Risk weighted asset
investments in non consolidated subsidiaries (NCS) and equity investments in commercial entities held in the banking book. Risk weighted asset treatments apply in lieu of common equity deductions if these items are individually less than 10% and together less than 15% of common equity. To the extent the amounts are greater than the concessional thresholds, common equity deductions apply APRA has chosen not to apply this concessional treatment and requires a 100% deduction from common equity for deferred tax assets, investments in non-consolidated financial institutions, NCS, equity investments, and all under-writing positions in financial and commercial institutions held for more than 5 business days
+107bps
than 5 business days Westpac’s common equity tier 1 capital ratio would increase if APRA applied concessional thresholds
Mortgage risk weights under APRA are based on a minimum loss given default (LGD) of 20%, whereas BCBS sets a minimum LGD of 10%. The actual LGD used must be supported by historical data but APRA’s higher minimum means that Australian mortgage risk weights are typically higher than those calculated using the lower BCBS LGD minimum
+73bps than those calculated using the lower BCBS LGD minimum
APRA applies a risk weighted asset requirement to Interest rate risk in the banking book (IRRBB). This is not currently considered under BCBS standards +24bps
Other differences, including treatment of specialised lending +40bps
Westpac’s fully harmonised Basel III common equity tier 1 capital ratio under BCBS 11.26%
Westpac Group | May 2014 | European Investor Roadshow 62

Appendix 4: Definitions
Asset quality
Stressed loans
Stressed loans are Watchlist and Substandard, 90 days past due well secured and impaired assets
Financial performance
Core earnings Operating profit before income tax and impairment charges loans secured and impaired assets
Impaired
Impaired assets can be classified as 1. Non-accrual assets: Exposures with individually assessed impairment
provisions held against them, excluding restructured loans 2. Restructured assets: exposures where the original contractual terms
have been formally modified to provide concessions of interest or i i l f l t d t th fi i l diffi lti f th t
AIEA Average interest earning assets
Net interest spread
The difference between the average yield on all interest bearing assets and the average rate paid on all interest bearing liabilities
Net interest margin Net interest income divided by average interest-earning assets
Impaired assets
principal for reasons related to the financial difficulties of the customer 3. 90 days past due (and not well secured): exposures where contractual
payments are 90 days or more in arrears and not well secured 4. other assets acquired through security enforcement 5. any other assets where the full collection of interest and principal is in
doubt
Full-time equivalent employees (FTE)
A calculation based on the number of hours worked by full and part-time employees as part of their normal duties. For example, the full-time equivalent of one FTE is 76 hours paid work per fortnight
Data based on Roy Morgan Research, Respondents aged 14+. Wealth penetration is defined as the number of Australians who
90 days past due - well secured
A loan facility where payments of interest and/or principal are 90 or more calendar days past due and the value of the security is sufficient to cover the repayment of all principal and interest amounts due, and interest is being taken to profit on an accrual basis
Watchlist and Loan facilities where customers are experiencing operating weakness and
fi i l diffi lt b t t t d t i l f i t t i i l
Wealth penetration is defined as the number of Australians who have Managed Investments, Superannuation or Insurance with each group and who also have a Deposit or Transaction Account, Mortgage, Personal Lending or Major Card with that group as a proportion of the total number of Australians who have a Deposit or Transaction Account, Mortgage, Personal Lending or Major Card with that group. Home and Contents penetration is defined as the number of Australians who have Household Insurance (Building
substandard financial difficulty but are not expected to incur loss of interest or principal
Individually assessed provisions or IAPs
Provisions raised for losses that have already been incurred on loans that are known to be impaired and are individually significant. The estimated losses on these impaired loans will be based on expected future cash flows discounted to their present value and as this discount unwinds, interest will be recognised in the statement of financial performance
Wealth and Home and Contents Penetration Metrics
number of Australians who have Household Insurance (Building, contents and valuable items) within the Group and who also have a Deposit or Transaction Account, Mortgage, Personal Lending or Major Card with that group as a proportion of the total number of Australians who have a Deposit or Transaction Account, Mortgage, Personal Lending or Major Card with that group. 12 month average to Sep 2013. WRBB includes Bank of Melbourne (until Jul 2011) BT Challenge Bank RAMS (until Dec 2011) Rothschild
Collectively assessed provisions or CAPs
Loans not found to be individually impaired or significant will be collectively assessed in pools of similar assets with similar risk characteristics. The size of the provision is an estimate of the losses already incurred and will be estimated on the basis of historical loss experience of assets with credit characteristics similar to those in the collective pool. The historical loss experience will be adjusted based on current observable data
2011), BT, Challenge Bank, RAMS (until Dec 2011), Rothschild, and Westpac. St.George includes Advance Bank, Asgard, BankSA, Bank of Melbourne (from Aug 2011), Dragondirect, Sealcorp, St.George and RAMS (from Jan 2012). Westpac Group includes Bank of Melbourne, BT, Challenge Bank, RAMS, Rothschild, Westpac, Advance Bank, Asgard, BankSA, Barclays, Dragondirect, Sealcorp and St.George
Westpac Group | May 2014 | European Investor Roadshow 63
Contacts
For further information For further information go to:
www.westpac.com.au/investorcentreCurt Zuber Treasurer, Westpac Banking Corporation +61 2 8253 4230 [email protected] J D
www.westpac.com.au/investorcentreand click on ‘Fixed income investors’
or visit our Bloomberg page ‘WBCT’
Joanne DawsonDeputy Treasurer, Westpac Banking Corporation +61 2 8204 2777 [email protected] Guy VolpicellaGuy VolpicellaExecutive Director, Structured Funding and Capital +61 2 8254 9261 [email protected] Alexander Bischoff Director, Global Funding +61 2 8253 4314 [email protected] Jacqueline Boddy Director Debt Investor RelationsDirector, Debt Investor Relations +61 2 8253 3133 [email protected]
Westpac Group | May 2014 | European Investor Roadshow 64