Embed Size (px)
Citation preview

Draft 22 Feb 2014. ACCEPTED for publication.
156
Western Australian Coastal Shark Bites: A risk assessment
Peter Sprivulis
Department of Emergency Medicine, University of Western Australia

Draft 22 Feb 2014. ACCEPTED for publication.
156
RESEARCH
Please cite this paper as: Sprivulis, P. Western Australian Coastal Shark Bites: A risk assessment. Aust Med J. 2014 in press
Abstract Background As Western Australia’s (WA) Government enacts shark bite mitigation, the personal risk of shark bite in WA has not been studied. Aims Model the risk of large (>3m) white shark bite (Carcharodon carcharias, LWS) in southwest WA. Method Observational study, 1/1/1974 to 31/12/2013. Analysis of prey abundance, location, water temperature and water activity participation. Shark bite risk was benchmarked against serious or fatal recreational cycling crash risk in WA. Results Total and fatal shark bites have grown exponentially over 40 years (3 to 29 total, 0 to 7 fatal per 5yrs), correlated with the 10% annual growth in WA Humpback whale (Megaptera novaeangliae) abundance (rtotal=0.96 95%CI 0.77-0.99, P<0.001; rfatal=0.96 95%CI 0.81-0.99, P<0.001) but not water activity participation rtotal= 0.25, 95%CI -0.45 - 0.76, P=0.48). LWS were implicated in 10 of 12 fatalities. Metropolitan Perth beach summer/autumn bathing less than 25m from shore in water less than 5m deep (risk lower than 1 in 20 years) is estimated to be at least 50x safer than cycling. Off-shore diving and surf sports off Perth, during winter/spring have a similar risk to cycling. Winter/spring off-shore diving south of Perth has between 3 and 11 times the cycling risk. Conclusion WA’s shark bite risk is likely to increase as whale abundance continues to increase off the WA coast. However, the risk to bathers less than 25m from shore in shallow water during the WA summer, is likely to remain very low, and well below the risk of other recreational activities undertaken in WA. Key Words shark, injury, risk
What this study adds: The personal shark bite risk for water activities in
WA has not previously been estimated.
Shark bite risk is highly correlated with the seasonal presence of migrating Humpback whales and varies with choice of water activity, season and location by almost three orders of magnitude.
Individuals and Government may use these risk estimates to make better-informed choices concerning water activities and shark bite risk mitigation.
Background An unprecedented cluster of shark bite fatalities in Western Australia (WA) over the last decade has resulted in the WA Government enacting a controversial policy of culling large sharks caught in coastal waters off the WA southwest and Perth metropolitan coasts.(1) The cluster of seven fatalities in three years has prompted debate concerning factors contributing to the cluster and debate concerning personal and government approaches to mitigating the risk of shark bites in Western Australia. However, there has been little published analysis of the factors contributing to bites to inform risk mitigation strategies.(2,3) This study aims to evaluate factors considered likely to have contributed to the cluster of shark bite fatalities and estimates the risk of large shark bite associated with recreational water activities usually undertaken off the southwest coast of WA.
Method Reported Shark Bite data for Western Australia for the forty year period 1 January 1974 to 31 December 2013 was obtained from the Global Shark Attack File (GSAF).(4) For the purposes of this study, a ‘bite’ was defined as physical contact initiated by the shark with its mouth/head against either a person in the water or their equipment/water craft. A ‘large shark’ was defined as a shark reported to be at least 3m in length. Shark encounters with fishing boats 5m or greater in length were excluded from analysis. Data were grouped by half-decade to facilitate analysis. The narrative records of large shark bites were accessed from GSAF and classified as either ‘off-shore’ if 50m or greater from shore and in greater than 5m depth, ‘on-shore’ if occurring in less than 5m depth and within 25m of shore, and ‘shallow-water’ if greater than 25m from shore but less than 5m in depth, similar to that used by the WA Dept of Fisheries.(2) Bites occurring along the south coast and on the west coast of WA south of Mandurah were classified as ‘South/Southwest’, north of Mandurah but south of the Wedge Island, including Garden and Rottnest Island, were classified as ‘Metropolitan/Western’ and bites further north were classified as ‘North’. All water activities undertaken within 25m of shore were classified as ‘bathing’; diving, snorkeling and swimming in water greater than 5m deep
Corresponding Author: Name: Peter Sprivulis Address: Department of Emergency Medicine, Fremantle Hospital, Alma Street, Fremantle, Western Australia 6160 peter dot sprivulis at uwa dot edu dot au
Draft 22 Feb 2014. ACCEPTED for publication.
157
and greater than 25m from shore were classified as ‘diving’ and all other activities not occurring on-shore (eg surfing, bodyboarding, surf ski paddling) were classified as ‘surf-sports’. Univariate analysis using publically available data sources was undertaken to evaluate the relationship of factors identified as possible risk factors for shark bite in Western Australia and changes in total reported bites and fatal bites per half-decade. Factors considered for analysis were based on those identified by the WA Dept of Fisheries and Gillham and included shark population growth, prey availability, water temperature and water activity participation.(2)(5) Given that, currently, it is ‘not possible to determine if the white shark population in Australian waters has shown any sign of recovery’ since white shark conservation protection was granted in 1996-1997, several hypothetical white shark population recovery models were devised, ranging between 0 and 2% annual decline prior to 1997, and between 0 and 12.5% annual growth since 1997.(6) The risk of large white shark bite during water activities undertaken off the WA southwest coast was modeled as follows: An annual estimate of the total number of episodes of diving or surf sports undertaken by individuals in the Southwest of Western Australia was calculated from Australian Sports Commission’s Exercise, Recreation and Sport Survey (ERASS) data by averaging the product of reported participation and mean episodes per annum for the years 2008-2010, assuming 90% of activity episodes occurred in WA’s southwest of which 80% occurs in the Metro/West region.(7) Four fifths of surf sport activities were assumed to take place in water less than 5m deep and within 50m of shore, with one fifth assumed to take place in deeper water and further from shore. All scuba diving was assumed to be in water at least 5m deep and at least 50m off shore. The undertaking of other water activities (eg bathing) along the WA southwest coast less than 25m from shore was assumed to be at least as common as surf-sport participation. It was also assumed that three quarters of water activity took place in summer/autumn. A mean bite rate of 3.0 bites per annum, the upper limit of estimates for projected bites per annum for the year 2018, calculated by linear regression from the correlation of bites with humpback whale abundance, was assumed for the half decade 2014-2018. Water activity episodes per bite were benchmarked against the episodes of recreational cycling per fatal or seriously injured crash, again using mean WA ERASS participation and mean road trauma cycling statistics for 2008-2010, assuming 80% of cyclists injured were recreational.(7,8) Recreational cycling was chosen for benchmarking because it is discretionary, like recreational water activity participation, and because most individuals would believe that they have a reasonable appreciation of its risks (234,140 episodes per injury). For on-shore episodes per bite with a nil bite denominator, episodes per bite was estimated to be 3.8 times the calculated shallow water surf-sports episodes per bite, based upon the all of southwest WA on-shore to shallow-water episodes per bite ratio of 3.8. Estimated interval between bites was
calculated as the ratio of episodes per bite to episodes per year. Statistical analysis was undertaken using VassarStats online statistical package.(9)
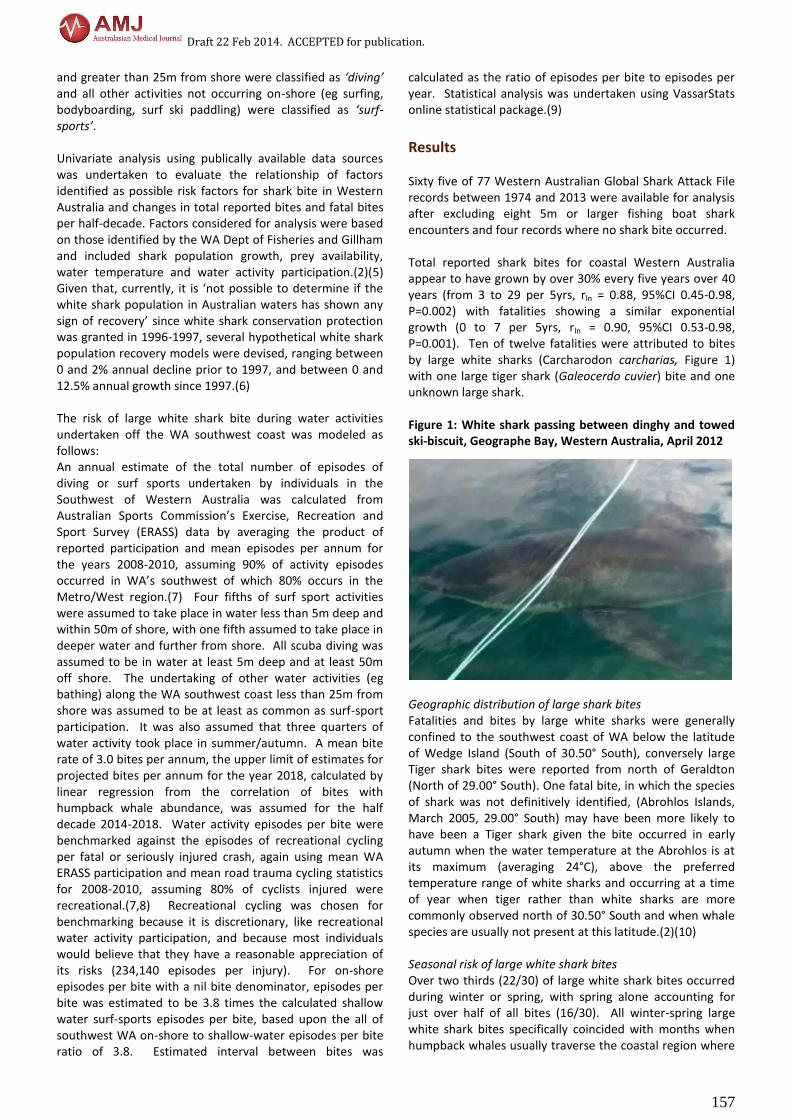
Results Sixty five of 77 Western Australian Global Shark Attack File records between 1974 and 2013 were available for analysis after excluding eight 5m or larger fishing boat shark encounters and four records where no shark bite occurred. Total reported shark bites for coastal Western Australia appear to have grown by over 30% every five years over 40 years (from 3 to 29 per 5yrs, rln = 0.88, 95%CI 0.45-0.98, P=0.002) with fatalities showing a similar exponential growth (0 to 7 per 5yrs, rln = 0.90, 95%CI 0.53-0.98, P=0.001). Ten of twelve fatalities were attributed to bites by large white sharks (Carcharodon carcharias, Figure 1) with one large tiger shark (Galeocerdo cuvier) bite and one unknown large shark. Figure 1: White shark passing between dinghy and towed ski-biscuit, Geographe Bay, Western Australia, April 2012
Geographic distribution of large shark bites Fatalities and bites by large white sharks were generally confined to the southwest coast of WA below the latitude of Wedge Island (South of 30.50° South), conversely large Tiger shark bites were reported from north of Geraldton (North of 29.00° South). One fatal bite, in which the species of shark was not definitively identified, (Abrohlos Islands, March 2005, 29.00° South) may have been more likely to have been a Tiger shark given the bite occurred in early autumn when the water temperature at the Abrohlos is at its maximum (averaging 24°C), above the preferred temperature range of white sharks and occurring at a time of year when tiger rather than white sharks are more commonly observed north of 30.50° South and when whale species are usually not present at this latitude.(2)(10) Seasonal risk of large white shark bites Over two thirds (22/30) of large white shark bites occurred during winter or spring, with spring alone accounting for just over half of all bites (16/30). All winter-spring large white shark bites specifically coincided with months when humpback whales usually traverse the coastal region where

Draft 22 Feb 2014. ACCEPTED for publication.
158
the bite occurred during the winter-spring seasonal migration of humpback whales south to Antarctica from the Kimberley region of WA (P<0.001) and when the water temperature off the southern and southwest coast is usually less than 22°C (P<0.001).(10) No definite white shark bites were identified to have occurred in water temperatures higher than 22°C, with the possible single exception of the Abrohlos 2005 bite. Injuries sustained during large white shark bites Nearly half (11/24) of the large white shark bites resulted in the death of the victim with an additional third (9/24) resulting in non-fatal injuries. None of six white shark bites upon watercraft resulted in injury. Risk factors for shark bite Estimated humpback whale (Megaptera novaeangliae) abundance appears to be highly correlated with both total reported shark bites (r=0.96 95%CI 0.77-0.99, P<0.001, Figures 2 and 3) and fatal shark bites per half-decade (r=0.96 95%CI 0.81-0.99, P<0.001). Projecting this regression suggests that in the absence of effective shark bite mitigation, WA may expect a mean of 8.6 (95%CI 7.5-9.8) bites and 2.0 (95%CI 2.2-2.5) shark bite fatalities per annum for the 2014-2018 half decade. Figure 2: Western Australian coastal shark bites 1974-2013
Weaker correlations were found for WA’s New Zealand fur seal (Arctocephalus forsteri) population growth for total bites (r=0.71 95%CI 0.00-0.95 P=0.04) and fatalities (r=0.78 95%CI 0.16-0.95 P=0.01). Australian sea lion (Neophoca cinerea) populations in WA have not increased during the study period and were not considered for further analysis. Despite significant total population growth in Western Australia, water sport participation data for Western Australia in the 10 years 2001-2010 showed a non-significant decreasing trend from 4,171,000 to 3,394,000 surf sport or diving episodes per year (r=-0.29, 95%CI -0.78 to 0.42, P=0.21) and was not significantly correlated with the increase in total bites over this period (r=0.25, CI -0.45 - 0.76, P=0.48).
The correlation between three illustrative shark population growth models and shark bites per half decade is presented in Table 1. The models illustrate that it is plausible that white shark population recovery at growth rates between 3 and 12.5%, since protection in 1997, could be contributing to increased bites. Table 1: White shark population growth models and correlation with Western Australian Shark Bites 1974-2013
Table 2: Expected activity episodes (x1million) per fatal white shark bite, south west Western Australia 2014-2018
Figure 3: Correlation between humpback whale abundance and total shark bites, Western Australia 1974-2018
Water activity risk estimates Table 2 presents the expected number of episodes of water activity per fatal white shark bite. The expected interval between bites and estimated risk of white shark bite for different forms of water activity relative to cycling is

Draft 22 Feb 2014. ACCEPTED for publication.
159
presented in Tables 3 and 4. At 2008 to 2010 mean activity participation rates, the estimated expected interval between white shark bites varies from as high as 30 years for metropolitan/west summer/autumn on-shore bathing to as low as 10 months for all of southwest WA winter/spring off-shore surf sports or diving. In comparison to recreational cycling, the risk of white shark bite for water activities undertaken in southwest WA is estimated to vary from less than 50 times lower (metropolitan/west summer/autumn bathing) to over 10 times higher (south/southwest region winter/spring diving) than the risk of serious or fatal recreational cycling injury, a variation approaching three orders of magnitude. Table 3: Expected white shark fatal bite interval for southwest Western Australia 2014-2018
Table 4: Risk of fatal large white shark bites for the southwest Western Australia 2014-2018 relative to cycling death or injury
Discussion Both fatal and total reported shark bites in Western Australia appear to be growing exponentially, with the increase in bites being attributable principally due to large
white shark bites. The growth in both fatal and total reported shark bites appears to be highly correlated with the growth in humpback whale abundance off the coast of WA; with the majority of large white shark bites occurring during the southward Humpback whale migration past the metropolitan Perth and southwest coast in late spring, when white sharks are known to migrate northward along the same stretch of coastline.(10,11) The principal prey of large white sharks is marine mammals, with pinnipeds (eg seals, sea lions) usually being ‘the most numerous’ prey consumed, usually obtained by directed hunting, but whale meat ‘contributing the most by mass’ to large white shark diets, usually obtained by scavenging whale carcasses.(12) White sharks are known to migrate large distances between breeding grounds and feeding habitats with research indicating that white sharks, some from as far afield as South Africa, migrate up the WA Coast in Spring, returning to southern waters (eg Great Australian Bight) in early Summer.(11) The southwest coast of WA during spring can be viewed as a preferred feeding habitat of large white sharks, and it is likely that the risk of large white shark bite will increase as the migrating humpback whale population continues to grow at a rate of over 10% per annum. The shark population models illustrate that it is plausible that white shark population recovery since protection was enacted in Australian waters in 1996-1997, may be contributing to increased bites. However, in the absence of a method of reliably estimating coastal white shark abundance or population growth, the validity of this conjecture can not be tested.(6) This study did not find that the recent boom in Western Australia’s population has translated into increased exposure to the risk of bite, with a non-significant decline in water activity participation being observed between 2001-2010. Water activity risk assessment The risk of white shark bite for Perth metropolitan on-shore bathers during summer and autumn is estimated to be no more than one bite every two decades, fifty times lower than the risk of a fatal recreational cycling crash. Off-shore diving and surf sports off Perth, during winter/spring, appear to have a similar risks to recreational cycling whereas off-shore diving and surf sports undertaken in the south/southwest appear to carry a fatal shark bite risk between 2-10 times the risk of a serious or fatal recreational cycling crash, when undertaken during the highest-risk, winter and spring seasons. The overall risk to divers may now be an order of magnitude higher than that estimated by Buzzacott a decade ago.(3) No individual in, or on, a surf ski, sea kayak or boat was injured in this study, suggesting that the use of such craft, which are substantially larger than surfboards or body boards, for surf-sports off-shore can reduce the risk of injury from a white shark bite (Figure 2).

Draft 22 Feb 2014. ACCEPTED for publication.
160
Limitations In examining GSAF narratives, it is apparent that attribution to shark type and size is not necessarily done in all cases by witnesses experienced in the identification of sharks. It is possible that not all bites attributed to large white sharks are correctly attributed. The water activity risk assessment only attempted to assess white shark bite risk and so doesn’t include the potentially serious or fatal additional risk of injury from other sharks, such as tiger or bull sharks (Carcharhinus leucas). The risk assessment approach used is slightly biased to over- rather than under-estimation of risk by using the highest number of projected bites (3 in 2018 for estimation of the frequency of bites for the next five years. However, it is likely that white shark bite risk will increase as the humpback whale population continues to grow, although bite rates may decline, due to changes in water activity participation or in choice of activity away from higher risk activities. Anecdotally, 2013 water activity participation at metropolitan Perth beaches is reported to be in decline.(13)
Conclusion As whale abundance increases off the coast of Western Australia, it is reasonable to predict that, in the absence of effective personal or policy based risk mitigation, the risk of white shark bite when undertaking recreational water activities off the southwest coast of WA will continue to increase. However, the risk of shark bite for beach goers engaged in bathing activities less than 25m from shore in shallow water during the WA summer is likely to remain very low, and well below the risk of other recreational activities commonly undertaken in WA.
References (1) Barnett C, Baston K. Improving shark safety at popular WA beaches. Department of Fisheries, Government of Western Australia. Perth. 2013. http://www.fish.wa.gov.au/About-Us/Media-releases/Pages/Improving-shark-safety-at-popular-WA-beaches.aspx (accessed Jan 2014) (2) Department of Fisheries. A correlation study of the potential risk factors associated with white shark attacks in Western Australia. Government of Western Australia. Perth. 2012. http://www.fish.wa.gov.au/Documents/occasional_publications/fop109.pdf (accessed Jan 2014) (3) Buzzacott P. An estimate of the risk of fatal shark attack whilst diving in Western Australia. SPUMS J. 2005; 35: 92-4 (4) Collier R, Hartley CJ. Global Shark Attack File Incident Log. Shark Research Institute. Princeton New Jersey. 2014. http://sharkattackfile.net/incidentlog.htm (accessed Jan 2014) (5) Gillham C. Shark attacks and whale migration in
Western Australia. Perth. 2012. http://www.washarkattacks.net/whale-numbers.php (accessed Feb 2014) (6) Department of Sustainability, Environment, Water, Population and Communities. Recovery Plan for the White Shark (Carcharodon carcharias). Australian Government. Canberra. 2013 http://www.environment.gov.au/system/files/resources/ce979f1b-dcaf-4f16-9e13-010d1f62a4a3/files/white-shark.pdf (accessed Jan 2014) (7) Australian Sports Commission. Exercise, Recreation and Sport Survey. Australian Government. Canberra. 2012. http://www.ausport.gov.au/information/casro/ERASS (accessed Jan 2014) (8) Office of Road Safety. Reported road crashes in Western Australia 2010. Government of Western Australia. Perth. 2011. http://www.ors.wa.gov.au/Stats/Annual/annual-crash-stats-2010.aspx (accessed Jan 2014) (9) Lowry R. VassarStats: Website for Statistical Computation. Vassar College. New York. http://vassarstats.net/ (accessed Jan-Feb 2014) (10) Dept of Mines and Petroleum. Map: Location and estimated period of Humpback Whale Activity in Western Australia. Government of Western Australia. Perth. 2003 (11) Department of Environment. Biodiversity Species Profile and Threats Database: Carcharodon carcharias — Great White Shark. Australian Government. Canberra. 2014. http://www.environment.gov.au/cgi-bin/sprat/public/publicspecies.pl?taxon_id=64470 (accessed Jan 2014) (12) Hussey NE, McCann HM, Cliff G, Dudley SFJ et al. Size-based analysis of diet and trophic position of the white shark (Carcharodon carcharias) in South African waters. In: Global Perspectives on the Biology and Life History of the White Shark. Michael L Domeier (Ed), CRC Press. New York. 2012. 3:27-45 (13) Markwick J. Sharks scare off swimmers. Mosman Cottesloe Post. 25 January 2014:1 (col. 1).
ACKNOWLEDGEMENTS The Author thanks the Gamble Family for the use of their photograph.
PEER REVIEW Not commissioned. Externally peer reviewed
CONFLICTS OF INTEREST The author declares that he has no competing interests.
FUNDING Nil.
ETHICS COMMITTEE APPROVAL Ethical approval was not sought for this study; the study models publically available data.