Embed Size (px)
Citation preview

AUSTRALIAN VENTURE CONSULTANTS PTY LTD
1
Western Australian Marine Science
Blueprint
Online Appendix 2: The Western Australian Marine
Environment
January 2015
AUSTRALIAN VENTURE CONSULTANTS PTY LTD
2
CONTENTS
1. Physical Oceanography ................................................................................................................... 4
1.1. Physical Oceanography of the Northern Region ................................................................. 4
1.2. Physical Oceanography of the Southern Region ............................................................... 10
2. Marine Ecosystems ........................................................................................................................... 14
3. River Catchments ............................................................................................................................. 16
3.1. Kimberley River Catchments .................................................................................................. 17
3.2. Pilbara Region ............................................................................................................................ 17
3.3. Gascoyne-Murchison ............................................................................................................... 17
3.4. Midwest Region ......................................................................................................................... 17
3.5. Swan-Avon ................................................................................................................................. 18
3.6. Peel – Harvey ............................................................................................................................. 18
3.7. South West Region .................................................................................................................... 19
3.8. Great Southern Region ............................................................................................................ 19
4. Key Western Australian Rivers ......................................................................................................... 20

AUSTRALIAN VENTURE CONSULTANTS PTY LTD
3
Disclosure and Disclaimer
This report has been prepared by Australian Venture Consultants Pty Ltd (ACN: 101 195 699) (‘AVC’). AVC has
been commissioned to prepare this report by the Western Australian Marine Science Institution, and has received
a fee from the Western Australian Marine Science Institution for its preparation.
While the information contained in this report has been prepared by AVC with all reasonable care from sources
that AVC believes to be reliable, no responsibility or liability is accepted by AVC for any errors, omissions or
misstatements however caused. Any opinions or recommendations reflect the judgment and assumptions of AVC
as at the date of the document and may change without notice. AVC, its officers, agents and employees exclude
all liability whatsoever, in negligence or otherwise, for any loss or damage relating to this document to the full extent
permitted by law. Any opinion contained in this report is unsolicited general information only. AVC is not aware that
any recipient intends to rely on this report or of the manner in which a recipient intends to use it. In preparing this
information it is not possible to take into consideration the information or opinion needs of any individual recipient.
Recipients should conduct their own research into the issues discussed in this report before acting on any
recommendation.
AUSTRALIAN VENTURE CONSULTANTS PTY LTD
4
The intended audience of the Blueprint is diverse and will demonstrate varying degrees of
familiarity with the key physical, chemical and biological features of the Western Australian
marine environment. The purpose of this Appendix is to provide a high level overview of these
features for the less informed reader.
1. Physical Oceanography Physical oceanography describes the physical aspects of the marine environment such as
waves, currents and water temperature. An understanding of physical oceanography is
critical. It determines the physical conditions and forces that marine infrastructure must
withstand and operate within, as well as setting the conditions in which marine ecosystems
exist and connect with each other.
While the physical Western Australian marine environment is interconnected along the coast
and indeed to the wider regional and global ocean environment, for practical reasons this
Appendix will describe the key physical ocean features of the Western Australian marine
environment according to the northern and southern regions.
1.1. Physical Oceanography of the Northern Region
North West Shelf
The north western margin of Western Australia is formed by a continental shelf known as the
North West Shelf. This is a wide, 2,500 kilometre long ramp comprised mostly of carbonate
sediments that starts from a narrow base on the North West Cape, substantially widening in a
northward direction. It is one of the largest structures of its kind existing in the modern world. In
fact, the large area of continental shelf and continental slope across the northwest is a key
feature that differentiates the northwest from other marine regions in Australia.
The North West Shelf hosts immense biodiversity as well as significant hydrocarbon resources in
the Carnarvon, Browse and Bonaparte Basins (see Appendix Error! Reference source not
found.)
Major Currents
Large scale regional ocean currents play a key role in ocean circulation patterns on and
adjacent to the North West Shelf. Figure 11 below illustrates the main currents that effect ocean
circulation in the northern region.
1 Adapted from the Integrated Marine Observing System
http://imos.org.au/httpimosorgauwasci1html.html (accessed 5th September 2014)

AUSTRALIAN VENTURE CONSULTANTS PTY LTD
5
FIGURE 1 – MAJOR OCEAN CURRENTS OF THE NORTHWEST
The following subsections describe the main current affect ocean circulation in the northwest.
Indonesian Through Flow
The Indonesian Through Flow (ITF), or the Indo-Pacific Through Flow as it is also known, delivers
a flow of warm, low salinity, oligotrophic tropical water from the western Pacific Ocean to the
North West Shelf. The flow is driven by a gradient difference between the western Pacific
Ocean and the Indian Ocean and enters the Indian Ocean through passages between the
islands of Eastern Indonesia2.
Once in the Indian Ocean, the ITF flows in two directions, both of which impact on the North
West Shelf. South of Java, ITF surface waters join the South Java Current to form the westward
flowing South Equatorial Current, with a portion of this re-curving and flowing by circuitous
routes southward, delivering mixed Pacific Ocean and central Indian Ocean water to the
western end of the North West Shelf3.
The ITF passes through the East Indies Triangle which hosts an immensely species rich benthic
shelf and reef habitats serving as an important mechanism for transporting planktotrophic
marine species from an important centre of marine biodiversity to the North West Shelf4.
During El Nino, the thermocline rises, sea level differentials drop, sea surface temperatures fall
and the strength of the ITF weakens. Conversely, during La Nina, higher sea level differentials,
warmer sea surface temperatures and deeper thermoclines result in a stronger ITF5.
2 Wilson, B. (2013) The Biogeography of the Australian North West Shelf: Environmental
Change and Life Response, Elsevier, Massachusetts 3 Domingues, C., Maltrud, M., Wijffels, S., Church, J., Tomczak, M. (2007)’Simulated lagrangian
pathways between the Leeuwin Current System and the upper ocean circulation of the
southeast Indian Ocean, Deepsea Research, Vol.2(54), pp.797-817 4 Wilson, B. (2013) The Biogeography of the Australian North West Shelf: Environmental
Change and Life Response, Elsevier, Massachusetts 5 Department of Environment, Water, Heritage and the Arts (2008), The Northwest Marine
Bioregional Plan: Bioregional Profile, Australian Government, Canberra
AUSTRALIAN VENTURE CONSULTANTS PTY LTD
6
Holloway Current
Driven by a steric height gradient and augmented by easterly winds during the autumn-winter
monsoon season, the Holloway Current flows along the North West Shelf margin6. It is a narrow
surface current that flows most strongly and persistently along the shelf break during the
southeast trade wind season from March to July. In response to the reversal of the regional
winds during the spring and summer months, the Holloway Current weakens and frequently
reverses its direction of flow7.
Eastern Gyral Current
The Eastern Gyral Current is an anticyclonic recirculation that flows eastward near latitude 15o
South. In the upper ocean, a strong salinity front exists between fresh water from the ITF in the
South Equatorial Current (see below) and salty subtropical waters. In that region, salinity
overwhelms the temperature contribution to density gradients generating eastward
geostrophic shear and establishing the Eastern Gyral Current8.
During the Southeast Monsoon (April to September), the pressure gradient between the Pacific
and Indian Oceans is more intense, strengthening the South Equatorial Current.
The Eastern Gyral Current is an upstream source for the Leeuwin Current (see subsequent
section on the Key Oceanographic Features of the Southern Region).
South Java Current
The South Java Current is a semi-annually reversing boundary current. It is controlled by the
monsoon over the Indian Ocean and Indonesian archipelago, flowing generally in a south-
east direction along the Java coast during December to April, a northwest direction during
June to October, and goes through a period of transition during two weeks in May and
November9.
South Equatorial Current
The South Equatorial Current flows westward along the northern flank of the Eastern Gyral
Current. During the Southeast Monsoon (April to September), the pressure gradient between
the Pacific and Indian Oceans is more intense, strengthening the South Equatorial Current.
Eddy Currents
Flooding of water from the ITF onto the continental shelf is believed to be assisted by local
eddy currents which facilitate cross-shelf transport. Along with internal tides, these eddy
6 Kronberg, M. (2004), Ocean Circulation over the North West Shelf of Western Australia: Does
it Impact on the Leeuwin Current (PhD Thesis), University of Copenhagen, Denmark 7 Wilson, B. (2013) The Biogeography of the Australian North West Shelf: Environmental
Change and Life Response, Elsevier, Massachusetts 8 Menezes, V., Phillips, H., Schiller, A., Domingues, C. and Bindoff, N. (2013), ‘Salinity
dominance of the Indian Ocean Eastern Gyral Current’, Geophysical Research Letters, Vol.
40 (21), pp 5716-5721 9 Sprintall, J., Chong, J., Syamsudin, F., Morawitz, W., Hautala, S., Bray, N. and Wijffels, S.
(1999), ‘Dynamics of the South Java Current in the Indo-Australian Basin’, Geophysical
Research Letters, Vol. 26(16), pp. 2493-2496

AUSTRALIAN VENTURE CONSULTANTS PTY LTD
7
currents modify the characteristics of the water on the shelf through facilitating vertical
mixing10.
Coastal Currents
Coastal currents on the North West Shelf are typically along-shore, wind driven flows that
reverse direction on a seasonal basis according to the winter south easterly trade winds and
the summer monsoon11. Regardless, these general trends are overridden by the impact of
astronomic semidiurnal tides.
Other Currents
Other seasonal surface currents in the northern region include the Ningaloo current, Shark Bay
Outflow and the Capes Current.
Tides
Tides in the northwest are among the largest tides along a coastline adjoining an open ocean
in the world. They increase in amplitude from south to north, corresponding to the increasing
width of the northwest shelf12. Spring tide amplitudes range from 4 metres on the Pilbara coast
to over 11 metres on the Kimberley coast.
Solitons
Solitons are waves that travel within the interior of the ocean. They occur as the result of
stratified density structure of two fluids, with a very sharp density change occurring along the
interface and with the properties that the smaller the density contrast, the lower the wave
frequency and slower the propagation speed.
Solitons are generally ubiquitous where strong tides and stratification occur in the
neighbourhood of irregular topography. The combination of tides, temperature stratification
and the sloping seabed on the North West Shelf create perfect conditions for soliton
propagation.
Ocean Circulation and Mixing
By virtue of the turbulence caused by the interaction of the main and eddy currents and
solitons discussed above, there is an area of intense boundary mixing along the shelf margin.
When the Holloway Current is flowing most strongly during autumn and winter, oligotrophic ITF
oceanic water and shelf coastal water mix by means of eddies associated with the large-
scale, regional, oceanic circulation and possibly cyclonic storms. When the Holloway Current
weakens or reverses, the water column along the North West Shelf may stratify, facilitating the
ability of complex tidal currents to dominate water circulation patterns of the outer and middle
shelf.
10 Department of Environment, Water, Heritage and the Arts (2008), The Northwest Marine
Bioregional Plan: Bioregional Profile, Australian Government, Canberra 11 Condie, S., Andrewartha, J. (2008) ‘Circulation and connectivity on the Australian North
West Shelf’, Continental Shelf Research, (28), pp. 1724-1739 12 Holloway, P. (1983) ‘Tides on the Australian Northwest Shelf’, Australian Journal of Marine
and Freshwater Research, (34), pp.213-220

AUSTRALIAN VENTURE CONSULTANTS PTY LTD
8
Internal waves generated by barotropic tides along the shelf break may cause bottom
turbulence, whereby colder, nutrient rich water from the deep sea to raise higher in the water
column.
On the shelf slope, the surface layer of warm, oligotrophic ITF water overlays the cooler, more
nutrient-rich waters of the deep sea. The boundary between these two water bodies is marked
by a sharp thermocline that is a barrier to convective mixing of nutrients.
Mobile Seabed
Much of the seabed off the Western Australian coastline is mobile. Over timescales of
decades, seafloor sediments are likely transported southward along the continental shelf, by
cyclone induced (see below) currents at the seabed. Physical indicators of this regional
pathway include submarine dune systems and sediment tails behind islands and reefs. The
regional bed sediment transport pathway is an important indication of the dynamic nature
of the shelf, the connectivity between various shelf ecosystems, and forms part of the long-
term natural resilience of these systems13.
Thermal Structure
In the Kimberley surface sea temperatures of coastal waters and offshore near the shelf margin
average approximately 28.5 oC. There is some noted seasonal variation. For example, near the
Ichthys gas field sea surface temperatures are consistently approximately 30 oC in March and
26 to 27 oC in July. Bottom temperatures of as low as 12 oC have been measured in the Browse
Basin14.
Surface sea temperatures of coastal waters in the Pilbara average approximately 27.3 oC in
coastal waters and 28.6 oC offshore near the shelf margin. There is seasonal variation in the sea
surface temperatures as well, with seasonal variation at the Pilbara mid-shelf location ranging
from 35oC in March-April to 24oC in July. Bottom temperatures as low as 20 oC have been
measured15.
Offshore waters are stratified with a distinct thermocline at depths of approximately 30 to 50
metres in summer and 70 to 120 metres in winter. The shelf break is an area of intense boundary
mixing, where mixed water intrudes onto the continental shelf16.
Salinity
Salinity on the North West Shelf is largely influenced by the ITF. Salinity along the margins of the
shelf is in the 34 to 35 ppt range. The salinity of coastal waters is generally higher in the range
of 34.8 to 35.2, but with some seasonal and spatial variability. For example, temporary dilution
occurs on the tropical monsoonal Kimberley coast and close to major river discharge points
on the Pilbara coast.17
13 Buchan, S. (2014), RPS Metocean 14 INPEX, Biological and Ecological Studies of the Bonaparte Archipelago and Browse Basin
Marine Sediment and Water Quality, INPEX, Perth 15 INPEX, Biological and Ecological Studies of the Bonaparte Archipelago and Browse Basin
Marine Sediment and Water Quality, INPEX, Perth 16 Brewer, D., Lyne, V., Skewes, T., Rothslisberg, P. (2007), Trophic Systems of the North West
Marine Region, Department of Environment and Water Resources 17 Wilson, B. (2013), The Biogeography of the Australian North West Shelf: Environmental
Change and Life’s Response, Elsevier, Massachusetts
AUSTRALIAN VENTURE CONSULTANTS PTY LTD
9
Nutrients
Nutrient concentrations in the surface waters of the North West Shelf are generally low,
especially near the shelf margin. Nutrient concentrations below the thermocline are
significantly higher and seasonal nutrient enrichment of benthic habitats on the outer and
middle shelf may be expected as a result of upwelling.
Nutrient concentrations in near-shore coastal waters of the North West Shelf are relatively high,
where they are derived from benthic primary production in the photic zone of the inner shelf
and inputs from the adjacent terrestrial environment, primarily through river discharge.
Turbidity
Turbidity is usually either measured as Light Attenuation Coefficient or concentration of Total
Suspended Solids (TSS). Offshore waters of the shelf margin are generally clear with low
concentrations of suspended particles and high light penetrations. Whereas coastal waters
receive fine terrestrial sediment and with increased nutrient concentrations, tend to be more
turbid18.
In the shallows of the inner-shelf turbidity is greatly influenced by disturbance and re-suspension
of fine sediments on the seafloor by tidal flows and waves (particularly those caused by
cyclones). Re-suspension of the seafloor sediments during periods of spring tide is a major
determinant of the high turbidity of coastal waters of both the Kimberley and the Pilbara where
macrotidal conditions prevail. The turbidity of coastal waters tends to be higher in summer
than in winter as a result of variation in seasonal wave conditions19.
Tropical Cyclones
Tropical cyclones in the northwest are frequent and often severe, with 75 percent of all severe
tropical cyclones crossing the Australian coast occurring in the Pilbara Region. The Pilbara
Region experiences an average of approximately five tropical cyclones per season, with an
average of two tropical cyclones crossing the coast, one of which is likely to be a severe
tropical cyclone.
Figure 220 below illustrates the pathway and intensity of tropical cyclones that crossed the
Australian coast between 1970 and 2009.
18 Wilson, B. (2013), The Biogeography of the Australian North West Shelf: Environmental
Change and Life’s Response, Elsevier, Massachusetts 19 Wilson, B. (2013), The Biogeography of the Australian North West Shelf: Environmental
Change and Life’s Response, Elsevier, Massachusetts 20 Haig et al (2013) IN: Pattiaratchi, C. (2013), An Overview of the Oceanography of Northern
Australia

AUSTRALIAN VENTURE CONSULTANTS PTY LTD
10
FIGURE 2 – PATHWAY AND INTENSITY OF TROPICAL CYCLONES CROSSING THE AUSTRALIAN COASTLINE
(1970 TO 2009)
Squalls
Squalls are high wind, wave and current events that escalate in intensity and travel very
rapidly. Driven by strong convection, they can occur in conjunction with tropical cyclones or
independently. A recent squall approximately 30 kilometres north of Onslow saw near calm
conditions escalate to a swell of two metres and wind speed of 75 kilometres per hour (40
knots) in a matter of hours.
1.2. Physical Oceanography of the Southern Region
South West Australian Shelf
The southwest region is characterised by a narrow continental shelf hosting numerous near-
shore islands and reefs. The continental slope is incised by many, well developed submarine
canyons, has mid-slope terraces, an extensive continental rise and the deepest marginal
plateau on the Australian margin, the Naturaliste Plateau21.
21 Richardson, L., Mathews, E. and Heap, A. (2005), Geomorphology and Sedimentology of
the South Western Planning Area of Australia: Review and Synthesis of Relevant Literature in
Support of Regional Marine Planning, Geoscience Australia, Australian Government,
Canberra
AUSTRALIAN VENTURE CONSULTANTS PTY LTD
11
South Westerly Swells
South westerly swells, originating in the Southern Ocean have significant impact on the
oceanographic processes in the southwest and contribute to a relatively high energy
environment22.
Offshore regions of the South West Australian Shelf are dominated by oceanic swells and seas
with an average significant wave height of about 3 metres and period from 5 to 20 seconds.
For most of the year, the waves arrive from the south west. However, winter storms often result
in waves from the west and north-west bringing high energy conditions for short periods of
time23. Inshore, much of the coastline is sheltered from the direct impact of swell and wave
activity by an extensive chain of reefs, which attenuate ocean waves24.
South Westerly Storms
South westerly storms, typically originating in the Southern Ocean during the winter months,
have a significant impact on oceanographic processes in the southwest, contributing to the
high energy environment25.
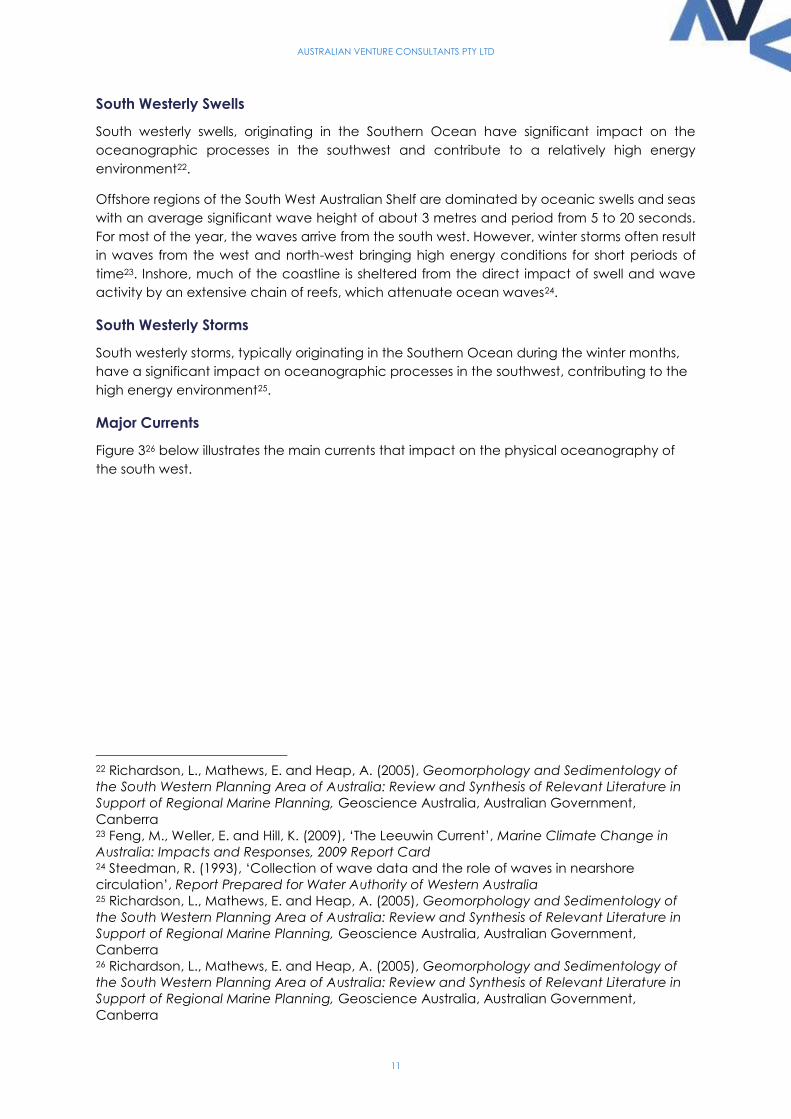
Major Currents
Figure 326 below illustrates the main currents that impact on the physical oceanography of
the south west.
22 Richardson, L., Mathews, E. and Heap, A. (2005), Geomorphology and Sedimentology of
the South Western Planning Area of Australia: Review and Synthesis of Relevant Literature in
Support of Regional Marine Planning, Geoscience Australia, Australian Government,
Canberra 23 Feng, M., Weller, E. and Hill, K. (2009), ‘The Leeuwin Current’, Marine Climate Change in
Australia: Impacts and Responses, 2009 Report Card 24 Steedman, R. (1993), ‘Collection of wave data and the role of waves in nearshore
circulation’, Report Prepared for Water Authority of Western Australia 25 Richardson, L., Mathews, E. and Heap, A. (2005), Geomorphology and Sedimentology of
the South Western Planning Area of Australia: Review and Synthesis of Relevant Literature in
Support of Regional Marine Planning, Geoscience Australia, Australian Government,
Canberra 26 Richardson, L., Mathews, E. and Heap, A. (2005), Geomorphology and Sedimentology of
the South Western Planning Area of Australia: Review and Synthesis of Relevant Literature in
Support of Regional Marine Planning, Geoscience Australia, Australian Government,
Canberra
AUSTRALIAN VENTURE CONSULTANTS PTY LTD
12
FIGURE 3 – MAIN CURRENTS OF THE SOUTH WEST REGION
West Australian Current
As the West Wind Drift approaches the coast of Western Australia, it turns north to parallel the
coast as the West Australian Current. It is weak during the winter and strong during summer.
Leeuwin Current
The Leeuwin Current is a warm, pole-ward flowing ocean eastern boundary current off the
west and south coasts of Australia. It is weaker during summer when there are opposing winds
and stronger in the winter months when these winds cease. In later autumn – early winter the
Leeuwin Current accelerates and rounds Cape Leeuwin and enters the waters of South
Australia, continuing as an eastward shelf current along the southern coast of Australia. During
the summer months, sporadic wind-driven northward inshore current and coastal upwelling
events occur in limited shelf regions off the west coast, while wind-driven upwelling is more
persistent off the southern coast of Australia.27
27 Feng, M., Weller, E. and Hill, K. (2009), ‘The Leeuwin Current’, Marine Climate Change in
Australia: Impacts and Responses, 2009 Report Card

AUSTRALIAN VENTURE CONSULTANTS PTY LTD
13
The headwaters of the Leeuwin Current lie at the western end of the North West Shelf, fed by
both tropical Pacific and central Indian Ocean water via the ITF, Holloway, South Equatorial
and Eastern Gyral Currents28
El Nino Southern Oscillation in the tropical Pacific Ocean has induced strong responses in the
Leeuwin Current off the west and south coasts of Australia, due to the existence of equatorial
and coastal waveguides. During La Nina events, deep anomalies in thermocline depth are
transmitted along the west and south Australian coasts, including high sea level anomalies,
strengthened Leeuwin Current volume transport, eddy energetics and pole-ward transport of
warm waters. Conversely, the event of El Nino, results in a weaker Leeuwin Current.
The headwaters of the Leeuwin Current lie at the western end of the North West Shelf and are
fed by both tropical Pacific Ocean and central Indian Ocean waters. The source of the
Leeuwin Current is understood to be complex. Waters from the Holloway Current are believed
to be a major source of the Holloway Current, as well as indirect flows from the branches of
the South Equatorial and Eastern Gyral Currents29.
The Leeuwin Current contributes to the maintenance of generally low levels of biological
productivity in the southwest region, as well as playing a crucial role in transporting tropical
and subtropical species to areas further south than would otherwise occur30.
Eddy Currents
The Leeuwin Current is intrinsically unstable and mesoscale eddy currents are an ubiquitous
feature of the Leeuwin Current. Indeed the Leeuwin Current has the highest eddy energy
among all eastern boundary currents in the world31. They are a major driver of ocean
circulation in the south west marine environment.
West Wind Drift
The West Wind Drift is a surface current that circulates around Antarctica, flowing from east to
west. It influences the south westerly direction of ocean swells affecting the south west Western
Australian marine environment32.
Subtropical Convergence
The subtropical convergence is the zone in the Southern Ocean where two water masses meet
and sharp changes in sea surface temperature are observed. The subtropical convergence
28 D’Admo, N., Fandry, C., Buchan, S. Domingues, C. (2009) ‘Northern Sources of the Leeuwin
Current and the Holloway Current on the North West Shelf’, Journal of the Royal Society of
Western Australia, (92), pp. 53-66 29 Wilson, B. (2013), The Biogeography of the Australian North West Shelf: Environmental
Change and Life’s Response, Elsevier, Massachusetts 30 Department of Environment, Water, Heritage and the Arts (2008), The Northwest Marine
Bioregional Plan: Bioregional Profile, Australian Government, Canberra 31 Feng, M., Weller, E. and Hill, K. (2009), ‘The Leeuwin Current’, Marine Climate Change in
Australia: Impacts and Responses, 2009 Report Card 32 Richardson, L., Mathews, E. and Heap, A. (2005), Geomorphology and Sedimentology of
the South Western Planning Area of Australia: Review and Synthesis of Relevant Literature in
Support of Regional Marine Planning, Geoscience Australia, Australian Government,
Canberra

AUSTRALIAN VENTURE CONSULTANTS PTY LTD
14
shifts latitude through time, moving northwards closer to southern Australia during glacial
periods33.
Ningaloo Current
The Ningaloo Current is a wind-driven, northward, inshore flow of cooler water from the west
coast, which in summer extends onto the western end of the North West Shelf.
2. Marine Ecosystems This section provides a brief overview of the biodiversity and ecosystems that are characteristic
of the Western Australian marine environment. It is deliberately brief in this introductory section,
as Appendix Error! Reference source not found., Sections Error! Reference source not found.
and Error! Reference source not found. provide a detailed discussion on the key habitats and
ecosystems of the northern and southern bioregions respectively.
Biodiversity is defined as the variety of life forms within a defined geographical area, including
the genetic and species diversity of plants, animals and microorganisms, as well as the variety
of habitats, ecological communities and ecological processes that exist in that geographical
area.
Ecosystems are comprised of biodiversity, habitats and nutrient cycling that support that
biodiversity. The physical ocean systems described in the previous sections shape the marine
environment in which those ecosystems exist, as well as providing connectivity between those
ecosystems.
The majority of the Western Australian coast line has a north-south orientation between the
latitudes 15o South and 25o South, with approximately 1,000 kilometres of coastline interfacing
with the Southern Ocean and a relatively small portion of the coastline interfacing with the
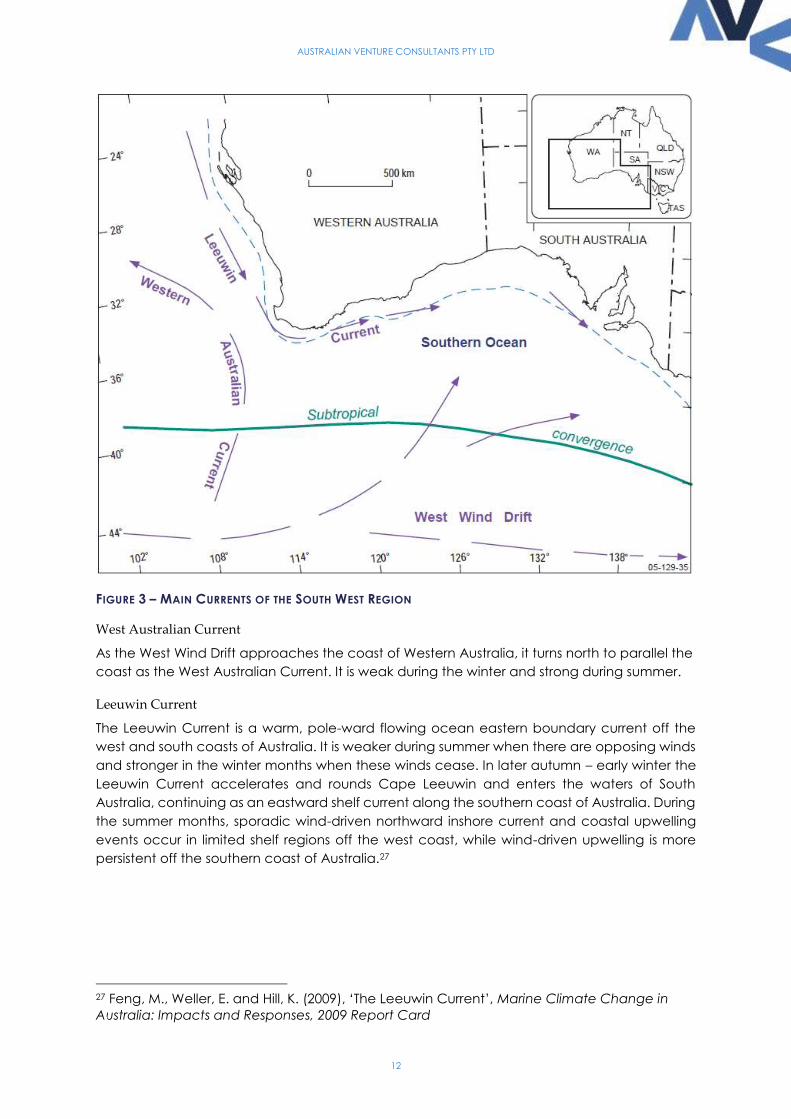
Timor Sea. Along this coastline exist a diverse range of physical features. These physical
features are summarised in Table 1 below.
33 Richardson, L., Mathews, E. and Heap, A. (2005), Geomorphology and Sedimentology of
the South Western Planning Area of Australia: Review and Synthesis of Relevant Literature in
Support of Regional Marine Planning, Geoscience Australia, Australian Government,
Canberra
AUSTRALIAN VENTURE CONSULTANTS PTY LTD
15
Physical Feature Description/Examples
Estuaries Leschenault, Peel Harvey, Swan-Canning,
Sounds Campden, Cockburn, King George
Bays Jurien Bay, Shark Bay, Roebuck Bay, Geographe Bay, Esperance
Bay
Island and island systems Recherche Archipelago, Rottnest Island, Bonaparte Archipelago,
Buccaneer Archipelago, Dampier Archipelago, Houtman-
Abrolhos Islands, Dirk Hartog Island, Barrow Island, Kimberly Islands
Coastal and Offshore Coral
reefs
Scott Reef, Rowley Shoals, Mermaid Reef, Montgomery Reef,
Ashmore Reef, Seringapatam Reef, Glomal Shoals and Ningaloo
Reef
Temperate Reefs Network of temperate reefs on the southwest coastline that host
significant biological productivity
Seagrass Meadows Western Australia has some of the most diverse seagrasses in the
world. Meadows of perennial seagrass species cover extensive
areas of Shark Bay, Cockburn Sound, Geographe Bay and Flinders
Bay and can be found along much of the southern coast. They
are less diverse and abundant and tend to be seasonal in northern
parts of the State.
Mangroves The climatic range in which mangroves exist in Western Australia
results in a complex ensemble of mangrove species that form
important habitats for a wide range of organisms and are quite
different to mangrove ecosystems elsewhere in Australia.
Sponge Gardens The Western Australian marine environment host extensive sponge
biodiversity. For example, the estimated number of sponge
species on Ningaloo Reef is 500 to 800 (the number of sponge
species known in the world is approximately 8,500)
Continental shelf A very wide, mostly sandy continental shelf
Shelf and deep ocean features Carbonate banks, continental slopes, Exmouth Plateau, Wallaby
Saddle, Naturalist Channel, Naturalist Plateau, Albany Canyons
and the Diamantina Fracture Zone
TABLE 1 – KEY PHYSICAL FEATURES OF THE WESTERN AUSTRALIAN MARINE ENVIRONMENT
The fact that these features exist in very diverse climatic and, as discussed in 1 above,
oceanographic conditions, means that they host diverse habitats and immense biodiversity
and ecosystems. This includes a wide range of iconic and listed marine fauna and flora,
significant endemism and short range endemic species.
AUSTRALIAN VENTURE CONSULTANTS PTY LTD
16
This includes a number of marine mega-fauna (whale sharks, blue whales, humpback whales,
southern right whales and sperm whales), numerous species of dolphin, dugong, a variety of
shark species, Australian sea lions, New Zealand fur seal, marine turtles, sawfish and sea snakes
as well as a large number of seabird species including the soft plumed petrel, Australian lesser
noddy and the Indian yellow-nosed albatross and species of coral. It also hosts significant
marine flora biodiversity including the most diverse seagrasses in the world and a large number
of sponge species. In addition to the large number of iconic and listed species, there is a
significant amount of marine fauna and flora endemism and short range endemic species in
the Western Australian marine environment. Furthermore, by virtue of the dominance of the
Leeuwin Current along the length of the Western Australian coast, these systems are highly
interconnected.
A detailed description of the key marine ecosystems that comprise the Western Australian
marine environment is contained in Appendix 13.
3. River Catchments The marine ecosystems discussed in the previous section are also affected, to an extent, by
the volume and chemical and sediment composition of river catchments that discharge into
the marine environment through river mouths and estuaries along the Western Australian
coast.
Compared to many other coastlines around the world, Western Australia has relatively few
large rivers that discharge into the marine environment. Indeed, the volume of run-off from
Australian rivers as a whole is among the lowest in the world and unlike the rest of the world, in
Australia, there is an inverse relationship between annual variation in the volume of run-off of
a river and the size of its catchment34. Indeed there is considerable inter-annual variation in
the flow of many Western Australian rivers, particularly those in the Gascoyne-Murchison,
Pilbara and Kimberley Regions.
Nevertheless, there are approximately 50 rivers in Western Australia that are over 100 kilometres
in length that either directly, or indirectly through a river system, discharge into the Timor Sea,
Indian Ocean and Southern Ocean from the Western Australian hinterland (see Section 4).
Only a handful of these rivers are significant in terms of flow and many draw from relatively
pristine catchments. However, there are a number of river systems, particularly the Ord River,
Swan-Canning Rivers, Serpentine-Murray-Harvey Rivers and several rivers in the South West of
the State whose catchment is characterised by significant agricultural, mining and urban
development.
The following subsections describe the main rivers in each of the regions of Western Australia
as well as the main river systems.
34 Finlayson, B. and McMahon, T. (1988) ‘Australia versus the rest of the world: a comparative
analysis of streamflow characteristics’, IN: Fluvial Geomorphology of Australia’, Warner, R.
(Ed.), Academic Press, Sydney

AUSTRALIAN VENTURE CONSULTANTS PTY LTD
17
3.1. Kimberley River Catchments The main rivers in the Kimberley Region that discharge to the Timor Sea are the Berkeley,
Durack, Forrest, King George, King, Ord, Pentecost and Sale Rivers. The Ord is the most
significant river in this region and one of the most regulated in Western Australia, with dams at
Lake Argyle and Lake Kununurra used for both irrigation and hydroelectricity. The irrigation
network covers 150km² of farmland (with plans for significant expansion currently being
implemented) supporting the production of a wide variety of crops, including tropical fruit,
vegetables and seed crops. Efforts to grow sugar, rice and cotton have not been sustainable.
Most of the other rivers in this region are largely in pristine condition due to their remoteness.
In addition, the Charnley, Drysdale, Fitzroy, Isdell, King Edward, Lennard, Mitchell, Prince
Regent and Robinson Rivers discharge into the Indian Ocean. The Fitzroy River is in a semi-
arid/monsoonal climate and has, on average, the greatest volume of annual flow and the
largest floods in WA. It remains an unregulated river and its catchment is dominated by
pastoral leases. There have been proposals for establishing an irrigation scheme in the region
and a pipeline to transport water to the Perth metropolitan area, albeit neither have
progressed.
Mining activities in the Kimberley region have the potential to impact on water quality.
However, there are very few operations and there interaction with rivers and the ground water
system is highly regulated and intensively managed.
3.2. Pilbara Region Rivers that discharge into the Indian Ocean from the Pilbara Region include the Ashburton,
Cane, De Grey, Fortescue, Harding, Robe, Sherlock, Turner and Yule Rivers. The Pilbara Region
is characterised by a semi-arid climate and a number of its rivers are ephemeral yet prone to
flooding. There are competing pressures on water resources in the region, the most significant
been from the resources, primarily iron ore, industry. However, increasing populations in
Karratha, Onslow and Port Hedland also potentially place pressure on water resources.
3.3. Gascoyne-Murchison The Gascoyne and Murchison are significant rivers in Western Australian. Although in a semi-
arid region and only flowing for around 120 days a year, the Gascoyne River is the longest river
in Western Australia. It is joined by the 561 kilometre long Lyons River about 16km from its mouth,
and together they have a catchment area of 68,326km².
There is significant horticulture activity carried out along the banks of the river near Carnarvon
on 170 plantations covering an area of 15km². This area produces a range of crops including
tropical fruit and vegetables. Pastoral activity is also significant with over 80 stations in the
region. Mining production is limited, with activity centred on salt production north of
Carnarvon (see Appendix Error! Reference source not found., Section Error! Reference source
not found.)
3.4. Midwest Region Rivers in the Midwest region include the Chapman, Greenough, Irwin and Moore Rivers. The
coastal areas of the Mid West experience a mild, Mediterranean climate with inland areas a
more arid climate.

AUSTRALIAN VENTURE CONSULTANTS PTY LTD
18
Broad-acre cropping and livestock operations are a significant land-user in the region and
within river catchments. There is also a small amount of horticulture undertaken near coastal
areas. Mining operations that could potentially impact on water quality include operations in
the iron ore, gold, copper, nickel and mineral sands sectors.
3.5. Swan-Avon The Perth Metropolitan Area and parts of the Wheatbelt region revolve around the Swan-
Canning-Avon river system. The combined Swan-Avon River is 280 kilometres long and flows
from a location near the town of Wickepin to the Indian Ocean at Fremantle. The Swan-Avon
River drains a total catchment of around 126,000km².
The lower reaches of the Swan and Canning rivers form an estuary that was mostly brackish
water before the Fremantle sand bar was removed in the late 1800s and a large flood delta
dredged. The estuary is now a permanently open and changes from fresh/brackish conditions
in winter and spring, to salty conditions during summer and autumn.
The Swan river system sits within a large urban and agricultural catchment and has relatively
shallow and slow-moving river conditions. These factors, as well as sandy soils, a climate of
diminishing rainfall and long, hot summers make the system vulnerable to a suite of
environmental issues. The most significant of these is the large amounts of nutrients that may
fuel algal blooms such as phosphorus and nitrogen flowing into the river from the agricultural
catchment.
The river is also a significant site of recreation for visitors and residents of the surrounding
metropolitan area and boating activities in particular.
3.6. Peel – Harvey The Harvey, Murray and Serpentine rivers discharge to the Peel Estuary, which is the focus of
the town of Mandurah and urban development in its surrounds.
The Harvey River discharges into the southern end of the elongated Harvey Estuary, which has
an area of about 56 km². This in turn feeds into the south west corner of the more northerly Peel
Inlet, which is roughly circular and occupies an area of about 75 km². The Serpentine River and
Murray Rivers discharge into the eastern edges of Peel Inlet.
The catchment area, approximately 11,500km², encompasses high quality coastal dune and
lake environments, the largest estuarine system in the south west, and an extensive back-plain
and foothills area. The coastal plain portion of the catchment supports many relatively small
sized farms and areas of irrigated horticulture. It also includes the rapidly growing city of
Mandurah and southern parts of the Perth metropolitan region with the associated urban, peri-
urban, and industrial land uses.
Both irrigated and non-irrigated intensive agriculture, in particular beef production, dominate
the coastal plain, and almost the entire coastal area has been cleared for agricultural, mining
or urban land use. Conserved areas and cropping dominate the broader catchment,
particularly on the Darling Plateau.
The estuary is also a significant site of recreation for visitors and residents of the surrounding
metropolitan area, including boating and fishing activities.

AUSTRALIAN VENTURE CONSULTANTS PTY LTD
19
After several decades of severe algal blooms in the estuary caused by discharge of nutrients
from agricultural land and piggeries, the Dawesville Cut was constructed and opened in 1994.
Recent surveys have shown that levels of phosphorous and sulphidic sediments remain high.
3.7. South West Region The main rivers in the South West Region are the Blackwood, Collie, Donnelly and Warren Rivers.
The Leschenault Estuary catchment covers approximately 4,808km² with land use in the area
highly diversified. Runoff from the catchment enters the estuary via the Collie and Preston
rivers and the Parkfield Drain. The lower Collie catchment has been extensively cleared and
drained for agriculture. Irrigated pastures in the central and eastern area support grazing of
dairy and beef cattle, while horticulture, industrial and residential development characterise
the western area near the estuary and coastline. Land use within the Preston catchment
ranges from broad-acre agriculture (cropping and grazing), to intensive orcharding, viticulture
and horticulture. Approximately 33 per cent of the catchment is cleared, with the land east
of the Darling Scarp remaining largely forested. Works to service the requirements of the
Bunbury Port undertaken in the 1950s included closing the natural outlet to the ocean at Point
MacLeod and excavating a connection to the ocean through the dunes opposite the mouth
of the Collie River. Rivers within the catchment are subject to algal blooms and fish kills from
excess nutrients in run off. Surveys have also shown the inlet has high levels of heavy metals in
sediment.
The Vasse Wonnerup Estuary and Geographe Bay catchment occupies some 2,000 km² along
the Busselton coast. The bulk of the land in the catchment is utilised by intensive agricultural
industries, with dairy and beef grazing dominant and intensifying, along with horticulture and
viticulture. Algal blooms caused by excessive nutrients have been known to cause fish kills in
the estuary. Population growth in the Busselton, Dunsborough and Capel town sites may also
contribute to the water quality problems.
The Blackwood, Donnelly and Warren Basins are largely cleared and used for horticulture,
viticulture and grazing as well as forestry. Salinity and nutrient run are a threat for some parts
of these rivers. Algal blooms have occurred in the Hardy Inlet, being the Blackwood River
mouth at Augusta.
Swimming, canoeing and fishing are popular recreational pursuits in many of the rivers of the
South West region.
3.8. Great Southern Region Rivers of the Great Southern Region include the Deep, Frankland, Gairdner, Kalgan, Kent, Lort,
Pallinup and Phillips Rivers.
The Deep River is one of a few rivers in WA that remains in almost pristine condition. Large
sections of catchment areas of the Great Southern are State Forest or National Park, and much
of the coastal area is remote and inaccessible. The region is becoming increasingly attractive
to visitors for nature based tourism activities.
There are large areas of cleared land for agricultural use and forestry, with the most significant
agricultural use being broad-acre cropping (wheat and barley), livestock and dairy, egg and
wool production.
AUSTRALIAN VENTURE CONSULTANTS PTY LTD
20
There are a number of significant estuaries in the region, including the Broke Inlet, Fitzgerald
Inlet, Gordon Inlet, Irwin Inlet, Stokes Inlet, Wilson Inlet and Walpole-Nornalup Inlet, which all in
relatively good condition.
AUSTRALIAN VENTURE CONSULTANTS PTY LTD
21
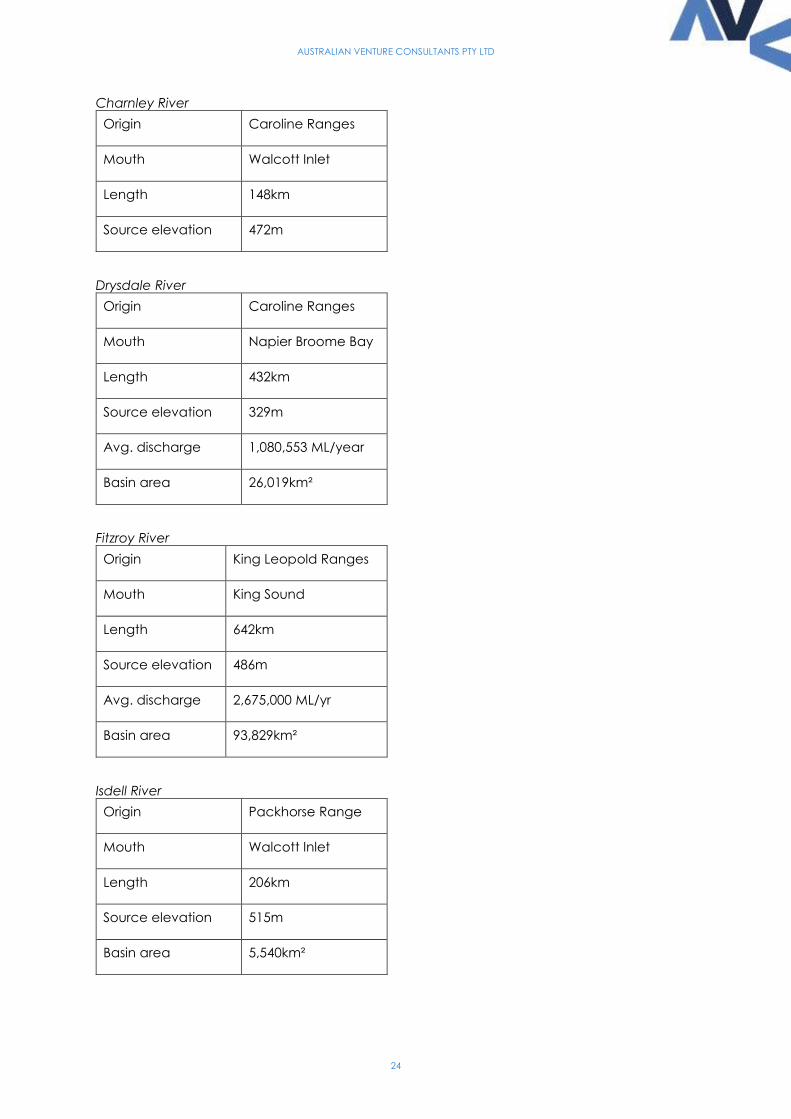
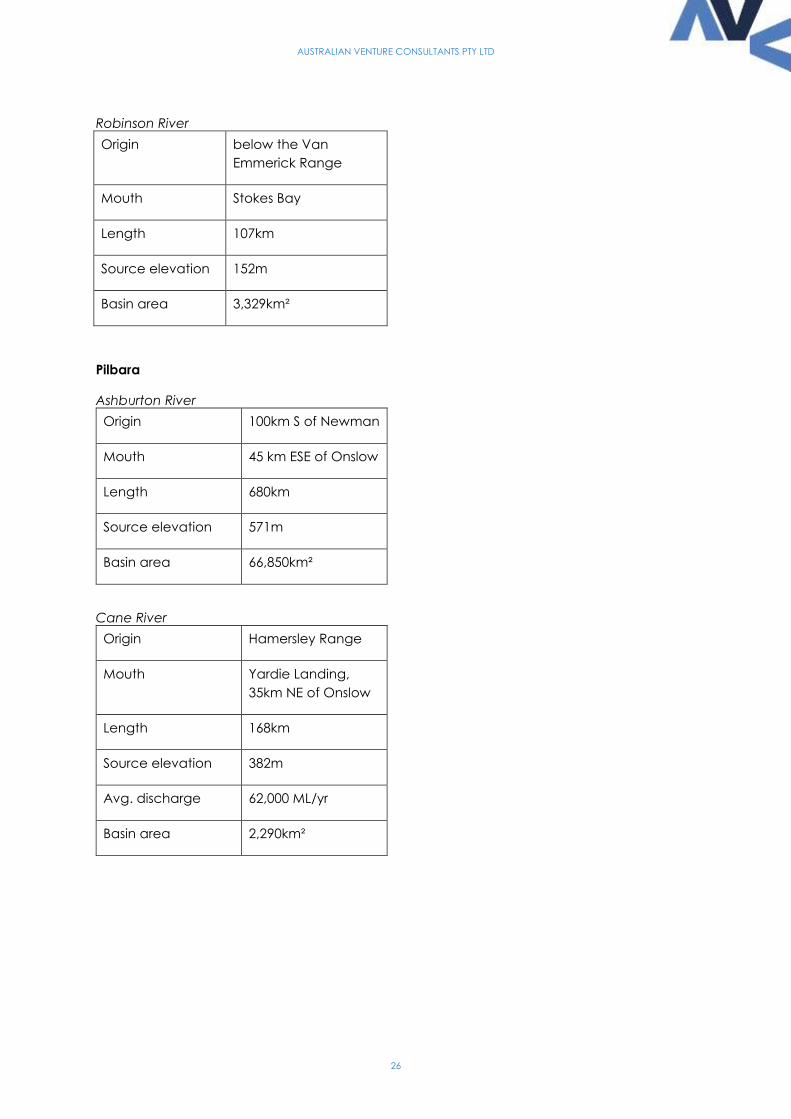
4. Key Western Australian Rivers The following tables summarise the main rivers in Western Australia.

AUSTRALIAN VENTURE CONSULTANTS PTY LTD
22
Kimberley Region
Berkeley River
Origin Tadarida Scarp
Mouth Joseph Bonaparte Gulf
Length 180km
Source elevation 422m
Basin area 5,149km²
Durack River
Origin Durack Range
Mouth Cambridge Gulf
Length 306km
Source elevation 563m
Avg. discharge 408,400 ML/yr
Basin area 4,088km²
Forrest River
Origin near Pseudomys Hill
Mouth Cambridge Gulf
Length 141km
Source elevation 319m
King George River
Origin W of the Ashton Range
Mouth Koolama Bay
Length 125km
Source elevation 212m

AUSTRALIAN VENTURE CONSULTANTS PTY LTD
23
King River
Origin Durack Range
Mouth Cambridge Gulf
Length 132km
Source elevation 387m
Ord River
Origin Kimberley Plateau
Mouth Cambridge Gulf
Length 588km
Source elevation 531m
Avg. discharge 3,870,000 ML/yr
Basin area 46,100km²
Pentecost River
Origin below the Durack Range
Mouth Cambridge Gulf
Length 275km
Source elevation 248m
Basin area 29,413km²
Sale River
Origin Spong Pyramid
Mouth Doubtful Bay
Length 109km
Source elevation 275m
Basin area 1,438km²
AUSTRALIAN VENTURE CONSULTANTS PTY LTD
24
Charnley River
Origin Caroline Ranges
Mouth Walcott Inlet
Length 148km
Source elevation 472m
Drysdale River
Origin Caroline Ranges
Mouth Napier Broome Bay
Length 432km
Source elevation 329m
Avg. discharge 1,080,553 ML/year
Basin area 26,019km²
Fitzroy River
Origin King Leopold Ranges
Mouth King Sound
Length 642km
Source elevation 486m
Avg. discharge 2,675,000 ML/yr
Basin area 93,829km²
Isdell River
Origin Packhorse Range
Mouth Walcott Inlet
Length 206km
Source elevation 515m
Basin area 5,540km²

AUSTRALIAN VENTURE CONSULTANTS PTY LTD
25
King Edward River
Origin Poonjurra Hill
Mouth Napier Broome Bay
Length 221km
Source elevation 480m
Basin area 17,624km²
Lennard River
Origin King Leopold Ranges
Mouth King Sound via
Meda and May Rivers
Length 240km
Source elevation 342m
Basin area 14,757km²
Mitchell River
Origin NE of Sharp Hill
Mouth Walmsley Bay
Length 117km
Source elevation 441m
Basin area 2,955km²
Prince Regent River
Origin Caroline Range
Mouth St George Basin,
Hanover Bay
Length 104km
Source elevation 550m
Basin area 5,506km²
AUSTRALIAN VENTURE CONSULTANTS PTY LTD
26
Robinson River
Origin below the Van
Emmerick Range
Mouth Stokes Bay
Length 107km
Source elevation 152m
Basin area 3,329km²
Pilbara
Ashburton River
Origin 100km S of Newman
Mouth 45 km ESE of Onslow
Length 680km
Source elevation 571m
Basin area 66,850km²
Cane River
Origin Hamersley Range
Mouth Yardie Landing,
35km NE of Onslow
Length 168km
Source elevation 382m
Avg. discharge 62,000 ML/yr
Basin area 2,290km²

AUSTRALIAN VENTURE CONSULTANTS PTY LTD
27
De Grey River
Origin confluence of
Nullagine and
Oakover Rivers
Mouth Breaker Inlet
Length 193km
Source elevation 129m
Avg. discharge 3,900 ML/yr
Basin area 56,720km²
Fortescue River
Origin Ophthalmia Range
Mouth 40km SW of
Dampier
Length 760km
Source elevation 602m
Avg. discharge 391,000 ML/yr
Basin area 49,759km²
Harding River
Origin Chichester Range
Mouth Butcher Inlet
Length 150km
Source elevation 311m

AUSTRALIAN VENTURE CONSULTANTS PTY LTD
28
Robe River
Origin Hamersley Range
Mouth near Robe Point
Length 276km
Source elevation 477m
Basin area 3,350km²
Sherlock River
Origin Abydos Plain
Mouth estuary at Sherlock
Bay
Length 393km
Source elevation 470m
Avg. discharge 188,000 ML/yr
Basin area 4,580km²
Turner River
Origin Pullcunah Hill
Mouth 40km S of Port
Hedland
Length 236km
Source elevation 253m
Basin area 4,555km²
AUSTRALIAN VENTURE CONSULTANTS PTY LTD
29
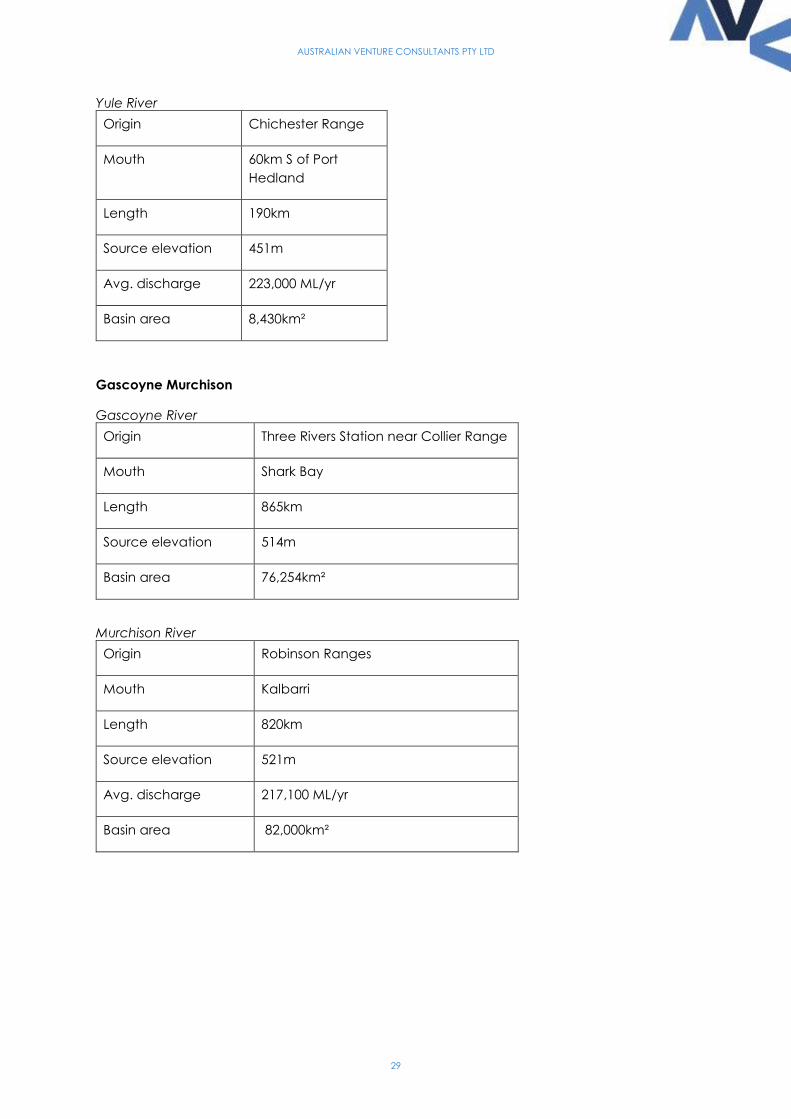
Yule River
Origin Chichester Range
Mouth 60km S of Port
Hedland
Length 190km
Source elevation 451m
Avg. discharge 223,000 ML/yr
Basin area 8,430km²
Gascoyne Murchison
Gascoyne River
Origin Three Rivers Station near Collier Range
Mouth Shark Bay
Length 865km
Source elevation 514m
Basin area 76,254km²
Murchison River
Origin Robinson Ranges
Mouth Kalbarri
Length 820km
Source elevation 521m
Avg. discharge 217,100 ML/yr
Basin area 82,000km²

AUSTRALIAN VENTURE CONSULTANTS PTY LTD
30
Midwest
Chapman River
Origin 150km NE of
Geraldton
Mouth Bluff Point
Length 105km
Source elevation 270m
Basin area 1,644km²
Greenough River
Origin Jingemarra Station
Mouth Cape Burney
Length 340km
Source elevation 391m
Basin area 13,200km²
Irwin River
Origin near Pindar
Mouth Arurine Bay
Length 140km
Source elevation 326m
Basin area 6,071km²
AUSTRALIAN VENTURE CONSULTANTS PTY LTD
31
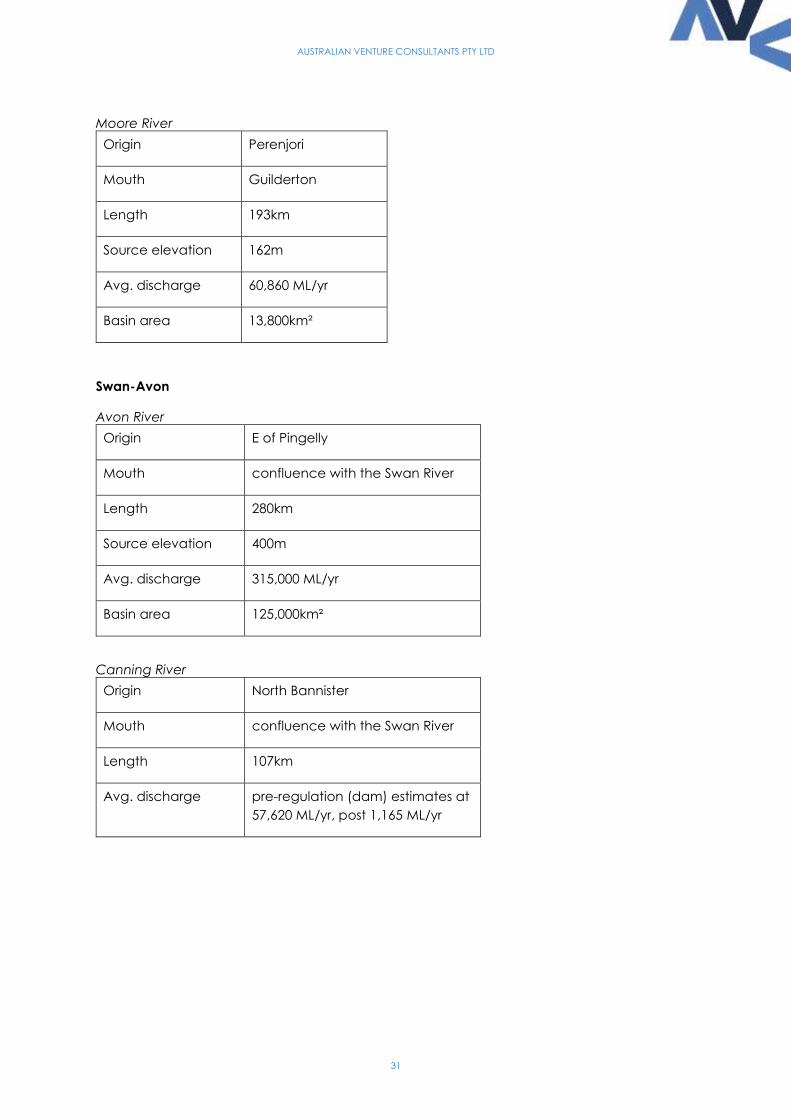
Moore River
Origin Perenjori
Mouth Guilderton
Length 193km
Source elevation 162m
Avg. discharge 60,860 ML/yr
Basin area 13,800km²
Swan-Avon
Avon River
Origin E of Pingelly
Mouth confluence with the Swan River
Length 280km
Source elevation 400m
Avg. discharge 315,000 ML/yr
Basin area 125,000km²
Canning River
Origin North Bannister
Mouth confluence with the Swan River
Length 107km
Avg. discharge pre-regulation (dam) estimates at
57,620 ML/yr, post 1,165 ML/yr

AUSTRALIAN VENTURE CONSULTANTS PTY LTD
32
Swan River
Origin near Walyunga National Park
Mouth Fremantle
Length 60km
Basin area 121,000km²
Peel-Harvey
Harvey River
Origin near Mt Keats
Mouth Harvey Estuary
Length 90km.
Avg. discharge 4,426 ML/yr
Basin area 2,000km²
Murray River
Origin Mt Keats
Mouth Peel Inlet
Length 134km
Source elevation 187m
Serpentine River
Origin Bowerling Hill
Mouth Peel Inlet
Length 111km
Source elevation 313m

AUSTRALIAN VENTURE CONSULTANTS PTY LTD
33
South West
Blackwood River
Origin junction of Arthur
and Balgarup Rivers
Mouth Hardy Inlet, Augusta
Length 300km
Source elevation 219m
Avg. discharge 940,400 ML/yr
Basin area 28,100km²
Collie River
Origin Darling Range
Mouth Leschenault Estuary
Length 154km
Source elevation 207m
Basin area 3,745km²
Donnelly River
Origin between Bridgetown
and Manjimup
Mouth 50km SE of Augusta
Length ]151km
Avg. discharge 331,000 ML/yr
Basin area 1,725km²
AUSTRALIAN VENTURE CONSULTANTS PTY LTD
34
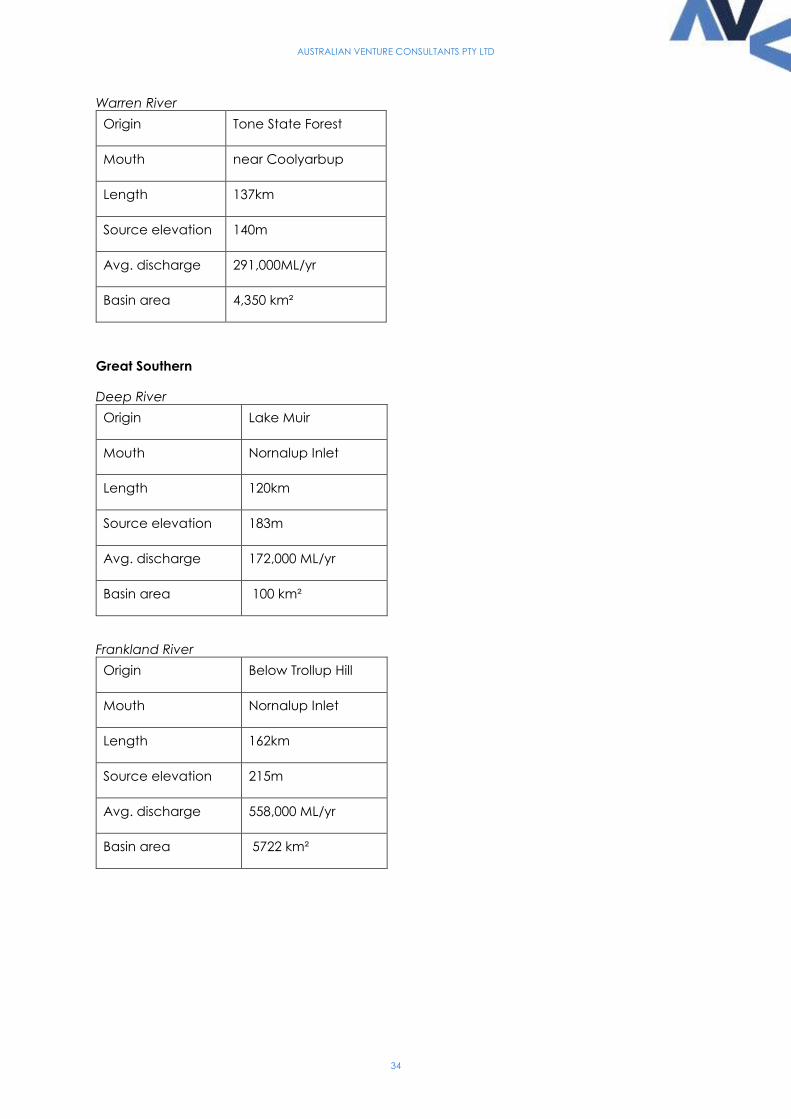
Warren River
Origin Tone State Forest
Mouth near Coolyarbup
Length 137km
Source elevation 140m
Avg. discharge 291,000ML/yr
Basin area 4,350 km²
Great Southern
Deep River
Origin Lake Muir
Mouth Nornalup Inlet
Length 120km
Source elevation 183m
Avg. discharge 172,000 ML/yr
Basin area 100 km²
Frankland River
Origin Below Trollup Hill
Mouth Nornalup Inlet
Length 162km
Source elevation 215m
Avg. discharge 558,000 ML/yr
Basin area 5722 km²

AUSTRALIAN VENTURE CONSULTANTS PTY LTD
35
Gairdner River
Origin Needilup-Jacup
Mouth Gordon Inlet
Length 130km
Source elevation 320m
Avg. discharge 940,000 ML/yr
Basin area 1,770km²
Kalgan River
Origin Stirling Ranges
Mouth Oyster Harbour,
King George Sound
Length 140km
Source elevation 199m
Avg. discharge 53,400 ML/yr
Basin area 2,562 km²
Kent River
Origin Tenterden
Mouth Irwin Inlet, Foul Bay
Length 140km
Source elevation 235m

AUSTRALIAN VENTURE CONSULTANTS PTY LTD
36
Lort River
Origin Goldfields-
Esperance; Peak
Charles National
Park
Mouth Stokes Inlet
Length 130km
Source elevation 206m
Avg. discharge 6,190 ML/yr
Basin area 2,502km²
Pallinup River
Origin south of Katanning
Mouth Beaufort Inlet
Length 250km
Source elevation 323m
Avg. discharge 24,800 ML/yr
Basin area 4,795km²
Phillips River
Origin Goldfields-
Esperance; Mt
Madden
Mouth Culham Inlet
Length 120km
Source elevation 188m
Avg. discharge 7,300 ML/yr
Basin area 2,307km²