Embed Size (px)
Citation preview
The Life Cycle of Dams:
An Analysis of Policy Change on the Rogue
River, Oregon
Wendy McDermottResource Management Graduate Student
Central Washington UniversityMay 24, 2011

Case-study approach provides for lessons-learned
~~~~~~~~~~~~~~~~~~~~~~
“Effective science and well-informed public policy are the avenues to successful management of environmental resources.”
~ William Graf (1992)
“Through documentation and analyses of case studies we can be guided by the light of science rather than
curse the darkness in which we must make projections.”
~ Bruce Babbitt (2002)
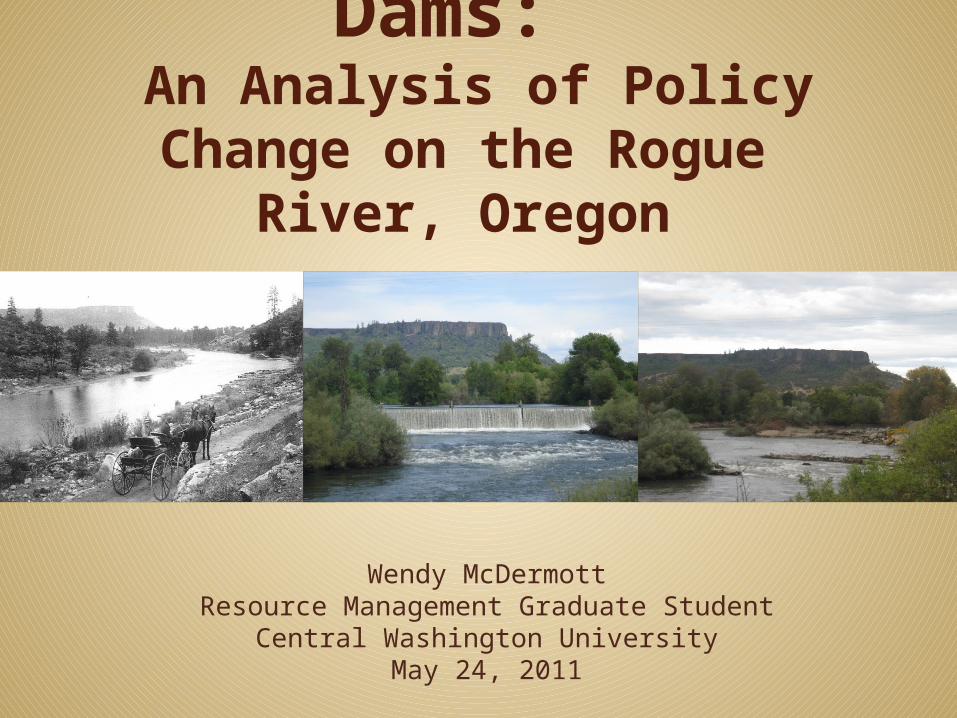
A Dammed Nation
Problem ~80,000 dams in the U.S. Disrupts natural flow regime Fragments ecosystems Block migrating fish passage Social displacement, migration
and resettlement
New Era of River Mgmt Convergence of a number of economic,
social, and environmental factors
Reflected in changing policies
to re-create more natural ecosystems and to conserve natural & cultural resources
Source: National Inventory of Dams, 2010
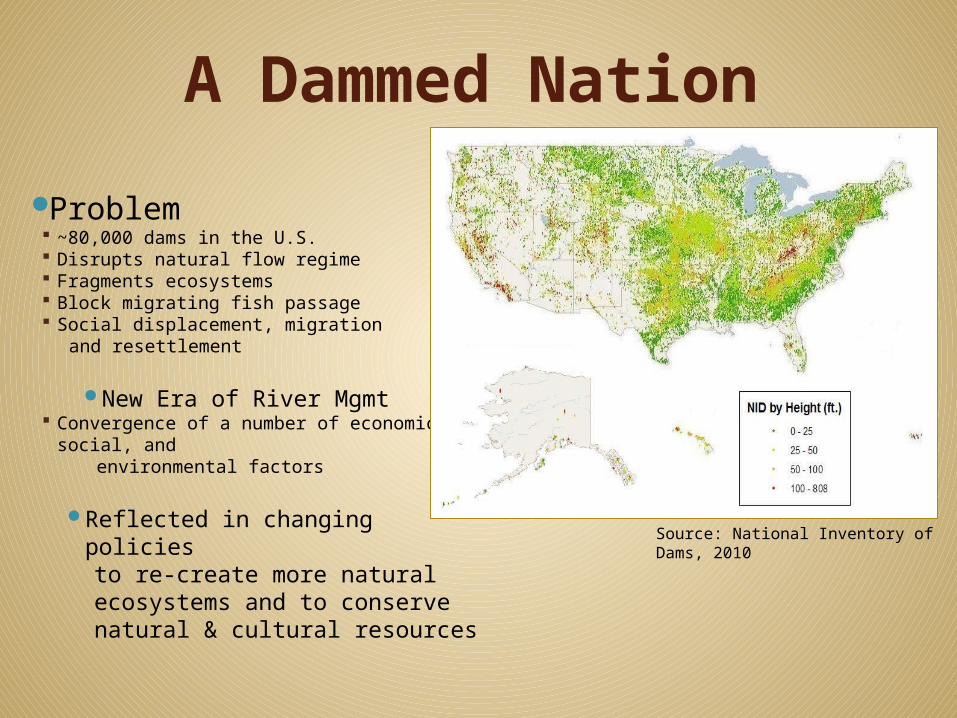
Predominant Reasons for Dam Removals in the U.S.
Environmental and Social Concerns
Age, Functional Status
Economics & Cost-benefit Analyses Marginal Benefits from Continued Operations FERC Relicensing Process
Hazard & Safety Ratings
Changes in Public Opinion
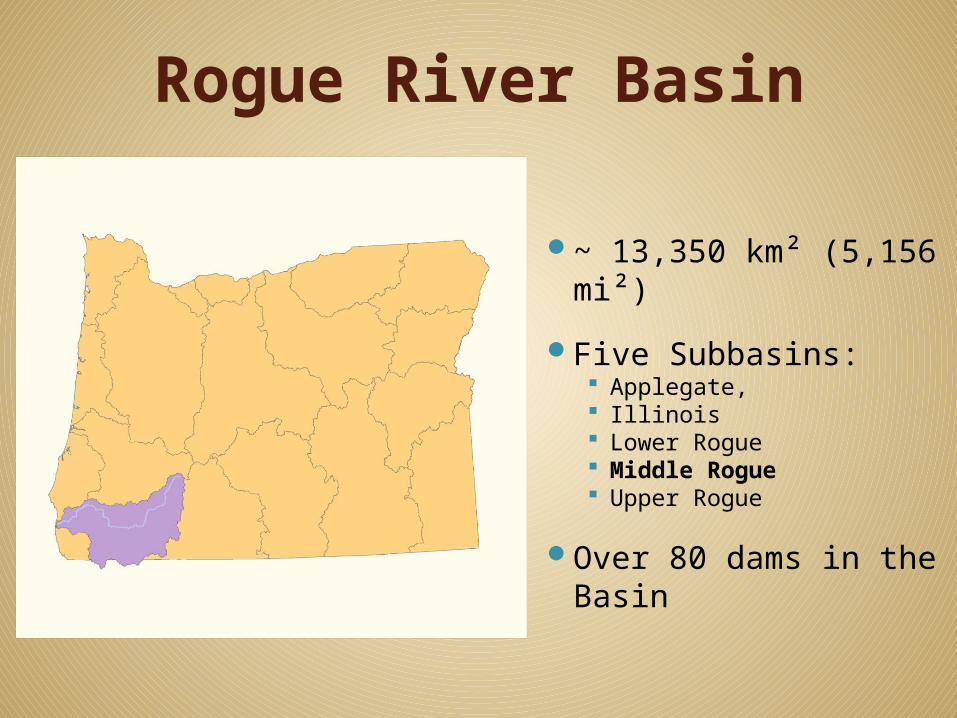
Rogue River Basin
~ 13,350 km² (5,156 mi²)
Five Subbasins: Applegate, Illinois Lower Rogue Middle Rogue Upper Rogue
Over 80 dams in the Basin
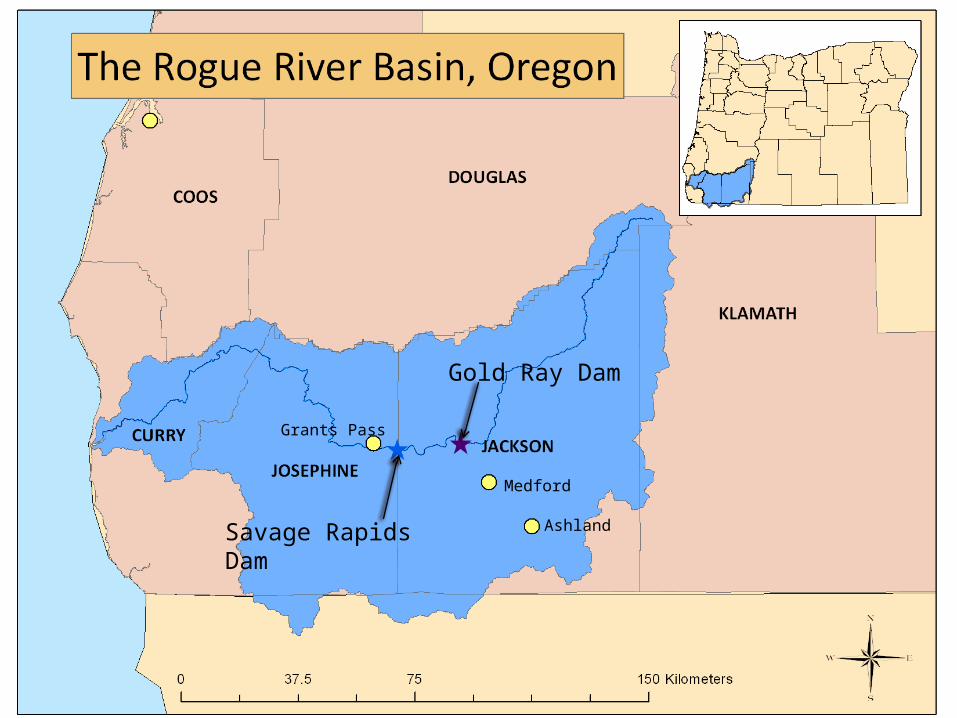
Medford
Ashland
Grants Pass
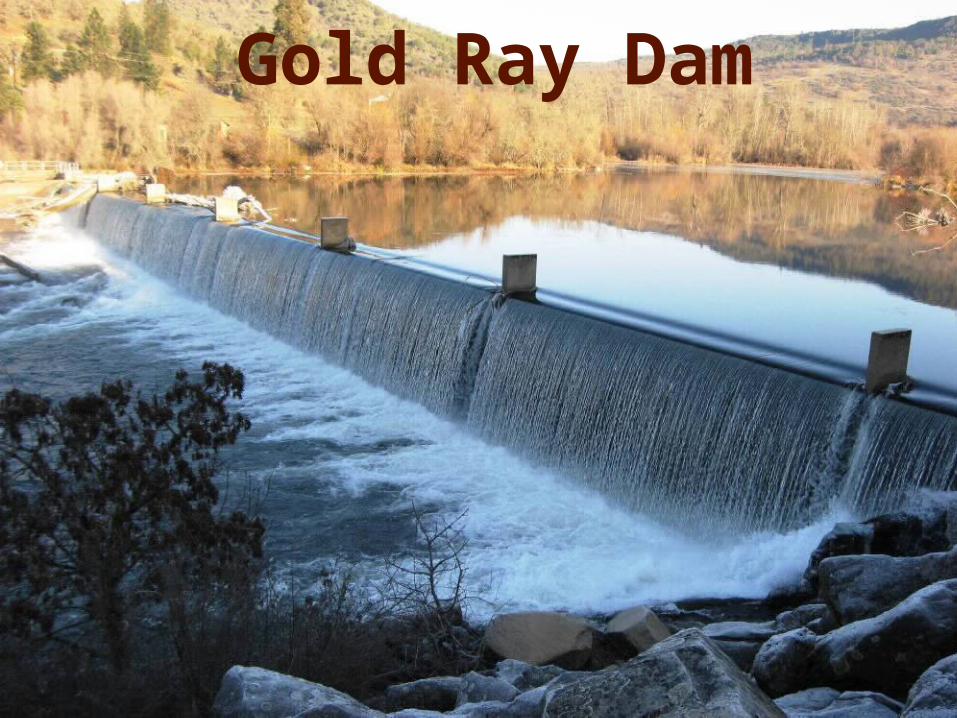
Gold Ray Dam
Savage Rapids Dam
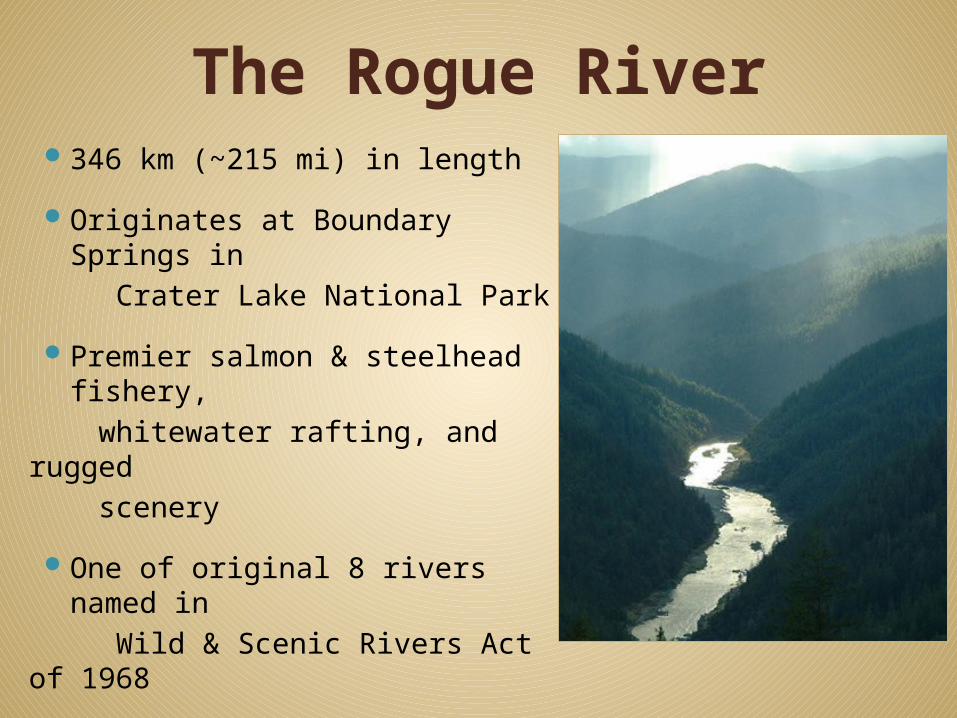
The Rogue River346 km (~215 mi) in length
Originates at Boundary Springs in
Crater Lake National Park
Premier salmon & steelhead fishery,
whitewater rafting, and rugged scenery
One of original 8 rivers named in
Wild & Scenic Rivers Act of 1968
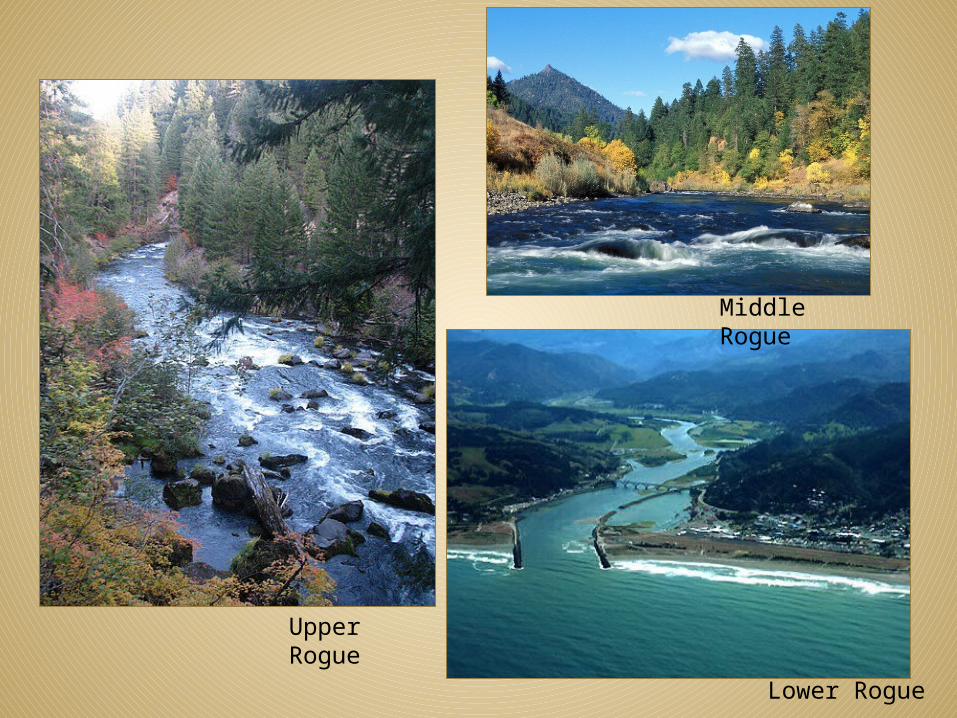
Upper Rogue
Middle Rogue
Lower Rogue

Rogue River Socio-Economics
Agricultural Industry:
2500 directly employed
9000 indirectly $141 million in
crop & livestock sales
pears, wine grapes, alfalfa, corn
(Climate Leadership Initiative, 2008)

Rogue River Socio-Economics
Fisheries $1.4 million commercial
fishing
$16 million sport fishing $1.5 billion non-use
values
Recreation/Tourism $30 million in economic
output 445 full- and part-time
jobs(ECONorthwest, 2009)

The Dams of the Study

Savage Rapids Dam
Gold Ray Dam

Medford
Ashland
Grants Pass
Gold Ray Dam
Savage Rapids Dam
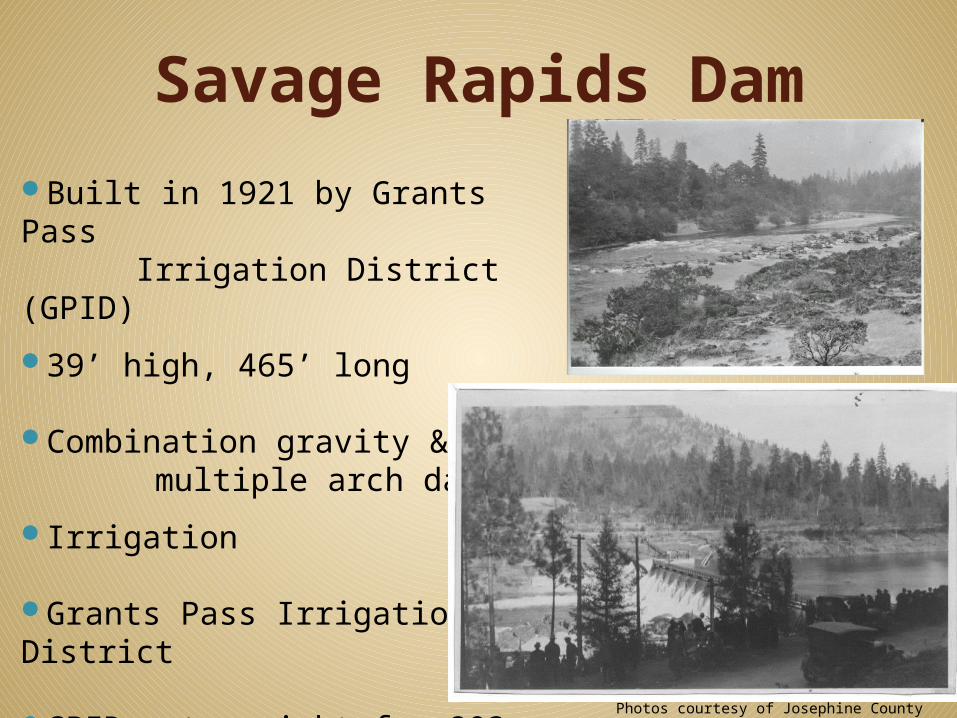
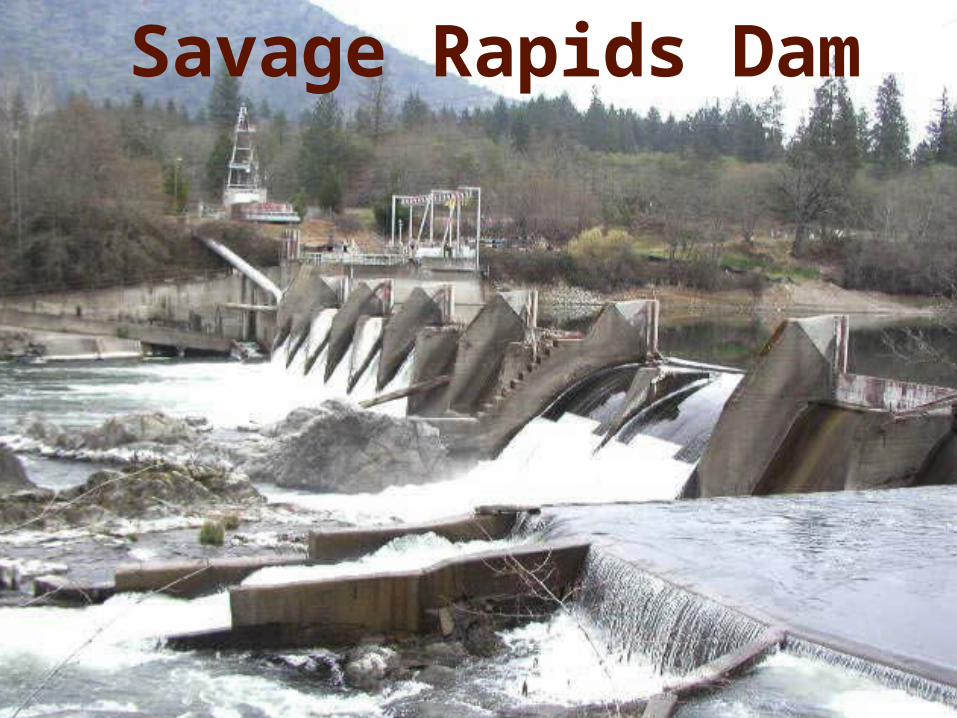
Savage Rapids Dam
Built in 1921 by Grants Pass Irrigation District (GPID)
39’ high, 465’ long
Combination gravity & multiple arch dam
Irrigation
Grants Pass Irrigation District
GPID water right for 203 cfs
Removed in October 2009
Photos courtesy of Josephine County Hx Society


Gold Ray Dam
Built in 1904 by Ray Brothers to power Braden Mine
Originally log crib style
Replaced with concrete in 1941 by CA-OR Power Company
35’ high, 394’ long
Hydropower
Closed in 1972 by Pacific Power, deeded to Jackson County
Removed Summer 2010
Photos courtesy of Jackson County

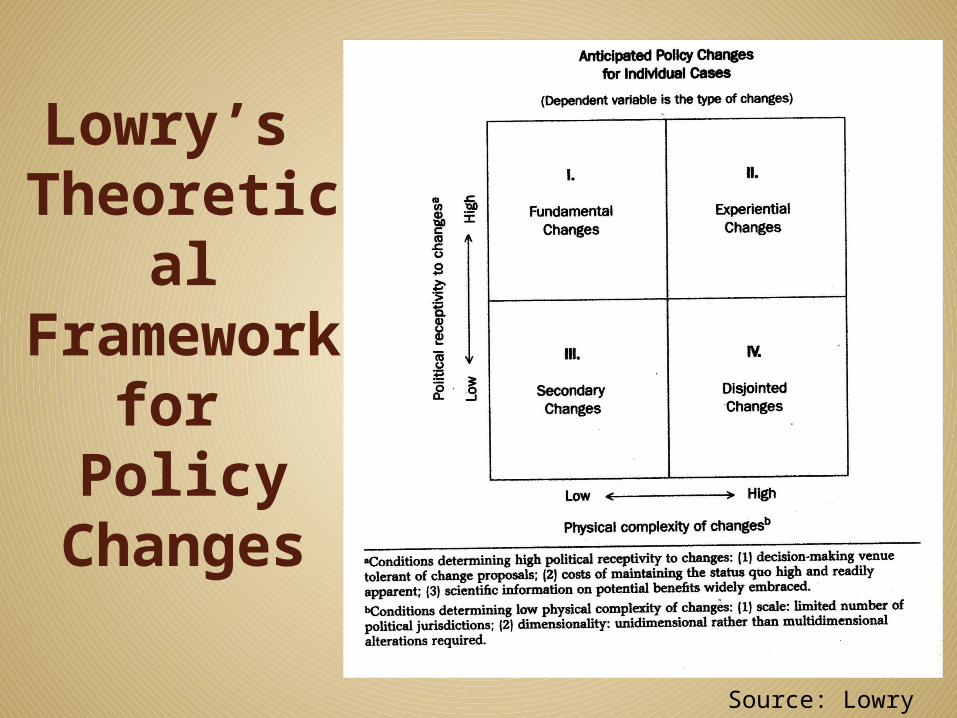
Lowry’s Theoretic
al Framewor
k for Policy
Changes
Source: Lowry (2003)

Independent VariablesPOLITICAL RECEPTIVITY Interactions btwn Coalitions Reflect Political Receptivity
Identify primary stakeholders What percent in favor of removal?
Decision-making Venue Level of decision-making Points of Access
Costs of Maintaining Status Quo Which Alternative costs more?
Scientific Info on Potential Benefits Widely Embraced
Broad-based scientific consensus
PHYSICAL COMPLEXITY
Scale – Political Jurisdictions Not # of actors, but diversity of
their viewpoint Is there agreement?
Dimensionality – (Decision Points along the way)
Unidimensional – less layers of government
Multidimensional – more layers
Scope of Undertaking Size of dam, miles of river to be
restored, etc.

MethodsReviewed NEPA documents & tech reports Gained initial understanding of issues at hand
Six weeks in the Rogue Basin! Visited Southern Oregon Hx Society & Josephine Cnty
Hx Society Collected and reviewed newspaper articles & LTEs Conducted interviews with key informants
Read Public Hearing Transcripts & Public Comment
from NEPA planning processes Created database, tallied for or against removal Analyzed content to identify major themes
Savage Rapids Dam

History of Savage Rapids Dam
Built 1921 - lacked safe passage for fish
1929 – GPID granted water right for 230 cfs to
irrigate ~18,000 acres Never reached that amount of irrigated lands
1982 –GPID reports only 7,738 acres under irrigation
State of Oregon reduces water right to 97 cfs 1987 – GPID applies for additional 90 cfs
1988 – 1990 - NGOs protest water rights application
Settlement instructed GPID to study water conservation practices & investigate fish passage option including removal

Savage Rapids Dam con’t
1994 – GPID issues plan to resolve fish passage issues through dam removal Replace dam with pumping system
1995 – BOR releases Planning Report/Final EIS Preferred Alternative: Dam Removal/Pumping Facility Dam Retention Alternative No Action Alternative
BUT....Months later, new GPID Board reneges on removal,
launches statewide lobbying campaign!And…Senator Brady from Grants Pass became
Pres of State Senate – “Saving” dam becomes state priority!
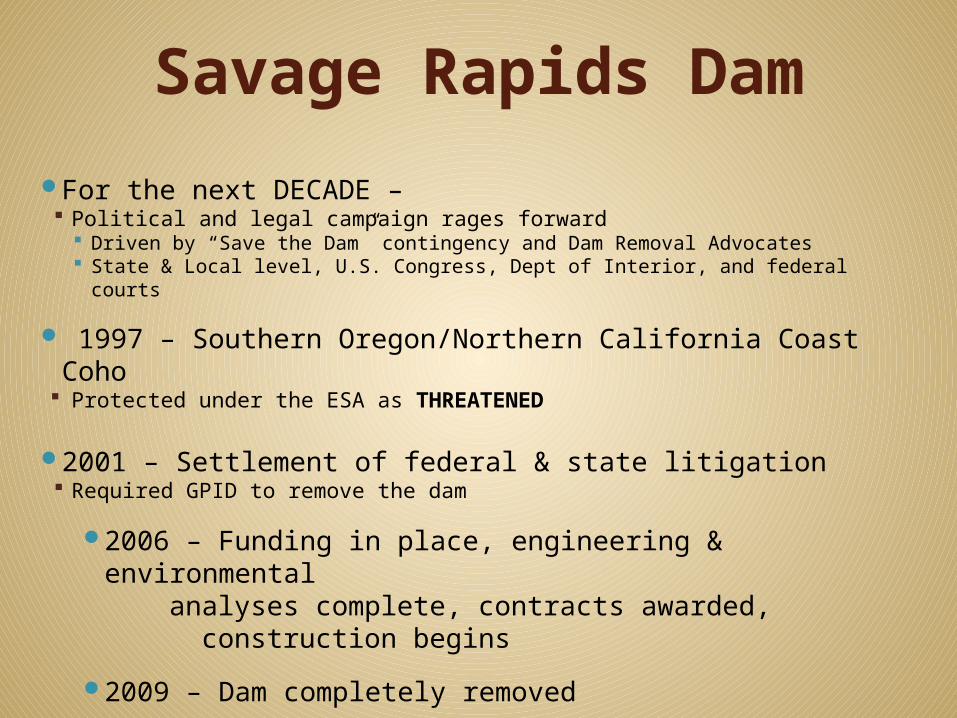
Savage Rapids Dam
For the next DECADE – Political and legal campaign rages forward
Driven by “Save the Dam” contingency and Dam Removal Advocates State & Local level, U.S. Congress, Dept of Interior, and federal courts
1997 – Southern Oregon/Northern California Coast Coho
Protected under the ESA as THREATENED
2001 – Settlement of federal & state litigation Required GPID to remove the dam
2006 – Funding in place, engineering & environmental
analyses complete, contracts awarded, construction begins
2009 – Dam completely removed


Gold Ray Dam
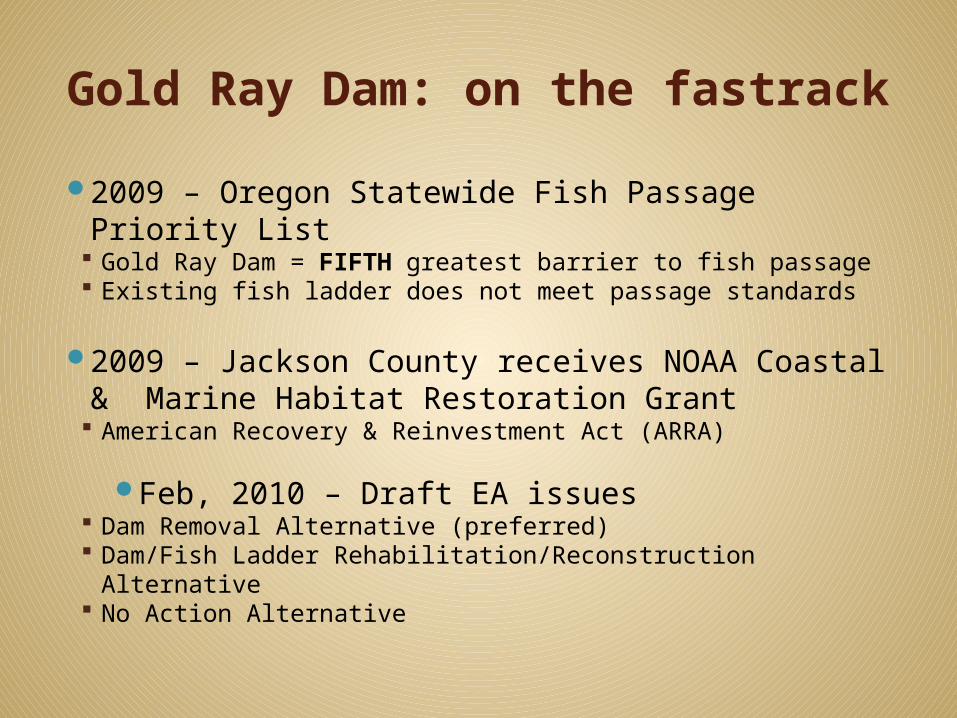
Gold Ray Dam: on the fastrack
2009 – Oregon Statewide Fish Passage Priority List
Gold Ray Dam = FIFTH greatest barrier to fish passage Existing fish ladder does not meet passage standards
2009 – Jackson County receives NOAA Coastal & Marine Habitat Restoration Grant
American Recovery & Reinvestment Act (ARRA)
Feb, 2010 – Draft EA issues Dam Removal Alternative (preferred) Dam/Fish Ladder Rehabilitation/Reconstruction Alternative No Action Alternative
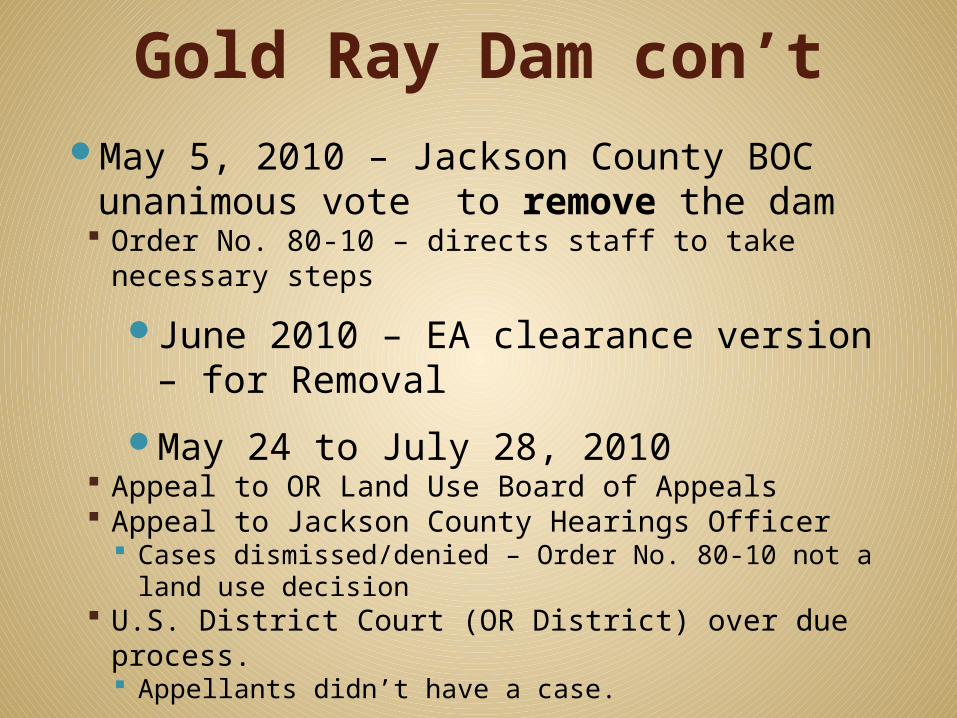
Gold Ray Dam con’tMay 5, 2010 – Jackson County BOC
unanimous vote to remove the dam Order No. 80-10 – directs staff to take necessary
steps
June 2010 – EA clearance version – for Removal
May 24 to July 28, 2010 Appeal to OR Land Use Board of Appeals Appeal to Jackson County Hearings Officer
Cases dismissed/denied – Order No. 80-10 not a land use decision
U.S. District Court (OR District) over due process. Appellants didn’t have a case.
Removal continues, completed Oct 2010

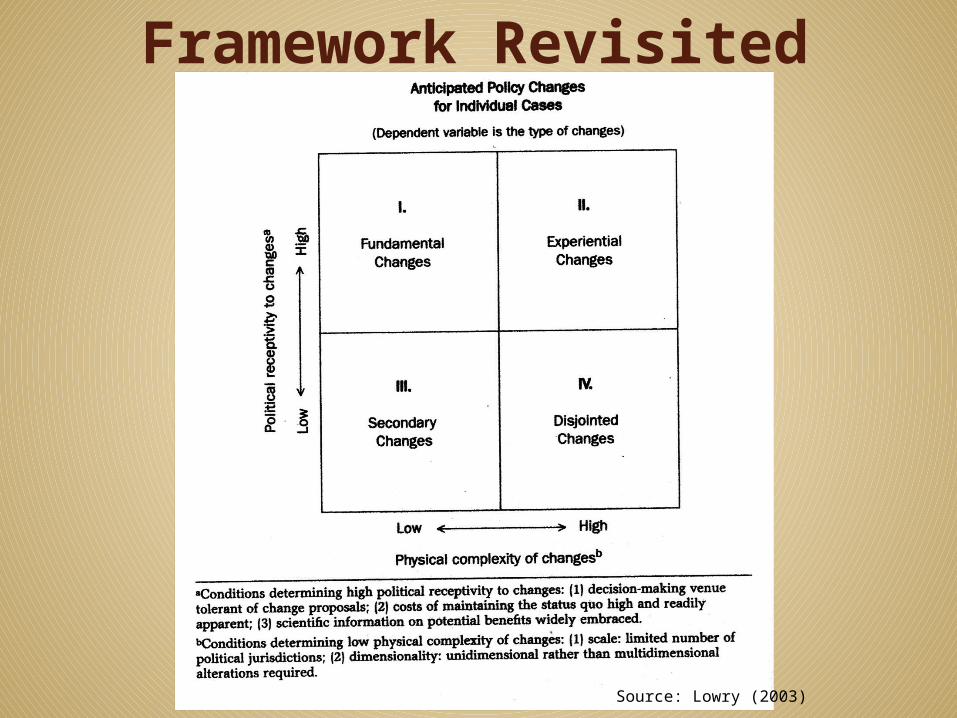
Framework Revisited
Source: Lowry (2003)
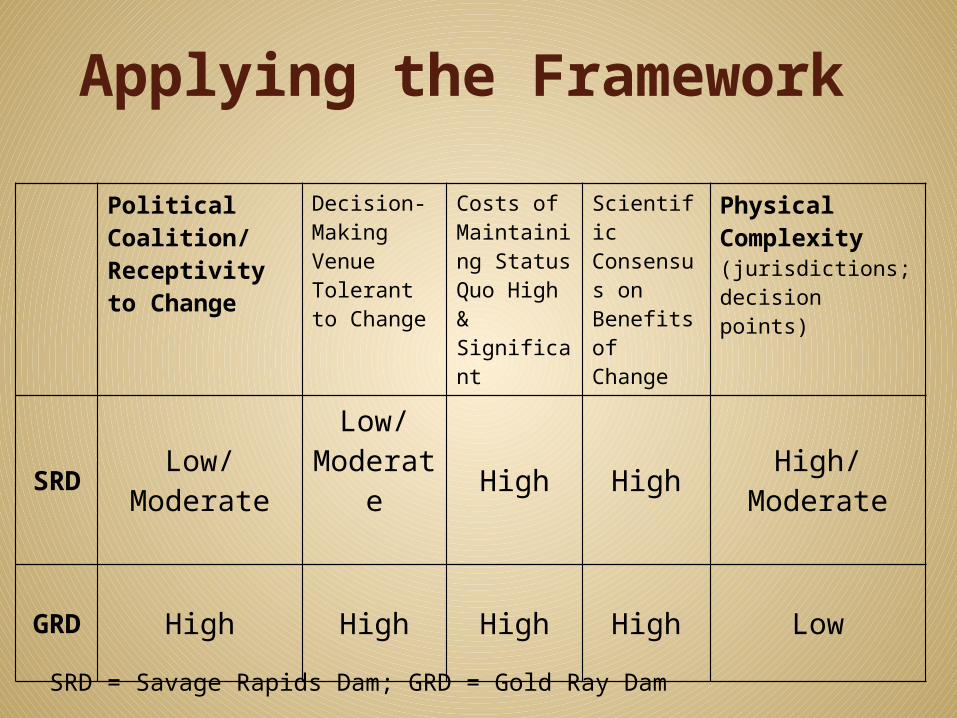
Applying the Framework
Political Coalition/Receptivity to Change
Decision-Making Venue Tolerant to Change
Costs of Maintaining Status Quo High & Significant
Scientific Consensus on Benefits of Change
Physical Complexity(jurisdictions; decision points)
SRDLow/
Moderate
Low/Moderat
e High High High/Moderate
GRD High High High High Low
SRD = Savage Rapids Dam; GRD = Gold Ray Dam

Concluding ThoughtsFundamental changes have occurred but Savage Rapids much more slowly than Gold Ray
WHY? Conditions were different Savage Rapids wasn’t always Fundamental; reflected
Disjointed Changes for a long time Gold Ray had more pro-change variables in place
Lowry’s Framework A way to categorize the process
Thank you!Questions?
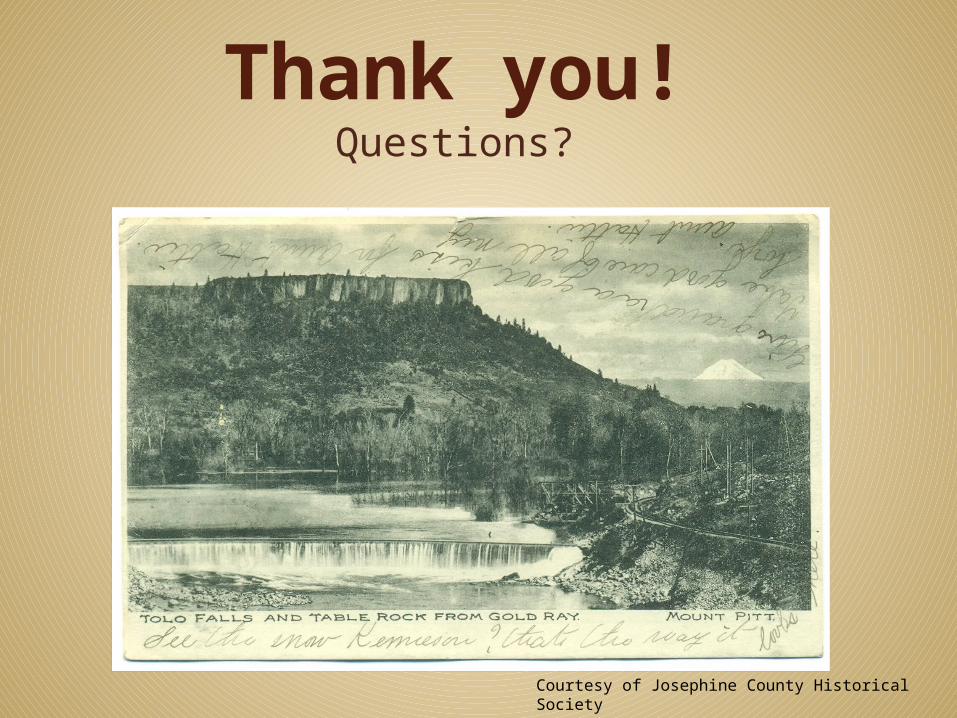
Courtesy of Josephine County Historical Society