Embed Size (px)
Citation preview

SURVEY REPORT
Wellness in the Workplace 2017

2 Wellness in the Workplace Survey 2017
About the sponsors
Southern Cross Health Society
Southern Cross Health Society opened for business in 1961. More than 50 years on the not-for-profit friendly society is New Zealand’s leading health insurer.
With over 820,000 members, the business funded more than 206,000 elective procedures, 726,000 GP visits and 428,000 specialist consultations in the financial year ended 30 June 2016 – paying claims in excess of $749 million.
BusinessNZ
BusinessNZ is New Zealand’s largest business representation group, providing a wide range of services for member businesses.
BusinessNZ undertakes analysis and advocacy on behalf of the wider business, manufacturing, importing and exporting sectors, making representation to Government, local government and other decision makers on issues important to business.
BusinessNZ regional organisations EMA, BusinessCentral, Canterbury Employers’ Chamber of Commerce and Otago Southland Employers’ Association provide services and advocacy on behalf of thousands of businesses in all parts of New Zealand.
Level 6, JacksonStone House 3-11 Hunter Street
Wellington 6011 New Zealand
P: 04 496 6555 E: [email protected]
www.businessnz.org.nz
Level 1, Ernst & Young Building 2 Takutai Square
Auckland 1010 New Zealand
P: 0800 800 181 E: [email protected]
www.southerncross.co.nz

Wellness in the Workplace Survey 2017 3
Contents
Foreword 4
Cut to the chase - a picture of health in the workplace 5
1. Background to the survey 7
2. Respondent demographics 8
3. Absence rates in 2016 10
4. Costs, drivers and factors around absence 12
5. Health insurance in the workplace 19
6. Stress and anxiety points 21
7. Relationship and communication with staff 25
8. Managing older workers 29

4 Wellness in the Workplace Survey 2017
ForewordNick Astwick - CEO (Southern Cross Health Society)Southern Cross Health Society is delighted to have again participated in this third, Wellness in the Workplace Survey with BusinessNZ.
It’s six years since the biennial survey first began, and trends and patterns are now emerging about the health and wellness of New Zealand workers and workplaces.
Stress and anxiety have continued to rise, large numbers of Kiwis continue turning up to work when sick, and three out of four businesses still aren’t geared to support older workers despite our ageing workforce.
For more than 50 years Southern Cross Health Society has looked after Kiwis by providing health insurance; supporting timely access to healthcare that helps people get back into life, and back to work.
But we also have a strong and increasing focus on health assurance; supporting individuals and businesses to protect and maintain their health. Only then can they contribute fully to family, community, work life and the economy.
With the average person spending around 90,000 hours at work during their lifetime, human capital is crucial to New Zealand’s success, and a happy, healthy, engaged workforce should be a key goal for all businesses.
I hope New Zealand organisations can use these latest survey findings as a basis for tweaking or introducing policies and procedures that positively benefit the health and wealth of their employees and themselves.
Kirk Hope- CEO (BusinessNZ)The health and wellbeing of everyone in the workplace is a key goal for all businesses.
Personal wellbeing is critical in its own right and is an important factor in every successful workplace.
Information on health, wellness, injury, illness and absence is important for employers, health professionals and others involved in workplace practice.
The Wellness in the Workplace Survey provides vital information and benchmarks towards the goal of healthier and safer workplaces.
This is the third survey in the Wellness in the Workplace series, providing information on changes in workplace practice since 2013.
BusinessNZ appreciates the co-operation of New Zealand businesses, business advocacy group EMA, and Southern Cross Healthcare Group in providing this valuable data towards the goal of healthy New Zealand workplaces.

Wellness in the Workplace Survey 2017 5
The Southern Cross Health Society - BusinessNZ Wellness in the Workplace Survey is designed to provide a picture of where New Zealanders stand in terms of health and wellbeing in the workplace. Given the strong focus on safety issues for employees due to recently established health and safety legislation, there has been relatively less attention placed on health issues for staff. One of the aims of this survey is to rebalance that attention.
Since this is the third Wellness in the Workplace Survey, trends are now forming that represent where New Zealand workplaces stand on key wellness information and views. The infographics on page 6 summarise the key findings from two perspectives.
First, Infographic 1 highlights the key table trends in terms of not only the 2016 dataset, but also areas where lines in the sand can be drawn from the survey’s time series, particularly around absence rates, and costs and drivers of absence. The survey’s broad dataset also provides a good handle on identifying key ‘pain points’, of which three stand out:
• The average days lost for manual workers is decreasing, for non-manual workers it is increasing. • On average more than 40% of staff are more likely to turn up to work when sick, despite clear communication
to stay home. • Overall stress/anxiety has consistently risen over the life of the survey.
Cut to the chase - a picture of health in the workplace
While identifying the key ‘pain points’ is one thing, providing practical advice and options to address any shortfalls is another. Therefore, Infographic 2 highlights five relatively simple steps businesses can take to improve workplace wellness.
These five steps are options that almost all businesses can undertake, and should help them on a path to improving staff wellbeing and minimising the cost of absence.
While there has been a
strong focus on safety issues for employees due to recent health and safety legislation,
relatively less attention has been placed on health
issues for staff

6 Wellness in the Workplace Survey 2017
Infographic 1: The big picture of health
Infographic 2: Improving workplace wellness

Wellness in the Workplace Survey 2017 7
This report outlines the main results of the third biennial Southern Cross Health Society – BusinessNZ Wellness in the Workplace survey.
The survey is intended to help employers benchmark absence levels among their own employees and identify how best to boost attendance and enhance employee health. It also provides policy makers with views on occupational health practice and absence in the workplace, information that has often been lacking in this country.
The survey also provides the business community with information on the overall health of their employees. This now has greater importance given recent health and safety legislation introduced in New Zealand.
The third survey was conducted between February and April 2017. Ten business associations including BusinessNZ regional organisations EMA, BusinessCentral, Canterbury Employers’ Chamber of Commerce and Otago Southland Employers’ Association, took part sending it out to a proportion of their members. In addition, BusinessNZ sent the questionnaire to a number of Major Company and Gold Group members, as well as a number of Government departments. Respondents were asked to report their absence data for the 12-month period 1 January to 31 December 2016, and to provide details of their policies and practices for managing employee attendance.
In total, 109 responses were received from entities across the private and public sectors, which was down from 113 responses in 2015. The respondent entities for 2017 employed 93,125 people, including 83,994 permanent staff. This was down from 116,218 people (including 97,837 permanent staff) in 2015, but similar
to 2013 of 97,116 and 89,955 respectively. The 2017 sample represented 4.97 percent of all employees in New Zealand, compared with 6.52 percent in 2015 and 5.68 percent in 20131.
Despite the dip in representation from previous years, the 2017 survey still represents a sizeable number of employees. By way of comparison, the most recent UK survey received 153 usable responses (representing 3.4 percent of all U.K. employees), despite its population being over 14 times larger than New Zealand’s.
Notes on survey comparisons
Although the surveys took place in 2013, 2015 and 2017, the fact that respondents were asked about their absence data for 2012, 2014 and 2016 means that for the purposes of this report, comparisons between the three surveys will state 2012, 2014 and 2016 as the comparison years.
1 Based on 1,709,000, 1,781,300 and 1,874,800 filled jobs during the June 2012, 2014 and 2016 quarters respectively (Quarterly Employment Survey, StatisticsNZ).
Purpose and overview
This is the third time the Southern Cross Health Society – BusinessNZ Wellness in the Workplace Survey has been carried out in New Zealand.
1. Background to the survey
Prior New Zealand ResearchThere are relatively few sources of information available on the number of days away from work due to illness and injury in a New Zealand context.
Previous studies have looked at aspects of absenteeism and wellbeing in the workplace but there has been no overall attempt to provide a more comprehensive assessment of New Zealand’s position with respect to the connections between absenteeism, sickness, costs and related workplace issues and practices.

8 Wellness in the Workplace Survey 2017
Figure 2 shows that the 2016 survey had a similar breakdown of employees to the New Zealand workforce. One point to note is that the proportion of large enterprises for 2016 (43 percent) was at its highest (33 percent in 2014 and 41 percent in 2012). This is an important point to note, given any overarching hourly or monetary values between the various time periods should be treated with caution.
Table 1 shows the average and median number of workers by size of business that responded to the survey. The average and median results for businesses with fewer than 50 staff was broadly similar to 2014. However, the exclusion of some very large employers for the 2016 results brought the average down for those with 100+ staff. In contrast, the overall median number of 60 doubled from 2014 as there were a smaller number of micro-small sized businesses in the 2016 dataset.
Employee Count Number Average Median
1-5 9 2.8 3
6-9 6 8.0 8.5
10-49 34 21.8 21
50-99 13 63.8 61
100+ 47 1947 880
Fewer than 50 50 17.3 15.5
Great than 50 59 1564 550
All 109 854 60.0
Respondents by workforce size
While New Zealand has a large proportion of micro-small sized enterprises, official data from StatisticsNZ show that employees are typically employed by relatively large-sized businesses (figure 1).
Therefore, given the make-up of New Zealand’s enterprises by size and the types of questions asked, there was a stronger targeting of medium to large enterprises in order to cover a higher proportion of employees.
Figure 1: New Zealand workforce: Proportion of employees by organisation size (Feb 2016)
Figure 2: Wellness Survey: Proportion of employees by organisation size (2016) Table 1: Average and median count of employees by
business size (2016)
2. Respondent demographics
1–511%
6–97%
10-4925%
50–9910%
100+47%
0-58% 6-9
6%
10-4931%
50-9912%
100+43%

Wellness in the Workplace Survey 2017 9
Respondents by industry
Figure 3 shows that those responding to the survey continue to come from a broad range of sectors in the economy (figure 3). The largest proportion was from the business, finance and property sectors, followed by the manufacturing and services sectors.
In addition to the 96 private sector enterprises taking part, 13 large public sector departments (up from nine in 2014) were also targeted, giving a strong proportion of public sector representation. The nine public sector departments represented 20,604 staff, down from 38,412 in 2014.
Respondents by region
As the questionnaire was again distributed by a number of regional and industry associations, responses continued to come from all parts of the country (figure 4).
Unsurprisingly, the greatest number of responses came from Auckland, although there was still good representation from the South Island, as well as the smaller regions.
Figure 3: Proportion of respondents by industry (2016)
Figure 4: Proportion of respondents by region (2016)
Ag, for, fish and
mining7%
Manufacturing17%
Elec, gas, water & construction
8%
Whole, retail, accommodation,
cafes & restaurant15%
Transport, storage &
communication5%
Business, finance & property
23%
Government administration
10%
Other service15%
Northland4%
Auckland17%
Waikato8%
Bay of Plenty5%
Gisborne3%
Hawkes Bay4%Taranaki
4%Manawatu-Wanganui5%
Wellington11%Marlborough
2%
Nelson-Tasman4%
West Coast3%
Canterbury11%
Otago14%
Southland5%

10 Wellness in the Workplace Survey 2017
• The average rate of absence in 2016 was 4.4 days per employee, compared with 4.7 days in 2014 and 4.5 days in 2012.
• Absence remains higher among manual employees in large enterprises, while non-manual workers in smaller enterprises experience the lowest level of absence.
• The difference in the average number of days off is now at its smallest (0.6 days) between manual and non-manual workers.
• When the average number of days lost is projected across the New Zealand workforce as a whole, over the last five years the country is shown to lose between 6.1 - 6.7 million working days per year.
• Average absence levels are consistently higher for public sector workers who, on average, are away 2-2.5 days more than private sector workers.
Time lost to absence averaged 4.4 days per employee in 2016
Employers were asked about the average number of days of absence per employee. Survey results in table 2 below show that overall absence was 4.4 days on average per employee. This was lower than in 2014 (4.7) and 2012 (4.5). It indicates that New Zealand’s overall absence rate is typically below five days, but above four.
As in previous years, if we were to project the number of days lost on average across the New Zealand workforce as a whole, it indicates that around 6.6 million days were lost to absence in 2016. Again, looking more broadly over the history of results for the survey, it shows that New Zealand loses 6.1 to 6.7 million working days a year due to absence.
New Zealand lost around
6.6 million working days
to absence in 2016
3. Absence rates in 2016
Total Private sector Public sector
Manual 4.6 4.5 5.5
Non-manual 4.0 3.6 6.4
All 4.4 4.1 6.5
Table 2: Absence levels: average days lost per employee

Wellness in the Workplace Survey 2017 11
Table 3: Absence by size of business (2016)
The manual/non-manual gap
The 2016 results continue the trend seen in previous surveys and offshore results whereby manual employees record higher average levels of absence than non-manual employees. This makes intuitive sense, given the nature of manual work, especially in jobs involving work such as lifting, and provides some explanation for the higher rate of absence.
The results for 2016 (table 2) show that for manual employees, the average number of days lost per employee was 4.6, compared with 4.0 days for non-manual employees.
This was the first time that absences by manual workers fell below five days, and the first time that absences reached four days for non-manual workers. It means the difference between manual and non-manual employees is at its smallest (0.6 days), compared with 1.2 and 1.5 days in 2012 and 2014 respectively. It is also much smaller than the most recent differential of 2.0 days for the latest UK findings.
Overall, results for 2012-2016 show contrasting outcomes between manual and non-manual workers. Average days of absence for non-manual workers have continued to increase, while the opposite has been the case for manual employees, leading to an ongoing convergence between the two main groups.
Average days of absence
Employee Count Total Manual Non-Manual
Fewer than 50 3.8 4.3 3.2
Great than 50 4.9 4.8 4.6
Ongoing private/public sector gap
The comparison between private and public sector absence levels in table 2 for 2016 again shows that the public sector (both central and local) has more absences than the private sector for manual, non-manual and permanent staff.
In terms of days, the overall difference between the two sectors has remained fairly consistent over the three time periods, with 2016 showing the largest differential of 2.4 days, compared with 2.3 and 2.1 for 2012 and 2014 respectively. This indicates that public sector workers are typically away from their jobs 2-2.5 days a year compared with those in the private sector.
Size of enterprise differentials
Table 3 shows average days of absence for manual/non-manual workers across those businesses with fewer or greater than 50 employees. The 2016 findings continue two consistent trends that have emerged since the survey began.
Those manual workers who work in large enterprises have the highest average amount of absence per year.
Those non-manual workers who are in enterprises with fewer than 50 employees have the lowest average level of absence.
As stated previously, employees in smaller enterprises are typically in a better position to be aware of how their absence may adversely affect both their work colleagues and the business as a whole. Therefore, efforts to reduce absence levels for manual workers in New Zealand’s larger enterprises would go some way to bringing overall absence levels down.
It should also be noted that the total average in table 3 does not include contract workers, though they are included for the breakdown of manual/non-manual workers. This means that the total average can end up slightly beyond the range of the manual/non-manual absence rate.
12 Wellness in the Workplace Survey 2017
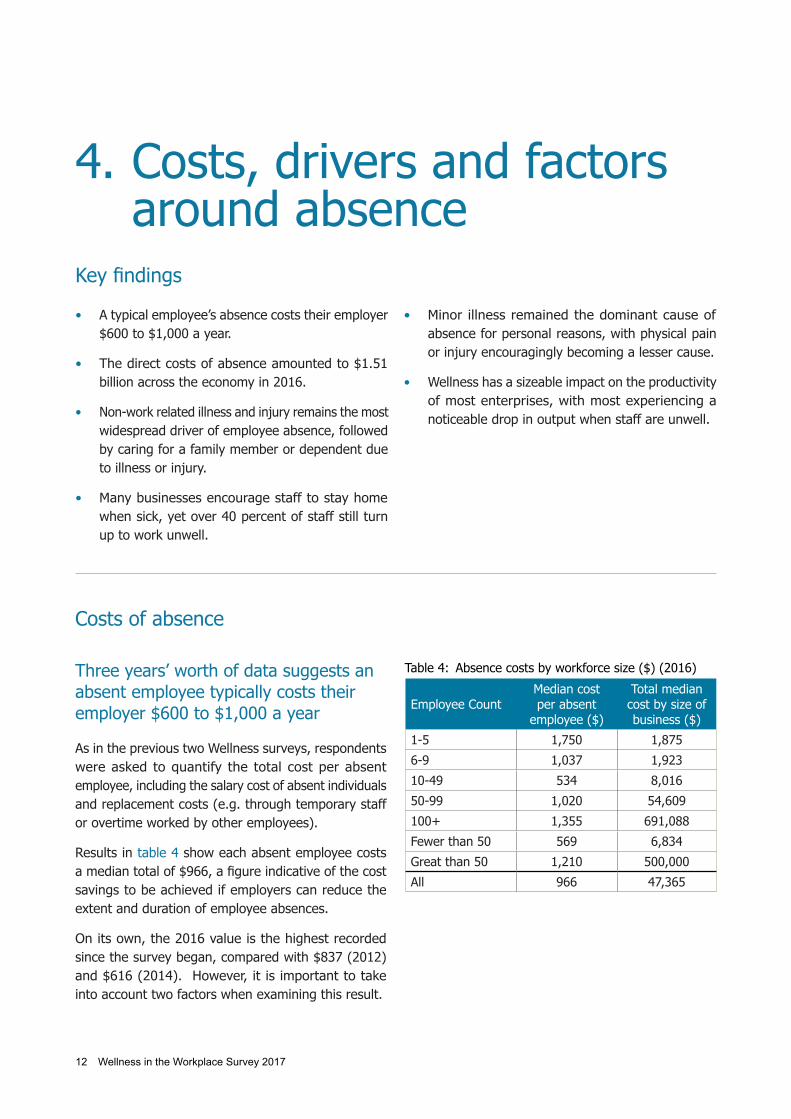
• A typical employee’s absence costs their employer $600 to $1,000 a year.
• The direct costs of absence amounted to $1.51 billion across the economy in 2016.
• Non-work related illness and injury remains the most widespread driver of employee absence, followed by caring for a family member or dependent due to illness or injury.
• Many businesses encourage staff to stay home when sick, yet over 40 percent of staff still turn up to work unwell.
• Minor illness remained the dominant cause of absence for personal reasons, with physical pain or injury encouragingly becoming a lesser cause.
• Wellness has a sizeable impact on the productivity of most enterprises, with most experiencing a noticeable drop in output when staff are unwell.
Key findings
4. Costs, drivers and factors around absence
Costs of absence
Three years’ worth of data suggests an absent employee typically costs their employer $600 to $1,000 a year
As in the previous two Wellness surveys, respondents were asked to quantify the total cost per absent employee, including the salary cost of absent individuals and replacement costs (e.g. through temporary staff or overtime worked by other employees).
Results in table 4 show each absent employee costs a median total of $966, a figure indicative of the cost savings to be achieved if employers can reduce the extent and duration of employee absences.
On its own, the 2016 value is the highest recorded since the survey began, compared with $837 (2012) and $616 (2014). However, it is important to take into account two factors when examining this result.
Employee CountMedian cost per absent
employee ($)
Total median cost by size of business ($)
1-5 1,750 1,875
6-9 1,037 1,923
10-49 534 8,016
50-99 1,020 54,609
100+ 1,355 691,088
Fewer than 50 569 6,834
Great than 50 1,210 500,000
All 966 47,365
Table 4: Absence costs by workforce size ($) (2016)

Wellness in the Workplace Survey 2017 13
First, changes in the proportion of responses from micro-small businesses means the sample of respondents’ quantifiable results needs to be interpreted with care. The results are indicative,
rather than substantive.
Also, three time periods worth of data over five years now provide a time series from which conclusions can be drawn about typical costs of absence: the median cost of an absent employee is around $600 to $1,000
a year.
Absence costs rise above 50 staff
A consistent finding in all Wellness surveys since 2013 has been higher absence costs in larger organisations. Enterprises with more than 50 staff consistently bear higher costs per absent worker than smaller enterprises. The 2016 survey found the average cost per absent employee was at least twice as high in larger than smaller enterprises. The overall cost of absences is also significantly greater in larger than smaller enterprises, as shown in table 4. Higher wages and higher absence levels in larger enterprises are key factors. Direct costs of absence amount to more than $1.51 billion a year.
As in previous years, extrapolating the direct costs of absence over the entire economy provides a macroeconomic picture of the level of direct costs New Zealand faces due to absence. For 2016, the average absence level per employee of 4.4 days amounts to a cost of around $1.51 billion for the total economy5. This compares with $1.45 billion for 2014 and $1.26 billion for 2012. In part, New Zealand’s increasing national cost is affected by an ever increasing workforce and a
5 Based on Quarterly Employment Survey (SNZ) average weekly earnings for FTEs at $1,142.15 and total employed of FTEs of 1,499,400. All figures were taken from the June quarter 2016 results.
natural rise in income. Any reduction or levelling out of that national cost would most likely come from a sustained decrease in average absence time lost.
Drivers of absence
Main causes of absence
Respondents were asked to list the three main causes of absence during 2016 for manual and non-manual employees.
Figure 5 shows that illness (non-work related) is the most common cause of absence. Caring for an unwell family member or dependent is the second most common cause of absence. Injury (non-work related) is the third most common cause of absence.
Differences between manual and non-manual occupations are evident, with non-manual occupations showing higher absences for illness and caring for others than manual occupations.
The 2016 results differ from previous years in that the top three reasons for absence are now more of a pronounced group compared with the rest. The next most common reason for absence - attending or waiting for medical appointments - has dipped by around five percentage points.
Overall, results from 2012 to 2016 have shown the top three reasons for absence unmoved in terms of ranking. These three reasons have also been more prominent for non-manual workers, while other reasons remain more relevant for manual workers.

14 Wellness in the Workplace Survey 2017
Figure 5: Main drivers of absence (2016)
Wellness in the Workplace Survey 2017 15
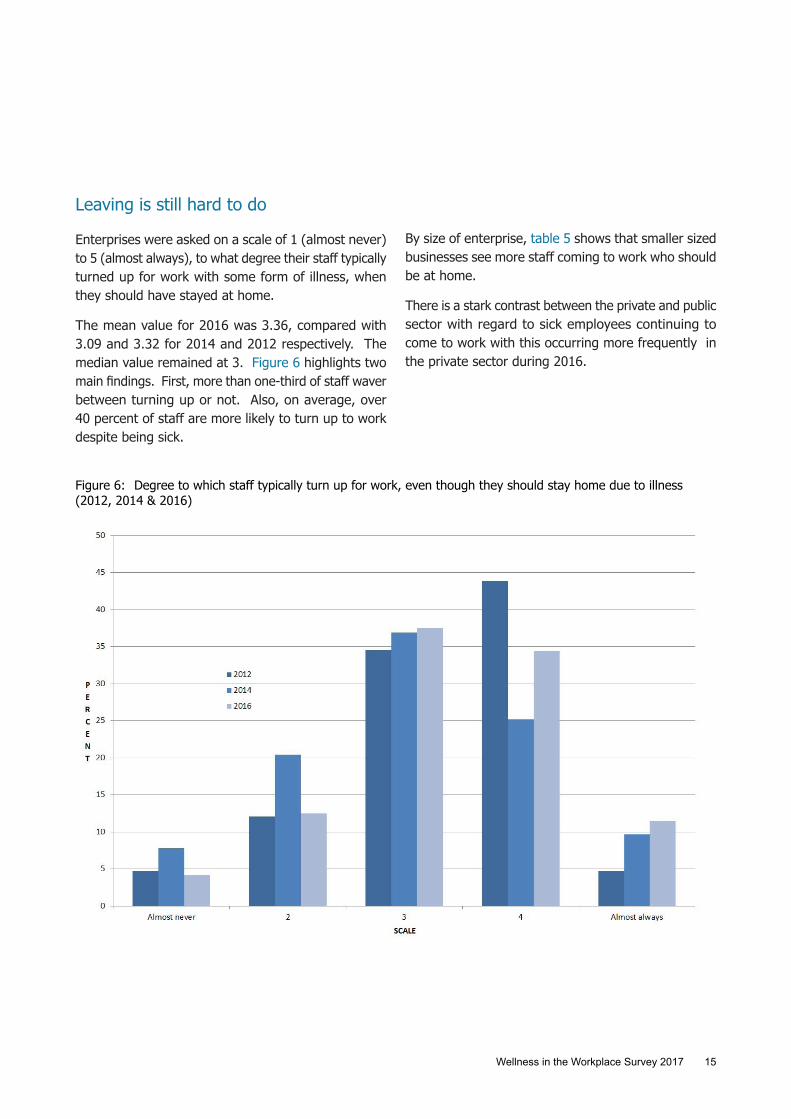
Leaving is still hard to do
Enterprises were asked on a scale of 1 (almost never) to 5 (almost always), to what degree their staff typically turned up for work with some form of illness, when they should have stayed at home.
The mean value for 2016 was 3.36, compared with 3.09 and 3.32 for 2014 and 2012 respectively. The median value remained at 3. Figure 6 highlights two main findings. First, more than one-third of staff waver between turning up or not. Also, on average, over 40 percent of staff are more likely to turn up to work despite being sick.
Figure 6: Degree to which staff typically turn up for work, even though they should stay home due to illness (2012, 2014 & 2016)
By size of enterprise, table 5 shows that smaller sized businesses see more staff coming to work who should be at home.
There is a stark contrast between the private and public sector with regard to sick employees continuing to come to work with this occurring more frequently in the private sector during 2016.

16 Wellness in the Workplace Survey 2017
A clear culture to stay home
Enterprises were again asked whether they thought the culture of their business encouraged employees to stay home when they were ill. Figure 7 shows the overall result for the three years observed, with some encouraging results. The average result again increased to 3.89, compared with 3.32 and 3.66 for 2012 and 2014 respectively. The rising average has been helped by those recording a value of 2 or lower continuing to drop, while those recording a value of 5 have consistently increased.
However, the question remains to what degree the culture of a workplace needs to change so that the roughly 40 percent of staff who turn up to work despite being ill actually heed the call to stay home.
Figure 7: Culture of respondent business encouraging employees to remain away from work if they are ill (2012, 2014 & 2016)
Size of enterprise Mean Median
1-5 3.5 3.50
6-9 3.5 4.00
10-49 3.38 3.00
50-99 3.09 3.00
100+ 3.38 3.00
<50 staff 3.43 4.00
>50 staff 3.31 3.00
Private sector 3.44 4.00
Public sector 2.82 3.00
All 3.36 3.00
Table 5: Degree to which staff typically turn up to work even though they should stay home with some form of illness (2016)
0
5
10
15
20
25
30
35
40
No, we have little ability to meetcustomer demands if staff are
away
2 3 4 Yes, very clear on this policy, if illthen stay at home
PERCENT
SCALE
2012
2014
2016
Wellness in the Workplace Survey 2017 17
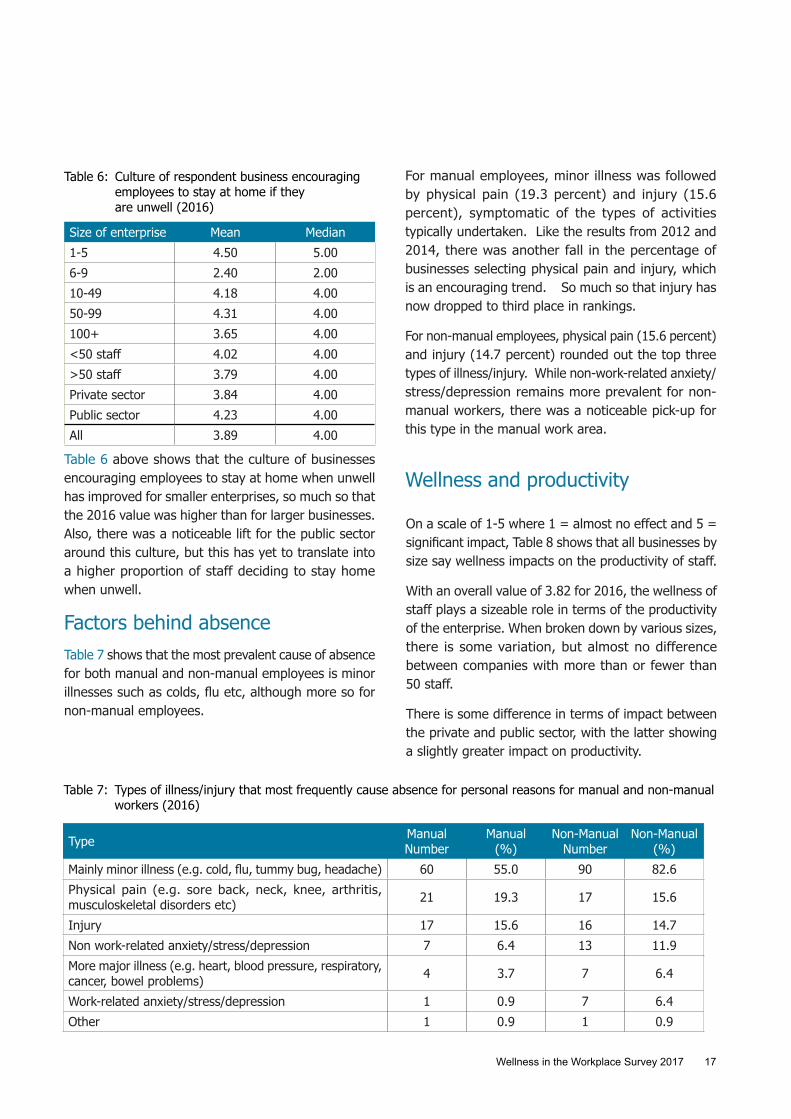
Table 6 above shows that the culture of businesses encouraging employees to stay at home when unwell has improved for smaller enterprises, so much so that the 2016 value was higher than for larger businesses. Also, there was a noticeable lift for the public sector around this culture, but this has yet to translate into a higher proportion of staff deciding to stay home when unwell.
Factors behind absenceTable 7 shows that the most prevalent cause of absence for both manual and non-manual employees is minor illnesses such as colds, flu etc, although more so for non-manual employees.
Size of enterprise Mean Median
1-5 4.50 5.00
6-9 2.40 2.00
10-49 4.18 4.00
50-99 4.31 4.00
100+ 3.65 4.00
<50 staff 4.02 4.00
>50 staff 3.79 4.00
Private sector 3.84 4.00
Public sector 4.23 4.00
All 3.89 4.00
Table 6: Culture of respondent business encouraging employees to stay at home if they are unwell (2016)
For manual employees, minor illness was followed by physical pain (19.3 percent) and injury (15.6 percent), symptomatic of the types of activities typically undertaken. Like the results from 2012 and 2014, there was another fall in the percentage of businesses selecting physical pain and injury, which is an encouraging trend. So much so that injury has now dropped to third place in rankings.
For non-manual employees, physical pain (15.6 percent) and injury (14.7 percent) rounded out the top three types of illness/injury. While non-work-related anxiety/stress/depression remains more prevalent for non-manual workers, there was a noticeable pick-up for this type in the manual work area.
Type Manual Number
Manual (%)
Non-Manual Number
Non-Manual (%)
Mainly minor illness (e.g. cold, flu, tummy bug, headache) 60 55.0 90 82.6
Physical pain (e.g. sore back, neck, knee, arthritis, musculoskeletal disorders etc) 21 19.3 17 15.6
Injury 17 15.6 16 14.7
Non work-related anxiety/stress/depression 7 6.4 13 11.9
More major illness (e.g. heart, blood pressure, respiratory, cancer, bowel problems) 4 3.7 7 6.4
Work-related anxiety/stress/depression 1 0.9 7 6.4
Other 1 0.9 1 0.9
Table 7: Types of illness/injury that most frequently cause absence for personal reasons for manual and non-manual workers (2016)
Wellness and productivity
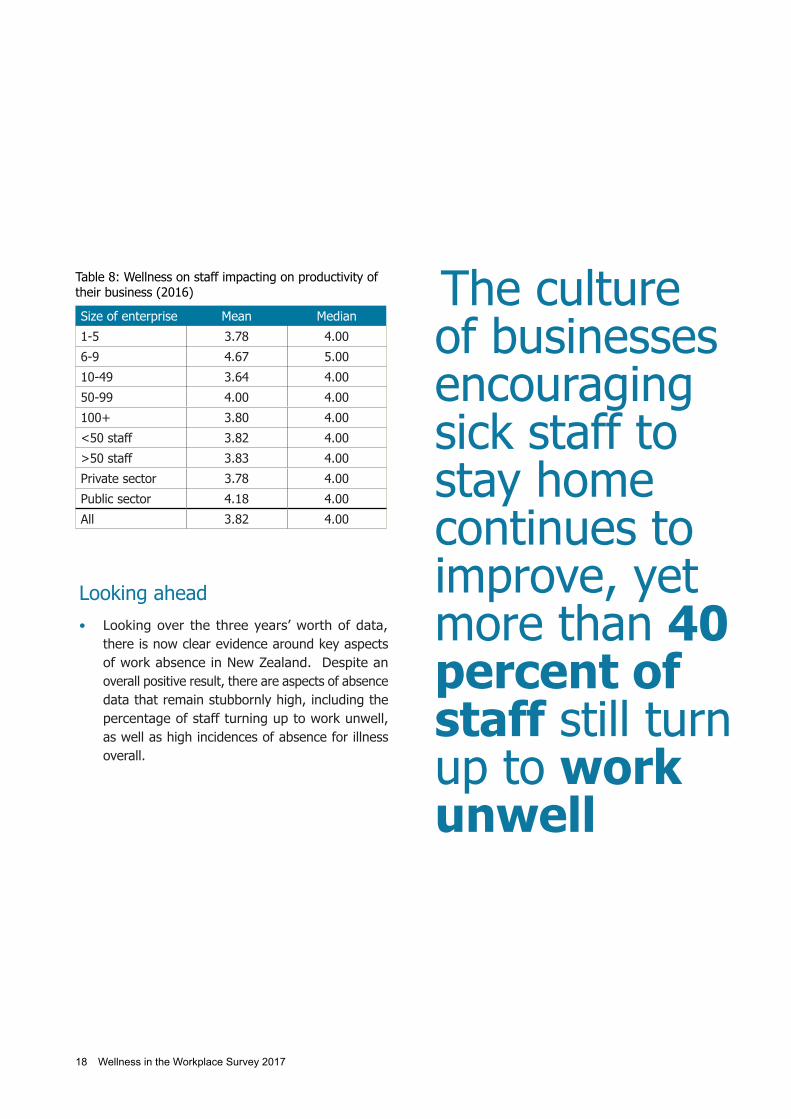
On a scale of 1-5 where 1 = almost no effect and 5 = significant impact, Table 8 shows that all businesses by size say wellness impacts on the productivity of staff.
With an overall value of 3.82 for 2016, the wellness of staff plays a sizeable role in terms of the productivity of the enterprise. When broken down by various sizes, there is some variation, but almost no difference between companies with more than or fewer than 50 staff.
There is some difference in terms of impact between the private and public sector, with the latter showing a slightly greater impact on productivity.
18 Wellness in the Workplace Survey 2017
Size of enterprise Mean Median
1-5 3.78 4.00
6-9 4.67 5.00
10-49 3.64 4.00
50-99 4.00 4.00
100+ 3.80 4.00
<50 staff 3.82 4.00
>50 staff 3.83 4.00
Private sector 3.78 4.00
Public sector 4.18 4.00
All 3.82 4.00
Table 8: Wellness on staff impacting on productivity of their business (2016) The culture
of businesses encouraging sick staff to stay home continues to improve, yet more than 40 percent of staff still turn up to work unwell
Looking ahead• Looking over the three years’ worth of data,
there is now clear evidence around key aspects of work absence in New Zealand. Despite an overall positive result, there are aspects of absence data that remain stubbornly high, including the percentage of staff turning up to work unwell, as well as high incidences of absence for illness overall.

Wellness in the Workplace Survey 2017 19
• Three years of data shows consistent differences between different sized enterprises in providing health insurance. Unlike larger enterprises, smaller businesses tend to view company provision of health insurance as unfeasible.
• Factors that would incentivise enterprises to provide health insurance include evidence of lower
Respondents were asked whether they provided health insurance for their staff. Table 9 shows overall 58.7 percent answering in the negative, which was down from 69.1 percent in 2014 and 65.3 percent in 2012.
Three years’ worth of data consistently shows significant differences by size of enterprise. Overall, larger businesses are more likely to have some form of health insurance for their staff, while micro-small businesses do not, and do not intend to, for the future.
Provision of health insurance – cost is key
Employers who do not provide health insurance were asked what would prompt them to consider providing it.
Key findings
5. Health insurance in the workplace
absenteeism and lower absenteeism-related costs.
• For companies that part-subsidise health insurance, the decision to increase employees’ health insurance coverage now depends more on cost than other factors.
1-5 6-9 10-49 50-99 100+ <50 >50 All
Yes, for all employees 11.1 0.0 11.8 15.4 44.7 10.0 39.0 25.7
Yes, but only a proportion of them 0.0 0.0 8.8 7.7 27.7 6.0 23.7 15.6
No, but would consider it in the future 22.2 16.7 17.6 7.7 6.4 18.0 6.8 11.9
No, we do not see it as something we would provide now or in the future 66.7 83.3 61.8 69.2 21.3 66.0 30.5 46.8
Table 9: Do you provide health insurance for your staff? (%) (2016)
Table 10 shows that reduced cost of health insurance and evidence that it reduces absenteeism would be the main factors. Evidence that health insurance assists in staff retention, and the removal of fringe benefit tax on employer-subsidised health insurance, were other key factors.
These four factors have remained the primary options for employers when considering health insurance for their employees since the survey began.

20 Wellness in the Workplace Survey 2017
Table 10: Factors that would cause an enterprise to consider providing health insurance for their employees
Number Percent
A decrease in the cost of health insurance 33 51.6
Evidence that it reduces absenteeism 33 51.6
Evidence that it assist in retaining staff due to perceived value as a benefit 30 46.9
Removal of FBT on employer-subsidised health insurance 29 45.3
Receiving more information and knowledge about health insurance 8 12.5
An approach by a health insurer to discuss policies, benefits and wellness programmes 5 7.8
Other 17 26.6
Table 11: Factors that would cause an enterprise to consider increasing health insurance coverage for their employees
Number Percent
A decrease in the cost of health insurance 16 35.6
Removal of FBT on employer-subsidised health insurance 9 20.0
Evidence that it assists in retaining staff due to perceived value as a benefit 9 20.0
Evidence that it reduces absenteeism 8 17.8
An approach by a health insurer to discuss policies, benefits and wellness programmes 1 2.2
Receiving more information and knowledge about health insurance 0 0.0
Other 3 6.7
Employers who part-subsidise health insurance were asked which factors would cause them to consider increasing coverage. Table 11 below shows a decrease in the cost of health insurance (35.6 percent) would be the main factor. This factor was second in 2012, first in 2014, and now holds a significant lead over other factors.
Looking ahead
• While there is a consistent difference between larger and smaller enterprises in provision of health insurance, enterprises of all sizes say the cost of health insurance is the main factor affecting wider uptake of health insurance across New Zealand.

Wellness in the Workplace Survey 2017 21
• Overall stress and anxiety levels for all enterprises remain more on the moderate than high side.
• But stress and anxiety have increased over the last two surveys.
• Workload has historically been the biggest issue for businesses with 50+ staff, but the 2016 dataset shows that this is also now the primary issue for businesses with fewer than 50 staff.
• Larger businesses are more likely to have stress identification processes in place, while businesses
Key findings
6. Stress, fatigue and anxiety points
with fewer than 50 staff are now more likely to have mechanisms for identifying employee stress.
• Large and small businesses are now far more likely to have some form of employee assistance programmes for stress.
Stress and fatigue in the workplace
Most western-style countries are becoming increasingly aware of health issues and the impact work and lifestyle choices can have on staff wellbeing and work performance. Many are looking for ways to deal with employee stress, fatigue and anxiety to minimise lost working time and improve overall wellbeing.
In New Zealand, recent changes to health and safety legislation have seen a fairly rapid change in mindset towards safeguarding staff safety. However, safeguarding staff health has been a lesser concern, even though this is an area where much can be done in a positive and low cost fashion, particularly around stress, fatigue and anxiety.
Table 12 shows on a scale of 1 (almost never stressful for most staff) to 5 (highly stressful for most staff) the current stress/anxiety levels amongst staff. Generally speaking, it is still the case that the larger the business the greater the stress level, although not by a significant extent.
One concerning aspect of the 2016 results was the increase in the overall score for stress/anxiety from 2.69 in 2014 to 3.02 in 2016. This is consistent with
results in table 13 that showed general stress/anxiety levels increasing during 2016 for those who provided a direction, with a net +22.9 percent of firms noting an increase, compared with +14.3 percent in 2014. For those with 50+ staff, the net result was +30.5 percent, more than double the +14.0 percent recorded for those with fewer than 50 staff.
Table 12: Rating general stress/anxiety levels amongst staff (2016)
Employee Count
Stress/anxiety levels amongst
staff(mean)
1-5 3.22
6-9 2.50
10-49 2.91
50-99 2.85
100+ 3.18
<50 2.94
>50 3.09
Private sector 3.01
Public sector 3.08
All 3.02

22 Wellness in the Workplace Survey 2017
Table 13: Change in direction of general stress levels staff experienced (2016)
Option All(%)
Fewer than 50
staff(%)
50+ staff(%)
Increased 31.2 24.0 37.3
Stayed roughly the same 56.9 64.0 50.8
Decreased 8.3 10.0 6.8
Net result +22.9 +14.0 +30.5
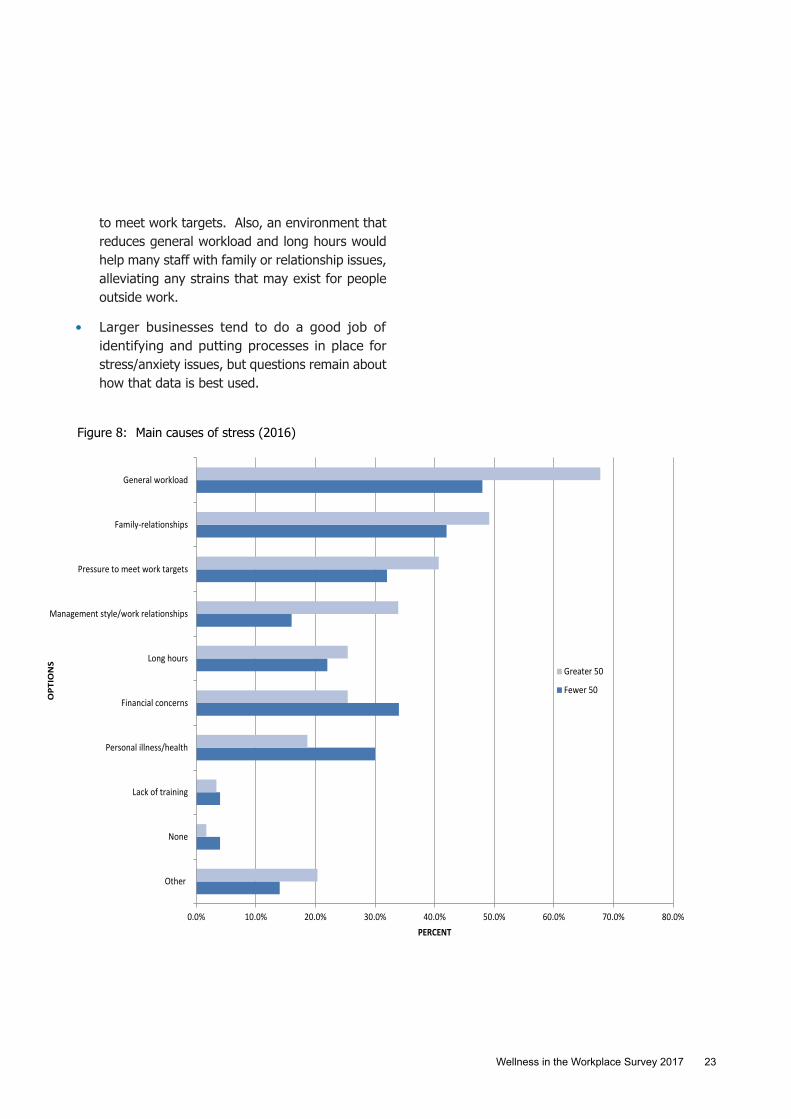
Figure 8 outlines the main causes of stress in the workplace. ‘General workload’ is the most stress/anxiety causing issue for businesses with 50+ staff. The 2016 dataset shows that this is also now the primary issue for those with fewer than 50 staff (compared with ‘family relationships’ in 2014). Beyond that, the order of issues relating to stress/fatigue has shown some movement since 2014, with a noticeable change in the proportion of smaller enterprises recording ‘long hours’, which rose from 8.1 percent in 2014 to 22 percent in 2016.
Figure 9 outlines the main practices businesses use as part of their stress identification process. As in 2014, the results show, overall, larger businesses are more likely to have identification processes in place, given their ability to implement these types of structures. Also, key staff in larger organisations are less able to have a close relationship with a larger number of workers, so more formal processes are required.
However, in comparison with 2014, the 2016 data set shows two positive differences. First, the proportion of enterprises with more than 50 staff that have undertaken ‘training for managers to identify and manage stress’ increased from 37.3 percent to 55.9 percent. Also, for those with fewer than 50 staff, the proportion of enterprises that did not have any practices to identify stress decreased from 53.2 percent in 2014 to 36.0 percent in 2016.
In relation to the stress management processes in figure 10, it is interesting to note changes in options chosen by the two groups identified. For those with more than 50 staff, ‘employee assistance programmes’ were the key option in 2016, overtaking ‘flexible hours’ from 2014. Also, those with fewer than 50 staff are now more likely to have some form of ‘employee assistance programmes’, rising from 14.5 percent in 2014 to 32 percent in 2016.
In terms of public/private comparisons, the fact that all Government agencies involved in the survey have more than 50 staff means the way they identify and manage stress tends to be similar to those in the private sector with 50+ staff. However, some of the options were more pronounced with the public sector, such as ‘employee assistance programmes’ and ‘flexible hours’, which were both at 92.3 percent.
Looking ahead
• The results show that in broad terms, larger businesses have remained more stressful environments, although the gap is closing. Also, it is concerning that overall stress/anxiety continues to rise.
• Across enterprises, workload is now the key determinant for stress, while longer working hours are also on the rise for smaller enterprises.
• As discussed in the previous report, any steps towards reducing stress/anxiety among staff will struggle to make headway if net stress levels continue to show a sizeable increase year-on-year.
• The interrelationship of many of the causes of stress needs to be examined. For instance, an emphasis on managing workloads would be the best place to start, as it would also help mitigate the issue of long hours worked and the pressure
Wellness in the Workplace Survey 2017 23
to meet work targets. Also, an environment that reduces general workload and long hours would help many staff with family or relationship issues, alleviating any strains that may exist for people outside work.
• Larger businesses tend to do a good job of identifying and putting processes in place for stress/anxiety issues, but questions remain about how that data is best used.
Figure 8: Main causes of stress (2016)
0.0% 10.0% 20.0% 30.0% 40.0% 50.0% 60.0% 70.0% 80.0%
Other
None
Lack of training
Personal illness/health
Financial concerns
Long hours
Management style/work relationships
Pressure to meet work targets
Family-relationships
General workload
PERCENT
OPT
ION
S
Greater 50
Fewer 50

24 Wellness in the Workplace Survey 2017
Figure 9: Practices undertaken as part of stress identification (2016)
Figure 10: Stress management processes (2016)
0.0% 10.0% 20.0% 30.0% 40.0% 50.0% 60.0% 70.0%
None
Other
Stress/fatigue audits
Risk assessment
Training for managers to identify and manage stress
Staff surveys
PERCENT
OPT
ION
S
Greater 50
Fewer 50

Wellness in the Workplace Survey 2017 25
7. Relationships and communication with staff
• Only around one-fifth of enterprises take a formal approach to gathering non-work related data.
• Even when data is collected, most businesses are not as proactive as they could be in terms of using that information to improve the wellbeing of staff.
• Enterprises are increasingly more likely than not to have a family-friendly workplace, although further improvements could be made.
Key findings• Flexible hours remains the most prevalent family-
friendly policy for all enterprises.
• Flu vaccinations remain the lead benefit for improving the wellbeing of staff in larger enterprises. Smaller enterprises see more value in education/training and mechanisms for staff to input ideas.
Data to improve wellbeing
Enterprises typically collect a variety of work-related data on their staff, including bank account details, home address and emergency contact numbers. However, whether they have a clearly defined and coordinated approach to collecting non-work related information is more questionable.
Table 14 shows that, as in 2014, only around one-fifth of enterprises take a formal approach to gathering non-work related data. When broken down by sub-sectors, unsurprisingly larger enterprises are more likely to have a plan in place, while overall the private sector is more likely than the public sector to take a formal approach to such information. However, the
difference is not significant.
Of those indicating at least some formal approach to collecting non-work information on staff, table 15 shows that on a scale of 1-5 where 5 is ‘very proactive ‘and 1 is ‘hardly ever used’, there was a slight overall improvement from 2014 in terms of enterprises’ constructive use of data. However, most enterprises could do more in using non-work data to improve the wellbeing of their staff.
Type Yes (%)
Sometimes(%)
No (%)
Don’t know (%)
<50 Staff 16.0 36.0 48.0 0.0
>50 Staff 28.8 45.8 22.0 3.4
Private sector 21.9 42.7 34.4 1.0
Public sector 30.8 30.8 30.8 7.7
All 22.9 41.3 33.9 1.8
Table 14: Enterprises having a clearly defined and coordinated approach to collecting non-work related information of staff (2016)
Table 15: How proactive are those that collect non-work related data to improve the wellbeing of their staff (2016)
Type Mean Median
<50 Staff 3.27 3.00
>50 Staff 2.88 3.00
Private sector 3.05 3.00
Public sector 2.88 3.00
All 3.03 3.00
Both the 2014 and 2016 data shows that despite larger enterprises being more likely to collect such data, those with fewer than 50 staff are more likely to use that information.

26 Wellness in the Workplace Survey 2017
Table 16: Extent to which enterprise ensures it has a family-friendly workplace for staff (2016)
Type Mean Median
<50 Staff 3.94 4.00
>50 Staff 3.66 4.00
Private sector 3.74 4.00
Public sector 4.08 4.00
All 3.79 4.00
We are family
Given the increasing trend to recognise ‘life balance’, with a holistic approach to work and non-work life, having a family-friendly workplace is increasingly becoming a way to demonstrate that staff are valued, and is being used as a retention tool.
On a scale of 1 (never) to 5 (always), enterprises were asked whether their workplace has a family-friendly workplace for staff?
Table 16 shows that the overall mean value was 3.79, slightly up on the 3.68 recorded in 2016. At the very least, this indicates that enterprises are increasingly more likely to have a family-friendly workplace. When broken down into individual responses, just over a quarter (25.2 percent) of respondents did not have a view either way (i.e. a score of 3), but almost 64 percent responded with a score indicating effort towards a family-friendly workplace. This outcome was similar to 2014.
Flexible options
Figure 11 shows that ‘flexible hours’ was again the most common approach to implementing family friendly policies. However, unlike the 2014 findings, for 2016 a ‘transitioned return to work’ moved into second spot for larger enterprises, while remaining in third spot for smaller sized businesses.
Larger organisations are more likely than smaller ones to use other options alongside ‘flexible hours’ as part of their family friendly policies.
In terms of general benefits enterprises provide to improve the wellbeing of their staff, figure 12 shows similar patterns to previous years, with placings for the top 4-5 options generally the same as 2014. However, the 2016 survey for the first time included the option of ‘mechanism for staff to provide input/ideas’. This was a separate question in the 2014 survey, and showed around 57 percent of organisations provide such mechanisms. Responses to this option for 2016 were similar for larger and smaller organisations, and it was the joint highest option, along with education/training, for organisations with fewer than 50 staff.

Wellness in the Workplace Survey 2017 27
Figure 11: Family-friendly policies offered (2016)
Figure 12: Benefits provided to improve the wellbeing of staff (2016)
0.0% 10.0% 20.0% 30.0% 40.0% 50.0% 60.0% 70.0% 80.0% 90.0%
None
Other
Onsite crèche
Bring your kids to work days
Breastfeeding area
Working from home
Transitioned return to work
Flexible hours
PERCENT
OPTIONS
Greater 50
Fewer 50

28 Wellness in the Workplace Survey 2017
Looking ahead
• Results have consistently shown that at the very least, 65 percent of New Zealand enterprises occasionally take a formal approach to collecting non-work related information on their staff. While this is a good first step to find out ways to improve wellbeing, many organisations may not be doing as much as they could to use the information they collect, despite the fact that this is a relatively simple and straightforward way to begin assisting employees.
• The slight improvement in enterprises taking a family-friendly approach to their workplace is welcomed, including the fact that 28 percent say they always ensure this is considered. There is however some way to go before the majority of organisations can be said to be truly family-friendly.
• Providing flu vaccinations is a relatively inexpensive way of preventing significant time out of the workforce. Larger businesses are twice as likely to offer this as smaller businesses. There is also the opportunity for other possibilities to be explored, including healthy food options, wellness programmes and, where practical, options around working from home/flexible hours.
Even when data is collected, most businesses are not as proactive as they could be in using that information to improve staff wellbeing

Wellness in the Workplace Survey 2017 29
• Three out of four businesses still do not have policies or arrangements in place for older workers, although uptake has improved since the survey began.
• Of those that do have policies/arrangements in place, some change to hours of work remains the most common option, followed by discussions and
The first Wellness survey showed that the vast majority of businesses in New Zealand did not have policies or arrangements in place for older workers. The 2014 survey then included a section dedicated to the issue of older workers, again repeated in 2016.
The 2016 survey introduced a new question on the age at which staff typically retire. The results in figure 13 show most retirements occur in the 65-67 age group, which is expected given the official age of receiving New Zealand Superannuation is 65.
8. Managing older workers
Table 17 shows that the number of enterprises with policies or arrangements for older workers has improved since 2012. By 2014 approximately one fifth of organisations had policies or arrangements in place for older workers. By 2016 a quarter of businesses surveyed had policies/arrangements in place.
Figure 14 shows that a change to hours of work is the most common option employed, either reduced or flexible hours. After that, information packs about retirement are the most common option for businesses with fewer than 50 staff, while larger businesses are more likely to initiate discussions around retirement plans.
The 2016 survey also asked what would be the most helpful options to help businesses better manage an older workforce. Figure 15 shows some contrasting results between larger and smaller businesses. Those with 50+ staff believe a toolbox for employers on how to manage older staff (67.8 percent) would be of most benefit. However, this option stood at 36.0 percent for those with fewer than 50 staff, similar to the proportion that believed none of these options would help.
information around retirement.
• Some form of toolbox for employers was the most popular factor in terms of helping businesses manage their older workers.
Year Yes (%)
No (%)
2016 25.2 74.8
2014 20.4 79.6
2012 12.6 87.4
Table 17: Policies or arrangements in place for older workers (2012-16)
In larger businesses (more than 50 staff), most retirements occur in the 65-67 age range. This contrasts with smaller businesses (fewer than 50 staff) where less than 40 percent of retirements occur in the 65-67 age range. The survey shows many more employees continue working into their 70s and beyond in smaller enterprises, compared with larger enterprises.
There would be a few reasons for the difference, including family members more likely to be part of smaller enterprises, as well as a greater likelihood of social connections across all levels of staff that encourage them to stay longer.

30 Wellness in the Workplace Survey 2017
Figure 13: Age staff typically retire (2016)
Figure 14: Policies businesses offer in terms of assisting older workers (2016)

Wellness in the Workplace Survey 2017 31
Figure 15: Options to help business better manage older workforce (2016)
Looking ahead • With at least a third of organisations employing
staff older than 65, many need to ensure they have the right policies and practices in place to ensure they can benefit from this growing pool of knowledge and experience.
• While the proportion of businesses that have policies in place for older workers continues to rise, 75 percent of businesses still do not. Establishing even rudimentary policies as a starting point can ensure businesses do not prematurely lose experience and skill when people consider retirement.
• A toolbox of ideas and suggested practices is a clear cut way in which the business community can ensure businesses better manage an older workforce. This can be delivered through business groups, or as a joint project with Government.

32 Wellness in the Workplace Survey 2017
For further information on this survey contact:
Stephen SummersEconomist
BusinessNZ
Level 6, JacksonStone House 3-11 Hunter Street
Wellington 6011 New Zealand
P: 04 496 6555F: 04 496 6550
[email protected] www.businessnz.org.nz
© Copyright BusinessNZ 2017