Embed Size (px)
Citation preview

Introduction Facing the increasing pressure offuel crisis, vehicle lightweighting isone of the most effective remedies toimprove fuel efficiency and cut emis-sions in the automotive industry. Re-duction in weight is usually achievedby using lightweight materials (e.g.,aluminum) or by optimization ofstructural design throughout the ve-hicle structures. For now, most of thevehicle outer panels are still made ofmild steel with the thickness in therange of 0.65 ~ 0.8 mm (Ref. 1).Analyses indicated that if these pan-
els can be substituted by advancedhigh-strength steel sheets whosethicknesses are below 0.6 or 0.5 mm,significant weight reduction could beachieved (Ref. 1). Moreover, the ap-plication of ultra-thin steels mighthave some advantages over the use ofaluminum in terms of manufacturingcost (Refs. 1–3). Resistance spot welding (RSW) hasbeen the predominant joining methodfor vehicle assembly due to its robust-ness and low cost (Refs. 4, 5). A litera-ture survey indicated that althoughextensive studies have been reportedfor RSW of steel thicker than 0.65mm, there was limited information
about RSW of ultra-thin high-strengthsteels (< 0.5 mm) for automotive ap-plications. A few of the early articleshave reported some analytical resultsto investigate the effect of steel thick-ness on heat transfer in resistancespot welding. Gould (Ref. 6) has stud-ied the weld development of threegauges of an AISI 1008 steel (nominal-ly 0.5, 1, and 1.5 mm) and concludedthat steel gauge strongly affected theratio of heat flow into the electrodesand surrounding sheet. Decreasingsteel gauge led to an increasing importance of heat loss through theelectrode. Eagar (Ref. 7) reported that thedecrease in steel thickness led to low-er resistance of the substrates, andthus the contact resistance at thefaying interfaces accounted for alarger proportion of the total jouleheat generation. As the sheet metalbecame thinner, the temperature gra-dients in the sheet became steeperand a greater portion of the totalheat was lost into the electrodes,which may increase the electrode tiptemperature and cause a significantreduction in electrode life. It was alsoreported that the cooling rate in theRSW process showed a strong gaugeeffect (Refs. 8, 9). The cooling ratewas significantly reduced as theworkpiece thickness became thick,ranging from over 100,000°C/s forgauges less than 0.5 mm to roughly2000°C/s at a 2.0-mm gauge. More-over, the combination of the varia-tions in heat generation and dissipa-
WELDING RESEARCH
FEBRUARY 2017 / WELDING JOURNAL 71-s
Weld Formation Characteristics in Resistance SpotWelding of UltraThin Steel
High welding current and short welding time were found to produce the best combination of strength and weld size
BY Y. Y. ZHAO, Y. S. ZHANG, AND PEI-CHUNG WANG
ABSTRACT Recent trends toward economically fabricating lightweight vehicles while ensuringstructural performance makes thin (e.g., < 0.5 mm) steels increasingly attractive in theautomotive industry. In the present study, the formation of the weld during resistancespot welding (RSW) of a 0.35mmthick 600 MPa grade dualphase steel wasinvestigated. The results indicated the weld initiated early and grew to reach a maximumsize of 2.8 mm within a welding time of 40 ms, and then its size remained virtuallyunchanged, and gradually exhibited a unique “doublelayer” feature. Furthermore, themechanism for the formation of weld layering was modeled from the perspective of temperature evolution. Modeling results indicated the temperature weld zone increased initially but then surprisingly decreased for the remaining welding process, and eventuallyresulted in a “doublelayer” weld. It was found that the strength of the weld increasedwith the weld size and was improved little with the occurrence of the weld layering.Therefore, the use of high welding current and short welding time is preferable to joinultrathin steel.
KEYWORDS • Resistance Spot Welding (RSW) • UltraThin Steel • Weld Formation • Temperature History
Y. Y. ZHAO and Y. S. ZHANG ([email protected]) are with Shanghai Key Laboratory of Digital Manufacture for Thinwalled Structures, Shanghai Jiao Tong University, Shanghai, China. PEICHUNG WANG is with the Manufacturing Systems Research Lab, General MotorsResearch & Development Center, Warren, Mich.
Zhao 2-17_Layout 1 1/13/17 1:54 PM Page 71

tion due to the variation of work-piece thickness would eventually leadto changes in weld nugget shape(Refs. 10, 11). For thin sheet, themajority of weld nugget growth oc-curred rapidly after initial melting,with weld nugget shape being gener-ally elliptical. The weld nugget of thethick sheet showed a more rectangu-lar or square shape. Although thesequalitative analyses provided insight-ful information regarding the effectof steel gauge on heat transfer andweld characteristics in resistancewelding, quantitative and experimen-tal results related to the weld growthand microstructural evolution in re-sistance spot welding of ultra-thinsteels are still lacking. Most of the published studies so fardealing with joining very thin metalsheets (thinner than 0.2–0.5 mm) fo-cused primarily on fabrication of elec-tronic and medical devices (Refs.12–18). The workpieces used in thesestudies were mostly similar or dissimi-lar combinations of nonferrous met-als. Moreover, this kind of RSW is usu-ally termed small scale RSW (SSRSW)compared to the large scale RSW (LSR-SW) used for vehicle assembly. Com-pared with LSRSW, the welding pa-rameters and energy input used inSSRSW are not in the same order ofmagnitude (Ref. 19). Due to the differ-ences in welding equipment and mate-rials, the published results on SSRSWprovided limited guidance for RSW ofultra-thin high-strength steel intend-ed for automotive applications. The present study was undertakento understand the weld growth char-acteristics during LSRSW of ultra-thin steel sheets. A series of experi-ments were conducted to study theweld initiation and growth behavior.Microstructures and weld formationmechanism were analyzed and thecorrelation between the jointstrength and weld size was investigat-ed. Due to the difficulty of measuringthe temperature at the faying inter-faces during resistance welding, finiteelement model coupled with thermal-electric-structural analysis was adopt-ed to estimate the temperature histo-ry and explain the resultant weld for-mation process. Finally, the best prac-tice for LSRSW of ultra-thin steel isdiscussed.
Experimental ProceduresMaterials
Bare 0.35-mm-thick dual-phase steel(DP600) was used in this study. Since0.35-mm-thick DP600 steel is not readi-ly available from the steel suppliers, thematerials employed in this study wereprepared by ourselves. The material wepurchased is a 0.8-mm-thick DP600steel of the Docol® series from SSAB(Ref. 20). Per manufacturers’ data sheet,chemical compositions and typical me-chanical properties of the as-received0.8-mm-thick steel are listed in Table 1.These as-received sheets were machinedinto 30-mm wide strips to fit the width
of the roller and cold-rolled to 0.35 mmthick. Figure 1A and B show the mi-crostructures of the as-received andcold-rolled steels, respectively. Referringto Fig. 1, ferrite and martensite werepresent in the cold-rolled DP600 steel(Ref. 21). The grains were elongatedalong the rolling direction and the mi-crohardness of the cold-rolled DP600increased from 250 to 330 HV afterrolling.
Sample Fabrication
Resistance spot welding of 0.35-mm-thick DP600 steel was performedusing a medium-frequency direct cur-
WELDING RESEARCH
WELDING JOURNAL / FEBRUARY 2017, VOL. 9672-s
Fig. 1 — Microstructures. A — Asreceived 0.8mmthick DP600 steel; B — coldrolled0.35mmthick DP600 steel.
Fig. 2 — Geometrical model and boundary condition for modeling of the resistance welding process.
Table 1 — Chemical Composition in wt% and Mechanical Properties of DP600 Steel
Chemical Composition in wt% Mechanical Properties
Steel Yield Tensile Elongation C Si Mn P S Al Nb Strength Strength DP600 0.1 0.2 0.8 0.01 0.002 0.04 0.015 350 MPa 600 MPa 16%
A B
Zhao 2-17_Layout 1 1/12/17 3:09 PM Page 72
rent (MFDC) welding machine with aservo actuator. The joints were madeusing the coupons approximately 100mm long and 30 mm wide with anoverlap distance of 40 mm. Electrodeswith a 5.0-mm-diameter flat tip endmade of copper-chromium alloy of Re-sistance Welder Manufacturers Associ-ation (RWMA) class II were used, thecomposition of which is Cu-0.2Zr-0.5Cr-0.01Al (wt-%). Unless otherwisespecified, all resistance welding testingwas performed using the parameterslisted in Table 2, which had been de-
termined based on a series of prelimi-nary tests.
Weld Initiation and Growth
The purpose of these experimentswas to understand the weld initiationand growth process. Resistance spotwelding of 0.35-mm-thick DP600 steelwas performed with a range of weldingtime (20–160 ms) at an increment of20 ms. Other than the welding time,all other welding parameters were
fixed at the values given in Table 2,and these included a squeezing time of200 ms (before the current was ap-plied) and a holding time of 100 ms af-ter the welding current was shut off.Three replicas were performed at eachwelding condition.
Dynamic ResistanceMeasurement
The variation of dynamic resist-ance was measured to facilitate theunderstanding of the characteristicsof heat generation during the weld-ing process. Test results were collect-ed by the welding monitor (MM-370A) from MIYACHI® (Ref. 22).Three replicates were prepared forthe measurement of dynamic resist-ance. A detailed description of theexperimental setup and procedureare in Refs. 23 and 24.
CrossSection Examinations
Cross-section examinations of thewelds were performed using a stan-dard metallographic procedure up tothe stage of grinding with 1200 sili-con carbide polishing papers and fur-ther polishing using colloidal silicapolishing suspension. The polishedwelds were subjected to hardness andmetallographic examinations. TheVicker hardness was measured by aDHT HV-1000 hardness tester at in-tervals of 0.25 mm under an appliedload of 294 g and a dwelling time of10 s. Metallographic examinationswere carried out to observe the mi-crostructural evolutions and possibleweld discrepancies. Specimens formetallographic examinations wereprepared using standard metallogra-phy procedure and then etched with a4% Picral reagent for 30 s and rinsedby ethanol. All surfaces were analyzedusing standard optical and stereo mi-croscopes. To obtain high-resolutionimages, scanning electron microscopy(FEI® Sirion Field Emission) was alsoemployed (Ref. 25).
Modeling
Geometric Model
Finite element modeling coupledwith electrical-thermal-mechanical
WELDING RESEARCH
FEBRUARY 2017 / WELDING JOURNAL 73-s
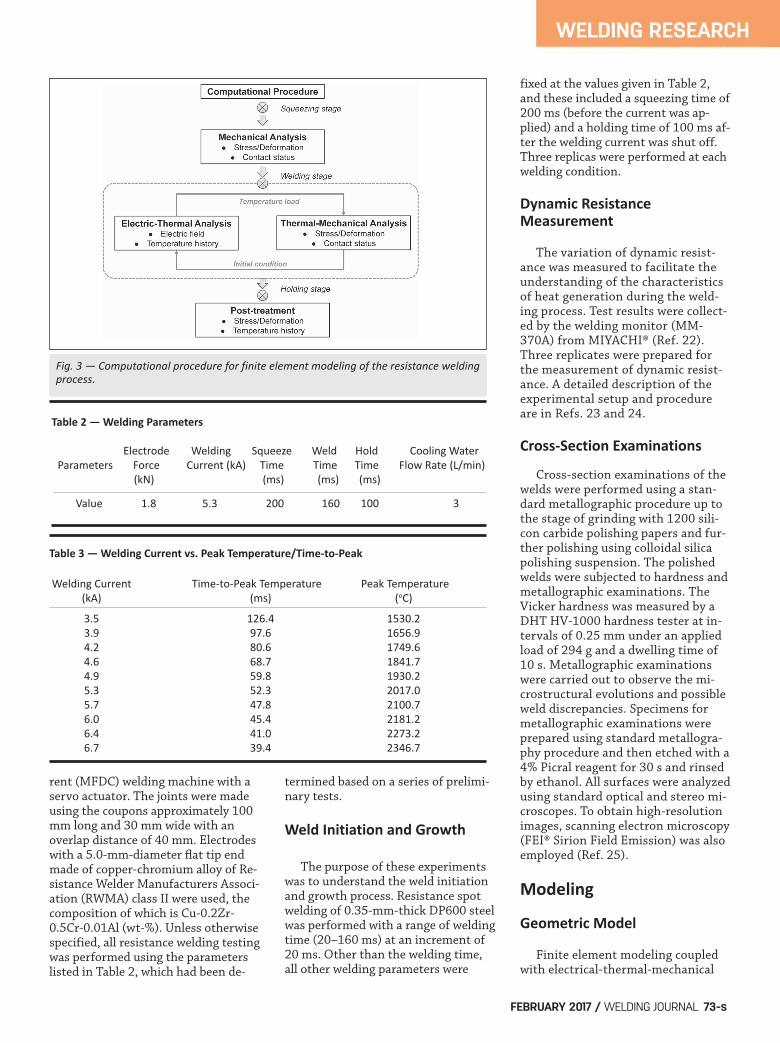
Fig. 3 — Computational procedure for finite element modeling of the resistance weldingprocess.
Table 2 — Welding Parameters
Electrode Welding Squeeze Weld Hold Cooling Water Parameters Force Current (kA) Time Time Time Flow Rate (L/min) (kN) (ms) (ms) (ms)
Value 1.8 5.3 200 160 100 3
Table 3 — Welding Current vs. Peak Temperature/TimetoPeak
Welding Current TimetoPeak Temperature Peak Temperature (kA) (ms) (oC)
3.5 126.4 1530.2 3.9 97.6 1656.9 4.2 80.6 1749.6 4.6 68.7 1841.7 4.9 59.8 1930.2 5.3 52.3 2017.0 5.7 47.8 2100.7 6.0 45.4 2181.2 6.4 41.0 2273.2 6.7 39.4 2346.7
Zhao 2-17_Layout 1 1/12/17 3:09 PM Page 73

analysis was conducted using com-mercial software ANSYS 15.0. Thephysical configuration of the resist-ance spot welding process can be sim-plified to a two-dimensional axisym-metric model. Figure 2A shows the el-ement grid used in the present analy-sis. As shown, four-node axisymmet-ric elements (i.e., PLANE67) wereused to model the electrode and steelsheets. Special contact elements wereinserted between the electrode/sheetand sheet/sheet interfaces to modelcontact state at those regions. Themodel was composed of 2608 nodesand 2664 elements, wherein 360 of
them were contact elements. Refinedmeshes shown in the enlarged area ofFig. 2A were used to capture the re-gion where the temperature gradientwas steep. Element types used forelectrical-thermal and thermal-me-chanical analysis were PLANE67 andPLANE42, respectively.
Boundary Conditions
Two types of boundary conditions,i.e., thermal-electrical and thermal-mechanical conditions shown in Fig.2B, were applied to the finite elementmodel as follows: The thermal-electrical boundaryconditions are
WELDING RESEARCH
WELDING JOURNAL / FEBRUARY 2017, VOL. 9674-s
Fig. 4 — A — Cross section; B — magnified rectangular region shown inA of resistance welded 0.35mmthick DP600 steel joints made with awelding current of 5.3 kA, a welding time of 160 ms, and an electrodeforce of 1.8 kN.
Fig. 5 — Microstructural evolutions from the weld center to the base metal. A — An overall view of the etched sample; B — center of theFZ1; C — FZ3; D — center of HAZ; E — HAZ close to base metal; F — HAZ boundary.
Table 4 — Recommended Welding Time for Various Steel Gauges
Steel Gauge (mm) 0.2 0.3 0.4 0.5 0.6 0.7
Critical Welding Time (ms) 40 60 80 100 120 160
A B
A
D
B
E F
C
Zhao 2-17_Layout 1 1/12/17 3:09 PM Page 74

1) The electrical potential at thebottom end of the lower electrode wasassumed zero, and the welding currentwas applied uniformly to the top ofthe upper electrode. 2) The convective heat transfer tothe surrounding air was considered byusing a convective heat transfer coeffi-cient of 19.4 Wm–2K–1. 3) Both the ambient air and initialwater temperatures were assumed tobe 21°C. Thermal-mechanical boundary con-ditions are 1) Electrode force was applied even-ly to each nodal point at the top end ofthe upper electrode. 2) The displacement of the surfaceof the lower electrode was set to zero. 3) The centerline of the model wasconstrained to extend only along theY-axis, without displacement along theX-axis.
Material Properties
In order to model the RSW processproperly, all of the relevant mechanical(i.e., modulus, Poisson ratio, andstress-strain relationship), physical(i.e., density, thermal conductivity, ex-pansion coefficient, and specific heat),
and electrical (i.e., resistivity) proper-ties for the steel sheets and copperelectrodes are needed. Since mechani-cal, electrical, and physical propertiesunder elevated temperature are notreadily available, many of these valueswere estimated from literature and as-sumed homogeneous and isotropic.Details on the determination of mate-rial properties are given in Refs. 26and 27.
Contact Resistance Model
Despite the temperature-dependentmaterial properties, the contact resist-ances at the faying interfaces are alsocrucial for the accuracy of the finitemodel. The contact resistance modelemployed in this study was a micro-electrical contact model proposed byLi (Ref. 28) derived from Kohlrausch’stheory (Ref. 29). A relationship wasdeveloped between the voltage dropacross a metallic contact interface andits resistance. According to the model,the voltage drop across the contact in-terface can be estimated by the follow-ing equation:
(1)
where V is the voltage drop across thecontact interfaces, TS and T0 are thecontact super temperature and thebulk temperature at the interfaces, re-spectively, and L is the Lorentz con-stant of iron (about 2.0 × 10⁻⁸(V/°C)2). In the present computations, TSat the workpiece/workpiece interfacewas specified to be the solidus of steel(1500°C), and at the electrode/work-piece interface to be the melting pointof the electrodes (1084°C). From Equation 1, the voltage dropacross the interface at any bulk temper-ature (T0) below TS can be obtained.Based on this temperature-dependentvoltage drop, the temperature-depen-dent contact resistance of the interfacecan be calculated by dividing by thewelding current. Furthermore, the con-tact resistance value can be converted toan equivalent electrical resistivity usingthe geometrical information of the con-tact elements at the interfaces. Oncethe temperature of the contact elementsexceeded its melting point, the contactresistance disappeared and the contactelements were disabled in this model.This contact resistance model has beenreported in Refs. 19 and 30; good agree-ments were reported between the calcu-lated and experimental measurementsin weld growth and dynamic resistance.
Computational Procedure
The computational procedure isshown in Fig. 3. Referring to Fig. 3, atthe squeezing stage, only mechanicalanalysis was conducted to calculate thecontact status and stress distributions.At the welding stage, electric-thermal-mechanical coupled analysis is needed.However, due to the difficulty of directcoupling of the electric-thermal-me-chanical field, the coupled analysis inthis study was conducted in two steps.The rise in temperature obtained fromthe electric-thermal analysis was thenapplied as thermal loading for thethermal-mechanical analysis, while thecontact status of the thermal-mechan-ical was used as the initial conditionsfor electric-thermal analysis. The timestep of iteration for the coupling was 5ms. And the temperature of the con-tact elements was checked every 5 msas well. Once it exceeded the meltingpoint, the corresponding contact element was disabled.
V 2 = 4L TS2 �T0
2( )
WELDING RESEARCH
FEBRUARY 2017 / WELDING JOURNAL 75-s
Fig. 6 — A typical microhardness profile of the resistance spot welded 0.35mmthickDP600 steel made with a welding current of 5.3 kA, an electrode force of 1.8 kN, and aweld time of 160 ms.
Zhao 2-17_Layout 1 1/12/17 3:09 PM Page 75

Results
Microstructural Evolution
To understand the weld formationcharacteristics in resistance spot weld-ing of 0.35-mm-thick DP600 steel, ex-tensive welding tests were performed.In setting up the welding machine toproduce a series of uniform welds, ini-tial values of suitable electrode forceand welding time were established. Thewelding controller was programmed inan attempt to maintain these values toproduce consistent welds. Figure 4 presents the typical crosssection of the welds made from lapjoint welded 0.35-mm-thick DP600steel with a welding current of 5.3 kAand a welding time of 160 ms. Refer-ring to Fig. 4A, the base metal (BM),heat-affected zone (HAZ), and fusionzone (FZ) of the weld were clearly iden-tified. Examinations of the resultsshown in Fig. 4A revealed there was acomparatively darker region betweenthe bright fusion zone and HAZ. High-
er magnification of the whole fusionzone is shown in Fig. 4B. Referring toFig. 4B, a unique “double-layer” fusionzone was observed. The inner and out-er weld zones are hereinafter referredto as FZ1 and FZ2, respectively. In theremaining part of this study, experi-ments were carried out to investigatethe weld formation and microstruc-tures of the “double-layer” fusion zone. Referring to Fig. 1B, the base metal,DP600 steel, was primarily composed offerrite and martensite (Ref. 21). The mi-crostructure in the base metal was com-posed of evenly distributed martensitewithin the ferrite phase, which waselongated along the rolling direction.Figure 5B and C present the microstruc-tures at location B (i.e., FZ1) and loca-tion C (i.e., FZ2) shown in Fig. 5A, re-spectively. As shown, both FZ1 and FZ2zones consisted virtually of martensite.However, the martensite lath in the FZ2was slightly finer than that of the FZ1.Referring to Fig. 5D to F, the volumefraction of martensite in the HAZ ishigher than that in the base metal.Since the peak temperature during
welding in the HAZ ranged from just be-low the liquidus to martensite temper-ing temperatures, Fig. 5D to F showedthe transitions of the HAZ from thecoarsened grain region to the fine grainregion and intercritical region (Ref. 31). Figure 6 shows a typical hardnessprofile of the resistance welded 0.35-mm-thick DP600 steel. As shown, theresults exhibited a significant hardnessincrease in the FZ1 compared to thebase metal. Due to the high content ofalloying elements in the steel and highcooling rate, the hardness of the FZ1, ata value of approximately 500 HV, wasabout 1.5 times more than that of thebase metal (BM). The higher hardnessin the FZ1 was apparently attributed tothe fully martensite microstructure ofthe FZ1. The hardness of the FZ2 isabout 430 HV, about 15% lower thanthat of the FZ1. The hardness of theHAZ from the FZ to the BM graduallydecreased from 460 HV to a compara-ble hardness of the BM, which can beattributed to the decreasing volumefraction of martensite in the HAZ fromthe FZ side to the BM side.
WELDING RESEARCH
WELDING JOURNAL / FEBRUARY 2017, VOL. 9676-s
A B
C D
E F
G H
Fig. 7 — Effect of welding time on the weld initiation and growth of resistance spot welded 0.35mmthick DP600 steel: A — 20 ms; B — 40 ms; C — 60 ms; D — 80 ms; E — 100 ms; F — 120 ms; G — 140 ms; H — 160 ms.
Zhao 2-17_Layout 1 1/12/17 3:09 PM Page 76

Weld Growth
In order to understand the “double-layer” phenomena, the welding timewas increased from 0 to 160 ms at theincrement of 20 ms, and the cross sec-tions of the welds were examined. Fig-ures 7 and 8 show the effect of weldingtime on the weld growth at variouswelding times.
Referring to Fig. 7, the fusion zonehad two distinctive stages, namely theexpanding and layering stages. In theexpanding stage (i.e., 0–40 ms), the fu-sion zone grew with welding time. Arapid growth in weld size was observedfor the first 20 ms, and after which theweld grew more gradually. At a weldingtime of 40 ms, the fusion zone reacheda diameter of about 2.8 mm and a thick-ness of 0.48 mm. The rapid growth inweld size, to some extent, was similar toRSW of aluminum. Rashid et al. (Ref.32) reported that the formation of acomplete weld was observed during the
first cycle in RSW of aluminum AA5182. As the welding time exceeded 40 ms,
the outer layer, FZ2, gradually emerged,which was accompanied with the dimin-ishing of an inner fusion zone, FZ1. Thesize of the FZ1 decreased to about 2.3mm in diameter and 0.3 mm in thick-ness at a welding time of 160 ms. Fur-thermore, the diameter and thicknessof the weld (i.e., sum of FZ1 and FZ2)almost remained unchanged after awelding time of 40 ms. Referring to Fig.8, the extent of the weld layering wasmore pronounced in the thickness di-rection than in the radial direction. Thisphenomenon likely was attributed tothe fact that the fraction of heat dissi-pated through the electrodes dominatedthe heat dissipation in welding of thinsteel sheets (Refs. 6, 7).
Dynamic Resistance
To understand the mechanism of theformation of a “double-layer” weld in re-
sistance welds, heat generation duringthe welding process was considered. Inthe resistance spot welding process, theprimary heat source is Joule heating(i.e., resistance heating when the weld-ing current passes through the stack-upof workpieces between the electrodes).The amount of Joule heat generationper unit time is proportional to thesquare of the current and resistance.Since the welding current was constant,Joule heat generation per unit time wasprimarily determined by the contact re-sistance and resistivity of steel. Thus,the dynamic resistance of resistancespot welding 0.35-mm-thick dual-phasesteel was measured, and the results areshown in Fig. 9A. For the purpose ofcomparison, the dynamic resistances of0.8-mm-thick steel were also acquired,and the results are presented in Fig. 9B. Referring to Fig. 9, the dynamic re-sistances in resistance welding both0.35- and 0.8-mm-thick steels experi-enced a “decrease-increase-decrease”
WELDING RESEARCH
FEBRUARY 2017 / WELDING JOURNAL 77-s
Fig. 8 — Effect of welding time on the A weld diameter and B weld thickness of resistance welded 0.35mmthick DP600 steel.
Fig. 9 — Dynamic resistance vs. time during resistance welding. A — 0.35mmthick steel; B — 0.8mmthick steel.
A B
A B
Zhao 2-17_Layout 1 1/12/17 3:09 PM Page 77

pattern with increasing the weldingtime. As can be seen in Fig. 9A and B,the dynamic resistance dropped dra-matically and reached a valley at thewelding times of about 2 and 4 ms forresistance welding of 0.35- and 0.8-mm-thick steels, respectively. This sharpdrop in resistance was related to thebreaking down of the surface asperitiescaused by Joule heating (Ref. 27). Whilethe dynamic resistances for both steelsgradually increased to a peak, the timespan of the increasing stage differedwidely between them. The times toreach the resistance peak were about 10and 40 ms for 0.35- and 0.8-mm-thicksteels, respectively. This difference canbe explained as follows: The dynamic resistance in resist-ance welding of steel consisted of two
aspects, namely bulkresistance of theworkpieces and con-tact resistance at thefaying interfaces.The increase in dy-namic resistance resulted primarilyfrom the increase in bulk resistance ofsteel as a result of the increase in tem-perature. Because the increase in bulkresistance is quite limited for 0.35-mm-thick steel, the time span for theincreasing stage of dynamic resistancewas significantly less than that of 0.8-mm-thick steel. After the peak, thesize of the molten region increasedprogressively, which also enlarged thecross-sectional area available for cur-rent flow and led to further decreasein dynamic resistance (Ref. 33).
To understand the effect of sheetthickness on the heat generation, thedynamic resistance over the weldingtime was integrated and the results areshown in Fig. 10. Referring to Fig. 10,about 23.3% of the total Joule heat wasgenerated within the initial weldingtime of 20 ms, and 50% within the ini-tial 55 ms in resistance welding 0.35-mm-thick steel, while only 12.7% at awelding time of 20 ms and 50% at awelding time of 70 ms for 0.8-mm-thicksteel. It can be inferred that the heatgeneration strongly concentrated at theinitial stage of the resistance welding
WELDING RESEARCH
WELDING JOURNAL / FEBRUARY 2017, VOL. 9678-s
Fig. 10 — Effect of sheet thickness on heat generation in resistancewelding steels.
Fig. 12 — Calculated temperature histories in resistance welding of0.35mmthick DP600 steel [results are presented for different levelsof penetration in the workpiece, ranging from 0 mm (faying interface)to 0.35 mm (electrode surface)].
Fig. 13 — Comparison of modeling and experimental results inresistance welding 0.35mmthick DP600 steel.
Fig. 11 — Effect of welding time on the strength of resistancewelded 0.35mmthick DP600 steel.
Zhao 2-17_Layout 1 1/12/17 3:09 PM Page 78

process of ultra-thin steels. This obser-vation in dynamic resistance and heatgeneration were in line with the testingresults of the weld formation. A high re-sistance in the beginning resulted in sig-nificant heat generation, and these re-sults explained the rapid weld growthduring the initial welding stage. Low re-sistance in the latter half of the weldingprocess also agreed with the stable fu-sion size observed in Fig. 7.
Effect of Weld Layering
From the aforementioned results,the weld layering occurred in resistancewelding of 0.35-mm-thick steel. Natu-rally, it is necessary to examine how theweld layering would affect the jointstrength. Welds with various degrees oflayering were fabricated. Figure 11shows the effect of welding time on thestrength of the welded 0.35-mm-thicksteel. Referring to Fig. 11, the joint
strength increased from about 2.5 to3.1 kN as the welding time increasedfrom 20 to 40 ms, which can be attrib-uted to the increase in weld size withprolonging the welding time. The jointstrength changed little when the weld-ing time was prolonged from 60 to 320ms. Examination of the test results re-vealed all joints failed in button pull-outmode. Based on these results, it can beconcluded that the joint strength wasproportional to the weld size (i.e., sumof the FZ1 and FZ2). Once the weld lay-ering occurred (i.e., at a welding time of~ 60 ms), the weld size grew little, andconsequently it had little benefit on thejoint strength, and indeed even slightlyimpaired the joint strength.
Discussions
Temperature History
To further clarify the formation
mechanism of “double-layer” weld,transient temperature histories for thelocations from the faying interfaces tothe electrode face were estimated, andthe results are shown in Fig. 12. Asshown, the temperatures rose first andthen fell, which was quite differentfrom the monotonic increase in tem-perature in resistance welding of thicksteel (e.g., > 1 mm) (Refs. 27 and 34).Referring to Fig. 12, calculated tem-perature at the faying interfacesachieved the melting point of steel at awelding time of 15 ms and reached thepeak (~ 2017°C) at a welding time ofabout 52 ms. After that, the tempera-ture at the faying interfaces decreased.The temperature histories for the loca-tions from the faying interfaces to theelectrode-workpiece interface all ex-hibited “first-rise-then-fall” pattern.Furthermore, the temperature de-crease in the latter stage of the weld-ing process was more pronounced atthe faying interfaces than at the electrode-workpiece interface. This “first-rise-then-fall” tempera-ture history was likely the cause of the“double-layer” weld shown in Fig. 7. Re-ferring to Fig. 12, the temperature atthe location of 0.2 mm above the fayinginterfaces achieved the solidus (i.e.,1500°C) at a welding time of about 32ms and increased to 1610°C at a weldingtime of 56 ms, and then dropped belowthe solidus at about 120 ms. These re-sults suggested the workpieces becamemolten at a welding time of 32 ms, andstarted to solidify at 120 ms. However,the temperatures for the locations be-tween the faying interfaces and 0.15mm above the faying interfaces werestill higher than the solidus at a weldingtime of 160 ms, and thus the workpiece
WELDING RESEARCH
FEBRUARY 2017 / WELDING JOURNAL 79-s
Fig. 14 — Calculated effect of welding current on the temperature histories in resistance welding 0.35mmthick DP600 steel.
Fig. 15 — Calculated effect of welding variables on the weld sizes inresistance welding 0.35mmthick DP600 steel.
Fig. 16 — Calculated effect of sheet thickness on the temperature histories in resistancespot welding steel.
Zhao 2-17_Layout 1 1/12/17 3:09 PM Page 79
at those locations solidified after thewelding current was shut off. Based onthese results, two kinds of solidificationprocesses occurred; the portion of themolten metal started to solidify afterthe welding current was turned off(Mode 1) and formed an inner layer,FZ1, while the outer layer of the moltenzone had already solidified progressivelyduring the welding process (Mode 2)and resulted in an outer layer (i.e., FZ2).Therefore, the boundary of the outer re-gion of the double layer (FZ2) was de-fined by the boundary of the meltingarea at the moment when the tempera-ture at the faying interface achieved thepeak (i.e., 52 ms), while the boundary ofthe inner layer (FZ1) was defined by theboundary of the melting area when thewelding current was about to shut off.Since the temperature at the outer layerwas lower than the inner one, the nucle-ation rate at the outer layer would havebeen higher than the inner layer, and
thus led to finer microstructure, refer-ring to Fig. 3. Furthermore, the coolingrates in RSW was well above the criticalcooling rates for martensite formationfor DP steel (i.e., 120°C/s) (Ref. 8), andthus both FZ1 and FZ2 were composedfully of martensite. The results shownindicated that the calculated tempera-ture history provided a good explana-tion for the experimental observations.
Comparison of Modeling andExperimental Results
The finite element model was usedto analyze the temperature evolutionduring resistance welding. Figure 13shows the comparison of calculated andmeasured weld sizes. As shown, oncethe calculated temperature exceeded themelting point (i.e., 1500°C) of steel, itwas colored in gray. The grey area thusindicated the area of FZ1, melting re-gion at different welding time. The
black dash line indicated the calculatedboundary of the FZ2, which was deter-mined by the melting region at 52 ms,while the white dash line showed theboundary of FZ2 in the cross sections.Referring to Fig. 13, the weld had a di-ameter of 2.8 mm and a depth of 0.48mm after only a welding time of 40 ms,and nugget layering was not observed.However, as the welding time was pro-longed, the weld nugget layering gradu-ally developed where the diameter anddepth of the inner layer of nugget (FZ1)gradually decreased, especially thedepth. For example, the diameter anddepth of the FZ1 decreased to 2.4 and0.32 mm, respectively, after a weldingtime of 160 ms. These results inferredthat the melting zone experienced an“expand-shrink” evolution during theresistance welding of 0.35-mm-thicksteel, which was in line with the meas-ured results shown in Fig. 7 that theFZ1 grew fast within the initial welding
WELDING RESEARCH
WELDING JOURNAL / FEBRUARY 2017, VOL. 9680-s
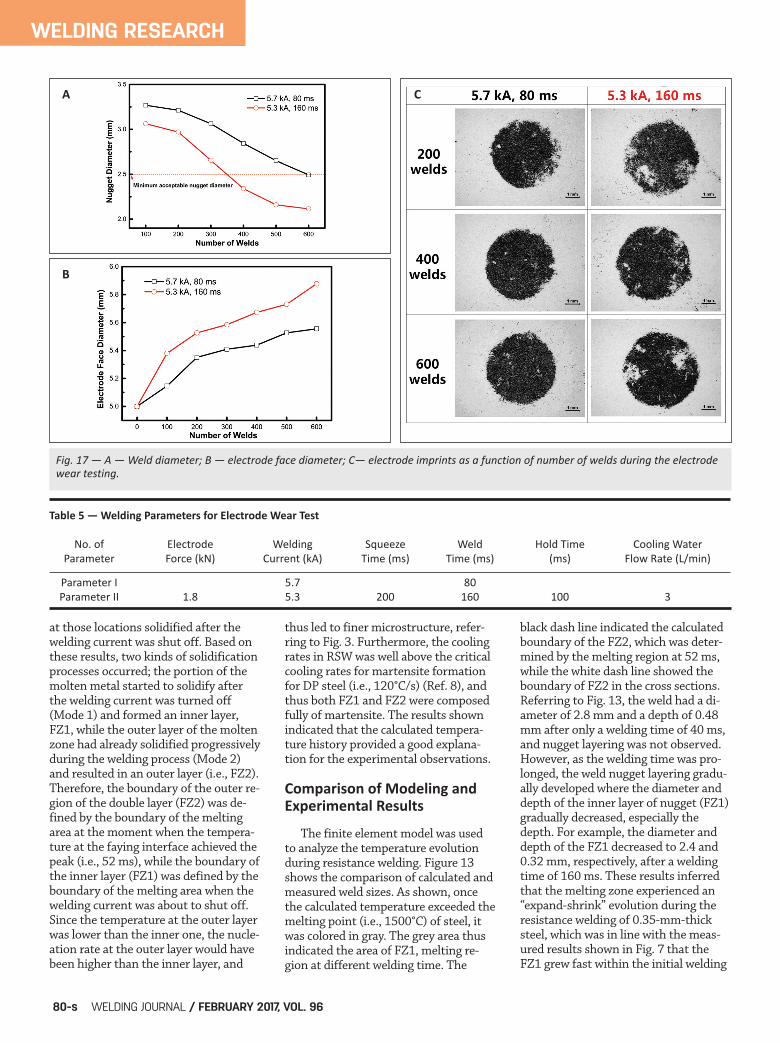
Table 5 — Welding Parameters for Electrode Wear Test
No. of Electrode Welding Squeeze Weld Hold Time Cooling Water Parameter Force (kN) Current (kA) Time (ms) Time (ms) (ms) Flow Rate (L/min)
Parameter I 5.7 80 Parameter II 1.8 5.3 200 160 100 3
Fig. 17 — A — Weld diameter; B — electrode face diameter; C— electrode imprints as a function of number of welds during the electrodewear testing.
A
B
C
Zhao 2-17_Layout 1 1/12/17 3:09 PM Page 80

time of 40 ms, and then gradually di-minished as the welding time contin-ued. In addition, the calculated size andshape of both FZ1 and FZ2 showedgood agreement with the cross sections.
Effect of Welding Current
From the aforementioned results, itwas found that the weld layering wasstrongly related to the temperaturehistory during the welding process.Since the Joule heat generation is pro-portional to the welding current, theeffect of welding current on the varia-tions of the weld layering was alsostudied from the perspective of tem-perature history. Figure 14 presentsthe effect of welding current on thecalculated temperature histories in re-sistance spot welding of 0.35-mm-thick DP600 steel. Table 3 lists the cor-relations between the welding currentand peak temperature and time-to-reach the peak temperature. Referringto Fig. 14 and Table 3, although theapplication of high welding current re-sulted in an increase in maximumtemperature, it hardly changed the“first-rise-then-fall” temperature his-tory. Moreover, the time to reach thepeak temperature occurred earlier un-der high welding current, and a moreprominent “first-rise-then-fall” tem-perature phenomenon was observed. Another interesting observationwas seen, referring to Fig. 15. In RSWthick steel (> 0.8 mm), a desired weldsize can be achieved by using eitherhigh welding currents with short weld-ing times or low welding currents withlong welding times under thermalequivalent principles (Refs. 6, 7). How-ever, it was not the case for steel witha thickness of 0.35 mm. For example,although the Joule heat of these threesets of welding parameters (4.0 kA,160 ms; 5.0 kA, 100 ms; and 6.0 kA,70 ms under an electrode force of 1.8kN) were similar, the resultant calcu-lated weld sizes were quite different,referring to Fig. 15. The calculatedweld sizes were 2.0, 2.7, and 3.2 mmunder the welding parameters of 4.0kA, 160 ms; 5.0 kA, 100 ms; and 6.0kA, 70 ms, respectively. These resultscan be explained by the dynamic re-sistance results shown in Fig. 7. Asshown, the dynamic resistance virtual-ly kept decreasing in resistance weld-ing of 0.35-mm-thick DP600 steel, and
consequently most of the Joule heatwas generated at the initial stage ofthe welding process. Therefore, it canbe concluded that high welding cur-rent and short welding time are prefer-able for RSW of 0.35-mm-thick steel.
Recommended WeldingPractice
The aforementioned results demon-strated that the weld size increasedrapidly at the initial stage of the weld-ing process and reached its maximumat a critical welding time. After that,the weld size remained virtually un-changed. Then, the weld graduallygrew to form a two-layer structure asthe welding continued. Furthermore,testing results showed that the jointstrength increased with the weld size,and weld layering provided little bene-fit from the joint strength perspective.Therefore, the use of high welding cur-rent and short welding time is recom-mended to join ultra-thin steel. Figure 16 presents the effect of sheetgauge on the temperature at the weldcenter for RSW of steels. Referring toFig. 16, while the temperature was al-ways rising within the welding time of160 ms for 0.8-mm-thick steel, the tem-peratures all rose first and then fell forsteel gauges varying from 0.7 ~ 0.2mm. As the steel gauge decreased, thetime to reach the peak temperature oc-curred earlier and the phenomenon oftemperature decrease became more pro-nounced. Thus, the weld layering hap-pened earlier with a decrease in steelgauge. The recommended welding timecan be identified by the round numbersof the turning point in the temperaturehistories, referring to Table 4. Asshown, the recommended welding timedecreased significantly with the de-crease in steel gauge. These results in-ferred that high welding current andshort welding time were preferred forRSW of thin steels. To further validate this observa-tion, electrode wear tests at a weldingrate of 30 welds per minute were con-ducted. Two sets of welding parame-ters shown in Table 5 were selected.Carbon imprints of electrode and peelspecimens at every 100-weld intervalwere conducted to monitor the elec-trode wear and weld diameter, respec-tively. The weld diameter was estimat-ed by measuring the diameter of pull-
out buttons during the peel tests. Fig-ure 17A and B presents the variationsof weld diameter and electrode face di-ameter vs. the number of welds, re-spectively. Referring to Fig. 17A, theweld diameters obtained using param-eter I (i.e., a welding current of 5.7 kAand a weld time of 80 ms) were largerthan those with the use of welding pa-rameter II (i.e., a welding time of 5.3kA and a weld time of 160 ms). Whilethe weld diameters made with parame-ter II fell below the minimum accept-able size (i.e., 2.5 mm) after 400 welds,the weld diameters obtained with theuse of welding parameter I were stillgreater than 2.5 mm after 600 welds.Moreover, the rate of electrode degra-dation with welding parameter I wascomparatively lower than that withwelding parameter II, referring to Fig.17B. The difference in electrode degra-dation was further observed from car-bon imprints shown in Fig. 17C. Refer-ring to Fig. 17C, severe cavitation atthe electrode surface (i.e., white areas)was observed using parameter II after600 welds, while the electrode im-prints of the electrode using parame-ter I remained relatively sound condi-tions. These results confirmed thathigh welding current and short weld-ing time were more preferable for RSWthin steels (< 0.5 mm).
Conclusions In this study, experiments and nu-merical modeling conducted on resist-ance welding of 0.35-mm-thick DP600steel concluded the following: 1) The weld initiated early and grewto reach a maximum diameter of 2.8mm within a welding time of 40 ms.Afterward, the weld gradually formedan inner layer and an outer layer withthe overall size virtually unchanged.The extent of the weld layering be-came pronounced with prolonging thewelding time. 2) The formation of the weld layer-ing was primarily attributed to theunique temperature history developedfor welding ultra-thin (i.e., 0.35 mm)steel. The temperature in the middleof the weld zone initially increasedrapidly and reached a maximum valueat a welding time of about 52 ms, andthen fell in the remaining of the weld-ing process. As the temperaturedropped, the molten zone solidified
WELDING RESEARCH
FEBRUARY 2017 / WELDING JOURNAL 81-s
Zhao 2-17_Layout 1 1/12/17 3:09 PM Page 81

gradually from the edge to the internalmolten zone, and consequently theweld layering was emerged. 3) The joint strength increased withthe weld size and was improved littlewith the occurrence of the weld layer-ing. Therefore, it is preferable to usehigh welding current and short weldingtime for resistance welding ultra-thinsteel.
This research was supported by theGeneral Motors Collaborative Re-search Laboratory at Shanghai JiaoTong University and National NaturalScience Foundation of China (Project51675338). The authors also sincerelythank Prof. Hyun Chung from KoreaAdvanced Institute of Science andTechnology (KAIST) for his kind helpduring the preparation of this manu-script, and the Brain Korea 21 (BK21)fellowship from the Ministry of Educa-tion of Korea.
1. Singh, H., and Coates, G. 2014. Ad-vanced high-strength steel lightweighting:minimum thickness study and AHSS appli-cation guidelines. Great Designs in Steel,American Iron and Steel Institute. 2. Zhao, Y. Y., Zhang, Y. S., Lai, X. M.,and Wang, P.-C. 2013. Resistance spotwelding of thin automotive steel. ASME.Journal of Manufacturing Science and Engi-neering 135(2): 021012.1-10. 3. Zhao, Y. Y., Zhang, Y. S., Lai, X. M.,and Wang, P.-C. 2014. Effect of insertedstrips on electrode degradation in resist-ance spot welding. Welding Journal 93(11):411-s to 420-s. 4. Agashe, S., and Zhang, H. 2003. Se-lection of schedules based on heat balancein resistance spot welding. Welding Journal82(7): 179-s to 183-s. 5. Sun, X., Stephens, E. V., Davies, R.W., Khaleel, M. A., and Spinella, D. J. 2004.Effects of fusion zone size on failuremodes and static strength of aluminum re-sistance spot welds. Welding Journal83(11): 308-s to 318-s. 6. Gould, J. E. 1987. An examination ofnugget development during spot welding us-ing both experimental and analytical tech-niques. Welding Journal 66(1): 1-s to 11-s.
7. Euiwhan, K., and Eagar, T. W. 1988.Parametric study of heat flow during resist-ance spot welding. Modeling and control ofcasting and welding Processes IV. Proceedingsof the Fourth International Conference on Mod-eling of Casting and Welding Processes. 8. Gould, J. E., Khurana, S. P., and Li, T.2006. Predictions of microstructures when welding automotive advanced high-strength steels. Welding Journal 85(5): 111-s to 116-s. 9. Ho, J. E., Wei, P. S., and Wu, T.H.2012. Workpiece property effect on resist-ance spot welding. IEEE Transactions onComponents, Packaging and ManufacturingTechnology 2(6): 925–934. 10. Williams, N. T., and Parker, J. D.2004. Review of resistance spot welding ofsteel sheets: Part 1 modelling and controlof weld nugget formation. InternationalMaterials Reviews 49(2): 45–75. 11. Williams, N. T., and Jones, T. B.1984. Resistance spot welding of low car-bon and high strength low-alloy (HSLA)steels, Report no. EUR 8693, Commissionof European Communities, Technical SteelResearch Programme, Brussels, Belgium. 12. Zhou, Y., Gorman, P., Tan, W., andEly, K. J. 2000. Weldability of thin sheetmetals during small-scale resistance spotwelding using an alternating-current pow-er supply. Journal of Electronic Materials29(9): 1090–1099. 13. Ely, K. J., and Zhou, Y. 2001. Mi-croresistance spot welding of Kovar, steel,and nickel. Science and Technology of Weld-ing and Joining 6(2): 63–72. 14. Zhou, Y., Dong, S. J., and Ely, K. J.2001. Weldability of thin sheet metals bysmall-scale resistance spot welding usinghigh-frequency inverter and capacitor-dis-charge power supplies. Journal of ElectronicMaterials 30(8): 1012–1020. 15. Tan, W., Zhou, Y., and Kerr, H. W.2002. Effects of Au plating on small-scaleresistance spot welding of thin-sheet nick-el. Metallurgical and Materials TransactionsA, 33(8): 2667–2676. 16. Tan, W., Zhou, Y., Kerr, H. W., andLawson, S. 2004. A study of dynamic re-sistance during small scale resistance spotwelding of thin Ni sheets. Journal of PhysicsD: Applied Physics 37(14): 1998–2008. 17. Fukumoto, S., Fujiwara, K., Toji , S.,and Yamamoto, A. 2008. Small-scale resist-ance spot welding of austenitic stainlesssteels. Materials Science and Engineering: A,492(1): 243–249. 18. Fujiwara, K., Fukumoto, S., Yokoya-ma, Y., Nishijima, M., and Yamamoto, A.2008. Weldability of Zr 50 Cu 30 Al 10 Ni10 bulk glassy alloy by small-scale resist-ance spot welding. Materials Science and En-gineering: A 498(1): 302–307. 19. Chang, B. H., Li, M. V., and Zhou, Y.
2001. Comparative study of small scaleand ‘large scale’ resistance spot welding.Science and Technology of Welding and Join-ing 6(5): 1–8. 20. ssab.com 21. Marya, M., and Gayden, X. Q. 2005.Development of requirements for resist-ance spot welding dual-phase (DP600)steels Part 1 — The causes of interfacialfracture. Welding Journal 84(11): 172-s to182-s. 22. www.amadamiyachi.com 23. Zhang, Y. S., Sun, H. T., Wang, P. C.,and Chen, G. L. 2014. Improvement ofprocess robustness in weld bonding of gal-vanized DP780 steel. Welding Journal93(12): 472-s to 481-s. 24. Shen, J., Zhang, Y. S., Lai, X. M.,and Wang, P. C. 2012. Adhesive placementin weld-bonding of multiple stacks of steelsheets. Welding Journal 91(2): 59-s to 66-s. 25. www.fei.com 26. Shen, J., Zhang, Y. S., Lai, X. M., andWang, P. C. 2010. Modeling of resistancespot welding of multiple stacks of steelsheets. Materials & Design 32(2): 550–560. 27. Wan, X. D., Wang, Y. X., and Zhang,P. 2014. Modeling the effect of weldingcurrent on resistance spot welding ofDP600 steel. Journal of Materials ProcessingTechnology 214(11): 2723–2729. 28. Li, M. V., Dong, P., and Kimchi, M.1997. A contact resistance model for resist-ance spot welding process: theory and im-plementation. ICAWT 97: High ProductivityJoining Processes, San Francisco, Calif. 29. Kohlrausch, F. 1900. Ueber dasProblem eines elektrisch erwarmten leit-ers. Annalen der Physik 306(2): 312–325. 30. Chang, B. H., and Zhou, Y. 2003.Numerical study on the effect of electrodeforce in small-scale resistance spot weld-ing. Journal of Materials Processing Technol-ogy 139(1-3): 635–641. 31. Khan, M. I., Kuntz, M. L., Su, P.,Gerlich, A., North, T., and Zhou, Y. 2007.Resistance and friction stir spot welding ofDP600: a comparative study. Science andTechnology of Welding and Joining 12(2):175–182. 32. Rashid, M., Medley, J. B., and Zhou,Y. 2011. Nugget formation and growthduring resistance spot welding of alu-minum alloy 5182. Canadian MetallurgicalQuarterly 50(1): 61–71. 33. Dickinson, D. W., Franklin, J. E.,and Stanya, A. 1980. Characterization ofspot welding behavior by dynamic electri-cal parameter monitoring. Welding Journal59(6): 170-s to 176-s. 34. Eisazadeh, H., Hamedi, M., and Hal-vaee, A. 2010. New parametric study ofnugget size in resistance spot weldingprocess using finite element method. Ma-terials and Design 31(1): 149–157.
WELDING RESEARCH
WELDING JOURNAL / FEBRUARY 2017, VOL. 9682-s
References
Acknowledgments
Zhao 2-17_Layout 1 1/12/17 3:09 PM Page 82