Embed Size (px)
Citation preview

Welcome to the Plant Breeding and Genomics Webinar Series
Today’s Presenter: Dr. Heather Merk
Presentation & Supplemental Files: http://www.extension.org/pages/60427
Co-Hosts: John McQueen & Heather Merk PBG home page:
www.eXtension.org/plant_breeding_genomics
Sign up for PBG News: http://pbgworks.org

Please fill out the survey evaluation! (You will be
contacted via email)
Watch past webinars and sign up for future webinars!
http://www.extension.org/pages/60426

Introduction to R Statistical Software: Application to Plant
Breeding
Presenter: Dr. Heather L. Merk
The Ohio State University, OARDC

Overview
• Why R?
• Where to Obtain R
• How to Perform Basic Commands
• Sample Analyses
• How to Obtain Help
• How to Learn More

Learning Objectives
At the end of this webinar you should be able to do the following using R... • Install and run R. Find R packages, install,
and load them. • Read in data and visualize distribution • Test if there are differences between varieties
(ANOVA using linear regression) • Distinguish varieties (Means and T-test) • Estimate variance components • Use loops to simplify analysis

R Overview • Open-source programming language for
statistical analysis and graphing • Based on S (developed by Bell Labs, the
developers of Unix. You will see similarities) • Provides language, tool, and environment in
one • Functions and analysis stored as objects,
allowing for function modification and model building
• Many packages for specific applications are already available

Why R?
• R is free!
• Powerful software
• Publication quality figures
• Built-in help
• Many resources
www.r-project.org/foundation

Obtain R
www.r-project.org

Choose a CRAN Mirror
• CRAN = Comprehensive R Archive Network
• Select the mirror site closest to you

Now That You Have R, the Fun Begins!

Command Line Interface
Workspace Type commands here

Basic Commands in R
• R is case sensitive
• # comment follows
• <- or = assignment operator
• c concatenate

Practice Entering Commands!
• Kim, D.Y. R basics [Online]. Illinois State University. Available at: http://math.illinoisstate.edu/dhkim/rstuff/rtutor.html (verified 8 Sept 2011).

Text Editors • Alternative to typing in command line • Write scripts that can easily be saved and recalled • Mac – built-in color text editor • PC – Tinn-R (Tinn is not Notepad), difficulties with Windows 7 and with
newer versions of R, http://sciviews.org/Tinn-R

Running a Script on a PC • Copy and paste into R console
OR
• Tinn-R – Open R, click on a line of your script, press Ctrl + Enter

Running a Script on a Mac • Copy and paste into R console
OR
• Highlight line, press Command + Enter

Sample Data • SolCAP Phenotypic data
• Processing tomato fruit shape, color, quality data
• Scanned images analyzed with Tomato Analyzer software
• 2009OHColorSample.xls has color data from one year in one location
• 2010OHColorSample.xls has color data from one year in one location

Data Format • Tab delimited or csv files • Flat file • Missing data NA • Headers – no spaces, no commas (csv), begin
with a letter

Importing Data • Script – Script2009OHColorSample.txt
• read.csv(“filename.csv”, header=T)
• read.txt(“filename.txt”, header=T)
• For PC – note the direction of the slashes

Learn More – Importing Data
• R Development Core Team. R Data import/export [Online]. The Comprehensive R Archive Network. Available at: http://cran.r-project.org (verified 9 Sept 2011).
Checking Data – Small Data Sets ONLY!
• object or print(object)
• summary(object)

Checking Data – Head & Tail Commands
• head(object) – See first rows of data including header
• tail(object) – See last rows of data including header

Checking Data – Structure Command • str(object) • See structure of the data set including the
number of observations, number of variables, number of levels of categorical variables

Visualizing Data • hist(object)

hist(OHColor$Avggreen, prob=T, xlab=“Average Green”, ylab= “Density”, main=“Average Green for OHIO 2009 Processing”, col=3); lines(density(OHColor$Avggreen, na.rm=T, bw=2))

Learn More – Graphics
• Murrell, P. 2006. R graphics. Chapman & Hall/CRC, NY.

Simple ANOVA Models
• Are there differences in average green between lines?
• 2009OHColorSample.xls has color data from one year in one location
• $ access a subset of data
• lm(formula=model)
• anova(model)

Simplifying the R Code • Complicated code:
• Simplified code:

Test Assumptions • plot(model)
• Provides 4 graphs: residuals vs. fits, qqplot, scale-location, residuals vs. leverage
• Meeting expected distributions challenging with large data sets

ANOVA Summary • summary(model)
• Suggests multiple lines have mean average green level that differs from SCT_0001 (Intercept)
• Follow-up with t-tests, box plots (multiple comparisons not covered here)
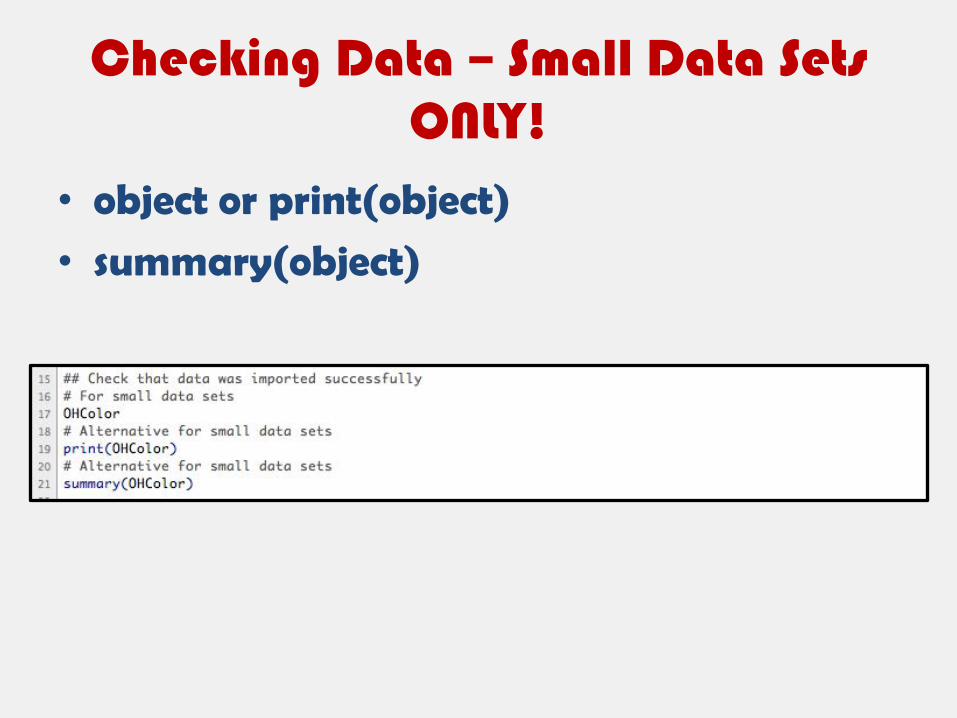
Summarizing Data
• Prior to t-test, may want to summarize data
• mean(object)
• sd(object)
• na.rm=T remove missing data

• tapply - command used to apply a function, e.g. mean

t-test • Does a line have a higher average green value than the
overall mean?
• Does one line have a higher average green than another?
• t.test(x,y) – x and y are numeric vectors
• Default confidence level is 0.95. Adjust by including (conf.level = insert desired level) in the command

Box Plot • boxplot(model) • boxplot(AVGGREEN~LINE)

Combining Data Sets • Combine data for 2009 and 2010
• 2010 data – 2010OHColorSample.xls
• Import 2010 data • Dataframes need to have same headers
• rbind(dataframe1, dataframe2)

Multi-year Data
• Sample data – collected in one location, two years, three reps total

Assign Variable Names
• Rename variables so that rep and year are factors for ease of use
• R recognizes the most recent object name if the name is used multiple times (e.g. we previously assigned the name AVGGREEN to average green in the 2009 data. AVGGREEN is now assigned to the combined data)

Multi-year ANOVA • REP and YEAR considered fixed
• Denote nesting using %in%
• Denote interactions using a colon or asterix between terms
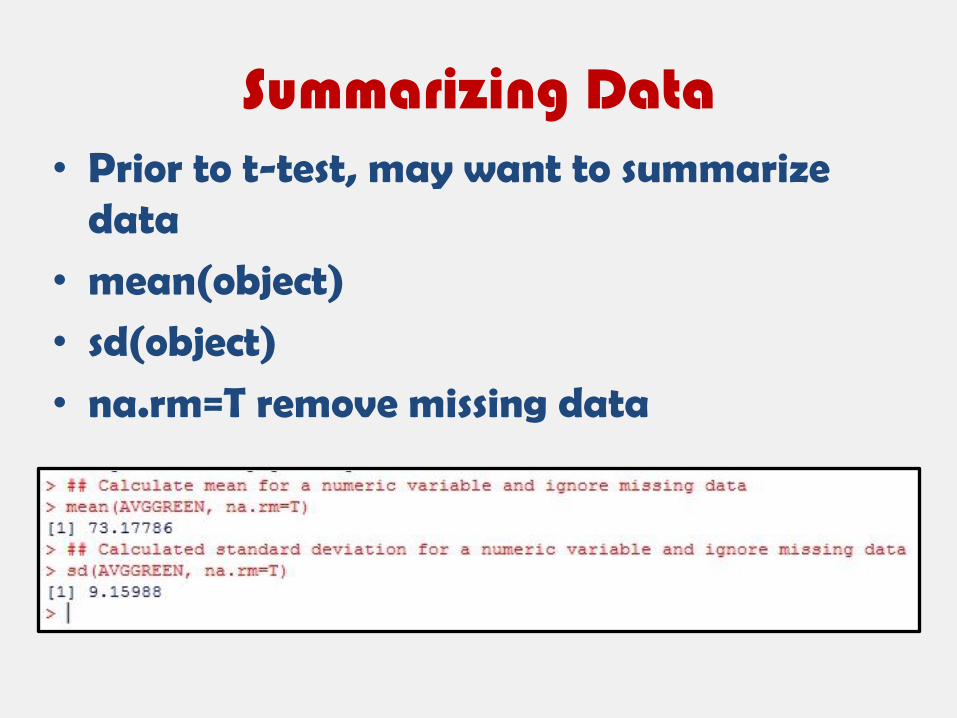
Models with Random Effects
• For many plant breeding applications we would consider main effects to be random, and would want to estimate the proportion of variance due to effects in our experimental design (e.g. estimates of heritability)
• Requires lme4 package

Installing a Package
• First time you want to use a package

Loading a Package
• Load package every R session you want to use it
• library(package name)

Calculating Variance Components • lmer(model) • Denote random effect - (1|object) • lmer can also be used with a mixed model
Can be used to estimate heritability

Learn More – lme4 Package
• Bates, D., M. Maechler, and B. Bolker. 2011. Package „lme4‟ [Online]. The R Project for Statistical Computing. Available at: http://cran.r-project.org/web/packages/lme4/lme4.pdf (verified 13 Sept 2011).

Exporting Tables
• Useful after manipulating a data set or creating a new data set
• Combined data for two years
• write.table(dataframe, col.names=NA, “filename.txt”)

• Based on – Cock, P. Programming in R [Online]. Molecular Organization and Assembly in Cells, The University of Warwick. Available at: http://www2.warwick.ac.uk/fac/sci/moac/degrees/modules/ch923/r_introduction/r_programming (verified 14 Sept 2011).
• Save time and simplify code • for and while loops
Introduction to Loops

For Loops
• Take the form – for (variable in
sequence) expression
OR
– for (variable in sequence)
{
expression
expression
expression }

While Loops
• Take the form – while(condition)
expression
OR
– while(condition)
{
expression
expression
expression
}

Single Marker-Trait Analysis
• Test association between trait and marker, one marker at a time
• Use simple linear model, lm(trait~marker)

Single Marker-Trait Analysis Loop
for(x in 3:ncol(data))
{
print(names(data[x]))
print(anova(lm(trait~data[,x]))))
}

R Help
• ??function name • help(function name)
• Help menu option of GUI

R Help Mailing List
https://stat.ethz.ch/mailman/listinfo/r-help

Learn More – Online www.eXtension.org/plant_breeding_genomics
R content coming Fall 2011
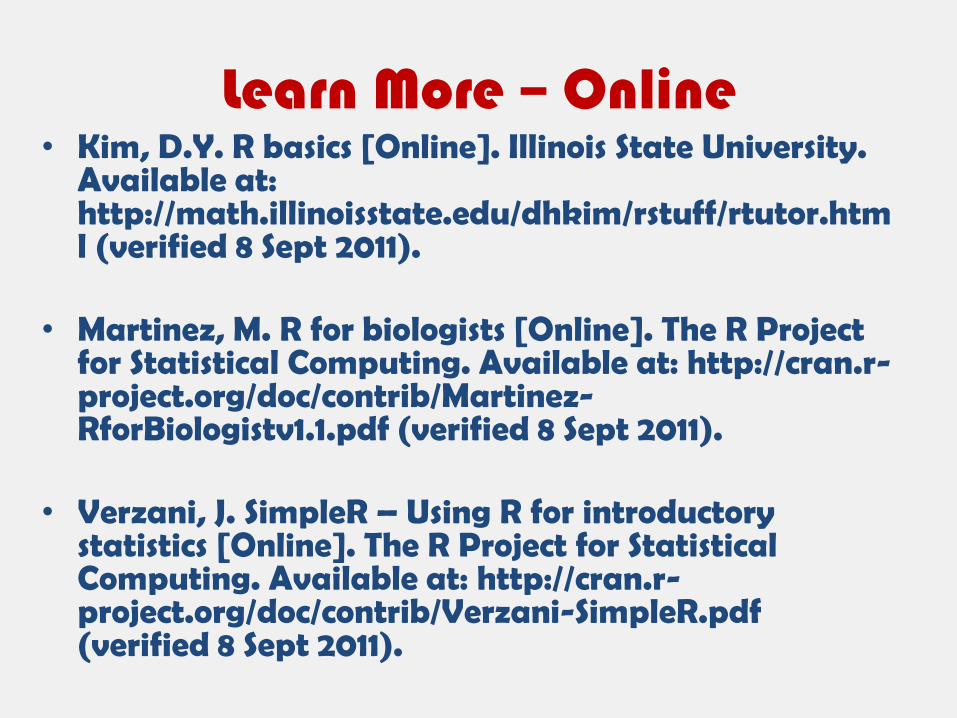
Learn More – Online • Kim, D.Y. R basics [Online]. Illinois State University.
Available at: http://math.illinoisstate.edu/dhkim/rstuff/rtutor.html (verified 8 Sept 2011).
• Martinez, M. R for biologists [Online]. The R Project for Statistical Computing. Available at: http://cran.r-project.org/doc/contrib/Martinez-RforBiologistv1.1.pdf (verified 8 Sept 2011).
• Verzani, J. SimpleR – Using R for introductory statistics [Online]. The R Project for Statistical Computing. Available at: http://cran.r-project.org/doc/contrib/Verzani-SimpleR.pdf (verified 8 Sept 2011).

Learn More – In Person
• Summer Institute for Statistical Genetics (SISG) at the University of Washington - http://www.biostat.washington.edu/suminst/sisg/general
• useR! Conference - http://www.r-project.org/conferences.html

Learn More – General Texts
• Adler, J. 2010. R in a nutshell: a desktop quick reference. O‟Reilly, Sebastapol, CA.
• Crawley, M. 2007. The R book. Wiley, Hoboken, NJ.
• Dalgaard, P. 2008. Introductory statistics with R. Springer-Verlaugh, NY.
• Zuur, A. F., E. N. Leno, and E.H.W.G. Meesters. 2009. A beginner‟s guide to R. Springer, NY.

Learn More – Importing Data
• R Development Core Team. R Data import/export [Online]. The Comprehensive R Archive Network. Available at: http://cran.r-project.org (verified 9 Sept 2011).

Learn More – Graphics
• Murrell, P. 2006. R graphics. Chapman & Hall/CRC, NY.

Learn More – lme4 Package
• Bates, D., M. Maechler, and B. Bolker. 2011. Package „lme4‟ [Online]. The R Project for Statistical Computing. Available at: http://cran.r-project.org/web/packages/lme4/lme4.pdf (verified 13 Sept 2011).

Learn More – Programming in R
• Cock, P. Programming in R [Online]. Molecular Organization and Assembly in Cells, The University of Warwick. Available at: http://www2.warwick.ac.uk/fac/sci/moac/degrees/modules/ch923/r_introduction/r_programming (verified 14 Sept 2011).

Acknowledgements
• David Francis, The Ohio State University • Debora Liabeuf, The Ohio State University • Sung-Chur Sim, The Ohio State University • Walter De Jong, Cornell University
• John McQueen, Oregon State University –
Technical Support • Michael Coe, Cedar Lake Research Group -
Evaluator

Supplemental Files
• Color data collected in Ohio in 2009 – 2009OHColorSample.xls
• Color data collected in Ohio in 2010 – 2010OHColorSample.xls
• Script file – Script2009OHColorSample.txt
• All files available at: http://www.extension.org/pages/60427/

Please fill out the survey evaluation! (You will be
contacted via email)


![Rice Molecular Breeding Laboratories in the Genomics Era ...downloads.hindawi.com/journals/ijpg/2008/524847.pdf · plant breeding” or “genomics-assisted breeding” [14]. However,](https://img.dokumen.tips/doc/110x75/601839f33688bf08b23767ac/rice-molecular-breeding-laboratories-in-the-genomics-era-plant-breedinga-or.jpg)