Embed Size (px)
Citation preview

Welcome to QM 2113-003
Business Statistics

Course Objectives: Again
1. To gain an understanding of descriptive statistics, probability, sampling, interval estimation, hypothesis testing, and linear regression.
2. To perform applications of statistical methods to business problems using the spreadsheet software Excel.

Some statistics•The top 3 makers of breakfast cereal account for 95 percent of domestic sales.
•The average price of a movie ticket is $5.60.
•The dollar has lost 35 percent of its value against the euro since 2001.
•20 percent of New York City students dropped out of school in academic year 2003-2004.
•Industrial production in China increased by 15.7 percent in 2004.
•E-commerce sites spend an average of $108 to acquire a new customer.

Statistics is the art and science of
collecting, analyzing,
presenting, and interpreting data.

Applications in Business & Economics
•Accounting: Auditing function, for example, relies on statistical sampling techniques.
•Finance: Portfolio managers use a variety of statistics, such as the price/earnings ratio, to determine if shares are properly valued by the market.
•Marketing: Market studies used for decision making about store or restaurant location, product lines or services sold, involve statistical analysis.

Applications in Business & Economics: Continued
•Production: Bottling plants use X-bar charts to prevent over or under filling—i.e., make sure that the average number of ounces falls within acceptable limits.
•Economics: Economists use statistical techniques to forecast important variables such as inflation or unemployment.

Elements, Variables, and Observations
•Elements are the entities on which data is collected.
•Variables are characteristics of interest for elements.
•Observations are the measurements for a particular element.

Student High School
Height Weight
Robert Lincoln 5’11” 170 lbs.
Portia Southside 5’7” 120 lbs.
Edward Oak Ridge 6’2” 198 lbs.
•Students are the elements.
•High school, height and weight are the variables.
•5’11”, 120 lbs, etc. are the observations.

Nominal and Ordinal Scales
•The scale of measurement for a variable is a nominal scale when the data are labels or names used to identify an attribute of the element.
•The scale of measurement is an ordinal scale if the order or rank of the data is meaningful.

Student High School
Height Weight
Robert Lincoln 5’11” 170 lbs.
Portia Southside 5’7” 120 lbs.
Edward Oak Ridge 6’2” 198 lbs.
•The scale of measurement for the high school variable is nominal.
•Scales of measurement for the height and weight variables are ordinal.

Scales of Measurement
•The data have the properties of ordinal data, andThe data have the properties of ordinal data, and the interval between observations is expressed inthe interval between observations is expressed in terms of a fixed unit of measure.terms of a fixed unit of measure.
•Interval data are Interval data are always always numeric.numeric.
Interval
Example:Example: Melissa has an SAT score of 1205, while KevinMelissa has an SAT score of 1205, while Kevin has an SAT score of 1090. Melissa scored 115has an SAT score of 1090. Melissa scored 115 points more than Kevin.points more than Kevin.
Example:Example: Melissa has an SAT score of 1205, while KevinMelissa has an SAT score of 1205, while Kevin has an SAT score of 1090. Melissa scored 115has an SAT score of 1090. Melissa scored 115 points more than Kevin.points more than Kevin.
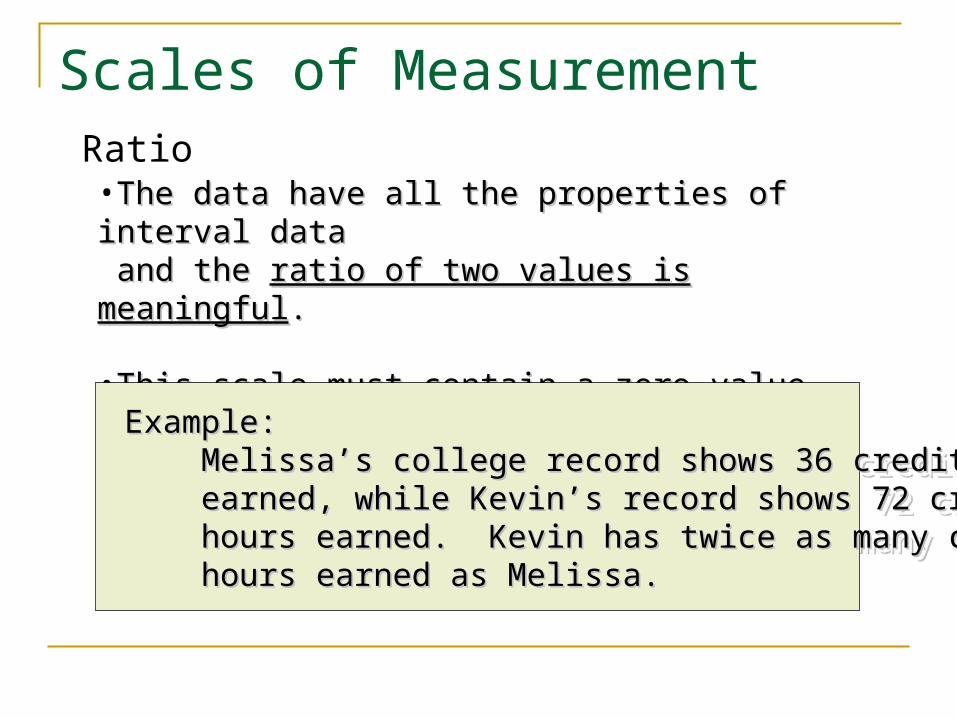
Scales of MeasurementRatio•The data have all the properties of interval dataThe data have all the properties of interval data and the and the ratio of two values is meaningfulratio of two values is meaningful..
•This This scale must contain a zero valuescale must contain a zero value that indicates that indicates that nothing exists for the variable at the zero pointthat nothing exists for the variable at the zero point
Example:Example: Melissa’s college record shows 36 credit hoursMelissa’s college record shows 36 credit hours earned, while Kevin’s record shows 72 credit earned, while Kevin’s record shows 72 credit hours earned. Kevin has twice as many credithours earned. Kevin has twice as many credit hours earned as Melissa.hours earned as Melissa.
Example:Example: Melissa’s college record shows 36 credit hoursMelissa’s college record shows 36 credit hours earned, while Kevin’s record shows 72 credit earned, while Kevin’s record shows 72 credit hours earned. Kevin has twice as many credithours earned. Kevin has twice as many credit hours earned as Melissa.hours earned as Melissa.

Qualitative and Quantitative Data
•Qualitative, or categorical, data are labels or names used to identify an attribute of each element. Can be numeric or non-numeric.
•Quantitative data are numeric values indicating how much or how many.

Student High School
Height Weight
Robert 1 5’11” 170 lbs.
Portia 2 5’7” 120 lbs.
Edward 3 6’2” 198 lbs.
•High School remains a qualitative variable—even though we are now labeling it with numbers.
•Arithmetic operations for numeric qualitative variables are meaningless.

Scales of MeasurementScales of Measurement
QualitativeQualitativeQualitativeQualitative QuantitativQuantitativee
QuantitativQuantitativee
NumericalNumericalNumericalNumerical NumericalNumericalNumericalNumericalNonnumericalNonnumericalNonnumericalNonnumerical
DataDataDataData
NominaNominallNominaNominall
OrdinaOrdinallOrdinaOrdinall
NominalNominalNominalNominal OrdinalOrdinalOrdinalOrdinal IntervalIntervalIntervalInterval RatioRatioRatioRatio
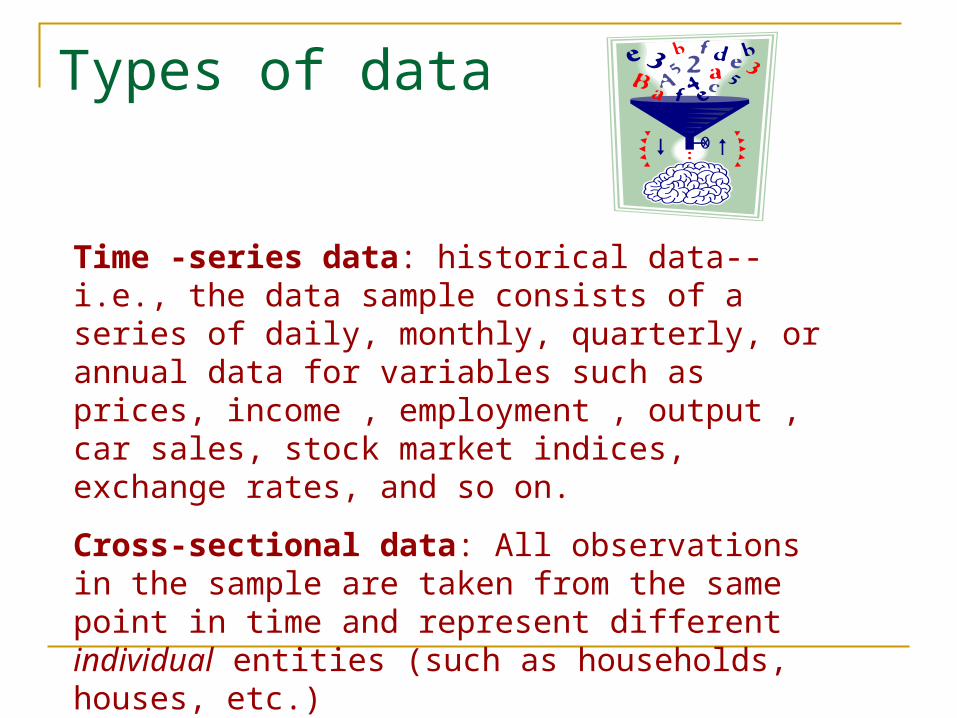
Time -series data: historical data--i.e., the data sample consists of a series of daily, monthly, quarterly, or annual data for variables such as prices, income , employment , output , car sales, stock market indices, exchange rates, and so on.
Cross-sectional data: All observations in the sample are taken from the same point in time and represent different individual entities (such as households, houses, etc.)
Types of data

Year Month Day Won per Dollar1997 3 10 8771997 3 11 880.51997 3 12 879.51997 3 13 880.51997 3 14 881.51997 3 17 8821997 3 18 8851997 3 19 8871997 3 20 886.51997 3 21 8871997 3 24 8901997 3 25 891
Time series data: Daily observations, Korean Won per dollar

Student ID Sex Age Height Weight
777672431 M 21 6’1” 178 lbs.
231098765 M 28 5’11” 205 lbs.
111000111 F 19 5’8” 121 lbs.
898069845 F 22 5’4” 98 lbs.
000341234 M 20 6’2” 183 lbs
Example of cross sectional data

Time-series graph

CO
UN
TRY
Austria
Belgium
Britain
Canada
France
Germany
Italy
Japan
Spain
Sweden
U.S.
Unemployment rate (percent)
16.014.012.010.08.06.04.02.0
4.1
4.7
14.1
4.8
11.2
9.6
9.8
6.6
5.7
10.1
3.8
Unemployment rates in industrialized countries, May 2000
Source: The Economist
Cross-section graph

Descriptive Statistics
Summaries of data that can be in tabular, graphical, or numerical form.

Example: Hudson Auto RepairExample: Hudson Auto Repair
The manager of Hudson AutoThe manager of Hudson Auto
would like to have a betterwould like to have a better
understanding of the costunderstanding of the cost
of parts used in the engineof parts used in the engine
tune-ups performed in thetune-ups performed in the
shop. She examines 50shop. She examines 50
customer invoices for tune-ups. The costs of customer invoices for tune-ups. The costs of parts,parts,
rounded to the nearest dollar, are listed on the rounded to the nearest dollar, are listed on the nextnext
slide.slide.

91 78 93 57 75 52 99 80 97 6271 69 72 89 66 75 79 75 72 76104 74 62 68 97 105 77 65 80 10985 97 88 68 83 68 71 69 67 7462 82 98 101 79 105 79 69 62 73
91 78 93 57 75 52 99 80 97 6271 69 72 89 66 75 79 75 72 76104 74 62 68 97 105 77 65 80 10985 97 88 68 83 68 71 69 67 7462 82 98 101 79 105 79 69 62 73
Example: Hudson Auto RepairExample: Hudson Auto Repair
Sample of Parts Cost for 50 Tune-upsSample of Parts Cost for 50 Tune-ups

Tabular Summary: Frequency and Percent Frequency
50-5950-59
60-6960-69
70-7970-79
80-8980-89
90-9990-99
100-109100-109
22
1313
1616
77
77
55
5050
44
2626
3232
1414
1414
1010
100100
(2/50)10(2/50)1000
PartsParts Cost ($)Cost ($)
PartsParts FrequencyFrequency
PercentPercentFrequencyFrequency

Graphical Summary: Histogram
PartsCost ($)PartsCost ($)
22
44
66
88
1010
1212
1414
1616
1818
Fre
qu
en
cy
Fre
qu
en
cy
50 60 70 80 90 100 110 12050 60 70 80 90 100 110 120
Tune-up Parts CostTune-up Parts Cost
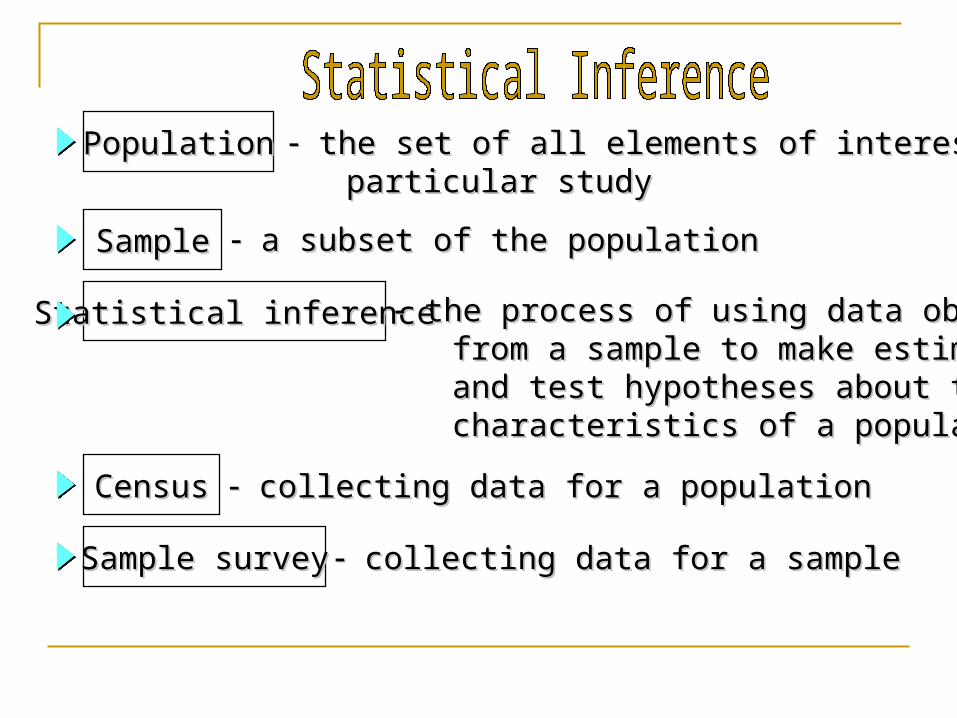
PopulationPopulation
SampleSample
Statistical inferenceStatistical inference
CensusCensus
Sample surveySample survey
the set of all elements of interest in athe set of all elements of interest in a particular studyparticular study
a subset of the populationa subset of the population
the process of using data obtainedthe process of using data obtained from a sample to make estimatesfrom a sample to make estimates and test hypotheses about theand test hypotheses about the characteristics of a populationcharacteristics of a population
collecting data for a populationcollecting data for a population
collecting data for a samplecollecting data for a sample
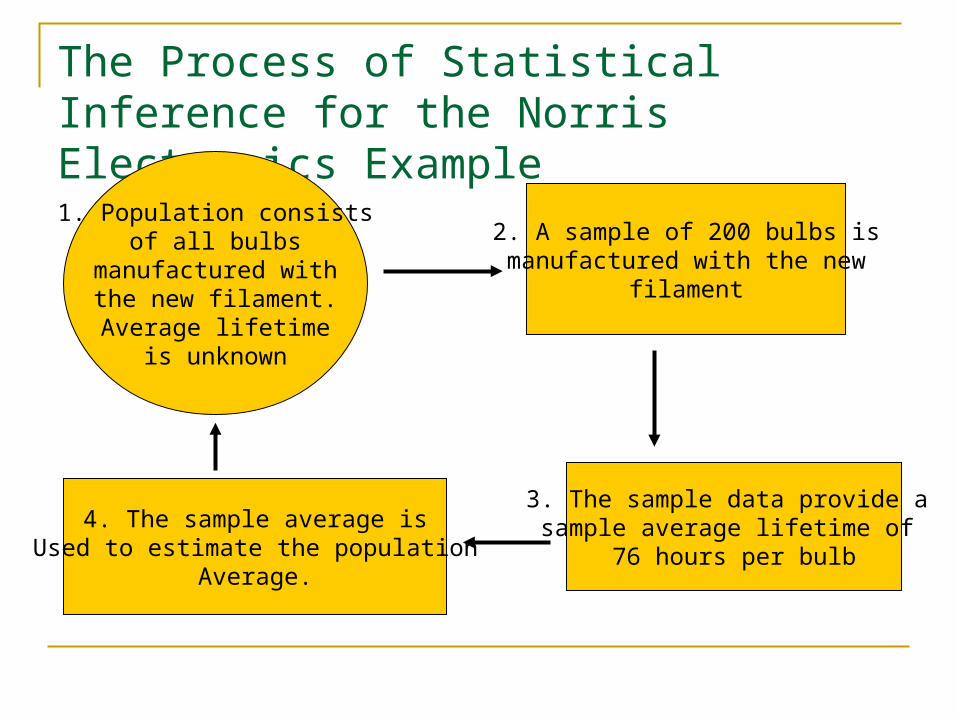
The Process of Statistical Inference for the Norris Electronics Example
1. Population consistsof all bulbs
manufactured with the new filament.Average lifetime
is unknown
2. A sample of 200 bulbs ismanufactured with the new
filament
3. The sample data provide a sample average lifetime of
76 hours per bulb
4. The sample average isUsed to estimate the population
Average.

107 85 70 60 82 89 75 89 66 91 86 94 77 61 77 65
54 78 66 80 79 63 67 77 68 77 88 93 71 62 58 58
66 90 71 67 88 74 65 72 85 63 80 77 84 85 88 76
62 81 64 83 74 85 99 81 83 68 77 77 93 59 74 71
74 62 96 94 79 65 77 64 74 71 89 78 89 61 83 86
92 70 77 89 78 84 76 57 73 79 62 72 68 82 92 92
75 66 87 76 88 66 96 98 73 65 83 81 59 79 59 45
65 78 72 84 71 59 73 98 73 73 81 87 64 72 68 75
81 75 76 68 71 74 71 86 65 88 94 84 94 68 61 102
83 86 79 64 61 85 92 69 62 62 101 92 62 70 82 76
78 72 63 68 72 75 98 81 116 75 76 66 61 84 59 65
90 67 97 103 63 69 79 70 67 79 89 63 78 62 51 73
96 68 70 71 43 82 65 63
The Sample
Hours Until Burnout

Statistical Analysis Using Microsoft Excel
1.Enter the data in the Excel Spreadsheet
2.Enter functions and formulas
3.Apply tools