Embed Size (px)
Citation preview

Assembly and comparison of two closely related Brassica napus
genomes
Authors: Philipp E. Bayer1, Bhavna Hurgobin1,2, Agnieszka A. Golicz2, Chon-Kit Kenneth
Chan1, Yuxuan Yuan1, HueyTyng Lee1,2, Michael Renton1, Jinling Meng3, Ruiyuan Li3, Yan
Long3, Jun Zou3, Ian Bancroft4, Boulos Chalhoub5, Graham J. King3,6, Jacqueline Batley1,
David Edwards1
Author affiliations:
1 School of Plant Biology, The University of Western Australia, Stirling Highway, Crawley,
WA 6009, Australia
2 Australian Centre for Plant Functional Genomics, School of Agriculture and Food Sciences,
University of Queensland, St. Lucia, QLD 4072, Australia
3 National Key Laboratory of Crop Genetic Improvement, Key Laboratory of Rapeseed
Genetic Improvement, Ministry of Agriculture P. R. China, Huazhong Agricultural
University, Wuhan, China
4 Department of Biology, University of York, York, UK
5 Organization and Evolution of Plant Genomes, Unité de Recherche en Génomique
Végétale, Unité Mixte de Recherche 1165 (Institut National de Recherche Agronomique,
Centre National de la Recherche Scientifique, Université Evry Val d’Essonne), Evry 91057,
France
6 Southern Cross Plant Science, Southern Cross University, Lismore, NSW 2480, Australia
1
Corresponding author: David Edwards, School of Plant Biology, The University of Western
Australia, Stirling Highway, Crawley, WA 6009, Australia. Tel: +61 (0)8 6488 2415 E-mail:
Word count: 5,704
E-mail addresses in order of authors
2
Running title: Assembly of Brassica napus genomes
Keywords: Genome assembly, whole genome comparison, genotyping by sequencing,
genome assembly improvement, Brassica napus, Tapidor, contigPlacer
3

Abstract
As an increasing number of plant genome sequences become available, it is clear that gene
content varies between individuals, and the challenge arises to predict the gene content of a
species. However, genome comparison is often confounded by variation in assembly and
annotation. Differentiating between true gene absence and variation in assembly or
annotation is essential for the accurate identification of conserved and variable genes in a
species.
Here we present the de novo assembly of the B. napus cultivar Tapidor and comparison with
an improved assembly of the B. napus cultivar Darmor-bzh. Both cultivars were annotated
using the same method to allow comparison of gene content. We identified genes unique to
each cultivar and differentiate these from artefacts due to variation in the assembly and
annotation. We demonstrate that using a common annotation pipeline can result in different
gene predictions, even for closely related cultivars, and repeat regions which collapse during
assembly impact whole genome comparison. After accounting for differences in assembly
and annotation, we demonstrate that the genome of Darmor-bzh contains a greater number of
genes than the genome of Tapidor.
Our results are the first step towards comparison of the true differences between B. napus
genomes and highlight the potential sources of error in the future production of a B. napus
pangenome.
4
Introduction
Brassica is a genus which contains economically important crop species, including
condiments such as mustards; vegetable crops including broccoli, Brussels sprouts, cabbage,
cauliflower; and commercially important oilseeds which are used as both a food and biofuel.
The genomes of the Brassica family are related as described in the triangle of U (Nagaharu
1935). There are three diploid Brassica-species, B. rapa (AA, n=10), B. nigra (BB, n=8), and
B. oleracea (CC, n=9), and these genomes evolved from a common ancestor which
underwent at least one whole genome triplication (Lysak et al. 2005). Combinations of these
genomes result in three amphidiploid Brassica species: B. juncea (AABB, n=18), B. carinata
(BBCC, n=17) and B. napus (AACC, n=19). Several Brassica genome assemblies have now
been published, including the A genome of the B. rapa cultivar Chiifu (Wang et al. 2011), the
C genome of the B. oleracea cultivars A2 (Liu et al. 2014) and TO1000 (Parkin et al. 2014),
the AACC genome of the B. napus cultivar Darmor-bzh (Chalhoub et al. 2014) and the BB
and AABB genome of B. nigra and B. juncea (Yang et al. 2016).
Early indications of significant differences in genome content between individuals was
apparent from data obtained from RFLP and SSR analysis in Brassica species, where a
relatively large number of null alleles were detected with co-dominant molecular assays
(Udall et al. 2005). With the increased application of next generation DNA sequencing
technology, these genomic differences are becoming more apparent and there is a growing
understanding that a single genome does not reflect the gene content of a species. Following
the production of reference genome assemblies, searchers are moving towards the
characterisation of pangenomes, representing the gene content of a species, including core
genes which are found in all individuals and variable genes which are only present in some
individuals (Golicz et al. 2015). Variable genes can be split into two groups: copy number
5

variations (CNVs), in which the number of copies of a gene differs between individuals, and
presence/absence variations (PAVs), an extreme form of CNV in which a gene is present in
some individuals but absent in others (Saxena et al. 2014, Golicz et al. 2016).
Gene presence/absence variation is important for crop improvement as some variable genes
have been shown to be associated with agronomic traits. In rice, comparison of three
divergent lines led to the identification of several variable genes including the submergence
tolerance gene Sub1A which is absent in submergence intolerant lines (Schatz et al. 2014). A
recent study investigated the pangenome for 1,483 rice accessions and found 1,913 high
confidence dispensable genes, out of which 1,489 were expressed (Yao et al. 2015). A
genome wide association study (GWAS) with SNPs for those rice accessions found that
23.5% of metabolic traits had higher association signals with SNPs located on dispensable
genes than with SNPs located on the core reference genome. Similarly, comparison of three
Brassica rapa morphological variations (turnip, rapid cycling, Chinese cabbage) revealed
around 1,224 unique genes in each of the three genomes (Lin et al. 2014), while another
recent study produced low coverage sequence data for 199 B. rapa and 119 B. oleracea
accessions to identify SNPs and trace parallel selection signals in the two subgenomes
(Cheng et al. 2016). Regions undergoing positive selection could be identified (25 in B. rapa
and 58 in B. oleracea), out of which 9 were shared between the genomes.
In chickpea, the re-sequencing of 16 lines identified up to 32 genes absent in each line (Thudi
et al. 2016), while a comparison of 503 inbred maize lines demonstrated that only 16.4% out
of 8,681 representative transcripts were expressed in all lines (Hirsch et al. 2014). Recently,
Golicz et al (2016) identified 61,379 genes in a Brassica oleracea pangenome study, of
which 18.7% demonstrated presence/absence variation among individuals, and with the
variable genes being enriched for annotations associated with important agronomic traits.
6
The repetitive content of plant genomes makes genome assembly and validation a challenge
(Edwards et al., 2013). Assemblers often cannot accurately assign sequence reads from
repetitive regions to their correct genomic location, and repeat sequences in the genome
frequently collapse into a single copy in the assembly. In addition, different annotation results
may confound comparative analyses as some genes may not be predicted in some cultivars
even if they share significant sequence identify with genes predicted in other cultivars. These
factors impact the direct comparison of whole genome assemblies for complex crop genomes
and make the assessment of species pangenomes a major challenge.
Here we describe the de novo assembly and annotation of the amphidiploid B. napus cultivar
Tapidor and comparison with an improved and reannotated assembly of the published B.
napus cultivar Darmor-bzh (Chalhoub et al. 2014). Comparison of the gene content between
Darmor-bzh and Tapidor identified genes that are conserved or unique to each cultivar. In
addition, we identified genes which appear to be absent in one or other cultivar due to
variation in assembly or annotation. Our results present a detailed assessment and comparison
of assemblies for complex B. napus genomes, the first step towards establishing a B. napus
pangenome. These finding highlight the differences which may be observed between
cultivars and demonstrate the challenges in producing a future B. napus pangenome.
Results
The B. napus Darmor-bzh and Tapidor genome assemblies
The published Darmor-bzh assembly (Chalhoub et al. 2014) consists of 19 pseudomolecules
anchored to a high resolution genetic map, as well as 19 collections of contigs assigned to a
chromosome but not placed, and 3 collections of contigs that are not assigned to any
pseudomolecule. In total, the 19 pseudomolecules have a combined length of 850 Mbp which
includes 204 Mbp remaining in 22 unplaced collections. K-mer based predictions for both
7
assembly size and genome size were calculated. Using all Darmor-bzh reads and all Tapidor
reads as input, k-mer based genome assembly size prediction estimated an assembly size of
808 Mbp for Darmor-bzh and 697 Mbp for Tapidor, while k-mer based genome size
prediction suggested a genome size of 1,345 Mbp for Darmor-bzh and 1,335 Mbp for
Tapidor.
The SkimGBS pipeline (Bayer et al. 2015) was applied to improve the published Darmor-bzh
assembly. This predicted 1,006,985 SNPs and called 38,471,969 genotypes across 92
individuals of the Tapidor x Ningyou-7 population, using the published Darmor-bzh assembly
as the reference. Using this data, contigPlacer added 8,820 previously unplaced contigs into
the Darmor-bzh pseudomolecules, increasing their length by 153 Mbp (23.6%) (Table 1). It
was not possible to place 10,981 contigs (51.3 Mbp), out of which 10,486 carried no SNPs,
and 495 had conflicting pseudomolecule locations. Unplaced contigs placed on two different
pseudo-molecules had an average size of 7,244 bp ranging from 2,004 bp to 98,348 bp. Of
the contigs with a previously assigned pseudomolecule, 98% were placed within their
predicted pseudomolecule (Supplementary Table 1).
The B. napus cultivar Tapidor was assembled de novo using paired end and mate paired
Illumina sequencing data with a range of insert sizes. The sequence data was first cleaned
prior to assembly. From 417,527,199 Tapidor read pairs, 54,030,058 (12.9%) were identified
as clonal and removed. Quality control using sickle (Joshi and Fass 2011) discarded a further
414,133 read pairs and 2,917,744 single reads, while computational normalization using
khmer (Brown et al. 2012, Crusoe et al. 2015) removed another 134,597,316 read pairs
bringing the final number of read pairs for assembly to 258,028,009. These were assembled
using VelvetOptimiser (Gladman and Seemann 2012) in conjunction with Velvet (Zerbino et
al. 2008) and a k-mer value of 71. After removal of contigs smaller than 1000 bp the
8
assembly contained 21,280 contigs with an N50 of 197,031 bp and a total size of 634.19
Mbp.
To produce pseudomolecules for Tapidor, the contigs were sorted by comparison with the
improved Darmor-bzh pseudomolecules, placing 18,087 contigs into 19 pseudomolecules
with a total length of 616.7 Mbp, with 3,193 (19.5 Mbp) unplaced contigs. Using this Tapidor
assembly, the SkimGBS pipeline predicted 945,406 SNPs and called 35,829,337 genotypes
for the Tapidor x Ningyou-7 population. ContigPlacer then placed an additional 452 Tapidor
contigs into pseudomolecules, bringing the total size of the Tapidor pseudomolecules to
625.9 Mbp, with 2,741 contigs (8.2 Mbp) remaining unplaced, none of which contained SNPs
(Table 1, Supplementary Table 1). A comparison of the Darmor-bzh and Tapidor assemblies
showed a near perfect overlap, with secondary overlaps due to sequence identity between
homeologous chromosomes (Supplementary Figure 1). A high resolution genetic map using
the Tapidor x Ningyou-7 DH population and MSTMap (Wu et al. 2008) placed 318.9 Mbp
(50.1%) of the Tapidor assembly into 19 linkage groups, and the order of these contigs
agreed with the placement of contigs using the Darmor-bzh reference (Supplementary Figure
2).
To assess and compare the completeness of the two genome assemblies, CEGMA (Parra et al.
2007) was used to identify core eukaryotic genes (CEGs), and BUSCO (Simão et al 2015)
was used with the Plants profile to identify Single-Copy Orthologs (SCOs). All 248 CEGs
aligned completely with the Darmor-bzh assembly, while only 246 CEGs aligned completely
with the Tapidor assembly, with the remaining two partially identified in the assembly. Of the
956 BUSCO groups, 925 and 904 appeared at least once in Darmor-bzh and Tapidor
respectively. In Darmor-bzh, 862 BUSCOs appeared more than once with an average copy
number of all BUSCOs of 2.2, while for Tapidor, 634 BUSCOs appeared more than once
with an average copy number of 1.8. In Darmor-bzh, 26 BUSCOs were missing and 5 were
9
fragmented, while in Tapidor 31 BUSCOs were missing with an additional 21 fragmented.
RepeatModeler identified 310,192,450 bp (36.48%) repeats in Darmor-bzh and 223,636,559
bp (35.15%) repeats in Tapidor. LTR/Gypsy was the most common repetitive element in both
assemblies, with 97,597 copies in Darmor-bzh and 92,747 copies in Tapidor (Supplementary
Table 2).
Gene-level comparison between Darmor-bzh and Tapidor
Both genome assemblies were annotated using identical publicly available gene, EST, RNA-
Seq and protein data. Genes shorter than 100 bp, with an AED score of 1 (no evidence
support for the annotation), or carrying transposase-related PFAM domains were removed.
The resulting AUGUSTUS high confidence gene sets contained 80,382 predicted genes for
Darmor-bzh (37,220 on the A and 39,334 on the C pseudomolecules, 3,228 on unplaced
contigs), and 70,162 predicted genes for Tapidor (31,969 on the A and 37,562 on C
pseudomolecules, 631 on unplaced contigs) (Table 1).
We compared the gene content between assemblies across each pair of homologous
chromosomes. In Darmor-bzh, 76,968 out of 77,154 genes (99.7%) located on
pseudomolecules had sequence identity with Tapidor genes. Out of these, 65,280 were
located in collinear blocks of at least 5 genes in the respective Tapidor pseudomolecule. Of
the 11,688 genes with no partners in collinear blocks 2,458 matched sequence on the
expected chromosome, out of which 701 matched the expected chromosomal region. In
Tapidor, 69,372 out of 69,531 genes (99.7%) showed sequence identity with Darmor-bzh
genes, with 59,099 genes in collinear blocks of at least five genes. Of the 10,903 genes with
no partners in collinear blocks, 2,103 matched with the expected chromosome, out of which
524 matched within the expected range.
10
To further assess the differences in predicted gene content, we aligned sequence reads from
both cultivars to each of the assemblies. Based on genomic read mapping, three Tapidor
genes were predicted to be absent in Darmor-bzh, while 73 Darmor-bzh genes were predicted
to be absent in Tapidor (Table 1). The genes predicted to be absent were compared with
Darmor-bzh, Tapidor, Ningyou-7 and Tapidor x Ningyou-7 RNA-Seq data. Of the 73 genes,
21 (29%) showed no expression in Darmor-bzh or Tapidor, 19 (26%) were expressed in
Darmor-bzh but neither Tapidor nor Ningyou-7, 27 (37%) were expressed in Darmor-bzh and
Ningyou-7 but not in Tapidor, and expression segregated in the Tapidor x Ningyou-7 DH
population, 2 (2.7%) were expressed in Tapidor and Ningyou-7 but not in Darmor-bzh, while
4 (5.5%) were expressed in all tissues in cases (Supplementary Table 3). The 3 genes
predicted to be absent in Darmor-bzh but not in Tapidor were not expressed in Darmor-bzh,
Ningyou-7 or Tapidor (Supplementary Table 4).
Proteins encoded by genes predicted to be absent in one of the two cultivars were compared
with Swiss-Prot and checked for enriched GO-terms. In genes present in Darmor-bzh but not
in Tapidor, terms such as ‘RNA splicing’ and ‘floral meristem growth’ were enriched (p <
0.05, Supplementary Table 5). The 3 genes predicted to be present in Tapidor but not in
Darmor-bzh had no Swiss-Prot hits and therefore, transfer of GO annotation was not possible.
Assessment of repetitive and collapsed assembly regions
Using the differential comparative read mapping pipeline CoReFinder, we identified 30,200
and 26,812 collapsed regions longer than 50 bp, with a total length of 12,495,844 bp and
10,522,089 bp and average sizes of 413 bp and 392 bp in the Darmor-bzh and Tapidor
assemblies respectively (Figure 1, Supplementary Table 6). We also identified 43,775 and
2,191 repetitive regions, where the sequence is represented more than once in the assembly,
totalling 31,807,543 bp and 972,605 bp, with an average of 720 bp and 437 bp in Darmor-bzh
and Tapidor respectively (Figure 2, Supplementary Table 7).
11
Genes were identified in both the collapsed and repetitive regions of the Darmor-bzh and
Tapidor assemblies. In Darmor-bzh, 2,455 genes (3.1%) were located in collapsed regions
and 5,703 (7.1%) were located in repetitive regions, while in Tapidor, 2,651 genes (3.8%)
were located in collapsed regions and 246 (0.4%) were located in repetitive regions
(Supplementary Table 8). In Tapidor, chromosome A2 and C2 carried the largest number of
collapsed genes (410, 15% and 245, 9.2%) while in Darmor-bzh, chromosomes A3 and C3
carried the largest number of collapsed genes (212, 8.6% and 222, 9.0%). In Darmor-bzh, the
chromosomes A3 and C3 carried the largest number of repetitive genes (588, 10.3% and 470,
8.2%) while chromosomes A1 and C1 carried the most repetitive genes in Tapidor (26,
10.5% and 28, 11.4%).
Pfam protein domains and UniProtKB/Swiss-Prot hits were identified for genes located in
repetitive and collapsed regions in both assemblies. Both sets of results were compared
between Darmor-bzh and Tapidor in order to identify any common patterns that may lead to
problems in genome assemblies. The largest number of shared Pfam domains and shared
Swiss-Prot hits was between genes located in repetitive regions in Darmor-bzh and genes
located in collapsed regions in Tapidor. In repetitive genes in Darmor-bzh, 10% of Pfam
domains overlapped with collapsed genes in Tapidor and Pfam domains collapsed in Darmor-
bzh, while only 0.5% of genes located in collapsed and repetitive regions in Tapidor shared
Pfam domains (Figure 3).
The repetitive genes in Darmor-bzh and collapsed genes in Tapidor contained repetitive
domains such as “Myb-like DNA-binding domain” or “pentatricopeptide repeat” (PPRs)
(Supplementary Table 9). A similar pattern was exhibited in shared Swiss-Prot hits where the
greatest overlap in terms of Swiss-Prot hits was between the set of proteins encoded by
Darmor-bzh genes located in collapsed regions and Tapidor genes located in repetitive
regions (Supplementary Figure 3). As with the Pfam domain overlaps, 10% of Swiss-Prot hits
12
were shared between repetitive genes in Darmor-bzh and collapsed genes in Tapidor. The
Swiss-Prot hits contained proteins such as “Myosin-6” or “Proline-rich receptor-like protein
kinase” (Supplementary Table 10).
Discussion
Brassica napus canola is an important global crop and a major source of vegetable oil for
human consumption. While genetic markers have been used for crop improvement for several
years (Hayward et al., 2012), the application of genomics is only now leading to improved
traits in the field. A major limitation of genomics based crop improvement is the lack of
available reference genome assemblies. The first public Brassica napus de novo whole
genome assembly was published in 2014, supported by a large multinational endeavour
(Chalhoub et al., 2014). Since this achievement, DNA sequencing and bioinformatics
technologies have advanced, and it has become increasingly accepted from studies in a wide
range of crop species that a single reference is insufficient to describe the gene content of a
species. To start to address this issue, we produced a second de novo whole genome assembly
for a closely related cultivar, B. napus Tapidor. Tapidor and Darmor-bzh both share Jet Neuf
as an ancestor, but Darmor-bzh additionally has the cultivar Bronowski in its direct ancestry
(Foisset et al. 1995), while Tapidor contains Bienvenu in its ancestry (Sharpe et al. 2003).
To permit a direct comparison between the Tapidor and Darmor-bzh genome assemblies, we
improved the published Darmor-bzh genome using high resolution skim genotyping by
sequencing (Bayer et al. 2015) to position previously unplaced contigs within
pseudomolecules. Both assemblies were then annotated using the same data and methods to
prevent confounding.
The assembly of the cultivar Tapidor was smaller (635 Mbp) compared with an assembly size
of 850 Mbp for Darmor-bzh (Table 1). By using k-mers to predict both the assembly size and
13
the genome size, we found that the estimated genome size was similar for both Darmor-bzh
(1,345 Mbp) and Tapidor (1,335 Mbp). In contrast, the predicted assembly size was similar
to, though smaller than the actual assembly size with an estimated 808 Mbp for Darmor-bzh
and 697 Mbp for Tapidor. The predicted genome size estimate accounts for coverage,
sequencing depth and unique k-mers, while the genome assembly estimates account only for
unique k-mers. The Tapidor sequence data contains fewer unique k-mers than the Darmor-
bzh sequencing data, which suggests that the Tapidor genome is actually smaller than the
Darmor-bzh genome. Both estimated genome sizes here are larger than the flow-cytometry
based estimations for different B. napus (AACC) cultivars of 1,129 to 1,235 Mbp
(Arumuganathan et al. 1991). While the predicted genome size difference probably reflects a
real difference in genome size, the discrepancy between the assembly size of Tapidor and
Darmor-bzh is probably due to the different sequencing technologies that were used for
assembly. Tapidor was assembled with short paired end sequences, while Darmor-bzh was
assembled using a combination of paired end, 454 and Sanger sequencing (Chalhoub et al.
2014). The consistent differences between the assembly sizes and predicted genome sizes is
common for genome assemblies and reflects the challenges of assembling the most repetitive
regions of the genome.
While there appears to be a real difference in the genome size of these two homozygous
individuals, we hypothesize that the different assembly methods cause the majority of
observed differences between the assemblies. The CEGMA results suggest that both
assemblies contain the majority of the gene content and that both assemblies are of high
quality. Both assemblies contain all core eukaryotic genes (CEGs), though two CEGs were
only partially present in Tapidor, which suggests that this assembly may be more fragmented.
Similarly, the BUSCO results show that both assemblies carry the majority of gene content,
with the Darmor-bzh assembly having more gene copies than Tapidor. This suggests that
14

some gene copies have collapsed in the Tapidor assembly which have not collapsed in the
Darmor-bzh assembly. The increased collapsing of regions in the Tapidor assembly compared
to the Darmor-bzh assembly is probably due to the use of long read 454 and Sanger sequence
data in the production of the Darmor-bzh assembly.
Both the genomes were annotated using the same methods and supporting data. Gene
prediction is dependent on a wide range of factors and the number of predicted genes is
influenced by the stringency of gene calling. To enable the most robust comparison of
predicted genes between these assemblies, we applied a relatively strict gene calling
approach. The number of predicted genes for Darmor-bzh is lower in our study than the
101,040 gene models originally predicted by Chalhoub et al. (2014), and this difference is
likely due to the more stringent methods of repeat masking employed, including the removal
of transposon-related and short genes.
As the Tapidor contigs were scaffolded based on the Darmor-bzh assembly, and both Tapidor
and Darmor-bzh have shared ancestry, we expected to see extensive collinearity between the
genome assemblies. We assessed this by comparison of genes present in collinear blocks
along the pseudomolecules. We also examined whether genes which were predicted to be
missing from collinear blocks were in fact missing or just remained unannotated. In Darmor-
bzh, 11,688 genes (14.5%) and in Tapidor 10,903 genes (15.5%) were not in collinear blocks
and were not identified in their expected regions, suggesting that they are either misplaced in
the assembly or are non-syntenic in the genome. Extensive homeologous recombination has
been observed in B. napus genes (Nicolas et al. 2007, Cai et al. 2014, Chalhoub et al. 2014)
which should explain some of the non-syntenic regions observed here.
As differences in genome assembly and annotation may suggest differences in gene content
which are not reflected in the actual genome, we investigated the number of genes predicted
15
to be absent in each cultivar based on raw data and independent of gene assembly or
annotation (Table 1). Mapping genomic sequence reads between references suggests that 73
genes are unique to Darmor-bzh and absent in Tapidor, while three genes are unique to
Tapidor and absent in Darmor-bzh. Out of the 73 genes predicted to be absent 27 (37%) were
expressed in Darmor-bzh and Ningyou-7 but not in Tapidor, with clear segregation in the
Tapidor x Ningyou-7 DH population, suggesting that these genes have been truly lost in
Tapidor but are present in Ningyou-7 (Supplementary Table 3). The 19 (26%) genes
expressed in Darmor-bzh but not in Tapidor or Ningyou-7 may also be absent in Ningyou-7,
or their expression may not be captured in the Darmor-bzh RNA-Seq libraries. Some error
remains, as 2 genes (2.7%) predicted to be absent in Tapidor and present in Darmor-bzh
appear to be expressed in Tapidor but not in Darmor-bzh, and 4 genes (5.5%) appear to be
expressed in all cultivars. These results may be due to the more relaxed mapping parameters
for the single RNASeq reads compared to the paired genomic sequence reads, leading to
erroneous read mapping and false calling of gene presence in the RNASeq analysis. Genes
which showed no expression in any of the cultivars assessed may be pseudogenes,
misannotated or only expressed in certain conditions or tissues which were not sampled
during RNA-Seq library preparation (Supplementary Table 4).
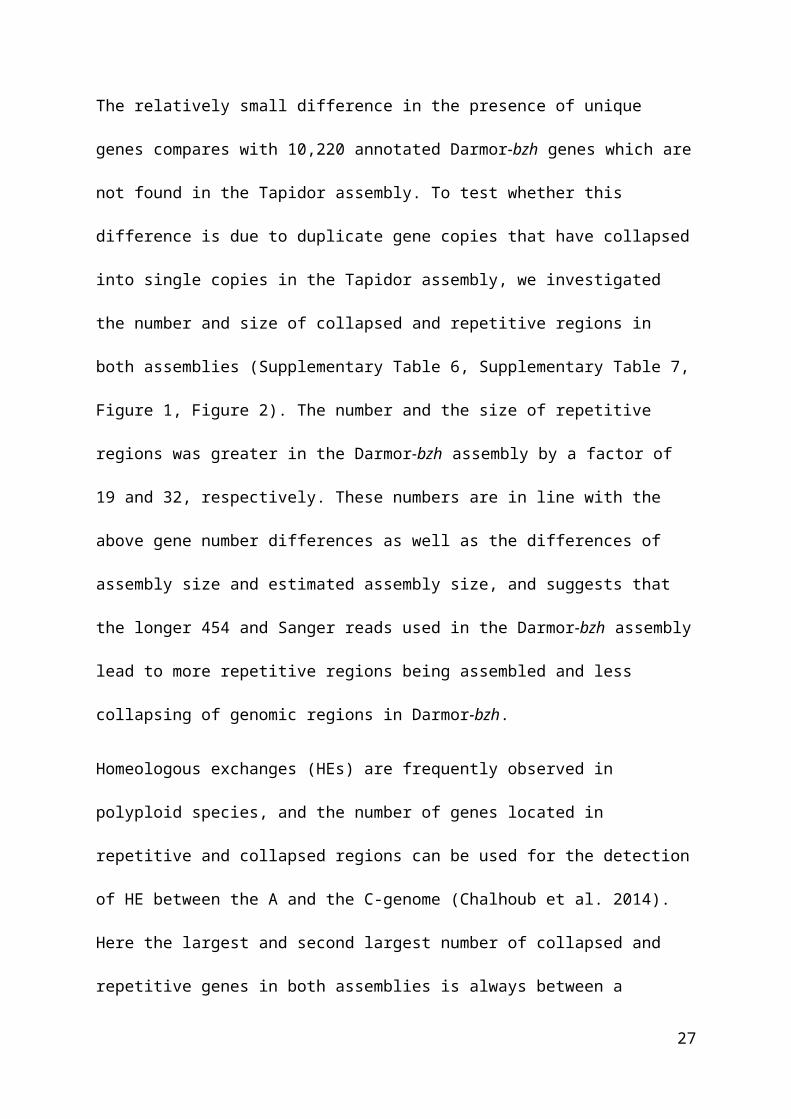
The relatively small difference in the presence of unique genes compares with 10,220
annotated Darmor-bzh genes which are not found in the Tapidor assembly. To test whether
this difference is due to duplicate gene copies that have collapsed into single copies in the
Tapidor assembly, we investigated the number and size of collapsed and repetitive regions in
both assemblies (Supplementary Table 6, Supplementary Table 7, Figure 1, Figure 2). The
number and the size of repetitive regions was greater in the Darmor-bzh assembly by a factor
of 19 and 32, respectively. These numbers are in line with the above gene number differences
as well as the differences of assembly size and estimated assembly size, and suggests that the
16
longer 454 and Sanger reads used in the Darmor-bzh assembly lead to more repetitive regions
being assembled and less collapsing of genomic regions in Darmor-bzh.
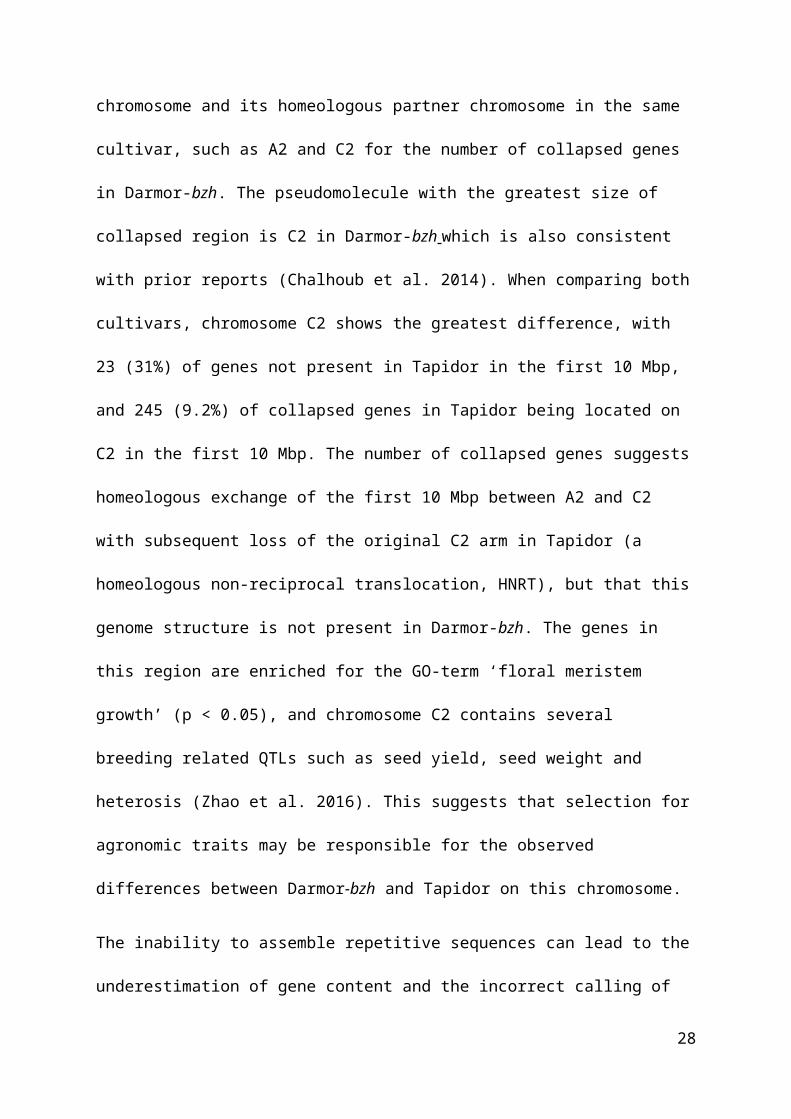
Homeologous exchanges (HEs) are frequently observed in polyploid species, and the number
of genes located in repetitive and collapsed regions can be used for the detection of HE
between the A and the C-genome (Chalhoub et al. 2014). Here the largest and second largest
number of collapsed and repetitive genes in both assemblies is always between a
chromosome and its homeologous partner chromosome in the same cultivar, such as A2 and
C2 for the number of collapsed genes in Darmor-bzh. The pseudomolecule with the greatest
size of collapsed region is C2 in Darmor-bzh which is also consistent with prior reports
(Chalhoub et al. 2014). When comparing both cultivars, chromosome C2 shows the greatest
difference, with 23 (31%) of genes not present in Tapidor in the first 10 Mbp, and 245 (9.2%)
of collapsed genes in Tapidor being located on C2 in the first 10 Mbp. The number of
collapsed genes suggests homeologous exchange of the first 10 Mbp between A2 and C2 with
subsequent loss of the original C2 arm in Tapidor (a homeologous non-reciprocal
translocation, HNRT), but that this genome structure is not present in Darmor-bzh. The genes
in this region are enriched for the GO-term ‘floral meristem growth’ (p < 0.05), and
chromosome C2 contains several breeding related QTLs such as seed yield, seed weight and
heterosis (Zhao et al. 2016). This suggests that selection for agronomic traits may be
responsible for the observed differences between Darmor-bzh and Tapidor on this
chromosome.
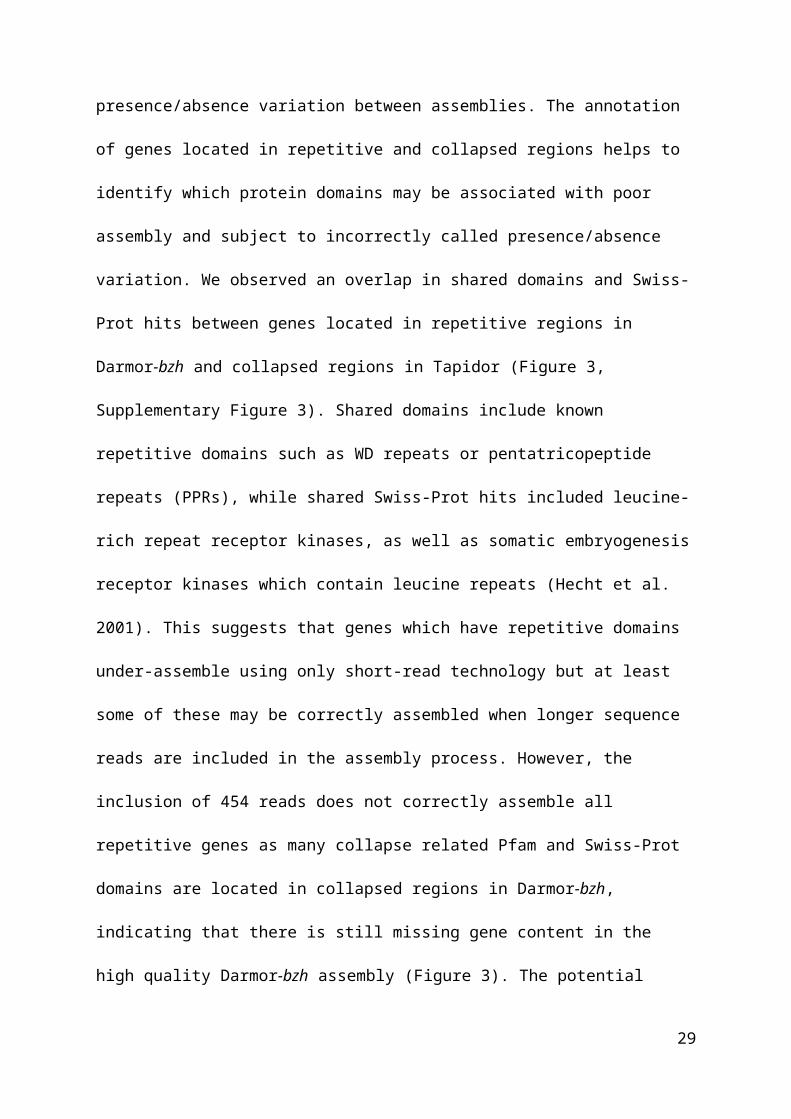
The inability to assemble repetitive sequences can lead to the underestimation of gene content
and the incorrect calling of presence/absence variation between assemblies. The annotation of
genes located in repetitive and collapsed regions helps to identify which protein domains may
be associated with poor assembly and subject to incorrectly called presence/absence
variation. We observed an overlap in shared domains and Swiss-Prot hits between genes
17
located in repetitive regions in Darmor-bzh and collapsed regions in Tapidor (Figure 3,
Supplementary Figure 3). Shared domains include known repetitive domains such as WD
repeats or pentatricopeptide repeats (PPRs), while shared Swiss-Prot hits included leucine-
rich repeat receptor kinases, as well as somatic embryogenesis receptor kinases which contain
leucine repeats (Hecht et al. 2001). This suggests that genes which have repetitive domains
under-assemble using only short-read technology but at least some of these may be correctly
assembled when longer sequence reads are included in the assembly process. However, the
inclusion of 454 reads does not correctly assemble all repetitive genes as many collapse
related Pfam and Swiss-Prot domains are located in collapsed regions in Darmor-bzh,
indicating that there is still missing gene content in the high quality Darmor-bzh assembly
(Figure 3). The potential collapsing of genomic regions containing important agronomic
genes is important for both future genome assembly projects as well as future pangenome
analysis as the capturing of all gene content which may play a role in agronomic performance
is important for the application of genomics assisted breeding.
The differential assembly of genes with repetitive domains along with the presence of
homeologous exchanges is likely to confound the assessment of gene presence variation
between individuals and the translation of this information for the agronomic improvement of
crop species. For example, there are several reports of variation in NBS LRR gene content
between individuals and that this may play an important role in the resistance or susceptibility
of crops to disease (Tollenaere et al. 2012, Wu et al. 2014). While the evidence suggests that
there is likely to be some true variation in the presence of these genes, it is important to
differentiate between true variation and assembly or annotation issues when interpreting the
biological function of these genes as assembly and annotation variation can confound gene
trait associations.
18
Conclusions
We have de novo assembled and annotated a second genome for the important oilseed crop
species, B. napus canola, and compared this with an improved and reannotated assembly of
the published cultivar Darmor-bzh (Chalhoub et al., 2014). We demonstrate that comparison
of gene content between individuals needs to account for differences in assembly and
annotation to avoid misinterpretation. Between the two assemblies, only three and 73
predicted genes represent real gene loss between these closely related cultivars, 524 and 701
(0.7 to 0.8%) are due to misannotation (i.e., the gene annotation process failed to identify a
gene in one assembly but predicted its presence in the other assembly), while 10,903 and
11,688 (14-15%) of the differences were due to either misplaced contigs or real gene
movement. Our results suggest that researchers comparing different genome assemblies
should not rely solely on the results of annotation pipelines but should also compare the
assemblies and the unassembled read data to differentiate between real differences and
artefacts. In particular, genes with repetitive domains may collapse leading to an
underestimation of gene copy number. By accounting for these potential errors it is possible
for future studies to establish an accurate pangenome for this important oilseed crop.
Methods
Darmor-bzh and Tapidor genome assemblies
All Tapidor reads were cleaned using sickle (Joshi and Fass 2011) and normalized using
khmer v1.0 normalize_by_median.py (Brown et al. 2012, Crusoe et al. 2015).
VelvetOptimiser (Gladman and Seemann 2012) was used with Velvet (Zerbino et al. 2008) to
assemble contigs. Contigs greater than 1 Kbp were sorted by comparison with the Darmor-
bzh assembly using blastn (Altschul et al. 1990) with an e-value of 1e-6. Contigs with two
highest-scoring alignments within 1% were unplaced. Contigs were then sorted by using
19
LASTZ (Harris 2007) and a custom script (LASTZSorter.py, available at
http://appliedbioinformatics.com.au/index.php/Darmor_Tapidor). MSTMap (Wu et al. 2008)
was used to calculate the genetic map using the unimputed SNPs of the DH population
(distance_function: kosambi, cut_off_p_value: 0.0000001, no_map_size 2, missing_threshold
0.1).
SGSautoSNP (Lorenc et al. 2012) was used with the SkimGBS pipeline (Bayer et al. 2015) to
call SNPs and genotypes using either the Tapidor or Darmor-bzh genome as reference
(Chalhoub et al. 2014). ContigPlacer was used to place unplaced contigs in the Darmor-bzh
and Tapidor assemblies and is available at https://github.com/philippbayer/contigPlacer.
Genome annotation
RepeatModeler v1.0.8 and RepeatMasker v4.0.6 (http://repeatmasker.org) together with
Repbase v were used to mask repeats. Gene models were produced using Tophat v2.1.0 and
cufflinks v2.2.0 (Kim et al. 2013), and annotation was performed using MAKER v2.31
(Cantarel et al. 2008). RNA-Seq data for the cultivars Tapidor, Ningyou and TN DH (Higgins
et al. 2012) were used together with Darmor-bzh RNA-Seq reads (Chalhoub et al. 2014).
CEGMA v2.5 (Parra et al. 2007) was used to annotate the Brassica oleracea C genome
(Parkin et al. 2014) with core gene models (COGs). The annotated core genes were used as
input for AUGUSTUS v3.0.2 (Keller et al. 2011). A set of ESTs from the 95k microarray
(Trick et al. 2009), Brassicaceae proteins from RefSeq, and Brassica rapa, Brassica oleracea
and Brassica napus unigenes from UniGene (NCBI Resource Coordinators 2013) were used
as evidence. Predicted genes with an AED-score of 1, shorter than 100 bp, or carrying
transposase-related domains were removed from subsequent analysis. Both assemblies were
assessed using CEGMA v2.5 (Parra et al. 2007) and BUSCO v1.1.b1 (Simão et al 2015) with
20
the early release plants dataset. Predicted transcripts and proteins were renamed according to
the standardised Brassica nomenclature (Østergaard et al. 2008).
Gene-level comparison between Darmor-bzh and Tapidor
MCScanX (Wang et al. 2012) was used to analyse collinearity between the Darmor-bzh and
Tapidor genes and to assign predicted genes to blocks of at least 5 colinear genes. Custom
scripts were used to parse the MCScanX output. Genes were compared with the Tapidor
pseudomolecules using blastp with an e-value cutoff of 1e-10. The scripts are available at
http://appliedbioinformatics.com.au/index.php/Darmor_Tapidor under ‘Colinearity analysis’.
Assessment of gene loss used the SGSGeneLoss pipeline v0.1 (Golicz et al. 2014). Public
Darmor-bzh (BioProject ID: ERP005275, ERP005532) reads were aligned using bowtie2
(settings: --end-to-end, --sensitive) (Langmead et al. 2012) and extracted using samtools (Li
et al. 2009). Gene expression levels of the genes predicted to be absent was measured using
bowtie v1.1.2 (Langmead et al. 2009) and eXpress v1.5.1 (Roberts et al. 2012) and the same
RNA-Seq data as used for the annotation. Predicted genes showing less than 5 unique
fragments mapping in a library were assumed to be not expressed in that library to account
for possible mismappings from expressed homeologous genes.
Genes were functionally annotated using blastp and UniProtKB Swiss-Prot. GO terms were
determined from Swiss-Prot results and topGO as used to predict enriched GO-terms (Alexa
et al. 2010).
To identify collapsed and repeated regions in the Tapidor and Darmor-bzh assemblies, reads
from each cultivar were mapped to their respective genome reference assemblies using
SOAPaligner v2.21 with parameters -r 0, -r 1, and -r 2 to generate three sets of alignments.
Base coverage was calculated for each BAM file using BEDTools genomecov v2.21.0
(Quinlan et al. 2010). The CoReFinder pipeline
21

(http://appliedbioinformatics.com.au/index.php/CoReFinder) identified collapsed and
repetitive regions with a minimum block size of 50 bp. R v3.2 (R Development Core Team
2011) was used to perform the Mann-Whitney U test using the wilcox.test() function to
compare the number and lengths of repetitive and collapsed regions between Darmor-bzh and
Tapidor. Conserved domains were identified using the command-line version of InterProScan
version 5.14-53.0 (Zlobnov et al. 2001) (settings: -appl Pfam).
Data access
All raw sequence reads for the cultivar Tapidor used for assembly have been submitted to
NCBI BioProject (https://www.ncbi.nlm.nih.gov/bioproject/342383). The Tapidor x
Ningyou-7 DH data is available at http://www.ncbi.nlm.nih.gov/bioproject/PRJNA274890
The assemblies and annotations along with scripts and other information described in this
manuscript are available at http://appliedbioinformatics.com.au/index.php/Darmor_Tapidor
Acknowledgments
The authors would like to acknowledge funding support from the Australian Research
Council (Projects LP110100200, LP130100925, LP140100537 and DP160104497), from the
UK Biotechnology and Biological Sciences Research Council (BBSRC) to GK
(BB/E017797/1) and IB (BB/E017363/1) and from the National Basic Research and
Development Programme of China (2006CB101600). This work was supported by resources
provided by the Pawsey Supercomputing Centre with funding from the Australian
Government and the Government of Western Australia, the Australian Genome Research
Facility (AGRF), the Queensland Cyber Infrastructure Foundation (QCIF) and the Australian
Partnership for Advanced Computing (APAC).
22
Disclosure declaration
The authors declare no competing interests.
23
References
Alexa, A. Rahnenfuhrer, J. (2010). topGO: enrichment analysis for gene ontology. R package
version, 2(0).
Altschul SF, Gish W, Miller W, Myers EW, Lipman DJ. 1990. Basic local alignment search
tool. J Mol Biol 215: 403–10.
Arumuganathan, K. and Earle, E.D. 1991. Nuclear DNA Content of Some Important Plant
Species. Plant Molecular Biology Reporter 9(3): 211-215.
Bayer PE, Ruperao P, Mason AS, Stiller J, Chan C-KK, Hayashi S, Long Y, Meng J, Sutton
T, Visendi P, Varshney RK, Batley J, Edwards D. 2015. High-resolution skim genotyping by
sequencing reveals the distribution of crossovers and gene conversions in Cicer arietinum
and Brassica napus. Theor Appl Genet 128: 1039–47.
Brown CT, Howe A, Zhang Q, Pyrkosz AB, Brom TH. 2012. A Reference-Free Algorithm
for Computational Normalization of Shotgun Sequencing Data.
http://arxiv.org/abs/1203.4802
Cai G, Yang Q, Yi B, Fan C, Edwards D, Batley J, Zhou Y, Adams K, Wendel J, Otto S, et
al. 2014. A Complex Recombination Pattern in the Genome of Allotetraploid Brassica napus
as Revealed by a High-Density Genetic Map ed. H. Candela. PLoS One 9: e109910.
Cantarel BL, Korf I, Robb SMC, Parra G, Ross E, Moore B, Holt C, Sánchez Alvarado A,
Yandell M. 2008. MAKER: an easy-to-use annotation pipeline designed for emerging model
organism genomes. Genome Res 18: 188–96.
Chalhoub B, Denoeud F, Liu S, Parkin IAP, Tang H, Wang X, Chiquet J, Belcram H, Tong
C, Samans B, Corréa M, Da Silva C, Just J, Falentin C, Koh CS, Le Clainche I, Bernard M,
24
Bento P, Noel B, Labadie K, Alberti A, Charles M, Arnaud D, Guo H, Daviaud C, Alamery
S, Jabbari K, Zhao M, Edger PP, Chelaifa H, Tack D, Lassalle G, Mestiri I, Schnel N, Le
Paslier M-C, Fan G, Renault V, Bayer PE, Golicz AA, Manoli S, Lee T-H, Thi VHD, Chalabi
S, Hu Q, Fan C, Tollenaere R, Lu Y, Battail C, Shen J, Sidebottom CHD, Wang X, Canaguier
A, Chauveau A, Bérard A, Deniot G, Guan M, Liu Z, Sun F, Lim YP, Lyons E, Town CD,
Bancroft I, Wang X, Meng J, Ma J, Pires JC, King GJ, Brunel D, Delourme R, Renard M,
Aury J-M, Adams KL, Batley J, Snowdon RJ, Tost J, Edwards D, Zhou Y, Hua W, Sharpe
AG, Paterson AH, Guan C, Wincker P. 2014. Early allopolyploid evolution in the post-
Neolithic Brassica napus oilseed genome. Science 345: 950-953.
Cheng F, Sun R, Hou X, Zheng H, Zhang F, Zhang Y, Liu B, Liang J, Zhuang M, Liu Y, Liu
D, Wang X, Li P, Liu Y, Lin K, Bucher J, Zhang N, Wang Y, Wang H, Deng J, Liao Y, Wei
K, Zhang X, Fu L, Hu Y, Liu J, Cai C, Zhang S, Zhang S, Li F, Zhang H, Zhang J, Guo N,
Liu Z, Liu J, Sun C, Ma Y, Zhang H, Cui Y, Freeling MR, Borm T, Bonnema G, Wu J, Wang
X. 2016. Subgenome parallel selection is associated with morphotype diversification and
convergent crop domestication in Brassica rapa and Brassica oleracea. Nat Genet 1–10.
Crusoe MR, Alameldin HF, Awad S, Boucher E, Caldwell A, Cartwright R, Charbonneau A,
Constantinides B, Edvenson G, Fay S, Fenton J, Fenzl T, Fish J, Garcia-Gutierrez L, Garland
P, Gluck J, González I, Guermond S, Guo J, Gupta A, Herr JR, Howe A, Hyer A, Härpfer A,
Irber L, Kidd R, Lin D, Lippi J, Mansour T, McA’Nulty P, McDonald E, Mizzi J, Murray
KD, Nahum JR, Nanlohy K, Nederbragt AJ, Ortiz-Zuazaga H, Ory J, Pell J, Pepe-Ranney C,
Russ ZN, Schwarz E, Scott C, Seaman J, Sievert S, Simpson J, Skennerton CT, Spencer J,
Srinivasan R, Standage D, Stapleton JA, Steinman SR, Stein J, Taylor B, Trimble W,
Wiencko HL, Wright M, Wyss B, Zhang Q, zyme en, Brown CT, Crusoe MR, Alameldin HF,
Awad S, Boucher E, Caldwell A, Cartwright R, Charbonneau A, Constantinides B, Edvenson
G, Fay S, Fenton J, Fenzl T, Fish J, Garcia-Gutierrez L, Garland P, Gluck J, González I,
25

Guermond S, Guo J, Gupta A, Herr JR, Howe A, Hyer A, Härpfer A, Irber L, Kidd R, Lin D,
Lippi J, Mansour T, McA’Nulty P, McDonald E, Mizzi J, Murray KD, Nahum JR, Nanlohy
K, Nederbragt AJ, Ortiz-Zuazaga H, Ory J, Pell J, et al. 2015. The khmer software package:
enabling efficient nucleotide sequence analysis. F1000Research 4.
Edwards D, Batley J, Snowdon RJ. 2013. Accessing complex crop genomes with next-
generation sequencing. Theoretical and Applied Genetics 126: 1-11
Foisset N, Delourme R, Barret P, Renard M. 1995. Molecular tagging of the dwarf BREIZH
(Bzh) gene in Brassica napus. Theor Appl Genet 91: 756–761.
Gladman S, Seemann T. 2012. VelvetOptimiser (Version 2.2.4) [Software]. Available at
http://www.bioinformatics.net.au/software.velvetoptimiser.shtml
Golicz AA, Martinez PA, Zander M, Patel DA, Van De Wouw AP, Visendi P, Fitzgerald TL,
Edwards D, Batley J. 2014. Gene loss in the fungal canola pathogen Leptosphaeria maculans.
Funct Integr Genomics 15: 189–96.
Golicz AA, Batley J, Edwards D. 2016. Towards plant pangenomics. Plant Biotechnol J 14:
1099–1105.
Golicz AA, Bayer PE, Barker GC, Edger PP, Kim H, Martinez PA, Chan CKK, Severn-Ellis
A, McCombie WR, Parkin IAP, Paterson AH, Pires JC, Sharpe AG, Tang H, Teakle GR,
Town CD, Batley J, Edwards D. 2016. The pangenome of an agronomically important crop
plant Brassica oleracea. Nat Commun 7: 13390.
Harris, R.S. 2007. Improved pairwise alignment of genomic DNA. Ph.D. Thesis, The
Pennsylvania State University.
Hayward A, Mason AS, Dalton-Morgan J, Zander M, Edwards D, Batley J. 2012. SNP
discovery and applications in Brassica napus. Journal of Plant Biotechnology 39: 49-61
26
Hecht V, Vielle-Calzada JP, Hartog M V, Schmidt ED, Boutilier K, Grossniklaus U, de Vries
SC. 2001. The Arabidopsis SOMATIC EMBRYOGENESIS RECEPTOR KINASE 1 gene is
expressed in developing ovules and embryos and enhances embryogenic competence in
culture. Plant Physiol 127: 803–16.
Higgins J, Magusin A, Trick M, Fraser F, Bancroft I. 2012. Use of mRNA-seq to
discriminate contributions to the transcriptome from the constituent genomes of the polyploid
crop species Brassica napus. BMC Genomics 13: 247.
Hirsch CN, Foerster JM, Johnson JM, Sekhon RS, Muttoni G, Vaillancourt B, Peñagaricano
F, Lindquist E, Pedraza MA, Barry K, de Leon N, Kaeppler SM, Buell CR. 2014. Insights
into the maize pan-genome and pan-transcriptome. Plant Cell 26: 121–35.
Joshi NA, Fass JN. 2011. Sickle: A sliding-window, adaptive, quality-based trimming tool
for FastQ files (Version 1.33) [Software]. Available at https://github.com/najoshi/sickle.
Keller O, Kollmar M, Stanke M, Waack S. 2011. A novel hybrid gene prediction method
employing protein multiple sequence alignments. Bioinformatics 27: 757–63.
Kim D, Pertea G, Trapnell C, Pimentel H, Kelley R, Salzberg SL. 2013. TopHat2: accurate
alignment of transcriptomes in the presence of insertions, deletions and gene fusions. Genome
Biol 14: R36.
Langmead B, Trapnell C, Pop M, Salzberg SL. 2009. Ultrafast and memory-efficient
alignment of short DNA sequences to the human genome. Genome Biol 10: R25.
Langmead B, Salzberg SL. 2012. Fast gapped-read alignment with Bowtie 2. Nat Methods 9:
357–9.
27
Lorenc MT, Hayashi S, Stiller J, Lee H, Manoli S, Ruperao P, Visendi P, Berkman PJ, Lai K,
Batley J, Edwards D. 2012. Discovery of Single Nucleotide Polymorphisms in Complex
Genomes Using SGSautoSNP. Biology (Basel) 1: 370–382.
Li H, Handsaker B, Wysoker A, Fennell T, Ruan J, Homer N, Marth G, Abecasis G, Durbin
R. 2009. The Sequence Alignment/Map format and SAMtools. Bioinformatics 25: 2078–9.
Lin K, Zhang N, Severing EI, Nijveen H, Cheng F, Visser RGF, Wang X, de Ridder D,
Bonnema G. 2014. Beyond genomic variation--comparison and functional annotation of three
Brassica rapa genomes: a turnip, a rapid cycling and a Chinese cabbage. BMC Genomics 15:
250.
Liu S, Liu Y, Yang X, Tong C, Edwards D, Parkin IAP, Zhao M, Ma J, Yu J, Huang S, et al.
2014. The Brassica oleracea genome reveals the asymmetrical evolution of polyploid
genomes. Nat Commun 5: 3930.
Lysak MA, Koch MA, Pecinka A, Schubert I. 2005. Chromosome triplication found across
the tribe Brassiceae. Genome Res 15: 516–25.
Nagaharu U. 1935. Genome analysis in Brassica with special reference to the experimental
formation of B. napus and peculiar mode of fertilization. Jpn J Bot 7: 389–452.
NCBI Resource Coordinators. 2013. Database resources of the National Center for
Biotechnology Information. Nucleic Acids Res 41: D8–D20.
Nicolas SD, Le Mignon G, Eber F, Coriton O, Monod H, Clouet V, Huteau V, Lostanlen A,
Delourme R, Chalhoub B, et al. 2007. Homeologous recombination plays a major role in
chromosome rearrangements that occur during meiosis of Brassica napus haploids. Genetics
175: 487–503.
28
Østergaard L, King GJ, Liljegren S, Roeder A, Kempin S, Gremski K, Østergaard L, Guimil
S, Reyes D, Yanofsky M, et al. 2008. Standardized gene nomenclature for the Brassica
genus. Plant Methods 4: 10.
Parkin IA, Koh C, Tang H, Robinson SJ, Kagale S, Clarke WE, Town CD, Nixon J,
Krishnakumar V, Bidwell SL, Denoeud F, Belcram H, Links MG, Just J, Clarke C, Bender T,
Huebert T, Mason AS, Pires CJ, Barker G, Moore J, Walley PG, Manoli S, Batley J, Edwards
D, Nelson MN, Wang X, Paterson AH, King G, Bancroft I, Chalhoub B, Sharpe AG. 2014.
Transcriptome and methylome profiling reveals relics of genome dominance in the
mesopolyploid Brassica oleracea. Genome Biol 15: R77.
Parra G., Bradnam K., Korf I. 2007. CEGMA: a pipeline to accurately annotate core genes in
eukaryotic genomes. Bioinformatics, 23(9), 1061-1067.
Quinlan AR, Hall IM. 2010. BEDTools: a flexible suite of utilities for comparing genomic
features. Bioinformatics 26: 841–2.
R Development Core Team 2011, R: A Language and Environment for Statistical
Computing. Vienna, Austria : the R Foundation for Statistical Computing. ISBN: 3-900051-
07-0. Available online at http://www.R-project.org/.
Roberts A, Pachter L. 2012. Streaming fragment assignment for real-time analysis of
sequencing experiments. Nat Methods 10: 71–73.
Saxena RK, Edwards D, Varshney RK. 2014. Structural variations in plant genomes. Brief
Funct Genomics 13: 296–307.
Schatz MC, Maron LG, Stein JC, Hernandez Wences A, Gurtowski J, Biggers E, Lee H,
Kramer M, Antoniou E, Ghiban E, Wright MH, Chia J, Ware D, McCouch SR, McCombie
29

WR. 2014. Whole genome de novo assemblies of three divergent strains of rice, Oryza sativa,
document novel gene space of aus and indica. Genome Biol 15: 506.
Sharpe AG, Lydiate DJ. 2003. Mapping the mosaic of ancestral genotypes in a cultivar of
oilseed rape (Brassica napus) selected via pedigree breeding. Genome 46: 461–8.
Simão FA, Waterhouse RM, Ioannidis P, Kriventseva E V, Zdobnov EM. 2015. BUSCO:
assessing genome assembly and annotation completeness with single-copy orthologs.
Bioinformatics 31: 3210–2.
Thudi M, Khan AW, Kumar V, Gaur PM, Katta K, Garg V, Roorkiwal M, Samineni S,
Varshney RK. 2016. Whole genome re-sequencing reveals genome-wide variations among
parental lines of 16 mapping populations in chickpea (Cicer arietinum L.). BMC Plant Biol
16 Suppl 1: 10.
Tollenaere R., Hayward A., Dalton‐Morgan J., Campbell E., Lee JR., Lorenc MT., Manoli S.,
Stiller J., Raman R., Raman H., Edwards, D., Batley J. 2012. Identification and
characterization of candidate Rlm4 blackleg resistance genes in Brassica napus using next‐generation sequencing. Plant biotechnology journal, 10(6), 709-715.
Trick M, Cheung F, Drou N, Fraser F, Lobenhofer EK, Hurban P, Magusin A, Town CD,
Bancroft I. 2009. A newly-developed community microarray resource for transcriptome
profiling in Brassica species enables the confirmation of Brassica-specific expressed
sequences. BMC Plant Biol 9: 50.
Udall JA, Quijada PA, Osborn TC. 2005. Detection of chromosomal rearrangements derived
from homologous recombination in four mapping populations of Brassica napus L. Genetics
169: 967–79.
30
Wang X, Wang H, Wang J, Sun R, Wu J, Liu S, Bai Y, Mun J-H, Bancroft I, Cheng F, et al.
2011. The genome of the mesopolyploid crop species Brassica rapa. Nat Genet 43: 1035–9.
Wang Y, Tang H, Debarry JD, Tan X, Li J, Wang X, Lee T, Jin H, Marler B, Guo H, et al.
2012. MCScanX: a toolkit for detection and evolutionary analysis of gene synteny and
collinearity. Nucleic Acids Res 40: e49.
Wu Y, Bhat PR, Close TJ, Lonardi S. 2008. Efficient and accurate construction of genetic
linkage maps from the minimum spanning tree of a graph. ed. L. Kruglyak. PLoS Genet 4:
e1000212.
Wu P, Shao Z-Q, Wu X-Z, Wang Q, Wang B, Chen J-Q, Hang Y-Y, Xue J-Y. 2014.
Loss/retention and evolution of NBS-encoding genes upon whole genome triplication of
Brassica rapa. Gene 540: 54–61.
Yang J., Liu D., Wang X., Ji C., Cheng F., Liu B., Hu Z., Chen S., Pental D., Ju Y., Yao P.,
Li X., Xie K., Zhang J., Wang J., Liu F., Ma W., Shopan J., Zheng H., Mackenzie SA., Zhang
M.2016. The genome sequence of allopolyploid Brassica juncea and analysis of differential
homeolog gene expression influencing selection. Nature Genetics 1546-1718
Yao W, Li G, Zhao H, Wang G, Lian X, Xie W. 2015. Exploring the rice dispensable genome
using a metagenome-like assembly strategy. Genome Biol 16: 187.
Zerbino DR, Birney E. 2008. Velvet: algorithms for de novo short read assembly using de
Bruijn graphs. Genome Res 18: 821–829.
Zhao X, Li B, Zhang K, Hu K, Yi B, Wen J,Chaozhi M, Jinxiong S, Tingdong F, Tu J. 2016.
Breeding signature of combining ability improvement revealed by a genomic variation map
from recurrent selection population in Brassica napus. Scientific Reports, 6.
31
Zdobnov EM, Apweiler R. 2001. InterProScan - an integration platform for the signature-
recognition methods in InterPro. Bioinformatics 17: 847–848.
32
Figures
Figure 1: Comparison of the count of collapsed regions by chromosome in Darmor-bzh and
Tapidor.
Figure 2: Comparison of the count of repetitive regions by chromosome in Darmor-bzh and
Tapidor.
Figure 3: Number of shared Pfam domains between genes located in collapsed and repetitive
regions between Darmor-bzh and Tapidor.
Supplementary Figures
Supplementary Figure 1: Dotplot comparison of the Darmor-bzh assembly (y-axis) and the
Tapidor assembly (x-axis) pseudomolecules.
Supplementary Figure 2: Comparison of ranks between 19 linkage maps from MSTMap and
physical placement using the Darmor-bzh genome assembly as reference.
Supplementary Figure 3: Number of shared Swiss-Prot hits between genes located in
collapsed and repetitive regions between Darmor-bzh and Tapidor.
33

34
Tables
Table 1: Size, SNPs, predicted genes, absent genes in Darmor-bzh and Tapidor
Name Darmor-
bzh SNPs
Darmor-
bzh
Length
(Mbp)
Darmor-
bzh SNPs /
Mbp
Tapidor
SNPs
Tapidor
Length
(Mbp)
Tapidor
SNPs /
Mbp
Darmor-
bzh
predicted
filtered
genes
Tapidor
predicted
filtered
genes
Tapidor
genes with
no
Darmor-
bzh reads
Darmor-
bzh genes
with no
Tapidor
reads
chrA01 45,870 31.16 1,472 37,875 23.9 1,586 3,687 3,050 0 3
chrA02 45,229 31.34 1,443 46,599 27.9 1,672 3,528 3,315 1 0
chrA03 59,180 39.49 1,499 55,319 32.1 1,723 5,429 4,408 0 4
chrA04 57,270 23.31 2,457 49,357 21 2,351 2,676 2,638 0 0
chrA05 54,784 28.6 1,916 36,548 20.1 1,818 3,506 2,634 1 1
chrA06 72,163 31.9 2,262 57,613 29.1 1,977 3,926 3,713 0 0
chrA07 45,458 28.9 1,573 34,101 22.7 1,505 3,555 2,976 0 0
chrA08 24,807 21.74 1,141 22,096 16.4 1,346 2,827 2,147 0 0
chrA09 79,586 46.72 1,704 53,008 30.8 1,721 5,286 3,913 0 3
35

chrA10 27,723 19.96 1,389 35,378 22.5 1,575 2,800 3,175 0 1
Total A 512,070 303 427,894 247 37,220 31,969 2 12
chrC01 92,316 47.95 1,925 63,462 31.9 1,990 3,739 3,083 0 5
chrC02 49,665 58.66 847 47,872 40.5 1,181 4,182 3,572 1 23
chrC03 64,224 71.85 894 72,229 55.2 1,307 6,448 5,800 0 9
chrC04 95,329 61.04 1,562 79,006 45.6 1,733 4,658 4,356 0 2
chrC05 25,226 52.72 479 43,752 45.6 959 4,452 4,839 0 4
chrC06 41,036 44.61 920 41,252 34.1 1,211 3,543 3,230 0 6
chrC07 34,089 52.5 649 41,001 37.3 1,099 4,165 3,523 0 1
chrC08 43,857 46.29 947 48,079 40.2 1,197 4,140 4,295 0 0
chrC09 46,660 60.21 775 57,479 51 1,127 4,607 4,864 0 2
Total C 492,402 496 494,132 381 39,934 37,562 1 52
Unplaced
contigs 2,513 51.33 49 23,380 8.5 2,752 3,228 631 0 9
Total 1,006,985 850 945,406 636 80,382 70,162 3 73
36

37