Embed Size (px)
Citation preview
We use a two-color
headline system to
highlight our rational and
emotional side alike. The
first line appears in blue
(the rational side), the
second line in orange (the
emotional side) and the
duality principle is reflected
in the wording of the
headline.
This system refers to the
first page title only, all
other headlines are blue.
Learn more about our
verbal identity in the
Sandvik Brand Identity
Directives, which you can
download at the Intranet >
home.sandvik.com/brand
INTERIM REPORT FIRST QUARTER 2019
1
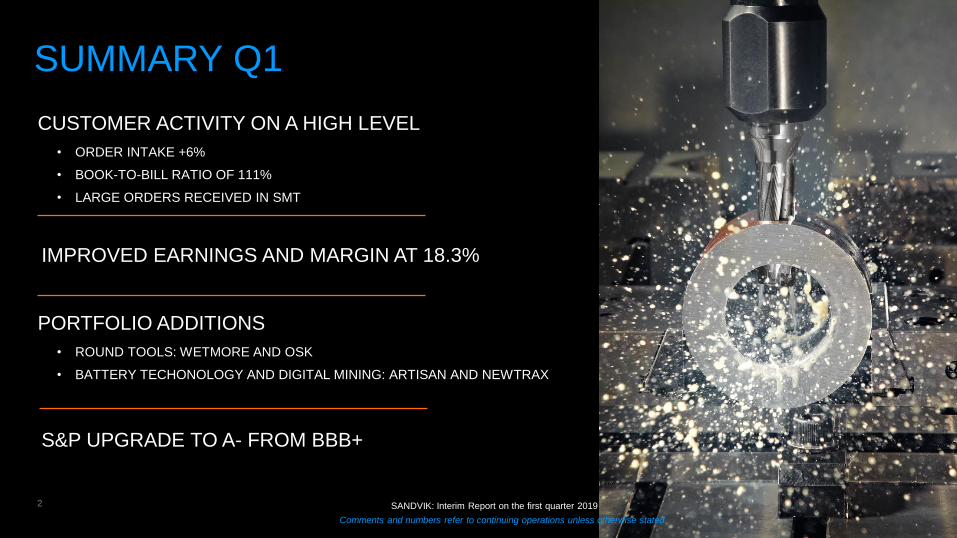
SUMMARY Q1
2
CUSTOMER ACTIVITY ON A HIGH LEVEL
• ORDER INTAKE +6%
• BOOK-TO-BILL RATIO OF 111%
• LARGE ORDERS RECEIVED IN SMT
IMPROVED EARNINGS AND MARGIN AT 18.3%
PORTFOLIO ADDITIONS
• ROUND TOOLS: WETMORE AND OSK
• BATTERY TECHONOLOGY AND DIGITAL MINING: ARTISAN AND NEWTRAX
SANDVIK: Interim Report on the first quarter 2019
Comments and numbers refer to continuing operations unless otherwise stated.
S&P UPGRADE TO A- FROM BBB+

3
% of group
revenue FY18 Y/Y
order intake
Y/Y UNDERLYING DEMAND TREND
EUROPE 38% +8%
NORTH AMERICA 21% +6%
ASIA 20% -4%
AFRICA/MIDDLE EAST 9% +2%
SOUTH AMERICA 5% +22%
AUSTRALIA 7% +24%
segment bubble size – share of group revenue 2018
Sequential underlying
demand trend (Q4/Q1)
MARKET
DEVELOPMENT
Comments and numbers refer to continuing operations unless otherwise stated.
SANDVIK: Interim Report on the first quarter 2019

ORDER INTAKE
4
P/V
6% REPORTED
27 873 MSEK MSEK
P/V
3% REPORTED
25 025
REVENUES RECORD-HIGH LEVEL FOR SMS AND LARGE ORDER IN SMT SEASONALLY WEAK FOR SMRT
Comments and numbers refer to continuing operations unless otherwise stated.
SANDVIK: Interim Report on the first quarter 2019
80 000
90 000
100 000
110 000
15 000
20 000
25 000
30 000
2015 2016 2017 2018 2019
Order intake, reported Organic order intake, 12M rolling
80 000
90 000
100 000
110 000
15 000
20 000
25 000
30 000
2015 2016 2017 2018 2019
Revenues, reported Organic revenues, 12M rolling

EBIT DEVELOPMENT
5
MSEK
EBIT
4 567 MSEK
• OVERALL STABLE
EXCLUDING FX, STRUCTURE
AND METALS
• IMPACTED BY
SHARP DECLINE IN TUNGSTEN
POWDER BUSINESS
EBIT %
18.3
*Adjusted for items affecting comparability
+7%
Comments and numbers refer to continuing operations unless otherwise stated.
SANDVIK: Interim Report on the first quarter 2019
10%
13%
16%
19%
22%
2 000
3 000
4 000
5 000
6 000
Q1 Q2 Q3 Q4 Q1 Q2 Q3 Q4 Q1 Q2 Q3 Q4 Q1 Q2 Q3 Q4 Q1
2015 2016 2017 2018 2019
EBIT* EBIT%*
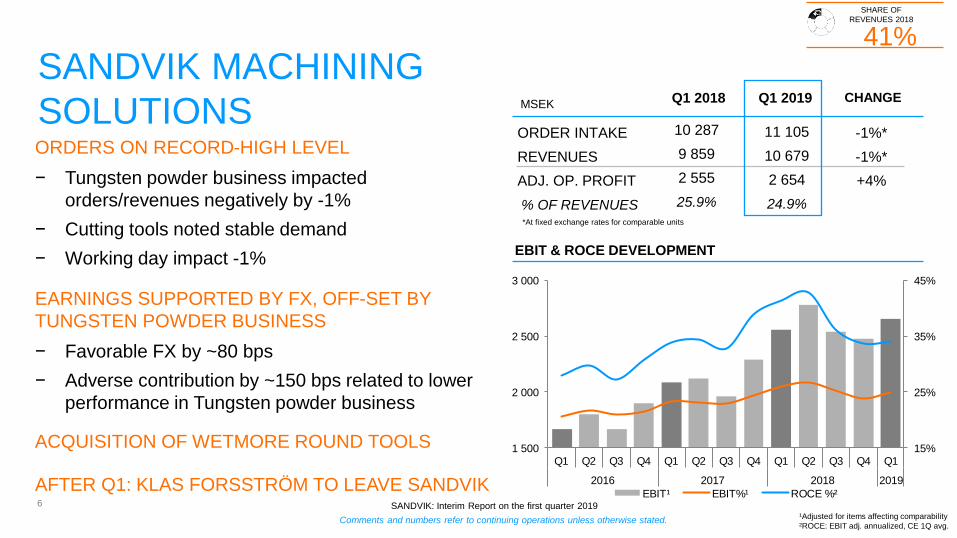
SANDVIK MACHINING
SOLUTIONS
6
ORDERS ON RECORD-HIGH LEVEL
− Tungsten powder business impacted
orders/revenues negatively by -1%
− Cutting tools noted stable demand
− Working day impact -1%
EARNINGS SUPPORTED BY FX, OFF-SET BY
TUNGSTEN POWDER BUSINESS
− Favorable FX by ~80 bps
− Adverse contribution by ~150 bps related to lower
performance in Tungsten powder business
ACQUISITION OF WETMORE ROUND TOOLS
AFTER Q1: KLAS FORSSTRÖM TO LEAVE SANDVIK
EBIT & ROCE DEVELOPMENT
-1%*
-1%*
+4%
CHANGE Q1 2018 Q1 2019
ORDER INTAKE
REVENUES
ADJ. OP. PROFIT
% OF REVENUES
10 287
9 859
2 555
25.9%
11 105
10 679
2 654
24.9%
MSEK
*At fixed exchange rates for comparable units
¹Adjusted for items affecting comparability
²ROCE: EBIT adj. annualized, CE 1Q avg.
41%
SHARE OF
REVENUES 2018
Comments and numbers refer to continuing operations unless otherwise stated.
SANDVIK: Interim Report on the first quarter 2019
15%
25%
35%
45%
1 500
2 000
2 500
3 000
Q1 Q2 Q3 Q4 Q1 Q2 Q3 Q4 Q1 Q2 Q3 Q4 Q1
2016 2017 2018 2019
EBIT¹ EBIT%¹ ROCE %²

SANDVIK MINING AND
ROCK TECHNOLOGY
7
STRONG UNDERLYING MARKET
− Equipment and aftermarket in strong growth
− Strategic automation order
EARNINGS AND MARGIN IMPROVEMENT
− Earnings primarily supported by revenue growth
− Negative impact from M&A activities -50bps
− Excluding FX earnings improved by 12%
ACQUISITION OF ARTISAN CLOSED AND
NEWTRAX ANNOUNCED
HENRIK AGER IS NEW HEAD OF SMRT
AS OF 1 APRIL
44%
SHARE OF
REVENUES 2018
¹Adjusted for items affecting comparability
²ROCE: EBIT adj. annualized, CE 1Q avg.
EBIT & ROCE DEVELOPMENT
+9%*
+6%*
+28%
CHANGE Q1 2018 Q1 2019
ORDER INTAKE
REVENUES
ADJ. OP. PROFIT
% OF REVENUES
10 230
9 324
1 402
15.0%
11 839
10 573
1 795
17.0%
MSEK
*At fixed exchange rates for comparable units
Comments and numbers refer to continuing operations unless otherwise stated.
SANDVIK: Interim Report on the first quarter 2019
5%
10%
15%
20%
25%
30%
35%
0
500
1 000
1 500
2 000
2 500
Q1 Q2 Q3 Q4 Q1 Q2 Q3 Q4 Q1 Q2 Q3 Q4 Q1
2016 2017 2018 2019
EBIT¹ EBIT%¹ ROCE %²

SANDVIK MATERIALS
TECHNOLOGY
8
STRONG DEVELOPMENT IN PROJECT BUSINESS
− Major energy orders of ~1 BSEK
− Improvement in capex-related energy segment
− Order growth -2% excl. large orders on high
comparables
UNDERLYING MARGIN IMPROVEMENT
− Supported by revenue growth and product mix
especially for standardized offering
− Ongoing efficiency measures
¹Adjusted for items affecting comparability ²ROCE: EBIT adj. annualized, CE 1Q avg.
³EBIT adj. for items affecting comparability and metal prices
15%
SHARE OF
REVENUES 2018
+23%*
+4%*
-13%
CHANGE Q1 2018 Q1 2019
ORDER INTAKE
REVENUES
OPERATING PROFIT
% OF REVENUES
UNDERLYING MARGIN³
3 935
3 640
352
9.7%
6.9%
4 930
3 773
307
8.1%
10.4%
MSEK
*At fixed exchange rates for comparable units
EBIT & ROCE DEVELOPMENT
Comments and numbers refer to continuing operations unless otherwise stated.
SANDVIK: Interim Report on the first quarter 2019
-5%
0%
5%
10%
15%
20%
-200
0
200
400
600
800
Q1 Q2 Q3 Q4 Q1 Q2 Q3 Q4 Q1 Q2 Q3 Q4 Q1
2016 2017 2018 2019
EBIT¹ EBIT%¹ ROCE%² EBIT%³
9
TOMAS ELIASSON
CFO
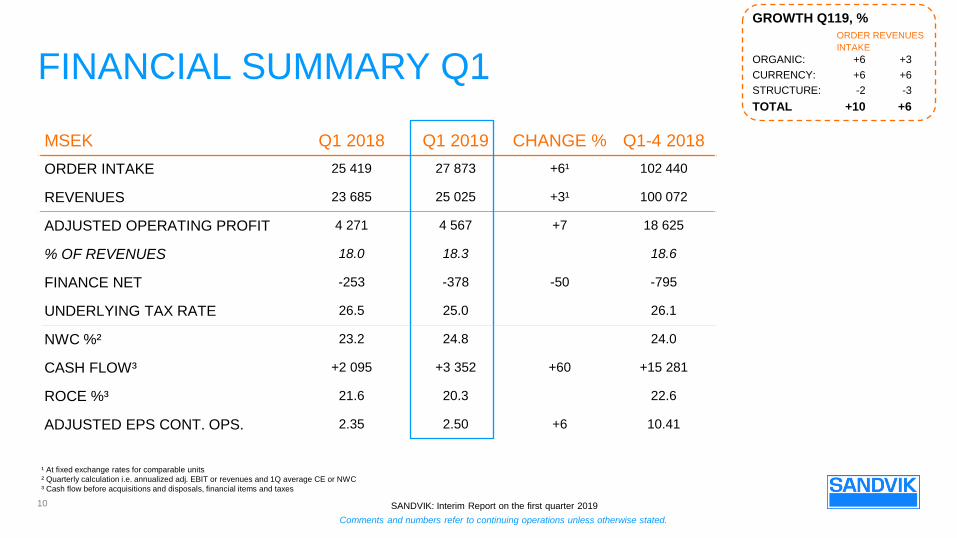
FINANCIAL SUMMARY Q1
10
¹ At fixed exchange rates for comparable units
² Quarterly calculation i.e. annualized adj. EBIT or revenues and 1Q average CE or NWC
³ Cash flow before acquisitions and disposals, financial items and taxes
GROWTH Q119, %
ORDER REVENUES
INTAKE
ORGANIC: +6 +3
CURRENCY: +6 +6
STRUCTURE: -2 -3
TOTAL +10 +6
MSEK Q1 2018 Q1 2019 CHANGE % Q1-4 2018
ORDER INTAKE 25 419 27 873 +6¹ 102 440
REVENUES 23 685 25 025 +3¹ 100 072
ADJUSTED OPERATING PROFIT 4 271 4 567 +7 18 625
% OF REVENUES 18.0 18.3 18.6
FINANCE NET -253 -378 -50 -795
UNDERLYING TAX RATE 26.5 25.0 26.1
NWC %² 23.2 24.8 24.0
CASH FLOW³ +2 095 +3 352 +60 +15 281
ROCE %³ 21.6 20.3 22.6
ADJUSTED EPS CONT. OPS. 2.35 2.50 +6 10.41
Comments and numbers refer to continuing operations unless otherwise stated.
SANDVIK: Interim Report on the first quarter 2019

SANDVIK GROUP
BRIDGE ANALYSIS
MSEK
REVENUES
EBIT
EBIT MARGIN
614
56
9%
+1 338
+564
-
-612
-324
-
CURRENCY
STRUCTURE
ONE-OFFS*
PRICE/ VOLUME/
PRODUCTIVITY
23 685
4 271
18.0%
Q1 2018
25 025
4 567
18.3%
Q1 2019
• Includes metal price effects within Sandvik Materials Technology of +22 MSEK in alloy surcharges on revenues and -186 MSEK in metal price effect on EBIT (+101 Q1 2018 vs. -85 Q1 2019). Structure -862 MSEK
topline and -102 MSEK for EBIT for Other operations (SPS/Hyperion). Structure SMT -179 MSEK on topline and -24 MSEK on EBIT (Wire, Custom Electric Manufacturing). Structure SMS +288 MSEK on topline and
+18 MSEK on EBIT (Hyperion, Metrologic Group, Dura-Mill & Wetmore). Structure +118 MSEK SMRT on topline and -31 MSEK on EBIT for Inrock & Artisan.
11
-0.2% +1.3% -0.9% MARGIN ACCRETION / DILUTION
GROUP LEVERAGE:
+9%
Comments and numbers refer to continuing operations unless otherwise stated.
SANDVIK: Interim Report on the first quarter 2019

SANDVIK GROUP EXCL. TUNGSTEN POWDER IMPACT
BRIDGE ANALYSIS
MSEK
REVENUES
EBIT
EBIT MARGIN
752
223
~30%
+1 338
+564
-612
-324
CURRENCY
STRUCTURE
ONE-OFFS*
ORGANIC
EXCL. TUNGSTEN
23 685
4 271
18.0%
Q1 2018
25 025
4 567
18.3%
Q1 2019
• Includes metal price effects within Sandvik Materials Technology of +22 MSEK in alloy surcharges on revenues and -186 MSEK in metal price effect on EBIT (+101 Q1 2018 vs. -85 Q1 2019). Structure -862 MSEK
topline and -102 MSEK for EBIT for Other operations (SPS/Hyperion). Structure SMT -179 MSEK on topline and -24 MSEK on EBIT (Wire, Custom Electric Manufacturing). Structure SMS +288 MSEK on topline and
+18 MSEK on EBIT (Hyperion, Metrologic Group, Dura-Mill & Wetmore). Structure +118 MSEK SMRT on topline and -31 MSEK on EBIT for Inrock & Artisan.
12
+0.4% +1.3% -0.9% MARGIN ACCRETION / DILUTION
GROUP UNDERLYING LEVERAGE:
+30%
Comments and numbers refer to continuing operations unless otherwise stated.
SANDVIK: Interim Report on the first quarter 2019
TUNGSTEN
BUSINESS
-137
-167
-0.6%

NET FINANCIALS
13
Comments and numbers refer to continuing operations unless otherwise stated.
SANDVIK: Interim Report on the first quarter 2019
MSEK Q1 18 Q1 19
Interest net -166 -168
Pension -30 -35
Bank charges -13 -15
Other fin income & costs -7 -4
IFRS16 -26
FX & other asset classes -35 -131
Total -253 -378
• GUIDANCE UNCHANGED
~1 BSEK
• LOOKING AHEAD: PREMATURE
PAYMENT OF LONG-TERM DEBT

NET WORKING CAPITAL
14
RELATIVE NWC BY BA
MSEK
RECEIVABLES INCREASE AND DELIVERY PREPARATION IN SMRT AND SMT
Comments and numbers refer to continuing operations unless otherwise stated.
SANDVIK: Interim Report on the first quarter 2019
20%
25%
30%
35%
20 000
22 500
25 000
27 500
2014 2015 2016 2017 2018 2019
NWC (continuing operations)
NWC % of revenues (continuing operations)
20%
25%
30%
35%
40%
45%
2014 2015 2016 2017 2018 2019
Sandvik Machining Solutions Sandvik Mining & Rock Technology
Sandvik Materials Technology

FREE OPERATING CASH FLOW
15
MSEK
*Including investments and disposals in rental, tangible and intangible assets and right-of-use assets (-37MSEK in Q119)
**Cash flow before acquisitions and disposals, financial items and taxes
*Adjusted for items affecting comparability
Comments and numbers refer to continuing operations unless otherwise stated.
MSEK Q1 2018 Q1 2019
EBITDA + non-cash 5 670 5 853
NWC change -2 710 -1 577
Capex* -864 -924
FOCF** 2 095 3 352
SANDVIK: Interim Report on the first quarter 2019
10 000
12 000
14 000
16 000
18 000
20 000
0
2 000
4 000
6 000
8 000
Q1 Q2 Q3 Q4 Q1 Q2 Q3 Q4 Q1 Q2 Q3 Q4 Q1 Q2 Q3 Q4 Q1
2015 2016 2017 2018 2019
Free operating cash flow
Free operating cash flow 12M rolling
Adjusted EBITA* 12M rolling
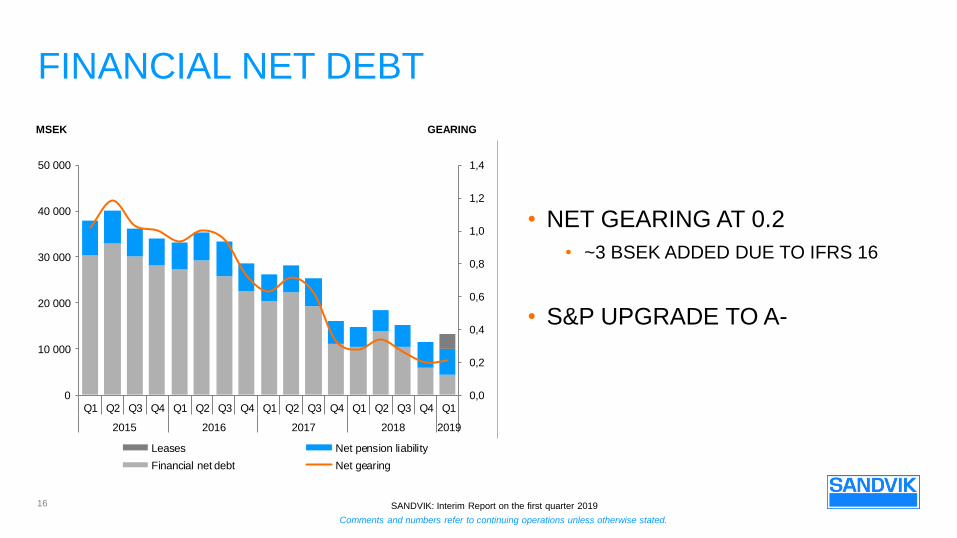
FINANCIAL NET DEBT
16
• NET GEARING AT 0.2
• ~3 BSEK ADDED DUE TO IFRS 16
• S&P UPGRADE TO A-
MSEK GEARING
Comments and numbers refer to continuing operations unless otherwise stated.
SANDVIK: Interim Report on the first quarter 2019
0,0
0,2
0,4
0,6
0,8
1,0
1,2
1,4
0
10 000
20 000
30 000
40 000
50 000
Q1 Q2 Q3 Q4 Q1 Q2 Q3 Q4 Q1 Q2 Q3 Q4 Q1 Q2 Q3 Q4 Q1
2015 2016 2017 2018 2019
Leases Net pension liability
Financial net debt Net gearing

OUTCOME Q1 AND GUIDANCE
17
Comments and numbers refer to continuing operations unless otherwise stated.
SANDVIK: Interim Report on the first quarter 2019
Q1 2019
Underlying currency effect (MSEK): +533 (~500)
Total currency effect (MSEK): +564
Metal price effect in quarter (MSEK): -85 (-150)
Q2 2019
Underlying currency effect (MSEK): +300*
Metal price effect in quarter (MSEK): +100**
FULL YEAR 2019
Capex (BSEK): <4.4 (incl. 0.4 due to IFRS 16) (Q1: 0.9; FY18: 3.9)
Net financial items (BSEK): ~1 (Q1: 0.4; FY18: 0.8)
Underlying tax rate (%): 25-27 (Q1: 25; FY18: 26.1 *Based on currency rates end of March 2019
**Based on currency rates, stock levels and metal prices at the end of March 2019

SUMMARY Q1
STRONG DEMAND
PROTECT MARGINS
CONTINUE ACQUIRING GROWTH

BACK-UP SLIDES
19

20
MINING (34%)
ENERGY (11%)
AUTOMOTIVE (12%)
CONSTRUCTION (9%)
AEROSPACE (6%)
END-CUSTOMER SEGMENTS % of group revenues 2018 excl. Mining systems; Other e.g. consumer goods, electronics, chemical and miscellaneous was 5% .
Comments and numbers refer to continuing operations unless otherwise stated.
GENERAL
ENGINEERING (23%)
SANDVIK: Interim Report on the first quarter 2019

PROFITABILITY DEVELOPMENT
21
ORGANIC
GROWTH
EBIT Q1 18
+564
CURRENCY
-186
METAL PRICE
EFFECT SMT
-138
STRUCTURE EBIT Q1 19
4,271
4,567
+56
EBIT MARGIN 18.0% 18.3%
GROUP LEVERAGE:
+9%
Comments and numbers refer to continuing operations unless otherwise stated.
SANDVIK: Interim Report on the first quarter 2019

BRIDGE ANALYSIS
CURRENCY STRUCTURE ONE-OFFS*
PRICE/ VOLUME/ PRODUCTIVITY Q1 2018 MSEK Q1 2019
MACHINING SOLUTIONS
MINING AND ROCK
TECHNOLOGY
MATERIALS TECHNOLOGY
REVENUES
ADJUSTED EBIT
ADJUSTED EBIT MARGIN
REVENUES
ADJUSTED EBIT
ADJUSTED EBIT MARGIN
REVENUES
ADJUSTED EBIT
ADJUSTED EBIT MARGIN
9 859
2 555
25.9%
9 324
1 402
15.0%
3 640
352
9.7%
-80
-159
-199%
574
206
+36%
120
80
+67%
+611
+240
-
+558
+219
-
+169
+85
-
+288
+18
-
+118
-31
-
-156
-210
-
10 679
2 654
24.9%
10 573
1 795
17.0%
3 773
307
8.1%
22
Comments and numbers refer to continuing operations unless otherwise stated.
SANDVIK: Interim Report on the first quarter 2019
• Includes metal price effects within Sandvik Materials Technology of +22 MSEK in alloy surcharges on revenues and -186 MSEK in metal price effect on EBIT (+101 Q1 2018 vs. -85 Q1 2019). Structure -862 MSEK
topline and -102 MSEK for EBIT for Other operations (SPS/Hyperion). Structure SMT -179 MSEK on topline and -24 MSEK on EBIT (Wire, Custom Electric Manufacturing). Structure SMS +288 MSEK on topline and
+18 MSEK on EBIT (Hyperion, Metrologic Group, Dura-Mill & Wetmore). Structure +118 MSEK SMRT on topline and -31 MSEK on EBIT for Inrock & Artisan.
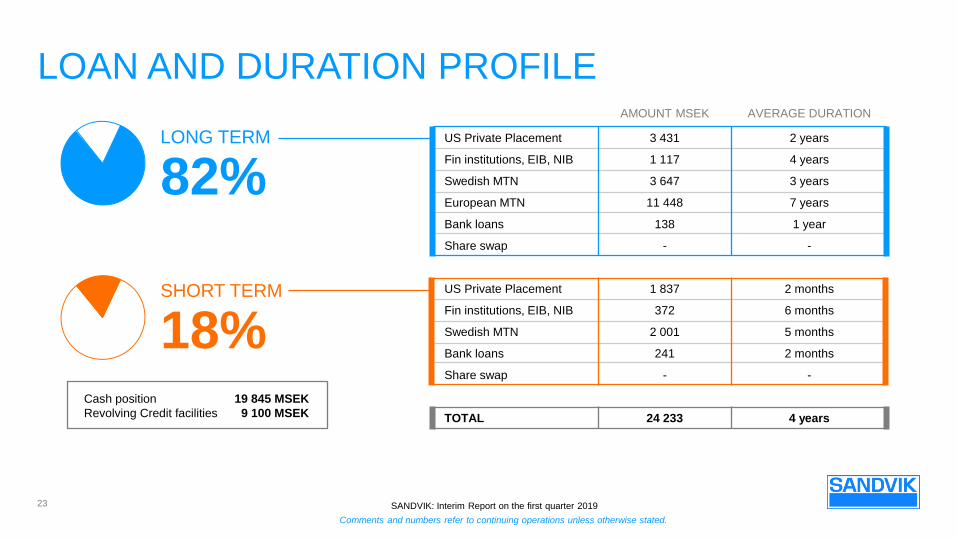
LOAN AND DURATION PROFILE
Cash position 19 845 MSEK
Revolving Credit facilities 9 100 MSEK
SHORT TERM
18%
LONG TERM
82%
AMOUNT MSEK AVERAGE DURATION
US Private Placement 3 431 2 years
Fin institutions, EIB, NIB 1 117 4 years
Swedish MTN 3 647 3 years
European MTN 11 448 7 years
Bank loans 138 1 year
Share swap - -
US Private Placement 1 837 2 months
Fin institutions, EIB, NIB 372 6 months
Swedish MTN 2 001 5 months
Bank loans 241 2 months
Share swap - -
TOTAL 24 233 4 years
23
Comments and numbers refer to continuing operations unless otherwise stated.
SANDVIK: Interim Report on the first quarter 2019

LOAN MATURITY PROFILE
MSEK
24
AVERAGE
INTEREST RATE:
~4%
Comments and numbers refer to continuing operations unless otherwise stated.
SANDVIK: Interim Report on the first quarter 2019
0
500
1 000
1 500
2 000
2 500
3 000
3 500
4 000
4 500
2019 2020 2021 2022 2023 2024 2025 2026 2027 2028 2029 2030 2031 2032 2033

Estimated to <4.4 BSEK for 2019 including 0.4 BSEK due to IFRS 16
GUIDANCE
TAX RATE
NET FINANCIAL
ITEMS
CAPEX
CURRENCY
EFFECTS
METAL PRICE
EFFECTS
The tax rate is estimated to 25-27% for 2019
Given currency rates at end of March 2019 the effect on operating profit from transaction and
translation would be +300 MSEK for Q2 2019
Given currency rates, stock levels and metal prices at the end of March 2019, it is estimated
that effect on operating profit in Q2 2019 will be +100 MSEK
Net financial items is estimated at 1 BSEK for 2019
25
Comments and numbers refer to continuing operations unless otherwise stated.
SANDVIK: Interim Report on the first quarter 2019

DISCLAIMER STATEMENT
“Some statements herein are forward-looking and the actual outcome could be materially different. In addition to the factors
explicitly commented upon, the actual outcome could be materially affected by other factors for example, the effect of economic
conditions, exchange-rate and interest-rate movements, political risks, impact of competing products and their pricing, product
development, commercialisation and technological difficulties, supply disturbances, and the major customer credit losses.”