Embed Size (px)
Citation preview


We can express information in a table as a set of ordered pairs. In order to see patterns, we can graph the ordered pairs on a coordinate plane.
Pattern: The points form a straight line. Each point is one unit to the right and three units up from the previous point. So, the cost increases by $3 for every CD created.
Example 1: Fill in the table with the order pairs for the ratios that describe the number of CDs to their cost. Then graph the ordered pairs and describe the pattern.
Cost to Create CDs
Number of CDs, x
Cost in Dollars, y
Ordered Pair (x, y)
1 3 (1, 3)
2 6 (2, 6)
3 9 (3, 9)

Comparison: The ratio of photos to pages for Renée’s scrapbook is 4:1 while the ratio of Gina’s is 6:1. On the graph, both sets of points are in a straight line but Gina’s points are steeper than Renée’s.
Example 2: Two friends are making scrapbooks. Renée places 4 photos on each page of her scrapbook. Gina places 6 photos on each page of her scrapbook. How do the ratios to each page for person compare?
Renée’s Scrapbook
Pages, x Photos, y (x, y)
1 4 (1, 4)
2 8 (2, 8)
3 12 (3, 12)
4 16 (3, 16)
Gina’s Scrapbook
Pages, x Photos, y (x, y)
1 6 (1, 6)
2 12 (2, 12)
3 18 (3, 18)
4 24 (3, 24)
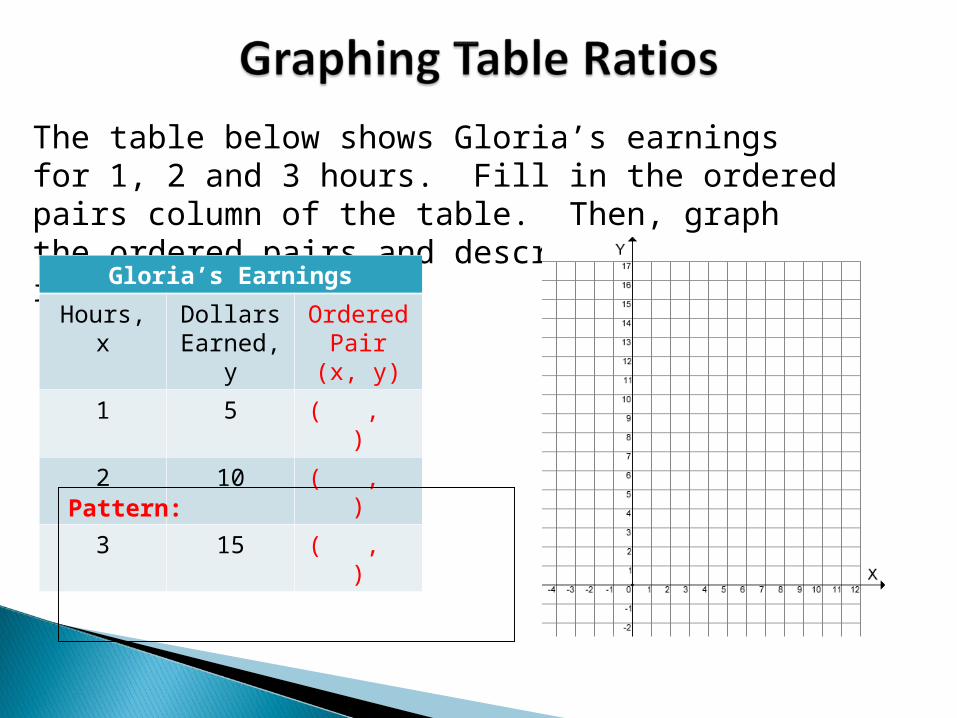
The table below shows Gloria’s earnings for 1, 2 and 3 hours. Fill in the ordered pairs column of the table. Then, graph the ordered pairs and describe the pattern in the graph.
Gloria’s Earnings
Hours, x Dollars Earned, y
Ordered Pair (x, y)
1 5 ( , )
2 10 ( , )
3 15 ( , )
Pattern:

Two friends are each saving money in their bank accounts. Marcus saves $10 each week while David saves $15 per week. Complete each table. Then, graph each person’s ordered pairs.
How do the ratios of Marcus’ savings and David’s savings compare?
Marcus’ Savings
Weeks, x
Savings, y (x, y)
1 10 ( , )
2 20 ( , )
3 30 ( , )
4 40 ( , )
David’s Savings
Weeks, x
Savings, y (x, y)
1 15 ( , )
2 30 ( , )
3 45 ( , )
4 60 ( , )