Embed Size (px)
Citation preview

IJDACR
ISSN: 2319-4863
International Journal of Digital Application & Contemporary research
Website: www.ijdacr.com (Volume 2, Issue 6, January 2014)
SAR Image Compression using Forward Biorthogonal
Wavelet Transform Coupled with SPIHT Algorithm
S.N. Rathnam
V. N. V. Sathya Prakash
Abstract: SAR image compression is very
important in reducing the costs of data storage
and transmission in relatively slow channels. We
propose synthetic aperture radar (SAR) complex
image compression schemes based on
FWT53_FFT with the set partitioning in
hierarchical trees (SPIHT) algorithm. The
FFT53_FFT (Forward biorthogonal 5/3 wavelet
transform) encodes the real images converted by
fast Fourier transform (FFT). The performance
analysis is observed by changing in BPP(Bit per
pixel) for a given image and based on varying BPP
peak signal-to-noise ratio (PSNR) and (Mean
square Error) MSE.
Keywords: FWT, FFT, BPP, PSNR, MSE, SPHIT.
I. Introduction
Data compression is the technique to reduce the
redundancies in data representation in order to
decrease data storage requirements and hence
communication costs [1]. Reducing the storage
requirement is equivalent to increasing the
capacity of the storage medium and hence
communication bandwidth. Thus the
development of efficient compression
techniques will continue to be a design challenge
for future communication systems and advanced
multimedia applications [2] [3]. Data can be
called as a combination of information and
redundancy. Information is the portion of data
that must be preserved permanently in its
original form in order to correctly interpret the
meaning or purpose of the data. Redundancy is
that portion of data that can be removed when it
is not needed or can be reinserted to interpret the
data when needed. Most often, the redundancy is
reinserted in order to generate the original data
in its original form. A technique to reduce the
redundancy of data is defined as Data
compression [2] [3]. There is two types of data
compression lossless and lossy algorithms,
lossless algorithm which can reconstruct the
original data exactly from the compressed data,
and lossy algorithms, which can only reconstruct
an approximation of the original message [3]. In
our work we have selected SAR image because
it has large scope for compression and this
image has varied affliction like a security system
for defense, for natural climatic etc.
SAR images formed from spatially overlapped
radar phase histories are becoming increasingly
important in a variety of remote sensing and
tactical applications. The capability of SAR
sensors to operate in virtually all types of
weather conditions, from very long ranges and
over wide areas of coverage, makes them
extremely attractive for surveillance missions
and for monitoring the earth’s resources. With
the increased popularity and the corresponding
abundance of such imagery, the need to
compress SAR images without significant loss
of image quality has become more urgent. In
addition, because SAR images are interpreted
for content by humans or by machines,
appropriate coding of images enables efficient
and effective machine selection and
interpretation.
IJDACR

IJDACR
ISSN: 2319-4863
International Journal of Digital Application & Contemporary research
Website: www.ijdacr.com (Volume 2, Issue 6, January 2014)
The complex SAR image, which consists of
amplitude and phase, is the first-level image data
of the SARsystem. The phase information
fidelity in complex SAR image is crucial to
some special applications, such as
interferometry and moving target detection.
Therefore, complex SAR image compression
requires not only reasonable amplitude fidelity
but also high phase information accuracy, which
is different from the ordinary optical image
compression. Currently, most compression
algorithms of complex SAR image adopt the
traditional wavelet transform. However, for the
complex SAR images, which are rich in edges
and texture, traditional wavelet transform does
not show efficient representation. Dong et al. [4]
proposed an algorithm which extracted edges of
SAR image with wedge let transform and
encoded the edges and texture separately. Li et
al. [5] used 2-D oriented wavelet transform for
remote sensing compression. The SAR images
used in [4], [5] are not complex SAR images.
The spatial-domain directional wavelet, such as
directional lifting wavelet transform (DLWT),
employs direction prediction for wavelet
decomposition, which adapts the wavelet
transform direction to the image edges. DLWT
[6] – [8] integrates spatial direction prediction
into the wavelet transform lifting framework,
provides an efficient. Mohammed Hamzah Abed
et al. use a modified version of SPIHT for two
dimensional signals which is lossless [9].
G.Chenchu Krishnaiah et al. performs 9/7 and
5/3 wavelets on photographic images
(monochrome and color) and estimated Peak
Signal to Noise Ratio (PSNR) [10]. J. Maly et al.
Proposes an implementation of discrete-time
wavelet transform based image codec using Set
Partitioning in Hierarchical Trees (SPIHT)
coding in the MATLAB environment. The
results show that the CDF 5/3 perform best
results among all tested wavelet families [11].
II. Set Partitioning in Hierarchical Trees
encoder
Probably the most successful variation of the
ideas of Shapiro was Set Partitioning in
Hierarchical Trees (SPIHT) [12]. SPIHT is
based on the concept that the wavelet
coefficients with higher magnitudes should be
transmitted first because they have a more
information content.
Figure 1: Left: The first stage of a 2-D wavelet
transform. Right: after the second stage.
Figure 1 shows how a set of coefficients might
be ordered and the information would be
represented. The number of coefficients 𝜇𝑛 such
that 2𝑛 ≤ |𝑐| < 2𝑛+1 is transmitted along with
this information, where c is the coefficient in
question. This means that only the bits covered
by the arrows in Figure 1 need to be transmitted
because all other bits can be inferred from𝜇𝑛.
Although the coefficients might be ordered in
terms of magnitude, in order to recover the
image in the decoder, the coefficients will have
to be reordered back to their original order. This
ordering information is not transmitted
explicitly, and instead is reconstructed based on
the fact that the decoder duplicates the encoder’s
execution path. Each decision is denoted by
𝑆𝑛(𝑇) = {1 𝑚𝑎𝑥(𝑖,𝑗)𝐸𝑇|𝑐𝑖,𝑗| ≥ 𝑧𝑛
0 𝑜𝑡ℎ𝑒𝑟𝑤𝑖𝑠𝑒
IJDACR
IJDACR
ISSN: 2319-4863
International Journal of Digital Application & Contemporary research
Website: www.ijdacr.com (Volume 2, Issue 6, January 2014)
This indicates the importance of the coordinates
in T, where T is a continually updated set of
coefficient coordinates used in the algorithm. At
each encoding step, the 𝑆𝑛 decision is output,
and thedecoding algorithm looks exactly the
same except that 𝑆𝑛 is input at each step of the
way. This is whatallows the execution path to be
reconstructed and the ordering information
inferred.
SPIHT continually updates a set of internal
buffers that contain coefficients that are in
various stages of the algorithm. SPIHT was
significantly better in terms of SNR than any
other published method
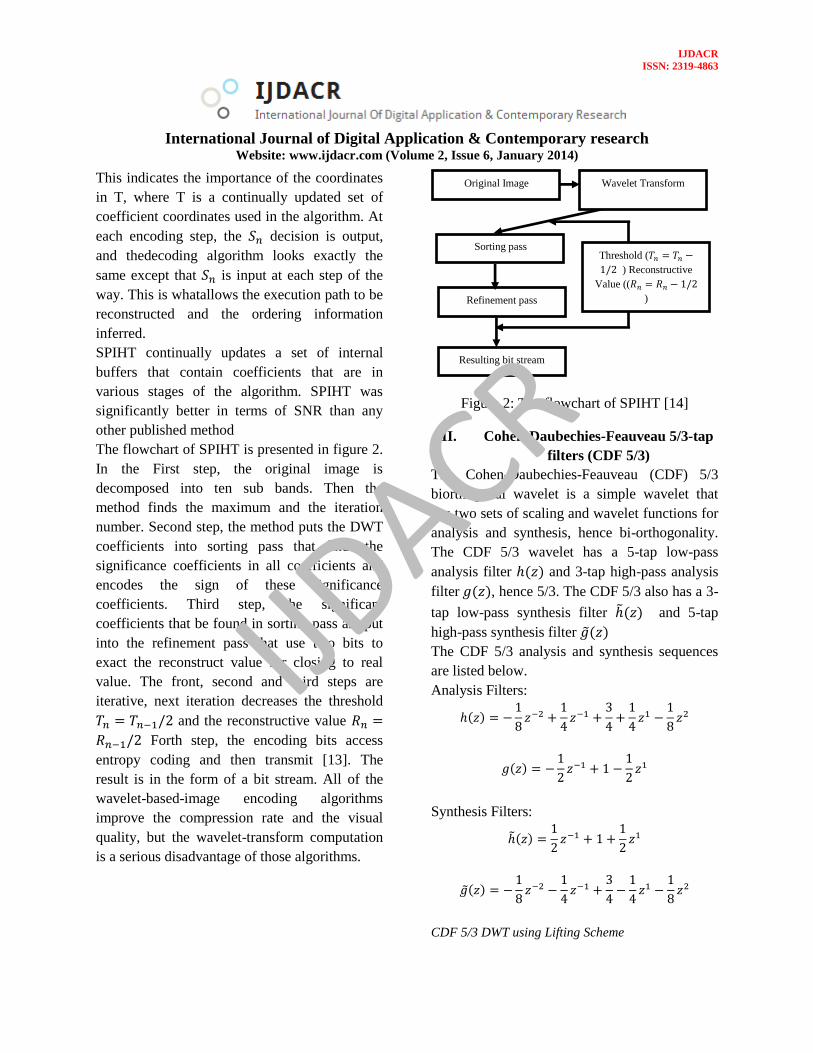
The flowchart of SPIHT is presented in figure 2.
In the First step, the original image is
decomposed into ten sub bands. Then the
method finds the maximum and the iteration
number. Second step, the method puts the DWT
coefficients into sorting pass that finds the
significance coefficients in all coefficients and
encodes the sign of these significance
coefficients. Third step, the significant
coefficients that be found in sorting pass are put
into the refinement pass that use two bits to
exact the reconstruct value for closing to real
value. The front, second and third steps are
iterative, next iteration decreases the threshold
𝑇𝑛 = 𝑇𝑛−1/2 and the reconstructive value 𝑅𝑛 =
𝑅𝑛−1/2 Forth step, the encoding bits access
entropy coding and then transmit [13]. The
result is in the form of a bit stream. All of the
wavelet-based-image encoding algorithms
improve the compression rate and the visual
quality, but the wavelet-transform computation
is a serious disadvantage of those algorithms.
Figure 2: The flowchart of SPIHT [14]
III. Cohen-Daubechies-Feauveau 5/3-tap
filters (CDF 5/3)
The Cohen-Daubechies-Feauveau (CDF) 5/3
biorthogonal wavelet is a simple wavelet that
has two sets of scaling and wavelet functions for
analysis and synthesis, hence bi-orthogonality.
The CDF 5/3 wavelet has a 5-tap low-pass
analysis filter ℎ(𝑧) and 3-tap high-pass analysis
filter 𝑔(𝑧), hence 5/3. The CDF 5/3 also has a 3-
tap low-pass synthesis filter ℎ̃(𝑧) and 5-tap
high-pass synthesis filter �̃�(𝑧)
The CDF 5/3 analysis and synthesis sequences
are listed below.
Analysis Filters:
ℎ(𝑧) = −1
8𝑧−2 +
1
4𝑧−1 +
3
4+
1
4𝑧1 −
1
8𝑧2
𝑔(𝑧) = −1
2𝑧−1 + 1 −
1
2𝑧1
Synthesis Filters:
ℎ̃(𝑧) =1
2𝑧−1 + 1 +
1
2𝑧1
�̃�(𝑧) = −1
8𝑧−2 −
1
4𝑧−1 +
3
4−
1
4𝑧1 −
1
8𝑧2
CDF 5/3 DWT using Lifting Scheme
Original Image
Sorting pass
Refinement pass
Resulting bit stream
Threshold (𝑇𝑛 = 𝑇𝑛 −
1/2 ) Reconstructive
Value ((𝑅𝑛 = 𝑅𝑛 − 1/2
)
Wavelet Transform
IJDACR

IJDACR
ISSN: 2319-4863
International Journal of Digital Application & Contemporary research
Website: www.ijdacr.com (Volume 2, Issue 6, January 2014)
SAR FFT Real image
CDF 5/3 SPIHT
Encoder
SPIHT
Decoder
IDWT Image
The low-pass and high-pass analysis filters for the
CDF 5/3 are restated below with the high-pass filter
translated by 𝑧−1
ℎ(𝑧) = −1
8𝑧−2 +
1
4𝑧−1 +
3
4+
1
4𝑧1 −
1
8𝑧2
𝑧−1𝑔(𝑧) = 𝑧−1 (−1
2𝑧−1 + 1 −
1
2𝑧1)
= −1
2𝑧−2 + 𝑧−1 −
1
2
The polyphase matrix 𝑃(𝑧) for the CDF 5/3 wavelet
is shown below.
𝑃(𝑧) = [−
1
8𝑧−1 +
3
4−
1
8𝑧1 −
1
2𝑧−1 −
1
21
4+
1
4𝑧1 1
]
𝑃(𝑧) = [
3
4−
1
8(𝑧1 + 𝑧−1) −
1
2(𝑧−1 + 1)
1
4(1 + 𝑧1) 1
]
The polyphase matrix can then be factored into two
triangular matrices.
𝑃(𝑧) = [1 −1
2(𝑧−1 + 1)
0 1
] [1 0
1
4(1 + 𝑧1) 1
]
It is apparent that two lift steps are required, one
predict and one update step, to perform the CDF 5/3
DWT. The coefficient for the predict step is:
𝛼 = −1/2
and the coefficient for the update step is:
𝛽 = 1/4
Predict and update equations for the CDF 5/3 filter
are shown below.
𝑃𝑟𝑒𝑑𝑖𝑐𝑡 ∶ 𝑜𝑑𝑑𝑛𝑒𝑤
= 𝑜𝑑𝑑𝑜𝑙𝑑
+ [−1/2(𝑒𝑣𝑒𝑛𝑙𝑒𝑓𝑡 + 𝑒𝑣𝑒𝑛𝑟𝑖𝑔ℎ𝑡)]
𝑈𝑝𝑑𝑎𝑡𝑒 ∶ 𝑒𝑣𝑒𝑛𝑛𝑒𝑤
= 𝑒𝑣𝑒𝑛𝑜𝑙𝑑
+ [1/4(𝑜𝑙𝑑𝑙𝑒𝑓𝑡 + 𝑜𝑙𝑑𝑟𝑖𝑔ℎ𝑡)]
The floor function is used for both predict and update
equations to provide an integer-to integer transform.
The forward CDF 5/3 DWT using the lifting scheme
is shown in Figure 3.
Figure 3: Forward CDF 5/3 DWT using Lifting
Scheme
IV. Proposed work
Figure 4: procedure for image compression
Input
signal
𝑍−1
↓ 2
𝐴 𝐵
Scaling
coef
Wavelet
coef
+ ↓ 2
+
IJDACR

IJDACR
ISSN: 2319-4863
International Journal of Digital Application & Contemporary research
Website: www.ijdacr.com (Volume 2, Issue 6, January 2014)
Initially, put on 1-D FFT transform on the SAR
image and move the negative frequency band to
the positive side, this doubles the original signal
bandwidth and the original frequency signal
focused on the positive side; second, do 1-D
IFFT transform and get a complex signal with
data volume doubled; lastly, characterize the
complex signal with its real part as the
imaginary part and the real part of the complex
signal fulfill the Hilbert transform. The spectrum
movement is corresponding to supplement zeros
on the negative side of the frequency signal and
creates the bandwidth doubled; so, the complex
signal which is the resultant signal of the inverse
FFT transform is corresponding to interpolate
the complex SAR image by every two pixels on
the dimension of transform.
Figure 5: block diagram of FFT
a. Image 1
b. Image 2
c. Image 3
d. Image 4
Complex
SAR Image
1-D IFFT
Spectrum
moving
Real
Image
Real part
extraction
1-D IFFT
IJDACR

IJDACR
ISSN: 2319-4863
International Journal of Digital Application & Contemporary research
Website: www.ijdacr.com (Volume 2, Issue 6, January 2014)
e. Image 5
f. Image 6
Figure 6: real part of testing images
A. Mean Square Error
The MSE of an estimator is one of various ways
to measure the modification between values
created by an estimator and the true values of the
quantity being projected. MSE calculates the
middling of the squares of the "errors." The error
is the quantity by which the value created by the
estimator varies from the quantity to be
projected. The alterationhappenshowing to
arbitrariness or owing to the estimator doesn't
account for data that could yield a more precise
estimate.
𝑀𝑆𝐸 = 1/(𝑀 ∗ 𝑁) ∑ ∑[𝑥(𝑖, 𝑗) − 𝑦(𝑖, 𝑗)]2
𝑁
𝑗=1
𝑀
𝑖=1
B. Peak Signal in Noise Ratio
PSNR is an engineering term for the ratio
between the greatest likely power of a signal and
the power of corrupting noise that affects the
fidelity of its representation. As various signals
have a very extensive dynamic range, PSNR is
generally conveyed in terms of the logarithmic
decibel scale. The PSNR is most commonly used as a
measure of quality of reconstruction by lossless
compression code (e.g., for image compression).
When the pixels are represented using 16 bits per
sample (16 data type images)
𝑃𝑆𝑁𝑅 = 10 ∗ 𝑙𝑜𝑔10 ((65535)2
𝑀𝑆𝐸)
Figure 7: GUI of proposed work
V. Result
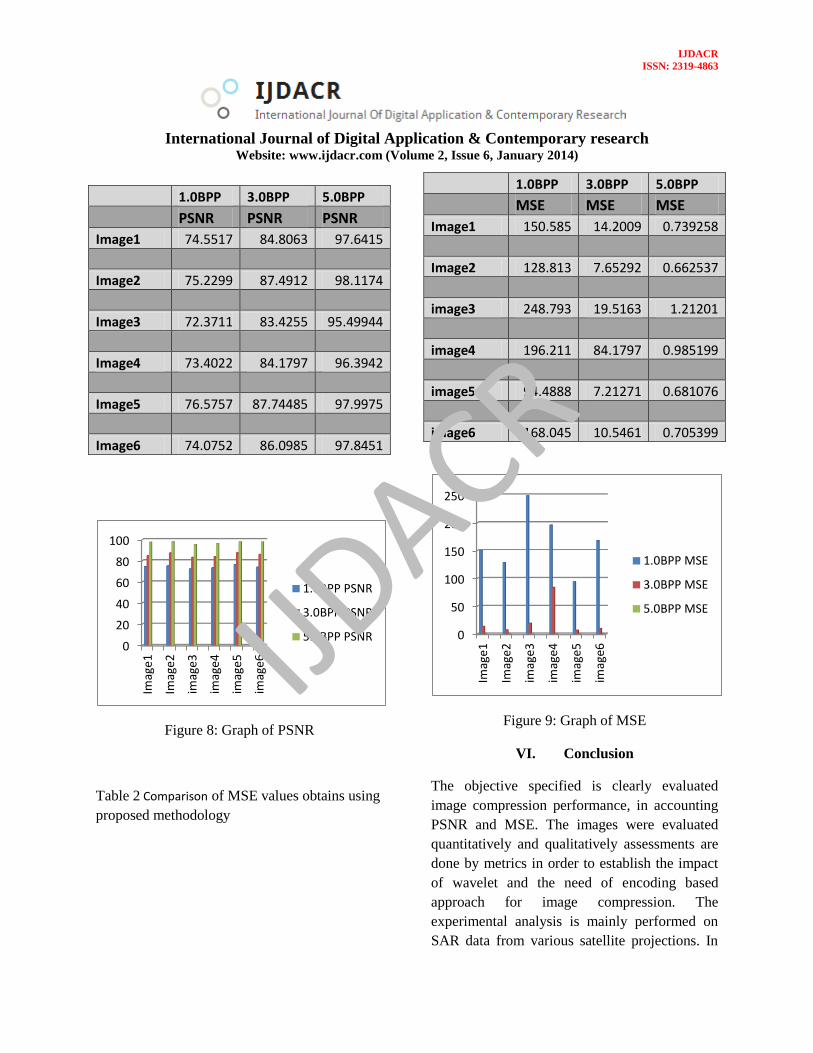
Table 1: Comparison of PSNR values obtains
using proposed methodology
IJDACR
IJDACR
ISSN: 2319-4863
International Journal of Digital Application & Contemporary research
Website: www.ijdacr.com (Volume 2, Issue 6, January 2014)
Figure 8: Graph of PSNR
Table 2 Comparison of MSE values obtains using
proposed methodology
Figure 9: Graph of MSE
VI. Conclusion
The objective specified is clearly evaluated
image compression performance, in accounting
PSNR and MSE. The images were evaluated
quantitatively and qualitatively assessments are
done by metrics in order to establish the impact
of wavelet and the need of encoding based
approach for image compression. The
experimental analysis is mainly performed on
SAR data from various satellite projections. In
0
20
40
60
80
100
Imag
e1
Imag
e2
imag
e3
imag
e4
imag
e5
imag
e6
1.0BPP PSNR
3.0BPP PSNR
5.0BPP PSNR 0
50
100
150
200
250Im
age1
Imag
e2
imag
e3
imag
e4
imag
e5
imag
e6
1.0BPP MSE
3.0BPP MSE
5.0BPP MSE
1.0BPP 3.0BPP 5.0BPP
PSNR PSNR PSNR
Image1 74.5517 84.8063 97.6415
Image2 75.2299 87.4912 98.1174
Image3 72.3711 83.4255 95.49944
Image4 73.4022 84.1797 96.3942
Image5 76.5757 87.74485 97.9975
Image6 74.0752 86.0985 97.8451
1.0BPP 3.0BPP 5.0BPP
MSE MSE MSE
Image1 150.585 14.2009 0.739258
Image2 128.813 7.65292 0.662537
image3 248.793 19.5163 1.21201
image4 196.211 84.1797 0.985199
image5 94.4888 7.21271 0.681076
image6 168.045 10.5461 0.705399
IJDACR

IJDACR
ISSN: 2319-4863
International Journal of Digital Application & Contemporary research
Website: www.ijdacr.com (Volume 2, Issue 6, January 2014)
ending, the FWT along with SPIHT
compression technique allows output as expertly
compressed image, with different operative
importance without changing the pixel accuracy
and image resolution or size. The analysis
presented here will prove useful in studies of
non-stationary in time series, and the addition of
statistical significance tests will improve the
quantitative nature of wavelet analysis.
VII. References
1. William A. Pearlman, “The Set
Partitioning in Hierarchical Trees
(SPIHT) Algorithm”, Rensselaer
Polytechnic Institute, 1997.
2. ARUN KUMAR P S,“Implementation
of Image Compression Algorithm using
Verilog with Area, Power and Timing
Constraints”, Department of Electronics
and Communication Engineering
National Institute of Technology
Rourkela, 2009.
3. Guy E. Blelloch, “Introduction to Data
Compression”, Computer Science
Department Carnegie Mellon
University, 2010.
4. R. Dong, B. Hou, and S. Wang, “SAR
image compression based on Wedgelet-
wavelet,” Signal Process. Image
Enhancement Multimedia Process.vol.
31, pp. 67–75, Dec. 2007.
5. B. Li, R. Rui, and H. X. Jiang, “Remote-
sensing image compression using two-
dimensional oriented wavelet
transform,” IEEE Trans. Geosci.Remote
Sens., vol. 49, no. 1, pp. 236–250, Jan.
2011.
6. W. Ding, F. Wu, and X. Wu, “Adaptive
directional lifting-based wavelet
transform for image coding,” IEEE
Trans. Image Process., vol. 16, no. 2, pp.
416–427, Feb. 2007.
7. Y. Liu and K. N. Ngan, “Weighted
adaptive lifting-based wavelet transform
for image coding,” IEEE Trans. Image
Process., vol. 17, no. 4, pp. 500–511,
Apr. 2008.
8. X. S. Hou, G. F. Jiang, R. Ji, and C. L.
Shi, “Directional lifting wavelet and
universal trellis coded quantization
based image coding algorithm and
objective quality evaluation,” IET Image
Process., vol. 5, no. 8, pp. 693–702,
Dec. 2011.
9. Mohammed Hamzah Abed, C. Namrata
Mahender, “SAR Image Compression
using SPIHT Algorithm”, International
Journal of Computer Applications (0975
– 8887) Volume 22– No.8, May 2011.
10. G.Chenchu Krishnaiah, T.Jaya Chandra
prasadM.N.giri prasad, “Efficient Image
Compression Algorithms Using Evolved
Wavelets”, International Journal of
Systems and Technologies (ISSN: 0974-
5815) Vol.4, No.2, pp 127-146, 2011.
11. J. Malý, P. Rajmic, “DWT-SPIHT
Image Codec Implementation”,
12. A. Said and W. Pearlman, “A new fast
and efficient image codec based on set
partitioning in hierarchical trees,” IEEE
Trans. Circuits and Syst. for Video
Technol., vol. 6, pp. 243–250, Jun1996.
13. Z. Xiong, K. Ramchandran, and M.
Orchard,“Space-frequency quantization
for wavelet image coding”. IEEE Trans.
Image Processing, vol. 6, no.5, May
1997, 677–693.
14. M. Beladgham, A. Bessaid, A. Moulay-
Lakhdar, M. Ben Aissa, A. Bassou,
“MRI Image compression using
IJDACR

IJDACR
ISSN: 2319-4863
International Journal of Digital Application & Contemporary research
Website: www.ijdacr.com (Volume 2, Issue 6, January 2014)
biorthogonal CDFwavelet based on
lifting scheme and SPIHT
coding”Quatrième Conférence
International sur le Génie Electrique
CIGE’10, 03-04 November 2010.
15. A. Jensen, A.la Cour-Harbo: Ripples in
Mathematics, Springer, 2001.
AUTHOR PROFILE
S.N. Rathnam: - M. Tech (DSCE), PG Student,
RGMCET, Nandyal-518501, Kurnool (dist),
Andhra Pradesh, India
V. N. V. Sathya Prakash: - Associate
Professor, School of Electronics &
Communication Engineering, RGMCET,
Nandyal-518 501, Kurnool (dist), Andhra
Pradesh, India
IJDACR