Embed Size (px)
Citation preview

WATERWAYS RESEARCH: QUALITATIVE AND
QUANTITATIVE FINDINGS
OTAGO REGIONAL COUNCIL
VERSUS RESEARCH
DECEMBER 2016

SUMMARY OF FINDINGS
Page 1
USE AND INTERACTIONS The main activities performed in and around the waterways in the Otago region appear to be predominantly based out of the water with relaxing/ sitting/ watching the top mention in terms of activities (68%). This was followed by walking/ walking the dog (59%) and sightseeing (54%). Swimming/ paddling was the key activity performed in the water, mentioned by 53% of residents.
Drinking water for human use was mentioned by 40% of residents in terms of collecting or using the water, and when asked specifically about groundwater 21% of residents stated they used it for human drinking water, with a further 20% using groundwater for watering the garden. In terms of waterways, urban waterways and rivers and streams appear to be used most frequently, with residents more likely to state they had used these waterways either every day, weekly or once or twice a month. Wetlands and estuaries had less frequent usage, with these waterways more likely to not be used at all. Coastal beaches and lakes were used less frequently.
IMPORTANT ATTRIBUTESResidents were asked to identify attributes of the waterways that were important. Key attributes included: the availability for future generations to use; use and access for everyone; supporting healthy and diverse ecosystems; suitability for recreational uses; remaining in its natural form and aesthetic. These attributes were rated highly across all waterbodies.
WATER QUALITYResidents were asked to rate the water quality of the region out of 10, where 1 was very poor water quality and 10 was very good water quality. Just over half (51%) rated the water quality as good (40%) or very good (11%) with most residents less inclined to give either very poor (5%) or very good ratings (11%). Residents were also asked if there were any waterways that they specifically associated with poor or good quality. Taieri River was the most associated river with poor water quality, while Clutha River was the most associated with good quality.
However it is important to note, that both of these rivers had mixed opinions with a proportion of residents mentioning Taieri River as having good quality and vice versa with Clutha River.
When asked to provide a specific reason for rating a waterway as poor quality, key mentions included algae/ rock snot (35%), run off/ excessive dairying (25%), and rubbish/ pollution (25%). Interestingly, when asked to provide indicators for poor water quality, 42% of residents mentioned that poor clarity/ cloudy water was an indicator (42%).
Reasons behind mentioning a waterway as good were largely visual based cues such as looks clear (37%) and clean/ fresh/ pure water (28%). These reasons were iterated further when asked to define what indicates good water quality whereby 62% stated water that is of a good quality looks clear. The addition of healthy plant/ fish life as an indicator for good quality water also featured, with 32% of residents mentioning this.
At a general level, residents were asked to specify any concerns they had about water quality in the region. These were recorded verbatim and post-coded. Dairy farmers received the highest number of mentions, with 19% highlighting this as a concern. This was followed by water quality generally (15%) and rock snot/ algae (13%).
Further emphasising farming effects as a top of mind concern, residents stated key contributors to water pollution in the Otago region were stock having access to waterways (53%), intensive farming (50%), and over application of fertiliser (49%). This was largely repeated at a local level; however, residents had less certainty as to the contributors of water pollution at a local level, with lower proportions mentioning contributors across a wider range of reasons. Stormwater from urban areas also featured as a key contributor to local water pollution.
URBAN AND RURALUrban and rural residents used the waterways in a similar fashion with a few key differences noted. Rural residents were more likely to use waterways for fishing, boating, collecting shellfish, hunting/shooting, and drinking water for stock and were also more likely to be involved in environmental enhancement programs than urban residents. Rural residents were more likely to use rivers and streams, lakes, and wetlands more frequently than urban residents who are more frequent users of beaches. Rural residents also had a much higher use of groundwater than urban residents do.

SUMMARY OF FINDINGS
Page 2
Interestingly rural and urban residents have similar aspects that they felt were important for a waterway with key mentions relating to supporting healthy ecosystems and availability for future generations. Although not significant, urban residents appeared slightly more likely to state that waterways should be left in their natural form while rural residents appeared to be less slightly concerned with this.
At a regional level, both urban and rural residents felt that water pollution was driven by stock having access to water, intensive farming, over application of fertiliser and run off from irrigation. However, there were clear differences in contributors when looking at water pollution at a local level. For rural residents the primary local contributors to water pollution related to stock access, intensive farming, and over-application of fertiliser. For urban residents the primary contributors related to stormwater, stock access, and discharges from industry.
Rural and urban residents rated the water quality across the region in a similar way although urban residents were far more likely to state that poor clarity or cloudy water indicated poor water quality.

Page 3
CONTENTS PAGE
BACKGROUND AND METHOD 4ACTIVITIES 8WATER VALUES AND IMPORTANCE 17WATER QUALITY AND CONCERNS 28DEMOGRAPHIC PROFILES 43DISCUSSION 47APPENDICES 51

Page 4
BACKGROUND AND METHOD

Page 5
BACKGROUND AND OBJECTIVESOtago Regional Council (ORC) encompasses five local councils- Waitaki District Council, Clutha District Council, Dunedin City Council, Central Otago District Council, and Queenstown Lakes District Council. ORC are responsible for protecting the region’s natural environment; integral to this is balancing the need for development and economic growth with residents’ need for good quality natural resources. With a review underway regarding ORC’s approach to water discharge management, ORC commissioned Versus Research to undertake research with the purpose of: • Clarifying the values that residents associate
with water, in order to protect these through the strategy;
• Engaging with the public to ascertain what matters the most to them about the rivers, streams, and coasts in the region, and;
• Understanding perceptions surrounding water quality.
METHODVersus completed a two staged approach to this project; qualitative research, followed by a quantitative survey (a copy of which is included in Appendix 1). Findings from both stages are reported in this document. Qualitative findings are explained in the pages either preceding each section or in yellow text boxes throughout the report. Quantitative results are exemplified through charts and figures.
QUALITATIVE INVESTIGATION The qualitative research was primarily used to ascertain values and identify perceptions. Exploration of reasons, opinions, and motivations around water quality and use was also undertaken.
The qualitative research was conducted online. Completing this research online allowed for greater flexibility, reach, and data collection than with traditional qualitative research methods such as focus groups. The online qualitative research included n=30 participants from across the Otago region. This portion of the research required participants to complete blog posts, forums, and an activity. Participants for the qualitative stage were sourced through Facebook.
QUANTITATIVE SURVEY The qualitative research was followed by an online quantitative survey, this survey was primarily used to verify and expand on qualitative findings.
The quantitative research was conducted via an online survey. A total of n=1,000 responses were collected for this portion of the project. The majority of the participants for this stage (78%)were sourced through post to online recruitment, which involved stratifying the Otago Region electoral roll and randomly selecting n=6,500 residents to post survey invitations letters to. Residents were sent a unique link to the survey and asked to complete this online. Those who were not able to complete the survey online were supplied with a paper copy to fill in and post back to Versus.
This approach to recruitment yielded n=780 responses. To ensure a spread of responses was achieved the post to online recruitment was supported by a Facebook campaign which resulted in a further n=220 responses. The following chart shows a summary of how the surveys were completed:
MARGIN OF ERROR Margin of error (MOE) is a statistic used to express the amount of random sampling error present in a survey’s results. The MOE is particularly relevant when analysing a subset of the data as smaller sample sizes incur a greater MOE. The final quantitative sample size for this study is n=1,000, which gives a maximum margin of error of +/- 3.1% at the 95% confidence interval, that is, if the observed result on the total sample of n=1,000 respondents is 50% (point of maximum margin of error), then there is a 95% probability that the true answer falls between 46.9% and 53.1%.
Online surveys from Facebook campaign, 22%
Online surveys from
postal invitation,
77%
Paper surveys from postal invitation,
1%

Page 6
BACKGROUND AND OBJECTIVESWEIGHTINGAge and gender weightings have been applied to the final data set for this project. Weighting ensures that specific demographic groups are neither under- nor over-represented in the final data set and that each group is represented as it would be in the population.
Age and gender were the variables to weight by as these variables needed to be adjusted the most in order to make the sample as representative as possible. Weighting gives greater confidence that the final results are representative of the Otago Region population overall and are not skewed by a particular demographic group. The proportions used for the gender and age weights were taken from the 2013 Census (Statistics New Zealand). The table below outlines the proportions used for the weights.
STATISTICAL DIFFERENCESThroughout the report, arrows are used to identify where significant differences are observed between districts. An arrow pointing up demonstrates that residents of that district were more likely to pick that measure while an arrow pointing down demonstrates residents from this district were less likely to pick this.
ACHIEVEDSAMPLE
OTAGO POPULATION
Residents aged 18-34 22% 31%
Residents aged 35-59 44% 41%
Residents aged 60+ 33% 28%
Refused 1% -
Males 42% 48%
Females 58% 52%
Refused 2% -

Page 7
SAMPLE PROFILE
The data below shows the unweighted sample achieved (on the left), compared to the population of the Otago region based on the 2013 census.
WAITAKI 9%CLUTHA 6%
DUNEDIN 61%CENTRAL OTAGO 11%
QUEENSTOWN LAKES 13%
AREA
RATEPAYER 78%NON RATEPAYER 22%
RATEPAYER STATUS
18-19 3%20-24 9%25-34 10%35-44 14%45-54 18%55-59 12%60+ 33%
AGE
MALE 41%FEMALE 57%
GENDER
EUROPEAN 87%MAORI 4%
PACIFIC ISLAND 1%ASIAN 3%
OTHER 6%PREFER NOT TO SAY 4%
ETHNICITY*
URBAN 68%RURAL 9%
SEMI RURAL 22%
LOCATION STATUS
WAITAKI 10%CLUTHA 8%
DUNEDIN 60%CENTRAL OTAGO 9%
QUEENSTOWN LAKES 13%
RATEPAYER 68%NON RATEPAYER 32%
18-19 6%20-24 10%25-34 15%35-44 16%45-54 17%55-59 8%60+ 28%
MALE 48%FEMALE 52%
EUROPEAN 79%MAORI 7%
PACIFIC ISLAND 2%ASIAN 5%
OTHER 3%PREFER NOT TO SAY 5%
*MULTIPLE CHOICE RESPONSES
NO DATA AVAILABLE
2016 SURVEY SAMPLE OTAGO REGION POPULATION
REFUSED 2%
REFUSED 1%

Page 8
ACTIVITIES

Page 9
ACTIVITIES | QUAL. FINDINGSThe qualitative component of this research looked predominantly at the interactions that respondents had with the waterways with the purpose of understanding how this affected their relationships with the water, and subsequently the values they placed on waterways.
When looking at how respondents interact with the waterways, it appeared that interaction and use fell into two categories; individual use and group use. Each type of use carried a different purpose, and therefore different expectations on the role of the waterways in this interaction, with individual use situated primarily out of the water, and group use primarily in the water.
Furthermore, respondents identified their appreciation of water as a valuable drinking source for both humans and animals, and identified it as a life source, showing a recognition of the role of water outside of the recreational or leisure space.
Using the qualitative findings as a foundation for understanding how people use and interact with the water, the following section outlines the quantitative findings with regards to the activities residents perform in the water and out of the water, as well as for collection and use.
“There is no other place where the sun rises above the pristine ocean shortly after 8am in the winter
months, revealing the cold, desolate beach, where I could forget about the woes of the week and enjoy
the solitude, the only sound being the crashing waves, the howling wind and the soft shuffle of my
dog’s paws on the sand.”
“The whole family gets in to skiing and biscuiting and fishing. It’s great to be able to pull the boat right up on the beach and spend hot summer days there. My kids will grow up with lots of memories of this
place and will probably learn to swim and ski here.”

Page 10
Swimming/ paddling
ACTIVITIES | IN THE WATER
Residents were presented with a list of activities commonly undertaken in the waterways, and were asked to select which activities they have used the waterways for in the last 12 months. Using the qualitative findings as a guide, these have been subsequently grouped into three categories: in the water, out of the water, and collection and use.
Sixty five per cent of residents reported undertaking an in the water activity in the last 12 months.
The activity most commonly performed in the water was identified as swimming/ paddling, with just over half of residents indicating they had used the waterways for swimming/ paddling purposes in the last 12 months. Boating, either motorised (23%) or in another form (12%), featured at a lower level, while 16% mentioned they had used the waterways for kayaking in the last 12 months. Seven per cent of residents had been water-skiing in the last 12 months, while 6% had been surfing.
Water- skiing
Boating- other
Kayaking
Boating- motorised
Surfing
53%
23%
16%
12%
7%
6%
In the water use appears to be more group oriented and recreationally focused, with
swimming, camping, boating, biscuiting etc. common mentions as group interactions. This
water use facilitates a connection with others, and the pleasure gained from the water is centred around being able to enjoy it and experience
it with those around you, therefore creating memories and stories.
Q: In the last 12 months, which of the following activities have you used the waterways including coastal beaches, estuaries, rivers/ streams, lakes, wetlands in the Otago region for?

Page 11
Relaxing/ sitting/ watching
By comparison, activities performed out of the water, featured more strongly than activities undertaken in the water, with ‘out of the water’ activities being carried out by a total of 91% of respondents in the last 12 months.
It is interesting to note how the activities most performed out of the water align with the notion of individual activities as observed in the qualitative stage of this research. With this, relaxing/ sitting/ watching the water was a popular activity, with 68% of residents mentioning they have interacted with the water in this way in the last 12 months. This was followed by, other more individually-focused activities, with walking/ walking the dog (59%) and sightseeing (54%) mentioned highly. Thirty per cent of residents mentioned they use the waterways for photography/ painting purposes, indicating a visual appreciation for the waterways.
ACTIVITIES | OUT OF THE WATER
Duck feeding
Camping
Wildlife spotting
Cycling
Tramping/ hiking
Photography/ painting
Picnicking
Sightseeing
Walking/ walking the dog
68%
59%
54%
44%
30%
29%
28%
28%
26%
25%
Out of the water use appears to be more centred on relaxing, taking time out, and creating an inner connection with one’s self, rather than outwardly
connecting with others. The role of the waterways is to be a relaxing and beautiful backdrop, with the sights and sounds encouraging a tranquil
moment of peace. Therefore the aesthetic elements are more important for this individual use, the look of the water and the surrounds, the plants and wildlife etc. are valuable elements in
this type of interaction.
Q: In the last 12 months, which of the following activities have you used the waterways including coastal beaches, estuaries, rivers/ streams, lakes, wetlands in the Otago region for?

Page 12
Drinking water- human
Using the water for any collect and use purpose in the last 12 months was reported by a total of 71% of residents.
Using the water in the region for human drinking water (40%) was the key ‘collect and use’ interaction that residents had with the waterways in the last 12 months. In addition to fishing (30%), 13% of residents mentioned that they collect other kai/ food from in and around the waterways, namely shellfish, watercress, whitebait. Furthermore, the collection of shells, stones and driftwood was also mentioned by a quarter of residents.
Fourteen per cent of residents have been involved in protecting the waterways by way of planting, collecting litter, or participating in an environmental enhancement programme. An additional 9% mentioned they have interacted with the waterways through their hunting and duck- shooting pursuits, while 5% have used the waterways for drinking water for their stock.
ACTIVITIES | COLLECT AND USE
Fishing
Collecting shells/ stones etc.
Planting, collecting litter
Collecting shellfish etc.
GROUNDWATER
16%
1%
1%
9%
20%
21%
55%
I am not sure
Other - Write In (Required)
Larger scale irrigation
Animal drinking water
Watering the garden
Human drinking water
I do not use groundwater
When asked specifically about groundwater use, 55% of residents indicated that they did not use groundwater, with a further 16% unsure. Twenty one per cent stated they used it for human drinking water, and 20% for watering the garden. Nine per cent used groundwater for animal drinking water, and 1% for larger scale irrigation.
Hunting, duck shooting
Drinking water- stock
40%
30%
25%
14%
13%
9%
5%
Q: In the last 12 months, which of the following activities have you used the waterways including coastal beaches, estuaries, rivers/ streams, lakes, wetlands in the Otago region for?

Page 13
Rivers and streams were more likely to be used every day, weekly, or once or
twice a month
ACTIVITIES | FREQUENCY
Wetlands and estuaries were more
likely to not be used at all
Coastal beaches were more likely to be used once or twice a month or less than monthly
Lakes were more likely to be used less
than monthly
Urban waterways were more likely to be used every day, weekly, or once or
twice a month
6% 18% 26% 36% 12%
Rivers and streams
3% 9% 32% 52%
Wetlands
4% 11% 36% 43% 5%
Estuaries
12% 26% 44% 13%
Coastal beaches
6% 17% 26% 35% 12%
Urban waterways
Lakes
10% 17% 47% 20%
Q: In the past year, how often have you done activities in and around the following types of waterways?
3% of respondents reported not using the waterways at all. These
residents were more likely to be aged 60+.
Every day Once or twice a week Once or twice a month Less than monthly Not at all Don’t know/ not sure

Page 14
CanterburyWest Coast
Southland
Queenstown LakesWaitaki
Central Otago
Dunedin
Clutha
DISTRICT DIFFERENCES | USE
Central Otago69% Relaxing / sitting / watching and listening to water 58% Walking, walking the dog 54% Swimming / paddling / jumping in water 48% Fishing 48% Sight seeing45% Drinking water (human use)42% Boating motorized 42% Cycling 38% Picnicking 30% Photography / painting
Clutha55% Walking, walking the dog50% Relaxing / sitting / watching and listening to water 47% Sight seeing46% Fishing42% Swimming / paddling / jumping in water36% Hunting / duck shooting35% Picnicking34% Boating motorized29% Drinking water (human use)22% Collecting fresh water shellfish, watercress, whitebaiting
Dunedin68% Relaxing / sitting / watching and listening to water59% Walking, walking the dog53% Sight seeing53% Swimming / paddling / jumping in water44% Picnicking36% Drinking water (human use)31% Photography / painting28% Tramping / hiking27% Bird watching / wildlife spotting27% Feeding the ducks
Queenstown Lakes78% Relaxing / sitting / watching and listening to water64% Sight seeing63% Swimming / paddling / jumping in water61% Walking, walking the dog60% Drinking water (human use)56% Cycling53% Picnicking53% Tramping / hiking49% Camping40% Fishing
Waitaki69% Relaxing / sitting / watching and listening to water59% Sight seeing58% Swimming / paddling / jumping in water58% Walking, walking the dog44% Picnicking42% Drinking water (human use)37% Fishing34% Bird watching / wildlife spotting32% Collecting shells/stones/driftwood30% Photography / painting
The image below shows the top ten activities conducted in each district. Residents in Central Otago were more likely to mention fishing and boating while Queenstown Lakes residents were more likely to state that they had undertaken tramping around waterways, residents in both of these districts were also more likely to state that they cycled around the waterways.
NOTE: An arrow pointing up indicates that residents of that district were more likely to give that response. An arrow pointing down indicates residents of that district were less likely to give that response.

Page 15
CanterburyWest Coast
Southland
Queenstown LakesWaitaki
Central Otago
Dunedin
Clutha
DISTRICT DIFFERENCES | FREQUENCY
Central Otago69% Lakes61% Rivers and streams44% River / pond / beach in an urban setting13% Wetlands7% Estuaries3% Coastal beaches
Clutha58% Rivers and streams34% River / pond / beach in an urban setting33% Coastal beaches24%Lakes16% Estuaries14% Wetlands
Dunedin53% Coastal beaches50% River / pond / beach in an urban setting43% Rivers and streams19% Estuaries16% Lakes11% Wetlands
Queenstown Lakes 88% Lakes75% Rivers and streams51% River / pond / beach in an urban setting26% Wetlands6% Estuaries9% Coastal beaches
Waitaki59% Rivers and streams53% Coastal beaches47% River / pond / beach in an urban setting25% Lakes17% Wetlands16% Estuaries
The image below shows the proportion of residents who used a particular waterway monthly or more often. The most commonly used waterways were rivers and streams and lakes with Queenstown Lakes and Central Otago residents particularly frequent lakes users. Dunedin and Waitaki residents appeared more likely than residents from other districts to use coastal beaches.
NOTE: An arrow pointing up indicates that residents of that district were more likely to give that response. An arrow pointing down indicates residents of that district were less likely to give that response.

Page 16
CanterburyWest Coast
Southland
Queenstown LakesWaitaki
Central Otago
Dunedin
Clutha
DISTRICT DIFFERENCES | GROUNDWATER
Central Otago46% Human drinking water39% Watering the garden18% Animal drinking water4% Larger scale irrigation36% Do not use groundwater13% Unsure
Clutha21% Watering the garden16%Human drinking water11% Animal drinking water2% Other 59% Do not use groundwater19% Unsure
Dunedin16% Watering the garden15% Human drinking water6% Animal drinking water1% Other 59% Do not use groundwater17% Unsure
Queenstown Lakes 35% Human drinking water31% Watering the garden15% Animal drinking water6% Larger scale irrigation4% Other 45% Do not use groundwater13% Unsure
Waitaki20% Human drinking water19% Watering the garden15% Animal drinking water50% Do not use groundwater20% Unsure
The image below shows the use of groundwater across the different districts. Central Otago and Queenstown Lakes residents had much higher use of groundwater for drinking purposes and watering the garden while Dunedin residents were less likely to use groundwater generally.
NOTE: An arrow pointing up indicates that residents of that district were more likely to give that response. An arrow pointing down indicates that residents of that district were less likely to give that response.

Page 17
WATER VALUES AND IMPORTANCE

Page 18
BELIEFSThe qualitative research uncovered the way in which the use and interactions with the waterways affect corresponding beliefs surrounding water; with both individual and group use, there is the inherent expectation that water will be available for use, that its use will be unrestricted, and always accessible.
These beliefs appear to be formed partly due to the nature of the region; the Otago region is an expanse of land which encompasses a range of waterways. There are very few places in this region where residents would not have some sort of interaction with the water. Interacting with the waterways in some way is generally unavoidable, while residents may not all be active water users, they are certainly driving past a waterway at some stage, as described by one qualitative respondent, it is the “back drop to our lives”.
This expectation is also driven by New Zealand culture generally with many respondents noting the New Zealand culture is one which is very connected to both land and sea; New Zealanders are connected with the outdoors, and many respondents noted that it is rooted in our upbringing. This appears to be quite an ingrained part of New Zealand culture, and is evident for both Maori and non-Maori respondents. This is seen particularly through the Maori culture, with an appreciation of the water as a source of life, gathering food etc.
The qualitative findings indicated that for all water uses water health is a key expectation; the water is expected to be clean, and of a health that is acceptable to swim in, free of pollution and weeds.
SURFACE VALUESValues largely concern an individual’s goals and serve as guiding standards in his or her life; with regards to water, these values determine the relationships with the waterways.
At the surface, values are largely focused in the ‘present’, specifically how water affects our lives now. Values associated at this level appear to be largely hedonistic. With this, water is used in the pursuit of pleasure, such as entertainment, recreation, creating memories, and ‘taking time out for me’. The role of water at this stage is seen predominantly as a facilitator in this, that is, water is there for ME to use it to enjoy and experience.
Tying in with the belief that water will always be accessible, available and unrestricted, is the premise that water is a constant; it will always be there.
WATER VALUES|QUAL. FINDINGS
Page 19
WATER VALUES|QUAL. FINDINGS
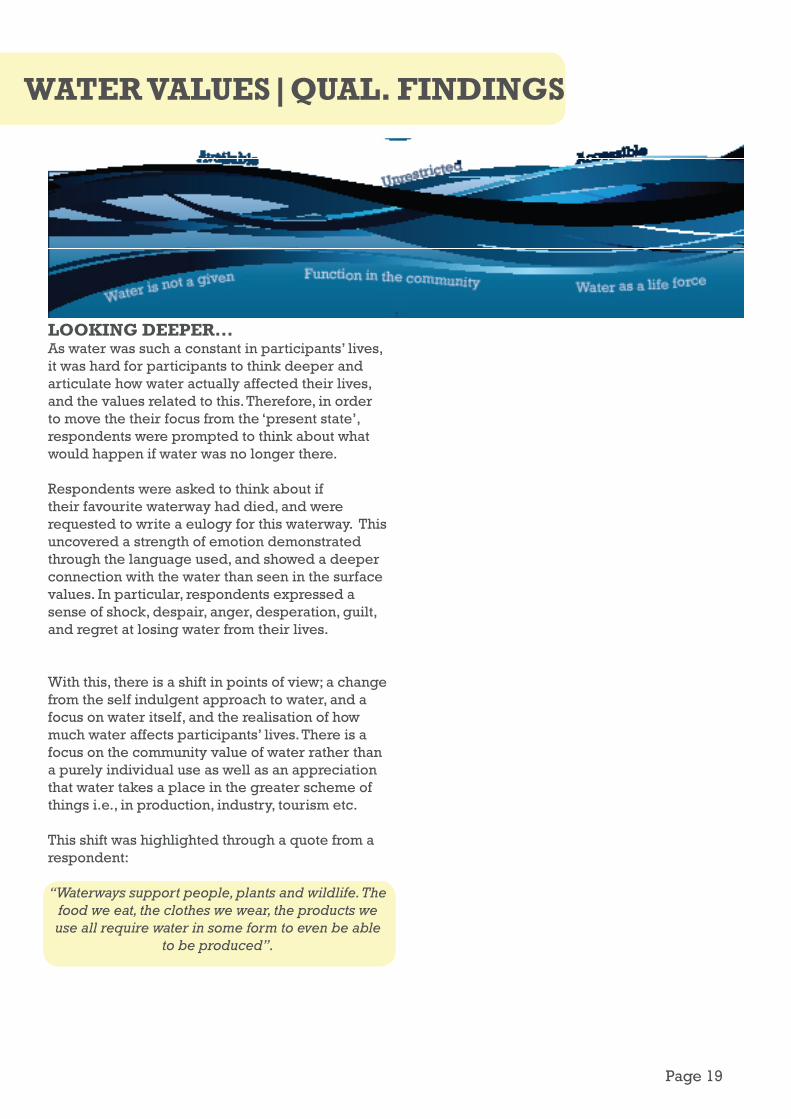
LOOKING DEEPER...As water was such a constant in participants’ lives, it was hard for participants to think deeper and articulate how water actually affected their lives, and the values related to this. Therefore, in order to move the their focus from the ‘present state’, respondents were prompted to think about what would happen if water was no longer there.
Respondents were asked to think about if their favourite waterway had died, and were requested to write a eulogy for this waterway. This uncovered a strength of emotion demonstrated through the language used, and showed a deeper connection with the water than seen in the surface values. In particular, respondents expressed a sense of shock, despair, anger, desperation, guilt, and regret at losing water from their lives.
With this, there is a shift in points of view; a change from the self indulgent approach to water, and a focus on water itself, and the realisation of how much water affects participants’ lives. There is a focus on the community value of water rather than a purely individual use as well as an appreciation that water takes a place in the greater scheme of things i.e., in production, industry, tourism etc.
This shift was highlighted through a quote from a respondent:
“Waterways support people, plants and wildlife. The food we eat, the clothes we wear, the products we use all require water in some form to even be able
to be produced”.

Page 20
EMBEDDED VALUESFollowing this shift, we can uncover the deeper, embedded values that lie beneath the surface values. These appear to be rooted firmly in the past and future, as outlined below:
PASTMeaningful relationship: There becomes more of a focus on the relationship with water in a deeper sense. With this, there appears to be more of a reflection on the connection with water as more of a person- to-person relationship i.e., how I would relate to a family member. The role of water in creating memories becomes more important, and respondents question whether these memories have been as strong if this particular waterbody was not involved.
Respect for history: With this, there appears to be a sense of respect for the life of the waterways. Acknowledgment is made about how long the waterways have been there and there is a sense of a respect for their existence for previous generations.
Hindsight: When thinking about the non-existence of waterways there is an overwhelming sense of the fortitude of hindsight; we could have done more, we should have done more. Respondents began to think retrospectively about preventing the deterioration of water, noticing changes that had occurred and feeling like more could have been done.
FUTUREProtection: This value focused predominantly on protecting the water and ensuring it can be used in the future. With the over arching surface belief that water should be unrestricted, accessible and available, respondents begin to realise that they need to make changes in order for this to be a reality in the future. With this, there is a recognition
that water needs to be protected, either through legislation, through individual and collective responsibility, through industry changes, or through education.
Connectedness: Rather than a focus solely on what water can do for us, respondents began to think in terms of how they affect water and in turn how water affects them. There is an appreciation that not only is water there to serve us, as seen in the surface values, but that they have a role in being there for water. Therefore it is an equal relationship rather than one sided. If we look after water, then water will continue to be there.
Precious/ prized resource: Water is now no longer a given, and functions more than just a ‘back-drop’. When respondents start looking at what it would be like if water was no longer there, they start uncovering the deeper values of water as a precious and prized resource. The language used here asserts water as a treasure/ taonga to be passed on to future generations. Again, there is an appreciation of their role in ensuring this happens.
Values are a more personal and fluid concept and can change as a person progresses through life stages, and different situations, thus these themes and concepts are difficult to measure quantitatively. With this, the aforementioned themes were constructed in a more tangible sense for quantitative respondents to measure in terms of importance, and these results are outlined in the following pages.
WATER VALUES|QUAL. FINDINGS

Page 21
The top 5 stated importance attributes are ranked in order
on the left hand side of the page.
Stated Importance: Attribute 1
Residents were asked to answer questions relating to aspects about the waterways that they consider important, and this was constructed through two questions; stated and derived importance.
Stated importance: is used to identify the attributes which were considered to be top of mind for residents. The top five stated importance attributes are ranked in order on the left hand side of the page. The attributes which score highly on the stated importance scale indicate the elements residents perceive to be generally important when managing a waterway.
Derived importance: is used to look deeper at more subconscious factors which are likely to affect behaviour. The results for the derived importance are shown in chart format and are ordered by their importance based on the number of times they were selected as most important relative to the number of times they were selected as least important (charted example below, further details of this analysis are included in Appendix 2). This analysis provides an indication of which attributes will have the greatest affect how residents interact with a waterway.
Both stated and derived importance should be considered when prioritising attributes for a given waterway’s management, elements which score highly on both sets of analysis should be considered as most critical in future management plans as they are both overtly expected by residents and will also affect behaviour.
IMPORTANCE: Example
Stated Importance: Attribute 2
Stated Importance: Attribute 3
Stated Importance: Attribute 4
Stated Importance: Attribute 5
6%
6%
9%
10%
16%
16%
16%
18%
20%
26%
28%
39%
43%
45%
39%
49%
24%
34%
23%
16%
20%
16%
11%
27%
5%
21%
4%
3%
6%
59%
45%
70%
58%
67%
68%
64%
67%
71%
54%
69%
52%
57%
54%
49%
0% 20% 40% 60% 80% 100%
The depth/ volume of thewater
Feeling secluded
Smell of the water
Facilities at and around thewater
Landscaping andmaintenance
Scenic value
Accessibility
Being able to use waterwaysnearby
Level of algae present
Collecting and consumingkai/food
Clarity of the water
Being able to swim
Absence of litter
Sustains ecosystems/wildlife
Preservation of natural stateand surroundings
Most Least Not chosen
DERIVED IMPORTANCE

Page 22
Is available for future generations
to use
Availability and access of coastal beaches emerges as a priority for residents, with 60% stated importance for availability for future generations to use and access for everyone (53%). This corresponds with a high derived importance for preservation of the natural state and surroundings, indicating this would affect both perception of, and behaviour for, using coastal beaches.
Further to this, a respect for coastal beaches in terms of a healthy and diverse ecosystem is also apparent, with 51% stated importance for coastal beaches supporting healthy and diverse ecosystems, and a further 43% choosing this as the most important attribute in terms of derived importance.
DERIVED IMPORTANCE
COASTAL BEACHES
60%
Can be used by and accessed by
everyone53%
Supports healthy and diverse ecosystems
51%
Is suitable for recreational uses
42%
Remains in its natural form and
aesthetic33%
“Good if it can be used for swimming, and no warnings about what could be in the
water. Bad if it’s polluted and has garbage everywhere.”
6%
6%
9%
10%
16%
16%
16%
18%
20%
26%
28%
39%
43%
45%
39%
49%
24%
34%
23%
16%
20%
16%
11%
27%
5%
21%
4%
3%
6%
59%
45%
70%
58%
67%
68%
64%
67%
71%
54%
69%
52%
57%
54%
49%
0% 20% 40% 60% 80% 100%
The depth/ volume of thewater
Feeling secluded
Smell of the water
Facilities at and around thewater
Landscaping andmaintenance
Scenic value
Accessibility
Being able to use waterwaysnearby
Level of algae present
Collecting and consumingkai/food
Clarity of the water
Being able to swim
Absence of litter
Sustains ecosystems/wildlife
Preservation of natural stateand surroundings
Most Least Not chosenQ: Which of the following attributes is the most and least important for... Q: Please choose up to three statements that you agree with the most. It is important that...

Page 23
Supports healthy and diverse ecosystems
The concept of water health appears prevalent for estuaries, with 64% stated importance on the healthy and diverse ecosystem, corresponding with the highest proportion choosing sustains ecosystems/ wildlife as the most important attribute for derived importance. Further to this, 52% rated the preservation of the natural state and surrounding area in terms of derived importance, as well as a further 36% rating the absence of litter in and around the water for derived importance.
The availability of estuaries for future generations also features as an important stated attribute, with 55% choosing this, followed by a further 42% selecting access and use for everyone as an important stated attribute.
DERIVED IMPORTANCE
ESTUARIES
64%
Is available for future generations
to use55%
Can be used by and accessed by
everyone42%
Remains in their natural form and
aesthetic41%
Is suitable for recreational uses
23%
“I think you could measure the quality of water by the quality and type of life it maintains.”
4%
6%
8%
10%
13%
13%
14%
19%
19%
21%
22%
36%
52%
58%
52%
32%
40%
25%
19%
18%
26%
21%
6%
20%
9%
22%
2%
3%
3%
45%
64%
54%
67%
71%
69%
60%
65%
75%
61%
70%
56%
61%
45%
39%
0% 20% 40% 60% 80% 100%
Feeling secluded
The depth/ volume of thewater
Facilities at or around thewater
Smell of the water
Being able to use waterwaysnearby
Scenic value
Landscaping andmaintenance
Accessibility
Level of algae present
Being able to swim
Clarity of the water
Collecting and consumingkai/food
Absence of litter
Preservation of natural stateand surrounding area
Sustains ecosystems/wildlife
Most Least Not chosen
Q: Which of the following attributes is the most and least important for... Q: Please choose up to three statements that you agree with the most. It is important that...
Page 24
Supports healthy and diverse ecosystems
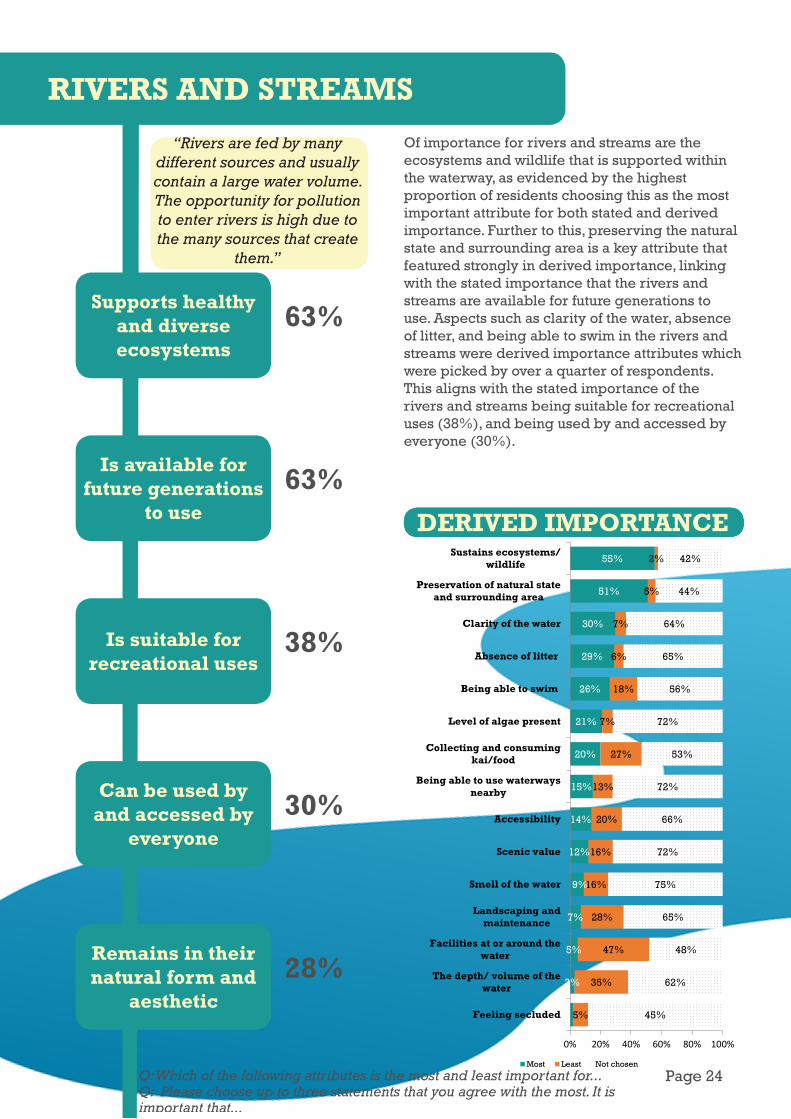
Of importance for rivers and streams are the ecosystems and wildlife that is supported within the waterway, as evidenced by the highest proportion of residents choosing this as the most important attribute for both stated and derived importance. Further to this, preserving the natural state and surrounding area is a key attribute that featured strongly in derived importance, linking with the stated importance that the rivers and streams are available for future generations to use. Aspects such as clarity of the water, absence of litter, and being able to swim in the rivers and streams were derived importance attributes which were picked by over a quarter of respondents. This aligns with the stated importance of the rivers and streams being suitable for recreational uses (38%), and being used by and accessed by everyone (30%).
DERIVED IMPORTANCE
RIVERS AND STREAMS
63%
Is available for future generations
to use63%
Is suitable for recreational uses
38%
Can be used by and accessed by
everyone30%
Remains in their natural form and
aesthetic28%
“Rivers are fed by many different sources and usually contain a large water volume. The opportunity for pollution to enter rivers is high due to the many sources that create
them.”
3%
5%
7%
9%
12%
14%
15%
20%
21%
26%
29%
30%
51%
55%
5%
35%
47%
28%
16%
16%
20%
13%
27%
7%
18%
6%
7%
5%
2%
45%
62%
48%
65%
75%
72%
66%
72%
53%
72%
56%
65%
64%
44%
42%
0% 20% 40% 60% 80% 100%
Feeling secluded
The depth/ volume of thewater
Facilities at or around thewater
Landscaping andmaintenance
Smell of the water
Scenic value
Accessibility
Being able to use waterwaysnearby
Collecting and consumingkai/food
Level of algae present
Being able to swim
Absence of litter
Clarity of the water
Preservation of natural stateand surrounding area
Sustains ecosystems/wildlife
Most Least Not chosen
Q: Which of the following attributes is the most and least important for... Q: Please choose up to three statements that you agree with the most. It is important that...

Page 25
Is available for future generations
to use
Similarly to rivers and streams, key stated importance to residents is that lakes are available for future generations to use (61%) and that they support healthy and diverse ecosystems (60%). This is also seen through the derived importance whereby a high proportion of residents choose sustenance of eco-systems/ wildlife (55%) and the preservation of the natural state and surroundings (43%) as most important. As with rivers and streams, the recreational value of lakes is also highlighted, with 44% stating it is important that the lakes are suitable for recreational uses, and a further 29% stating that they can be accessed and used by everyone is important. This corresponds with results seen in the derived importance ratings whereby absence of litter, and being able to swim feature as important attributes, and are likely to affect behaviour. Feeling secluded at the lakes is of little importance to residents, with 55% choosing this as least important, and a further 41% stating the facilities around the water were of least importance.
LAKES
61%
Supports healthy and diverse ecosystems
60%
Is suitable for recreational uses
44%
Can be used by and accessed by
everyone29%
Remains in its natural form and
aesthetic27%
“Lake Wanaka is the backdrop of my life and forms a large part of that life, from swimming and boating,
or hanging out with friends on the shoreline, to sitting watching out
over the lake as the sun goes down.”
7%
10%
10%
11%
11%
20%
27%
27%
31%
33%
43%
55%
55%
41%
28%
28%
17%
23%
16%
22%
26%
7%
6%
16%
3%
8%
43%
54%
66%
65%
73%
66%
73%
67%
54%
67%
68%
52%
63%
49%
43%
0% 20% 40% 60% 80% 100%
Feeling secluded
Facilities at and around thewater
The depth/ volume of thewater
Landscaping andmaintenance
Smell of the water
Accessibility
Scenic value
Being able to use waterwaysnearby
Collecting and consumingkai/food
Level of algae present
Clarity of the water
Being able to swim
Absence of litter
Preservation of natural stateand surroundings
Sustains ecosystems/wildlife
Most Least Not chosen
DERIVED IMPORTANCE
Q: Which of the following attributes is the most and least important for... Q: Please choose up to three statements that you agree with the most. It is important that...
Page 26
Supports healthy and diverse ecosystems
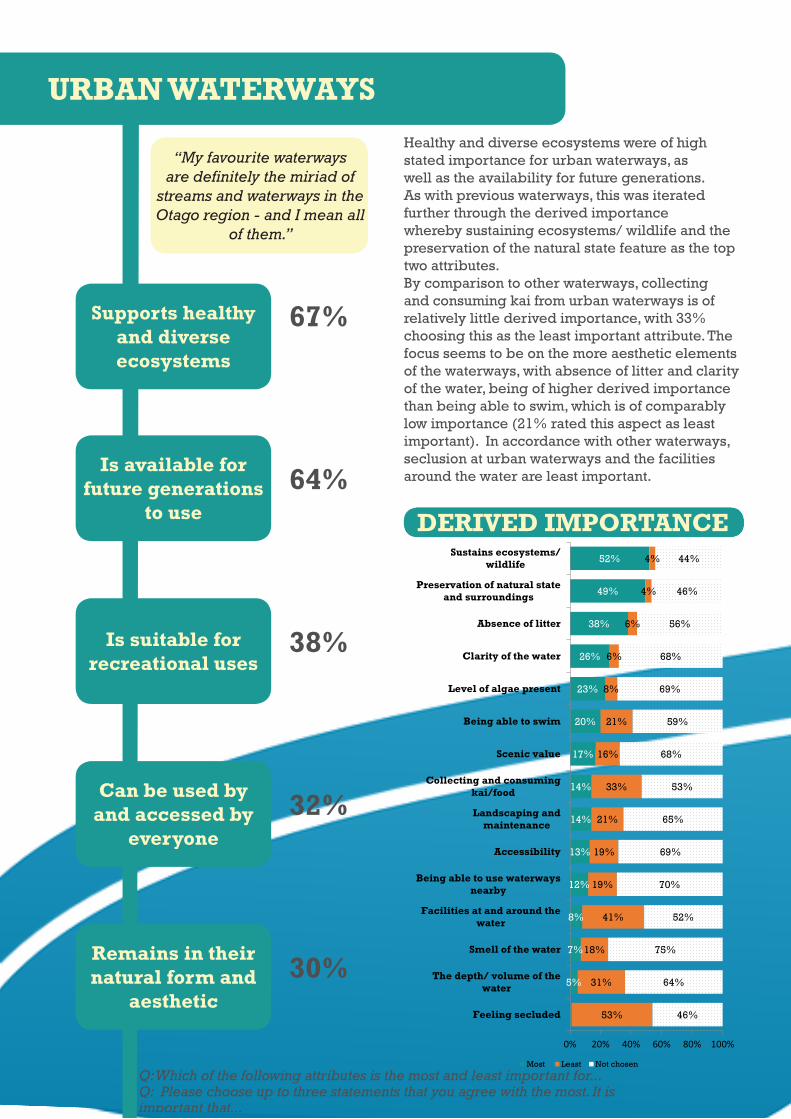
Healthy and diverse ecosystems were of high stated importance for urban waterways, as well as the availability for future generations. As with previous waterways, this was iterated further through the derived importance whereby sustaining ecosystems/ wildlife and the preservation of the natural state feature as the top two attributes. By comparison to other waterways, collecting and consuming kai from urban waterways is of relatively little derived importance, with 33% choosing this as the least important attribute. The focus seems to be on the more aesthetic elements of the waterways, with absence of litter and clarity of the water, being of higher derived importance than being able to swim, which is of comparably low importance (21% rated this aspect as least important). In accordance with other waterways, seclusion at urban waterways and the facilities around the water are least important.
DERIVED IMPORTANCE
URBAN WATERWAYS
67%
Is available for future generations
to use64%
Is suitable for recreational uses
38%
Can be used by and accessed by
everyone32%
Remains in their natural form and
aesthetic30%
“My favourite waterways are definitely the miriad of
streams and waterways in the Otago region - and I mean all
of them.”
5%
7%
8%
12%
13%
14%
14%
17%
20%
23%
26%
38%
49%
52%
53%
31%
18%
41%
19%
19%
21%
33%
16%
21%
8%
6%
6%
4%
4%
46%
64%
75%
52%
70%
69%
65%
53%
68%
59%
69%
68%
56%
46%
44%
0% 20% 40% 60% 80% 100%
Feeling secluded
The depth/ volume of thewater
Smell of the water
Facilities at and around thewater
Being able to use waterwaysnearby
Accessibility
Landscaping andmaintenance
Collecting and consumingkai/food
Scenic value
Being able to swim
Level of algae present
Clarity of the water
Absence of litter
Preservation of natural stateand surroundings
Sustains ecosystems/wildlife
Most Least Not chosen
Q: Which of the following attributes is the most and least important for... Q: Please choose up to three statements that you agree with the most. It is important that...

Page 27
Supports healthy and diverse ecosystems
Stated importance ratings for wetlands supporting healthy and diverse ecosystems are the highest across all waterways, with 79% of residents choosing this as an important attribute, and a further 59% in derived importance. The recreational value of wetlands is relatively low, with only 22% of residents choosing this as a stated important attribute, further highlighted by 28% of residents stating that being able to swim is least important for wetlands in the derived importance. This is also shown through aspects such as accessibility, and being able to use the waterways featuring lower down in terms of derived importance. Interestingly, 66% of residents did not choose either most or least important for the depth/ volume of wetlands, indicating that this attribute is one which is not closely associated with wetlands, or is not regarded as being a contributing factor either way.
DERIVED IMPORTANCE
WETLANDS
79%
Is available for future generations
to use69%
Remains in their natural form and
aesthetic40%
Can be used by and accessed by
everyone26%
Is suitable for recreational uses
22%
“This place holds many fond memories for me. The area is
rich in birdlife andmakes me feel connected to
nature.”
7%
9%
12%
13%
15%
16%
17%
20%
27%
37%
54%
59%
3%
48%
36%
21%
23%
19%
14%
16%
10%
30%
28%
9%
5%
66%
47%
57%
72%
68%
69%
73%
69%
74%
53%
51%
64%
62%
42%
38%
0% 20% 40% 60% 80% 100%
The depth/ volume of thewater
Feeling secluded
Facilities at and around thewater
Smell of the water
Accessibility
Landscaping andmaintenance
Being able to use waterwaysnearby
Scenic value
Level of algae present
Collecting and consumingkai/food
Being able to swim
Clarity of the water
Absence of litter
Preservation of natural stateand surroundings
Sustains ecosystems/wildlife
Most Least Not chosen
Q: Which of the following attributes is the most and least important for... Q: Please choose up to three statements that you agree with the most. It is important that...

Page 28
WATER QUALITY AND CONCERNS

Page 29
WATER QUALITY | QUAL. FINDINGSThe qualitative research focused predominantly on uncovering values and beliefs surrounding the waterways, and how this affected our residents interactions. Further to this, a small portion of the research focused on the perceptions of water quality in the region, and any concerns that residents may have.
When looking at the perceptions of current water quality in the region, two key aspects came through. The first is that the waterways were okay currently, but there were concerns for the future. These concerns appeared to be largely regarding the continued use and accessibility of the water. Concerns were also raised regarding farming run off in the waterways and managing this in the future. There were also specific mentions regarding weeds and pest species which are perceived to be getting worse in the region.
Further to this it is evident that water quality perceptions were mixed and varied throughout the region, and as such there were some areas and waterways that were considered to be poorer or better quality than others.
To put this into context, the qualitative research looked at uncovering the cues that were used to judge water quality. Three key ‘buckets’ emerged with regards to judging water quality. The first was very visually based, and indicators such as clear water and no weeds were key cues to water quality. The second was experience based, whereby respondents asked “Could I swim in it? Could I drink it?”. Lastly, information in the media and from others was also used to form judgements on water quality.
The quantitative research used this context to look specifically into water quality ratings, which waterways were associated with poor and good water quality, indicators for poor and good water quality, and any concerns regarding water quality.
“I think the indication if water is good or bad has to do with what we can do with it. Can we drink it,
swim in it, use it for stock water etc.”
“Visual indicators e.g. clarity of water, ecosystems, plant life, species variety, and odour than more
technical testing.”

Page 30
VERY POOR
5%
WATER QUALITY
POOR
15%
NEUTRAL
30%
GOOD
40%
VERY GOOD
11%
Just over half (51%) rated the water quality in the region as good (40%) or very good (11%), with 30% rating the water quality as neutral. Twenty per cent rated the water quality as poor (15%) or very poor (5%) overall. Residents were also asked if there were any waterways that they specifically considered to be of poor or good water quality. The top 10 for each category are shown below. Taieri River was the key mention in terms of poor water quality with 52% of residents mentioning this river as poor quality, however 19% associated this waterway with good quality. Clutha River received 49% of mentions pertaining to good water quality; however 27% of mentions for poor quality were also attributed to this waterway.
WATERWAYS WITH POOR QUALITY
WATERWAYS WITH GOOD QUALITY
14%
15%
17%
17%
18%
21%
23%
24%
27%
52%
Silver Stream
Shag River
Lake Waihola
Lake Dunstan
Kaikorai
Kakanui
Leith
Lake Wanaka
Clutha River
Taieri River
11%
11%
13%
14%
15%
16%
17%
19%
26%
49%
Waitaki
Shotover
Dart River
Matukiki River
Manuherikia
Lake Wanaka
Hawea River
Taieri River
Lake Wakatipu
Clutha River
1-2
3-4
5-6
7-8
9-10Q: ...Using a scale of 1 - 10 please indicate what you think the water quality is like for the Otago region overall. Q: Are there any particular waterways in the Otago region that you associate with poor/ good water quality?

Page 31
REASONS| POOR QUALITY Respondents were asked to provide a reason behind mentioning a specific waterway as having poor quality. These reasons appear to be largely focused on aspects found within the water such as algae/ rock snot (35%), run off (25%), and rubbish and pollution (25%). As mentioned in the qualitative findings, visual cues such as poor clarity/ cloudy water (22%) were also used to ascertain water quality, as well as aspects such as high nutrient or bacteria levels (19%).
“When I notice pollution or invasive pest weeds or algaes it really upsets me. I want to do something to help fix it but the problem already seems too large.”
1%
1%
2%
3%
7%
8%
8% ↓
9%
9%
11%
12%
14%
15%
19%
22%
25%
25%
35%
Other
Don't know
Water quality tests
Sedimentation
Signs from local governments
Animals in or near water
Lack of wildlife
Decreased flow/ stagnant
Contaminants in the water e.g.1080
Poor smell
Low water volume
Not swimmable/drinkable/poortaste
Faeces in the water
High nutrient/bacteria levels
Poor clarity/ cloudy water
Rubbish/ pollution
Run-off/excessive dairying
Algae/ rock snot
Q: ...for each waterway please explain why you associate this waterway with poor water quality?

Page 32
INDICATORS | POOR QUALITY
5%
5%
7%
8%
8%
9%
16%
22%
26%
31%
31%
42%
Animals in or near water
Run-off
Decreased flow/ stagnant
Contaminants in the water e.g.1080
High nutrient/bacteria levels
Faeces in the water
Lack of wildlife
Rubbish/ pollution
Not swimmable/drinkable/poortaste
Poor smell
Algae/ rock snot
Poor clarity/ cloudy water
When asked what indicates poor water quality, these cues centred largely on aspects such as poor clarity/ cloudy water (42%) and the presence of algae/ rock snot (31%) as indicators of poor water quality. Further to this, the smell of the water (31%) was also mentioned as an indicator, followed by indications pertaining largely to whether the water is suitable for use i.e. swimming/ drinking (26%) suggesting residents based water quality largely on what it looks like and how they can use it.
“Over the last twenty years I have seen a decline in the water quality and quantity and it is time we started to put more plans in place not just to prevent more
damage but to improve our waterways.”
Q: Now thinking again about water quality, what indicates poor water quality?

Page 33
There were very few differences between the districts in terms of the indicators of poor water quality with low clarity and poor appearance, poor taste, and an inability to swim in the waterway considered to be the primary indicators of poor quality across all districts. Central Otago residents rated the water quality in their district the lowest with 32% rating this as 1 - 4 out of 10.
DISTRICT PERCEPTIONS | POOR
CanterburyWest Coast
Southland
Queenstown LakesWaitaki
Central Otago
Dunedin
Clutha
Central Otago Poor - 32%35% Poor clarity/ cloudy water34% Poor smell34% Algae/ rock snot25% Not swimmable/drinkable/poor taste19% Rubbish/ pollution
Clutha Poor - 23%40% Poor clarity/ cloudy water38% Poor smell35% Algae/ rock snot26% Lack of wildlife19% Not swimmable/drinkable/poor taste
Dunedin Poor - 18%43% Poor clarity/ cloudy water31% Poor smell29% Algae/ rock snot26% Not swimmable/drinkable/poor taste25% Rubbish/ pollution
Queenstown Lakes Poor - 16%40% Poor clarity/ cloudy water32% Algae/ rock snot29% Not swimmable/drinkable/poor taste29% Poor smell22% Rubbish/ pollution
Waitaki Poor - 28%46% Poor clarity/ cloudy water34% Poor smell31% Algae/ rock snot28% Not swimmable/drinkable/poor taste14% Lack of wildlife
NOTE: An arrow pointing up indicates that residents of that district were more likely to give that response. An arrow pointing down indicates that residents of that district were less likely to give that response.

Page 34
REASONS | GOOD QUALITY
Respondents were asked to provide a reason behind why a specific waterway was considered to be good quality. These reasons closely align with qualitative findings which suggest visual cues are important, such as looks clear (37%), clean and fresh (28%), and flowing water (20%). Further to this, experience based criteria such as drinkable (4%) and swimmable (4%) also featured as reasons behind providing a good quality rating for a waterway although to a lesser degree.
“The most important thing to me is the quality of the water. I believe water quality directly correlates to the health of the
environment in general so of course I want to live in the healthiest environment possible!”
7%
15%
1%
1%
1%
2%
2%
2%
2%
3%
4%
4%
4%
4%
18%
20%
28%
37%
Don't know
Other
No stock in and around land
Fishable
No contamination/bacteria
Water depth/volume
No rubbish
No smell
Little or no human impact
No pollution
Natural
Swimmable
Drinkable/No bad taste
Little or no farming impact
Healthy fish/plant life
Flowing water
Clean/fresh/pure water
Looks clear
Q: ...for each waterway please explain why you associate this waterway with good water quality?

Page 35
INDICATORS | GOOD QUALITY
7%
8%
8%
11%
12%
15%
19%
20%
28%
32%
62%
No contamination/bacteria
No rubbish
Low presence of chemicals,pollutants
Flowing water
Swimmable
No algae
No smell
Clean/pure water
Drinkable/No bad taste
Healthy fish/plant life
Looks clear
When asked to define what indicates good water quality, visual cues such as looks clear (62%) were primarily used. This aligns with the qualitative findings which indicated residents relied heavily on visual cues. Further to this, healthy plants/ fish life (32%), clean/ pure (20%) and no smell (19%) or algae (15%) were also mentioned as indicators, followed by a waterway’s suitability for use i.e., drinking (28%).
“Clean and pure water is healthy. The less impurities it has, the better it looks, smells and tastes. This makes
it better for recreational use, swimming, tourism and the ecosystem in general.”
Q: Now thinking again about water quality, what indicates good water quality?

Page 36
Across the districts the indicators of good water quality were fairly similar with clarity, being drinkable, healthy fish or plant life, and smell all key factors. Queenstown Lakes residents appeared to have the highest water quality rating with 62% of residents rating the water quality as good (7 - 10 out of 10).
DISTRICT PERCEPTIONS| GOOD
CanterburyWest Coast
Southland
Queenstown LakesWaitaki
Central Otago
Dunedin
Clutha
Central Otago Good - 48%60% Looks clear30% Drinkable/No bad taste27% Healthy fish/plant life19% Clean/pure water17% No smell
Clutha Good - 46%69% Looks clear35% Healthy fish/plant life25% Drinkable/No bad taste20% Clean/pure water18% No smell
Dunedin Good - 49%61% Looks clear34% Healthy fish/plant life25% Drinkable/No bad taste20% No smell20% Clean/pure water
Queenstown Lakes Good - 62%63% Looks clear37% Drinkable/No bad taste26% Healthy fish/plant life18% Clean/pure water16% Swimmable
Waitaki Good - 44%63% Looks clear30% Drinkable/No bad taste29% Healthy fish/plant life28% Clean/pure water22% Flowing water
NOTE: An arrow pointing up indicates that residents of that district were more likely to give that response. An arrow pointing down indicates that residents of that district were less likely to give that response.

Page 37
CONTRIBUTORS|REGIONResidents were asked to indicate what they consider the 3 biggest contributors to water pollution in the Otago region. Half of residents mentioned stock having access to waterways (53%) and intensive farming as key contributors to pollution in the region. Industry contributors such as over-application of fertiliser (49%) and discharges from industries (32%) were also considered key contributors.
“In my area there are a lot of new dairy farms and grazing happening. So this is having a big impact on
our waterways in terms of pollution and the usage of water. I think one of the best things we can do in order to keep our water quality ideal so everyone can use it is a lot more education and action. We need to educate farmers about what they can be doing to protect the water that runs through their
properties from effluent runoff etc. and take action in areas which are considered public.”
Q: From the list below, please indicate what you think are the 3 biggest contributors to water pollution in Otago as a region?
6%
2%
3%
3%
7%
10%
13%
16%
19%
22%
32%
49%
50%
53%
Don't know
Something not listed above, pleasespecify
Works in the bed of waterways
Mining, gold mining
Septic tanks on private properties
Landfills
Wastewater treatment plants
Stormwater from urban areas
Disturbing the margins of waterways(construction of buildings, ploughing,…
Run off from irrigation
Discharges from industries
Over-application of fertiliser (includingfarm effluent)
Intensive farming
Stock having access to rivers, lakes, orwetlands

Page 38
CONTRIBUTORS|LOCALResults for contributors to local pollution show a more mixed perception with six contributing factors receiving more than 25% of the total mentions. Of note, was the relatively higher mention for stormwater in urban areas featuring in the local contributors, with 34% of residents stating this as a key contributor for local pollution compared to only 16% who mentioned this for regional water pollution.
“I think protecting and maintaining the waterways and New Zealand’s environment is
each person’s individualresponsibility. If we see
rubbish, pick it up, if we are farming choose smarter ways of farming that won’t damage
the waterways.”
Q: From the list below, please indicate what you think are the 3 biggest contributors to water pollution in Otago in your local area?
12%
2%
5%
6%
8%
14%
16%
17%
24%
29%
31%
33%
34%
36%
Don't know
Other
Mining, gold mining
Works in the bed of waterways
Septic tanks on private properties
Landfills
Run off from irrigation
Wastewater treatment plants
Disturbing the margins of waterways(construction of buildings, ploughing,…
Discharges from industries
Intensive farming
Over-application of fertiliser (includingfarm effluent)
Stormwater from urban areas
Stock having access to rivers, lakes, orwetlands

Page 39
DISTRICT | REGIONThere were limited differences across the districts with regards to the contributors to regional water pollution with key factors for residents in each district relating to farming practices, particularly intensification, stock access, irrigation, and fertiliser application.
CanterburyWest Coast
Southland
Queenstown LakesWaitaki
Central Otago
Dunedin
Clutha
Central Otago Regional54% Stock having access to rivers, lakes, or wetlands46% Intensive farming44% Over-application of fertiliser (including farm effluent)28% Discharges from industries25% Run off from irrigation
Clutha Regional54% Stock having access to rivers, lakes, or wetlands45% Over-application of fertiliser (including farm effluent)41% Intensive farming35% Discharges from industries26% Run off from irrigation
Dunedin Regional52% Stock having access to rivers, lakes, or wetlands50% Intensive farming48% Over-application of fertiliser (including farm effluent)35% Discharges from industries21% Run off from irrigation
Queenstown Lakes Regional54% Stock having access to rivers, lakes, or wetlands53% Intensive farming52% Over-application of fertiliser (including farm effluent)22% Run off from irrigation21% Stormwater from urban areas
Waitaki Regional60% Intensive farming57% Stock having access to rivers, lakes, or wetlands51% Over-application of fertiliser (including farm effluent)24% Run off from irrigation23% Discharges from industries

Page 40
DISTRICTS | LOCALThere were a few clear differences regarding residents’ perceptions of what contributes most to water pollution in their local area. For residents in Central Otago, Clutha, and Waitaki, local water quality was more affected by stock having access to waterways. Waitaki residents were also more likely to mention intensive farming and irrigation run off while Clutha residents were more likely to mention over-application of fertiliser. Although still mentioned, farming related contributors appeared to be less relevant to Dunedin residents, who were more likely to mention urban stormwater, wastewater treatment plants and landfills (18% each, not shown below), discharges from industry, and disturbing the margins of the waterways. Queenstown Lakes residents appeared to have more moderate mentions of farming related contributors.
CanterburyWest Coast
Southland
Queenstown LakesWaitaki
Central Otago
Dunedin
Clutha
Central Otago Local48% Stock having access to rivers, lakes, or wetlands41% Intensive farming36% Over-application of fertiliser (including farm effluent)23% Run off from irrigation16% Wastewater treatment plants
Clutha Local57% Stock having access to rivers, lakes, or wetlands51% Over-application of fertiliser (including farm effluent)36% Intensive farming27% Discharges from industries21% Run off from irrigation
Dunedin Local41% Stormwater from urban areas36% Discharges from industries30% Stock having access to rivers, lakes, or wetlands29% Over-application of fertiliser (including farm effluent)26% Disturbing the margins of waterways (construction of buildings, ploughing, vegetation removal)
Queenstown Lakes Local39% Over-application of fertiliser (including farm effluent)39% Stock having access to rivers, lakes, or wetlands36% Stormwater from urban areas33% Intensive farming25% Disturbing the margins of waterways (construction of buildings, ploughing, vegetation removal)
Waitaki Local62% Intensive farming51% Stock having access to rivers, lakes, or wetlands42% Over-application of fertiliser (including farm effluent)28% Run off from irrigation20% Disturbing the margins of waterways (construction of buildings, ploughing, vegetation removal)
NOTE: An arrow pointing up indicates that residents of that district were more likely to give that response. An arrow pointing down indicates that residents of that district were less likely to give that response.

Page 41
CONCERNSResidents were asked if they had any specific concerns regarding water quality in the Otago region, these were recorded verbatim and post-coded. Results showed a mixed view on concerns regarding water quality and ranged from farming-effects, to contaminants in the water, to the effects of use, and recreation. While dairy farmers were mentioned by 19% of residents with concerns, this was followed closely by general water quality concerns (15%) and concerns regarding rock snot/ algae (13%) and contaminants in the water (12%).
“I am really concerned about the future and what it holds. Over the last twenty
years I have seen a decline in the water quality and quantity and it is time we started to put more plans in place not
just to prevent more damage but to improve our waterways.”
5%
2%
2%
2%
4%
4%
5%
6%
9%
10%
10%
12%
12%
13%
15%
19%
Other
Loss of aquatic life
Concern for future
Specific river mentioned
Too many visitors/over-use
Recreation/leisure use
Poor management
Didymo
Pollution
Reduced flow/low watervolume
Animals in or near water
Effluent
Contaminants e.g. 1080
Rock snot/algae
Water quality (general)
Dairy farmers
Q: Do you have any specific concerns on water quality in the Otago region? What are these?

Page 42
CanterburyWest Coast
Southland
Queenstown LakesWaitaki
Central Otago
Dunedin
Clutha
Central OtagoHave a specific concern- 48%24% Dairy farmers23% Rock snot/algae 22% Water quality (general)14% Reduced flow/low water volume8% Contaminants e.g. 1080
CluthaHave a specific concern- 41%33% Dairy farmers30% Water quality (general)18% Animals in or near water13% Contaminants e.g. 10808% Effluent or poor management (each)
DunedinHave a specific concern- 40%31% Dairy farmers 20% Water quality (general) 14% Rock snot/algae 14% Effluent 12% Contaminants, animals in or near water and/or pollution (each)
Queenstown LakesHave a specific concern-61% 26% Dairy farmers20% Rock snot/algae20% Didymo16% Effluent16% Water quality (general)
WaitakiHave a specific concern- 48%49% Dairy farmers20% Reduced flow/low water volume16% Contaminants e.g. 108014% Recreation/leisure use 11% Water quality (general)
The image below shows the top five specific concerns that residents in each district have about the water quality in the region. Concerns in Central Otago were spread fairly evenly across the top three issues while Clutha and Dunedin residents talked mostly of dairy farmers and water quality in general. Queenstown Lakes residents appeared more focussed on the appearance of the water with higher mentions of didymo and rock snot. Waitaki residents seemed to have a greater concern with dairy farmers than residents in other areas.
DISTRICT PERCEPTIONS
NOTE: An arrow pointing up indicates that residents of that district were more likely to give that response. An arrow pointing down indicates that residents of that district were less likely to give that response.

Page 43
DEMOGRAPHIC PROFILES

Page 44
GENDER DIFFERENCESACTIVITY AND USEThe primary gender differences across the quantitative results related largely to the use of the waterways. Male residents were far more likely to undertake activities in the water including boating, fishing, and hunting and this was particularly true of males aged 45 - 59 years. In comparison, female residents were more likely to undertake activities near the water with relaxing/sitting/watching water, swimming/paddling, walking the dog, feeding ducks, photography or collecting shells more commonly mentioned by female residents, particularly those aged 25 - 44 years.
Furthermore, female residents accessed rivers/streams and lakes less frequently than male residents, however male and female residents accessed wetlands, estuaries, coastal beaches and urban waterways with similar frequency.
STATED IMPORTANCEInterestingly male and female residents showed similar levels of stated importance for waterway attributes with no notable differences observed in the responses between the genders. In particular both male and female residents prioritised waterways supporting healthy and diverse ecosystems and availability for future generations.
REGIONAL WATER QUALITY, INDICATORS AND CONCERNSMale and female residents rated the region’s water quality in a similar manner with most rating the water quality in the region as good (7 or higher out of 10, 52% males and 49% for females). Male and female residents also held similar perceptions around what indicates good (clear, healthy fish/
plant life, or drinkable) or poor (poor clarity, algae, poor smell and unable to swim or drink the water) water quality generally.
There were limited differences in the specific concerns about water quality in the Otago region; both males and females’ concerns primarily related to dairy farmers, algae, contaminants and reduced water flow.
At a regional level, male residents felt the primary contributors to water pollution in the region were stock access (52%), intensive farming (55%), and over application of fertilise (52%), while female residents related this to similar areas but at a lower level (stock 53%, intensive farming 46%, over application of fertiliser 45%). Female residents also appeared to see disturbing the margins of waterways as a more critical contributor (22% for females but only 16% for males).
Male and female residents perceived similar contributors to water pollution in local areas, key to which were stock access, over-application of fertiliser and stormwater in urban areas, and intensive farming.
COMMENTS ON SPECIFIC WATERWAYSMale residents were more likely than female residents to mention specific waterways where they felt the quality of the water was particularly poor with key mentions for male residents being Taieri River 21%, Clutha River 6%, Leith 6%, Kakanui 5%, and Kaikorai 5%. Similarly male residents were also more likely to mention specific waterways where the water quality was good (key mentions being Clutha River, Waitaki, and Taieri River) and largely attributed this to clarity, clean water, and healthy fish life.

Page 45
ETHNIC DIFFERENCESACTIVITY AND USEThe ethnicity of the resident did not appear to be related to the main activities that residents used waterways for with the primary activities similar for both Maori and non-Maori residents (relaxing, walking, sightseeing, swimming, and drinking). However some differences in use were evident at a lower level; Maori had a higher propensity to camp (41% compared to 27% for non-Maori) or collect freshwater kai (25% compared to 13% for non-Maori) while non-Maori had a higher propensity to picnic (44% compared to 29% for Maori), undertake photography (31% compared to 21% for Maori), and cycle (28% compared to 11% for Maori).
Maori residents also appeared to use the waterways more frequently, particularly rivers and streams and coastal beaches with fewer Maori residents saying they had not used these at all in the last 12 months (rivers and streams 2% for Maori and 12% for non-Maori, coastal beaches 2% for Maori and 14% for non-Maori).
STATED IMPORTANCEMaori and non-Maori residents both stated that supporting ecosystems, availability, remaining in their natural form and access were important, however Maori appeared to place less importance on the suitability of waterways for recreational use (33% for Maori and 48% for non-Maori). Maori residents were also much more likely to state that it is important for waterways to be protected as a reliable food source (37% for Maori and 17% for non-Maori) particularly estuaries.
Maori residents were also more likely to state that it is important for waterways to be protected for spiritual values and use (21% for Maori and 6% for non-Maori) and this is particularly relevant for lakes and rivers and streams. The idea of protection for spiritual reasons was also evident in the qualitative work; Maori’s relationship with the water encompassed the past as part of their value set, while non-Maori residents were far more focussed on the present and future of the waterways.
REGIONAL WATER QUALITY, INDICATORS AND CONCERNSMaori and non-Maori rated water quality across the region similarly (good ratings for Maori were 53% and 50% for non-Maori), although Maori were more likely to state that low water volume (15% for Maori and 3% for non-Maori) or stagnation (16% for Maori and 6% for non-Maori) were key features which indicated poor water quality; similarly Maori were more likely to indicate that water depth/volume (11% for Maori and 1% for non-Maori) was a key indicator of good quality.
Maori and non-Maori were no more or less likely to have specific concerns about water quality in the region with both Maori and non-Maori residents’ concerns relating to dairy farmers, algae, stock in or near the water, effluent and contaminants. Both Maori and non-Maori residents named similar contributors for local and regional water pollution. However, at a regional level Maori were more inclined to say disturbing the margins of waterways (29% for Maori and 19% for non-Maori) and wastewater treatment plants (21% for Maori and 12% for non-Maori) were pollution contributors. At a local level, Maori also appeared more likely to state that disturbing the margins was a pollution contributor (38% for Maori and 23% for non-Maori).
COMMENTS ON SPECIFIC WATERWAYSThere were no differences between Maori and non-Maori residents regarding the waterways that related to good or poor quality; key mentions for good quality waterways related to Clutha River, Lake Wakatipu and Waitaki while poor quality was mentioned for the Taieri River and the Kakanui River.

Page 46
RURAL VS URBAN DIFFERENCES
ACTIVITY AND USEThe main activities that rural and urban residents used waterways for were very similar with key mentions relating to relaxing/sitting, walking/walking the dog, swimming, sightseeing and picnicking. Rural residents were more likely to use waterways for fishing (43% compared to 26% for urban residents), boating (34% compared to 20% for urban residents), collecting freshwater shellfish (19% compared to 10% for urban residents), hunting/shooting (19% compared to 6% for urban residents), and drinking water for stock (11% compared to 2% for urban residents). Rural residents were also more likely to be involved in environmental enhancement programs than urban residents (20% for rural, 12% for urban residents).
Rural residents were also more likely to use rivers and streams, lakes and wetlands more frequently than urban residents who were more frequent users of beaches than rural residents. Rural residents also had a much higher use of groundwater than urban residents (57% of urban residents did not use groundwater, compared to 49% of rural residents).
STATED IMPORTANCEInterestingly rural and urban residents mentioned similar aspects that they felt were important for a waterway with key mentions relating to supporting healthy ecosystems and availability for future generations. Although not significant, urban residents were slightly more likely to state that they felt waterways should be left in their natural form (49%) while rural residents were less slightly concerned with this (38%).
REGIONAL WATER QUALITY, INDICATORS AND CONCERNS.Rural and urban residents rated the water quality across the region in similar way (51% of urban residents rated the quality as good and 46% of rural residents rated the quality as good) although urban residents were far more likely to state that poor clarity or cloudy water indicated poor water quality (46% for urban residents and 33% for rural residents). Rural residents were more likely to mention specific waterways that were of poor quality with key waterways mentioned by rural residents being Taieri River (20%), Kakanui (7%), Clutha River (5%), Lake Hayes (5%), and Lake Waihola (5%). Both urban and rural residents judged good water quality in a similar way with clarity, healthy ecosystems, taste, and smell the primary indicators.
COMMENTS ON SPECIFIC WATERWAYSRural residents were more likely to have specific concerns about Otago waterways (62% of rural residents had a specific concern while only 44% of urban residents mentioned a specific concern) with key concerns for both groups being dairy farmers, general water quality, contaminants and rock snot/algae. At a regional level, both urban and rural residents felt that water pollution was driven by stock having access to water, intensive farming, over-application of fertiliser, and run off from irrigation.
However, there were clear differences in contributors when looking at water pollution at a local level. For rural residents the primary local contributors to water pollution related to stock access (45% for rural residents and 33% for urban residents), intensive farming (44% for rural residents and 27% for urban residents), and over-application of fertiliser (44% for rural residents and 29% for urban residents); for urban residents the primary contributors related to stormwater (39% for urban residents and 21% for rural residents), stock access, and discharges from industry (31% for urban residents and 20% for rural residents).

Page 47
DISCUSSION

Page 48
MANAGING THE WATERWAYSWHAT ARE WE DOING WITH WATER AND WHAT DO WE VALUE?Residents use the waterways in a variety of ways and for a variety of purposes. Recreational activities in and around the water appear to be largely group based, whereby the focus is largely on creating memories and enjoying the moment and the waterway becomes a facilitator in making this happen. Conversely, individual activities appear to be largely focused on connecting with one’s self in the presence of nature such as relaxing, walking, sightseeing etc. these activities are largely performed out of the water.
Due to the varying nature of the interactions with waterways, residents have differing expectations of what the water should look like, and how it should be. Qualitative findings suggested that for activities performed in the water, there is the inherent expectation that the waterways are clear and swimmable, with the presence of wildlife and fish indicating water health. With activities performed out of the water, there is a greater focus on the aesthetic appeal of the waterways, because this forms a large part of the connection with nature and helps to facilitate relaxation and inward reflection. In terms of aesthetic appeal, a lack of litter, clean and clear water, and natural surroundings contribute to an overall experience.
The way in which residents interact with the water, and the associated expectations that this brings contribute to surface values. These values are ones which largely speak to residents on a personal level, and connect with how they use the waterways. With this, surface values are largely focused in the present, and appear to be hedonistic in nature i.e. what can water do for me. Water is essentially valued as a constant component in our lives, and will always be there as “a back drop to our lives”.
Embedded values look deeper to how water is valued both in the past and future, and essentially determine the relationship with water and recognise that water may not always be a constant. With the embedded values there is a respect for how water has featured in the past and a willingness to protect this for future generations to enjoy. The embedded values recognise the relationship as being two-fold, in that it is not only what water can do for me, but how I can affect the water. When looking to the future there is an
awareness that waterways in the region need to be protected and treated as the precious treasure/ taonga that they are so that future generations can continue to use them.
This is further iterated in the quantitative research, with availability for future generations to use and the ability for everyone to use and access the waterways key attributes across all types of waterways.
WHAT DO WE WANT FOR THE FUTURE?Key attributes for future management of waterways were measured using both stated importance and derived importance. Stated importance looks at aspects that will affect perceptions while derived importance looks at attributes which affect behaviour, or use of the waterways.
Looking across both stated and derived importance measures it is evident that there are clear measures which the waterways need to be managed for. In particular, we see a consistent mention regarding ecosystems and wildlife, as well as preservation for natural state. Throughout the research findings, ecosystems and wildlife comes up consistently as a critical attribute; this is noted as particularly relevant as residents use this as a sign of good water quality with aspects such as flowing water, healthy plant and fish life mentioned as indicators of water quality i.e., if the fish and wildlife can live in and around it then it must be okay for humans to use.
Further to this, preservation of the natural state is also an attribute which featured strongly, this links closely with the qualitative findings whereby residents respect the waterways as a part of their lives and acknowledge the place waterways have in nature; the closer this can remain to its natural state, the more this assists in residents continuing to connect with the waterways in the region.
While there are key attributes across all waterways that need to be managed as a whole, as the qualitative findings indicated residents have different expectations for different waterways, and this is further highlighted when looking at differences across waterway types. The table (overleaf) shows the results for important stated attributes across all waterway types.

Page 49
COASTAL BEACHES
ESTUARIES RIVERS/STREAMS
LAKES WETLANDS URBAN NET
Are available for future generations to use
60% 55% 63% 61% 69% 64% 75%
Support healthy and diverse ecosystems
51% 64% 63% 60% 79% 67% 75%
Can be used by and accessed by everyone
53% 42% 30% 29% 26% 32% 48%
Are suitable for recreational uses...
42% 23% 38% 44% 22% 38% 48%
Remain in natural form and aesthetic
33% 41% 28% 27% 40% 30% 46%
Meets peoples and animals needs for drinking water
6% 11% 22% 22% 11% 19% 22%
Are recognised as significant parts of our history
11% 13% 12% 15% 16% 14% 21%
Are protected to provide a reliable food source
13% 14% 10% 6% 12% 13% 18%
Support irrigation and food production
6% 6% 10% 8% 5% 3% 10%
Protected for spiritual values and uses
3% 5% 5% 7% 5% 4% 7%
Function as a key tourism point
6% 5% 4% 5% 3% 3% 6%
Can be used for transport and navigation
3% 2% 0% 1% 0% 2% 2%
Supports commercial and industrial uses
3% 3% 1% 3% 1% 2%
I do not agree with any of the above statements
1% 1% 1% 1%
STATED IMPORTANCE COMPARISONS
MANAGING THE WATERWAYSThere are a number of differences observed, usage and access are relatively more important for both coastal beaches and estuaries, however while this corresponds with a higher importance on recreational uses for coastal beaches this is not the case for estuaries, where there is a lower importance placed on suitability for recreational purposes. Remaining in natural form and aesthetic appears to have a stronger association with estuaries and wetlands, with a weaker association for rivers/ streams. With this, it is seemingly more important for rivers and streams and lakes to meet people and animals need for drinking water, this was a less relevant for coastal beaches. Additionally, the importance for rivers and streams to support irrigation and food production was also comparably higher.Overall, it appears that residents place less importance on the economic/ commercial uses of water and more importance on the more personal uses of water, corresponding with the surface values noted in the qualitative research.
“I only hope that we as a collective see our country in light of its best, purest, forms, and of the dangers and damages made, in hopes to purify and maintain the place we live.”

Page 50
WATER QUALITY UNDERSTANDINGGenerally Otago residents perceive water quality as pretty good, which was indicated in both the qualitative and quantitative stages. However, early qualitative findings indicated that residents’ understanding regarding water quality was largely misguided or misattributed. Residents gained their understanding of water quality predominantly through visual cues (does it look okay), experienced based cues (can I swim in it/ drink from it?), or through media/ hearsay (what I have heard). This appears to contribute to a relatively shallow understanding of water quality in the region. This was largely confirmed in the quantitative stage whereby the indicators of water quality featured strongly and a sense of confusion and ambiguity surrounding cause and effect was observed across responses.
With this, there is an overwhelming focus on the effects of farming on the waterway, but an apparent lack of understanding regarding how this actually affects the waterways in the region. Farming effects (including run off, stock access, fertiliser application, excessive dairying) feature as a key mentions across specific concerns, region wide concerns, and also is mentioned as a contributor for both local and region waterways. Further to this, there is also a concern regarding pest species on the waterways, therefore affecting perceptions of water quality.
There also appears to be a narrow understanding of the physical location of poor waterways with rivers and streams being the main waterways associated with poor water quality, rather than coastal areas, suggesting there is a relatively limited understanding of how waterways are connected in the region i.e., if rivers and streams are affected this will also affect coastal areas such as estuaries and beaches too.
Addressing this mis-information and seemingly narrow understanding through targeted communications regarding water quality and accepted water quality criteria levels, may contribute to a greater understanding amongst residents, and an appreciation that they can continue to use the waterways as they have in the past.
“In my area there are a lot of new dairy farms and grazing happening. So this is having a big impact on our waterways in terms of pollution and the usage of water. I think one of the best things we
can do in order to keep our water quality ideal so everyone can use it is a lot more
education and action.”
“It’s a bit of a scary thought with increasing amounts of dairy farms
around. They use a lot ofwater and have a huge negative impact
on the local waterways. A lot can be done to help this area to protect our water
ways.”
MANAGING THE WATERWAYS

Page 51
APPENDICES
Page 52
Otago Region Waterways Survey 2016
Page 1 of 11
Otago Region Waterways Survey 2016
Before you start please write your login code here: About this survey
The Otago Regional Council would like to know what you think of waterways in the region, what attributes are important to you, and how you perceive current water quality. Your name has been randomly selected from the electoral roll to participate in this survey. It should take approximately 10 minutes to complete; all the answers you provide are held in complete confidence. Please ensure this is posted by 20th of November. To thank you for your time and effort, everyone who completes the survey can go in to the draw to win one of five $200 supermarket vouchers.
How to complete the survey
All you need to do is tick the corresponding answer under the question. In some instances we ask you to write your answer in the space provided.
Your individual answers are completely confidential. We report summary results about groups (e.g. 50% of people said…) and we do not identify which individuals have said what.
If you would prefer to complete the survey online please go to the link below and enter your login code.
Survey website: http://sgiz.mobi/s3/Otago-Region-Waterways-POSTAL
If you have any questions regarding how to complete this survey, please contact Sam Thorburn at Versus Research on 0800 837 787 or email [email protected]
Please return the completed survey to:
Versus Research Ltd Freepost 172567
PO Box 5516 Frankton
Hamilton 3242
APPENDIX 1 | QUESTIONNAIRE

Page 53
Otago Region Waterways Survey 2016
Page 2 of 11
Section 1: Use of Waterways in Otago Region The first few questions are about how you use the waterways in the Otago Region.
1) In the last 12 months, which of the following activities have you USED THE WATERWAYS including coastal beaches, estuaries, rivers/ streams, lakes, wetlands in the Otago region for?
IF YOU HAVE NOT USED THE WATERWAYS IN THE LAST 12 MONTHS PLEASE JUST LEAVE THIS QUESTION BLANK AND GO TO QUESTION 2 ON PAGE 3
Please tick all that apply
[ ] Bird watching / wildlife spotting [ ] Kayaking [ ] Boating – motorized [ ] Operating a business [ ] Boating- other [ ] Photography / painting [ ] Camping [ ] Picnicking
[ ] Ceremonial use, such as baptism [ ] Planting/ collecting litter/participating to an environmental enhancement program
[ ] Collecting fresh water shellfish, watercress, whitebaiting
[ ] Relaxing / sitting / watching and listening to water
[ ] Collecting shells/stones/driftwood [ ] Sight seeing [ ] Cycling [ ] Surfing [ ] Drinking water (human use) [ ] Swimming / paddling / jumping in water [ ] Drinking water (stock use) [ ] Tramping / hiking [ ] Feeding the ducks [ ] Walking, walking the dog [ ] Fishing [ ] Water skiing [ ] Hunting / duck shooting
If you have used the waterways for any other activities that are not listed above please include these in the space below. Please write your answer in the space below

Page 54
Otago Region Waterways Survey 2016
Page 3 of 11
2) In the past year, how often have you UNDERTAKEN ACTIVITIES IN AND AROUND the following types of waterways? Please only tick one response for each waterway
Coastal beaches Estuaries
Rivers and streams Lakes Wetlands
River, pond, or beach in an
urban setting
Every day [ ] [ ] [ ] [ ] [ ] [ ]
Once or twice a week
[ ] [ ] [ ] [ ] [ ] [ ]
Once or twice a month
[ ] [ ] [ ] [ ] [ ] [ ]
Less than monthly
[ ] [ ] [ ] [ ] [ ] [ ]
Not at all [ ] [ ] [ ] [ ] [ ] [ ]
Don't know [ ] [ ] [ ] [ ] [ ] [ ]
3) GROUNDWATER is the water beneath the surface of the ground, DO YOU USE this for... Please tick all that apply [ ] Human drinking water
[ ] Animal drinking water
[ ] Watering the garden
[ ] Larger scale irrigation
[ ] Other (please write your answer in here):________________________________________
[ ] I do not use groundwater
[ ] I am not sure

Page 55
Otago Region Waterways Survey 2016
Page 4 of 11
Section 2: Important Features for Waterways in Otago Region
4) This next question asks about what is important for the region’s waterways. From the list below, please SELECT THE THREE FEATURES that you think are MOST IMPORTANT FOR EACH TYPE OF WATERWAY listed below. The same features can be selected for more than one waterway.
Please select up to three features for each type of waterway
It is important that this waterway… Coastal beaches Estuaries
Rivers and
streams Lakes Wetlands Urban
Waterways Supports healthy and diverse ecosystems
[ ] [ ] [ ] [ ] [ ] [ ]
Is suitable for recreational uses (including swimming)
[ ] [ ] [ ] [ ] [ ] [ ]
Is protected to provide a reliable food source
[ ] [ ] [ ] [ ] [ ] [ ]
Remains in their natural form and aesthetic
[ ] [ ] [ ] [ ] [ ] [ ]
Supports irrigation and food production
[ ] [ ] [ ] [ ] [ ] [ ]
Meets peoples and animals’ need for drinking water
[ ] [ ] [ ] [ ] [ ] [ ]
Is protected for their spiritual values and uses
[ ] [ ] [ ] [ ] [ ] [ ]
Supports commercial and industrial uses
[ ] [ ] [ ] [ ] [ ] [ ]
Is protected as a source of reliable electricity
[ ] [ ] [ ] [ ] [ ] [ ]
Can be used for transport and navigation
[ ] [ ] [ ] [ ] [ ] [ ]
Is available for future generations to use
[ ] [ ] [ ] [ ] [ ] [ ]
Functions as a key tourism point [ ] [ ] [ ] [ ] [ ] [ ]
Can be used by and accessed by everyone
[ ] [ ] [ ] [ ] [ ] [ ]
Is recognised as significant parts of our heritage and identity
[ ] [ ] [ ] [ ] [ ] [ ]
I do think any of these features are important for this waterway
[ ] [ ] [ ] [ ] [ ] [ ]

Page 56
Otago Region Waterways Survey 2016
Page 5 of 11
Section 3: Water Quality 5) Thinking about the water quality in the region, and using a scale of 1 to 10, where 1 IS VERY POOR WATER QUALITY, and 10 IS VERY GOOD WATER QUALITY, please indicate what you think the water quality is like for the OTAGO REGION OVERALL on the scale below? Please tick one response only
Very POOR water quality
1 2 3 4 5 6 7 8 9
Very GOOD water quality
10 [ ] [ ] [ ] [ ] [ ] [ ] [ ] [ ] [ ] [ ]
6) Thinking specifically about water quality, what indicates POOR water quality? Please write your answer in the space below; please continue on the back of this page if needed
7) Are there any particular waterways in the Otago region that you associate with POOR water quality? Please tick one response only [ ] Yes - PLEASE ANSWER QUESTION 8 ON PAGE 6 [ ] No - PLEASE SKIP TO QUESTION 9 ON PAGE 6

Page 57
Otago Region Waterways Survey 2016
Page 6 of 11
8) Please list the WATERWAYS that you associate with POOR water quality in the space below. For each waterway please explain why you associate this waterway with POOR water quality. Please write your answer in the spaces below. Please list up to 5 waterways.
Name of waterway Reason why you associate this waterway with POOR water quality
9) Now thinking again about water quality, what indicates GOOD water quality? Please write your answer in the space below; please continue on the back of this page if needed

Page 58
Otago Region Waterways Survey 2016
Page 7 of 11
10) Are there any particular waterways in the Otago region that you associate with GOOD water quality? Please tick one response only [ ] Yes - PLEASE ANSWER QUESTION 11 BELOW [ ] No - PLEASE SKIP TO QUESTION 12 ON PAGE 8
11) Please list the WATERWAYS that you associate with GOOD water quality in the space below. For each waterway please explain why you associate this waterway with GOOD water quality. Please write your answer in the spaces below. Please list up to 5 waterways.
Name of waterway Reason why you associate this waterway with GOOD water quality

Page 59
Otago Region Waterways Survey 2016
Page 8 of 11
Section 4: Factors that Affect Water Quality 12) Do you have any SPECIFIC CONCERNS on water quality in the Otago region? Please tick one response only [ ] Yes - PLEASE ANSWER QUESTION 13 BELOW [ ] No - PLEASE SKIP TO QUESTION 14 ON PAGE 9
13) Please write your CONCERNS about the water quality in the Otago region in the space below. Please write your answer in the space below; please continue on the back of this page if needed

Page 60
Otago Region Waterways Survey 2016
Page 9 of 11
14) From the list below, please indicate what you think are the 3 BIGGEST CONTRIBUTORS to WATER POLLUTION in Otago as a REGION? Please tick up to three items [ ] Intensive farming
[ ] Stock having access to rivers, lakes, or wetlands
[ ] Run off from irrigation
[ ] Disturbing the margins of waterways (construction of buildings, ploughing, vegetation removal)
[ ] Mining, gold mining
[ ] Works in the bed of waterways
[ ] Over-application of fertiliser (including farm effluent)
[ ] Discharges from industries
[ ] Stormwater from urban areas
[ ] Septic tanks on private properties
[ ] Wastewater treatment plants
[ ] Landfills
[ ] Something else (please write your answer here):_________________________________
[ ] I don't know
15) From the list below, please indicate what you think are the 3 BIGGEST CONTRIBUTORS to WATER POLLUTION in Otago in YOUR LOCAL AREA? Please tick up to three items [ ] Intensive farming
[ ] Stock having access to rivers, lakes, or wetlands
[ ] Run off from irrigation
[ ] Disturbing the margins of waterways (construction of buildings, ploughing, vegetation removal)
[ ] Mining, gold mining
[ ] Works in the bed of waterways
[ ] Over-application of fertiliser (including farm effluent)
[ ] Discharges from industries
[ ] Stormwater from urban areas
[ ] Septic tanks on private properties
[ ] Wastewater treatment plants
[ ] Landfills
[ ] Something else (please write your answer here):_________________________________
[ ] I don't know

Page 61
Otago Region Waterways Survey 2016
Page 10 of 11
Section 5: Demographic Questions We’re almost at the end now. The next few questions are about you, so we can be sure we’ve talked
to a cross-section of people. These responses are completely confidential.
16) Could you please tell me which of the following age groups you fit into? Please tick one response only [ ] 18-19 years [ ] 20-24 years [ ] 25-34 years [ ] 35-44 years [ ] 45-54 years [ ] 55-59 years [ ] 60 years or older [ ] Prefer not to answer 17) And are you? Please tick one response only [ ] Male [ ] Female [ ] Prefer not to answer 18) Which of the following best describes your household situation? Please tick one response only [ ] Young single, living alone [ ] Group flatting together [ ] Young couple, no children [ ] Family, mainly pre-school children [ ] Family, school children [ ] Family, adult children [ ] Older couple/single person [ ] Middle aged single/couple [ ] Boarding or similar [ ] Prefer not to answer 19) Do you live in an urban, rural, or semi-rural area? Please tick one response only [ ] Urban [ ] Rural [ ] Semi-rural [ ] Prefer not to answer
20) Which, if any, of the following industries do you work in? Please tick one response only [ ] Arts, design, entertainment, sports and media [ ] Business and financial [ ] Community and Social Service [ ] Computer and mathematical [ ] Construction and extraction [ ] Education and training [ ] Farming [ ] Fishing [ ] Food preparation and serving [ ] Forestry [ ] Healthcare [ ] Installation, maintenance and repair [ ] Legal [ ] Management [ ] Office and administrative [ ] Production [ ] Protective services [ ] Sales [ ] Other (please write your answer below) _______________________________________ [ ] Not currently in paid employment [ ] Retired [ ] Prefer not to answer
21) To which ethnic group/s do you belong? Please tick all that apply [ ] European [ ] Maori [ ] Pacific Island [ ] Asian [ ] Other (please write your answer below) ______________________ [ ] Prefer not to answer
Page 62
Otago Region Waterways Survey 2016
Page 11 of 11
22) Which district do you live in? Please tick one response only [ ] Waitaki [ ] Clutha [ ] Dunedin [ ] Central Otago [ ] Queenstown Lakes [ ] I live in a district outside of the Otago region
23) Are you currently a ratepayer in the Otago region? Please tick one response only [ ] Yes [ ] No
24) If you would like to enter the draw for ONE OF FIVE $200 GROCERY VOUCHERS please include your contact details below.
Name
Preferred contact phone number
Login code
Thank you for participating in this survey. Your response is important to us and we appreciate your feedback.
Please return the completed survey form to:
Versus Research Ltd Freepost 172567
PO Box 5516 Frankton
Hamilton 3242

APPENDIX 2 | DERIVED IMPORTANCE
Page 63
Derived importance: is used to look deeper at more subconscious factors which are likely to affect behaviour.
Derived importance was conducted using a max-diff analysis which prompted residents to rate a series of attributes for most and least important for a specific waterway. Max-diff is an approach for obtaining preference/importance scores for multiple items. This is done by asking respondents to pick a most important and a least important attribute from a set of lists.
The tables on the following page show the percent of respondents who picked this attribute as most, or least, important for a given waterway.

APPENDIX 2 | DERIVED IMPORTANCE
Page 64
MOST IMPORTANTCOASTAL BEACHES ESTUARIES RIVERS/
STREAMS LAKES WETLANDS URBAN
Absence of litter 39% 36% 29% 33% 37% 38%Accessibility 16% 14% 14% 10% 9% 13%Being able to swim 28% 19% 26% 31% 20% 20%Being able to use waterways nearby
16% 10% 15% 11% 13% 12%
Clarity of the water 26% 21% 30% 27% 27% 26%Collecting and consuming kai/food
20% 22% 20% 20% 17% 14%
Facilities at and around the water
9% 6% 5% 5% 6% 8%
Feeling secluded 6% 3% 1% 1% 4% 1%Landscaping and maintenance
10% 13% 7% 7% 12% 14%
Level of algae present 18% 19% 21% 27% 16% 23%Preservation of natural state and surroundings
45% 52% 51% 43% 54% 49%
Scenic value 16% 13% 12% 11% 15% 17%Smell of the water 6% 8% 9% 10% 7% 7%Sustains ecosystems/ wildlife
43% 58% 55% 55% 59% 52%
The depth/ volume of the water
2% 4% 3% 6% 2% 5%
LEAST IMPORTANT
COASTAL BEACHES ESTUARIES RIVERS/
STREAMS LAKES WETLANDS URBAN
Absence of litter 4% 2% 6% 3% 5% 6%Accessibility 20% 21% 20% 23% 23% 19%Being able to swim 21% 20% 18% 16% 28% 21%Being able to use waterways nearby
16% 19% 13% 22% 14% 19%
Clarity of the water 5% 9% 7% 6% 9% 6%Collecting and consuming kai/food
27% 22% 27% 26% 30% 33%
Facilities at and around the water
34% 40% 47% 41% 36% 41%
Feeling secluded 49% 52% 5% 55% 48% 53%Landscaping and maintenance
23% 26% 28% 28% 19% 21%
Level of algae present 11% 6% 7% 7% 10% 8%Preservation of natural state and surroundings
6% 3% 5% 8% 3% 4%
Scenic value 16% 18% 16% 16% 16% 16%Smell of the water 24% 25% 16% 17% 21% 18%Sustains ecosystems/ wildlife
3% 3% 2% 2% 3% 4%
The depth/ volume of the water
39% 32% 35% 28% 3% 31%

Versus Researchversus.co.nz07 8567090