Embed Size (px)
Citation preview

WORKING PAPER | December 2013 | 1
Working Paper
WAtERshED DEvElOPmENt IN INDIA: EcONOmIc vAluAtION AND ADAPtAtION cONsIDERAtIONsErin Gray anD arjuna SriniDhi
EXECUTIVE SUMMARYWatershed Development (WSD) in India has been a part of the national approach to improve agricultural produc-tion and alleviate poverty in rainfed regions since the 1970s. Watershed Development programs aim to restore degraded watersheds in rainfed regions to increase their capacity to capture and store rainwater, reduce soil ero-sion, and improve soil nutrient and carbon content so they can produce greater agricultural yields and other benefits. As the majority of India’s rural poor live in these regions and are dependent on natural resources for their livelihoods and sustenance, improvements in agricul-tural yields improve human welfare while simultaneously improving national food security (Ahmad et al. 2011; GOI 2012; Kerr 2002).
While WSD receives a significant amount of government attention and funding, there is not a clear understanding among practitioners of the overall effectiveness of WSD programs in meeting the objectives of food security and poverty alleviation. Furthermore, there is little concrete evidence of how revitalized ecosystems might improve resilience to climate change and conversely, how increas-ing rural dependence on climate-sensitive agricultural income might increase vulnerability.
A reason behind this lack of understanding is that data collection and evaluation efforts for WSD have lacked rigor and consistency between WSD implementing and administrative agencies. Additionally, evaluations of WSD have tended to focus on describing changes in key indi-cators and providing project narratives, and as a result, have not provided a clear picture of the economic, social, and environmental benefits for WSD beneficiaries. This
Disclaimer: Working Papers contain preliminary research, analysis, findings, and recommendations. They are circulated to stimulate timely discussion and critical feedback and to influence ongoing debate on emerging issues. Most working papers are eventually published in another form and their content may be revised.
Suggested Citation: Erin Gray and Arjuna Srinidhi. 2013. “Watershed Development in India: Economic valuation and adaptation considerations” Working Paper. Washington, DC: World Resources Institute. Available online at http://www.wri.org/publication/watershed-development-india-economic-valuation-adaptation-considerations
cONtENtsExecutive summary.......................................................1
Introduction...................................................................3
I. A brief history of Watershed Development in India.....4
1.1 challenges for data collection and refining WsD...6
1.2 the need for economic valuation...........................7
II. Economic valuation and Watershed Development......9
2.1 Benefit-cost Analysis of Kumbharwadi
Watershed: methodology and Results.............11
III. climate change adaptation considerations
for economic valuation............................................16
3.1 WOtR’s climate change Adaptation Project....16
3.2 Economic valuation and ccA..........................19
Iv. Discussion and results............................................21
Bibliography.................................................................24
Appendix 1: Benefit-cost Analysis tables.....................26

2 |
paper argues that there is a clear need for more systematic economic valuation of WSD initiatives to better prioritize government funding and WSD guidelines, foster greater awareness of the benefits of ecosystem restoration for food security and poverty alleviation, and improve the plan-ning and implementation of projects. Economic valuation is a useful tool that assigns monetary values to benefits of WSD, including social and environmental benefits. Economic valuation can contribute to improved WSD decision-making, awareness, and planning, by allowing comparison of project costs and benefits through decision-support tools like benefit-cost analysis.
In 2012, the World Resources Institute (WRI) partnered with a WSD implementing agency, the Watershed Organ-isation Trust (WOTR), to conduct an economic valuation of one of its WSD projects using benefit-cost analysis (BCA) and review their recent Climate Change Adaptation (CCA) Project. The WOTR is an NGO based in Pune, India, that has been implementing WSD projects since 1993. It is one of the first WSD organizations to develop a CCA strategy in India. The objective of this partnership was to better understand the need for economic valuation and related data collection and analysis challenges, as well as to foster an understanding of CCA interventions.
This partnership informed the development of this paper. We provide a history of WSD and evaluation measures and challenges. We also present methods and results from our BCA of a WOTR-implemented participatory WSD project located in Maharashtra and highlight our data collection challenges.
Through this BCA we provide an overview of a typical WSD project and discuss costs and benefits, including market, non-market, and co-benefits. We compare costs and benefits from the project initiation date in 1998 through 2012, using net present value and benefit-cost ratio as indicators of project success. Results of the analy-sis show a net present value ranging from $5.08 to $7.43 million over the 15-year project period, and a positive benefit-cost ratio of 2.3 to 3.8, showing that this has been a positive investment for the 171 households of the Kumbharwadi watershed. Key data collection challenges included:
Lack of consistency in data reporting for social, environmental, and economic indicators of WSD projects by implementing agencies, due to a lack of funding to support monitoring and evaluation activi-
ties and a lack of knowledge about which data to col-lect to support economic valuation.
Lack of consistency in data collection as project impact assessments are often completed by different research agencies; and therefore, project implement-ing agencies (PIAs) tend to regard the challenges of deriving meaningful results from WSD project data as an external problem.
Insufficient acknowledgment of non-market and co-benefits that can help generate greater awareness of ecosystem services and societal ben-efits, as well as provide a broader picture of WSD impacts.
Lack of post-project impact assessments that can help determine whether perceived benefits are actually long-term benefits that contribute to resil-ience to drought and other factors.
Finally, we provide an overview of WOTR’s CCA Project which was initiated in 2009 and has been implemented in nearly 50 villages in three states. We argue that as more PIAs implement climate adaptation projects, practitioners and those interested in valuation can begin building better and more consistent data collection strat-egies into their operations. We conclude by discussing adaptation-related valuation considerations and recom-mendations for WSD, including:
Economic valuation of WSD projects should leverage community participation for data collection. Data collection can be difficult for PIAs and researchers as staff and funding resources are generally immediately spent on project implementa-tion and improving welfare conditions. Those plan-ning on conducting valuations can leverage the power of participatory programs to integrate villager and local knowledge into valuations and data collection.
Watershed Development valuations should consider how benefits are distributed among economic classes, on-farm and off-farm stakeholders, and genders. As poverty reduction is a stated goal of the Government of India (GOI) for its WSD programs, it is important that evaluations consider not only total benefits but how benefits are distributed.

Watershed Development in India: Economic valuation and Adaptation considerations
WORKING PAPER | December 2013 | 3
Economic valuations should consider market, non-market, and co-benefits of WSD proj-ects. Watershed Development projects are rooted in ecosystem restoration for the provision of ecosystem goods and services like crop production, water sup-ply, erosion control, and many others. As these goods and services support human welfare and livelihoods in rainfed regions, and therefore support WSD goals, it is important that they are represented in project evaluations.
Economic valuation can provide information to help develop and tailor CCA interventions and strategies. Economic valuation is a commonly used tool to develop and evaluate investment pro-grams. Data collection conducted at repeated inter-vals can help PIAs adjust their strategy if needed, or strengthen certain interventions.
Guidance is needed from WSD funders and researchers to help implementing agencies standardize data collection processes and reporting protocols. Most PIAs already have data collection and reporting protocols in place, but the robustness of this data varies based on time and resource constraints, as well as knowledge of what is needed to conduct an economic valuation. Guidance is specifically needed on which indicators can best be used to conduct a robust economic analysis, how to calculate the rate of return for a given WD interven-tion and optimize interventions to return the greatest utility to watershed villages, and how data should be reported.
InTRodUCTIonWatershed Development (WSD) in India has been a part of the national approach to improve agricultural produc-tion and alleviate poverty in rainfed regions since the 1970s. Essentially, WSD programs aim to restore degraded landscapes in rainfed regions to increase their capacity to capture and store rainwater, reduce soil erosion, and improve soil nutrient and carbon content so they can produce greater agricultural yields for local consumption and income generation. As the majority of India’s rural poor live in these regions and are dependent on natural resources for their livelihoods and sustenance, improve-ments in agricultural yields improve human welfare while simultaneously improving national food security (Ahmad et al. 2011; GOI 2011; Kerr 2002).
Watershed Development programs focus on rainfed regions because these areas represent 65 percent of arable land in India and 55 percent of the country’s agricultural output, and provide food that supports 40 percent of the nation’s population (Ahmad et al. 2011; Planning Com-mission 2012). These areas, however, are characterized by low productivity, due to both geographical and climatic conditions, and also due to a history of poor land manage-ment. Despite these challenges, the Department of Land Resources (DoLR) (2006) states, “While it is the rainfed parts of Indian agriculture that have been the weakest, they are also the ones that contain the greatest unutilised potential for growth, and need to be developed if food security demands of the year 2020 are to have a realistic chance of being met.”
The focus and scale of WSD has changed greatly over time, but today, the GOI through its most recent WSD guide-lines (GOI 2011) and Twelfth Five Year Plan (Planning Commission 2012), recognizes the importance of ecosys-tems, community participation, and project flexibility for promoting economic activity and addressing cultural dif-ferences and local needs. A ‘participatory’ WSD approach integrates and trains community members in WSD inter-ventions including ecosystem-based interventions (e.g. afforestation, agro-forestry), technical interventions (e.g. human-built interventions for soil and water conservation and drought mitigation), and social interventions (e.g. women’s self-help group development, capacity building).
Current spending on WSD is estimated to be roughly four billion US dollars per year1 with numerous WSD programs and project implementing agencies (PIAs) dedicated to promoting WSD interventions. Despite the level of attention and funding WSD receives, practitio-ners do not have a clear understanding of the overall effectiveness of WSD programs, how WSD is contribut-ing to poverty reduction and human welfare, which WSD interventions and portfolio of interventions are most beneficial, and how to adjust programs for near- and long-term climate risks. Furthermore, there is a lack of understanding of how revitalized ecosystems might improve resilience to climate change and conversely, how increasing rural dependence on climate-sensitive agricul-tural income might increase vulnerability.
A reason behind this lack of understanding is that evalua-tions of WSD and data collection by government agencies and third parties to date have lacked rigor and consistency. Additionally, evaluations of WSD have tended to describe

4 |
changes in key indicators and provide project narratives, rather than a review of the economic costs and benefits and the distribution of costs and benefits across WSD beneficia-ries. This paper argues that there is a clear need for more systematic economic valuation of WSD initiatives to better prioritize government funding and WSD guidelines, foster greater awareness of the benefits of ecosystem restora-tion for food security and poverty alleviation, and improve the planning and implementation of projects. Economic valuation is a useful tool that assigns monetary values to benefits of WSD, including social and environmental ben-efits. Economic valuation can contribute to improved WSD decision-making and planning by allowing for the compari-son of project costs and benefits through decision-support tools like benefit-cost analysis (BCA).
This paper discusses data collection needs and challenges for WSD in relation to economic analysis. Our discussion is based on a short-term collaboration in 2012 between the World Resources Institute (WRI) and the Watershed Organisation Trust (WOTR) to evaluate a sample WSD project and review WOTR’s Climate Change Adaptation (CCA) project. Since it began in 1993, WOTR has imple-mented over 380 WSD projects covering almost 260,000 hectares in six Indian states. This document is therefore useful for those who implement, fund, and/or evaluate WSD projects in India. Additionally, as this working paper highlights challenges related to data collection and climate change adaptation of rural areas, we hope it will be useful for practitioners involved with development of rainfed areas in other countries.
We begin by providing the historical context for WSD policy in India, highlighting influential policies and chal-lenges for evaluating and scaling up successful WSD proj-ects. We then provide a more in-depth overview of WSD, framed through a BCA of a project implemented by WOTR in the Kumbharwadi watershed of Maharashtra. This section provides insights into typical WSD interventions and processes. We discuss results from the BCA, including market and non-market benefits as well as data collection challenges faced by implementing agencies like WOTR. Section IV presents a discussion of WOTR’s Climate Change Adaptation (CCA) strategy as well as a discus-sion on how to extend economic valuation to assess CCA projects. We then conclude with a summary of important data collection constraints and considerations with regard to economic valuation of WSD.
The World Resources Institute and WOTR hope to build upon this analysis in the future by evaluating more water-sheds and looking more closely at the impacts of WOTR’s CCA approach as it develops over time. We hope this work will lead not only to improved evaluation of WSD proj-ects but better targeted funding and interventions that continue to support rural livelihoods and adaptation to climate change.
I. A bRIEf hISToRY of WATERShEd dEVElopMEnT In IndIAWatershed Development programs began in the early 1970s as a way to address food security and rural poverty in India’s rainfed regions. The GOI’s initial interest in WSD was spurred by a growing realization that there were production limits to agriculture from India’s Green Revo-lution (Joshi et al. 2005). The Green Revolution focused on promoting high-yielding crop varieties, increased fertilizer and pesticide use, and large-scale irrigation of the country’s plains, which represent less than 40 percent of arable land area. Rainfed regions, conversely, repre-sent almost 65 percent of cultivable area in India and 55 percent of agricultural production (Planning Commission 2012). Despite representing the majority of cultivable area, rainfed areas are less productive than irrigated areas, with crop yields at about a third of the national aver-age. This low productivity is due to a variety of reasons. Rainfed areas are characterized by erratic, deficient, and delayed rainfall patterns. Rainfed regions also represent 73 agro-climatic zones and are characterized largely as having hilly, mountainous terrain. As a result, large-scale irrigation is often difficult or impossible and it is diffi-cult to implement a standard remedy to improving crop production and livelihoods (Planning Commission 2012). Rainfed regions have also historically experienced severe degradation due to heavy deforestation and unsustainable agricultural and livestock practices. Populations living in these regions are also some of India’s poorest, with insuffi-cient access to education and agricultural markets (Ahmad et al. 2011; GOI 2011).
Over the past fifty years, WSD has evolved from a top–down, technical, and bureaucratic approach to a participatory, ecosystems-based approach including social, ecosystem-based, and technical interventions. For example, early programs from the 1970s administered by the Ministry of Rural Development (MoRD), like the Drought Prone Areas Programme (DPAP), the Desert Development Programme (DDP), and the Integrated
Watershed Development in India: Economic valuation and Adaptation considerations
WORKING PAPER | December 2013 | 5
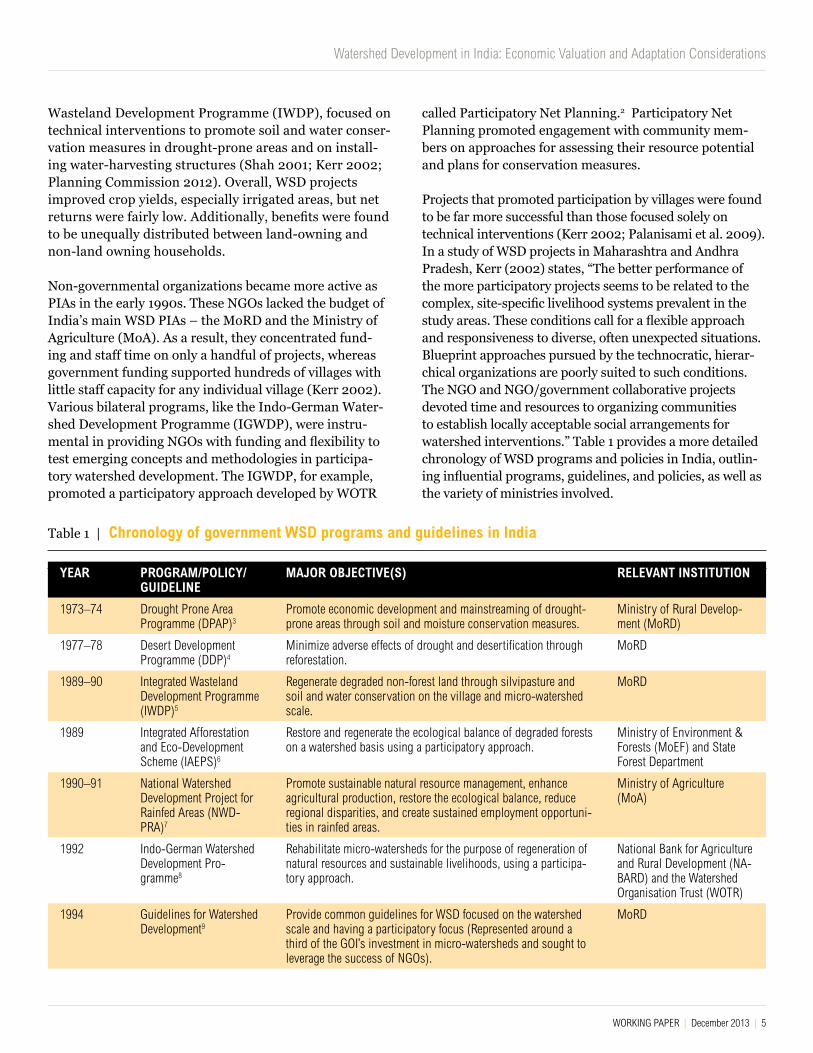
called Participatory Net Planning.2 Participatory Net Planning promoted engagement with community mem-bers on approaches for assessing their resource potential and plans for conservation measures.
Projects that promoted participation by villages were found to be far more successful than those focused solely on technical interventions (Kerr 2002; Palanisami et al. 2009). In a study of WSD projects in Maharashtra and Andhra Pradesh, Kerr (2002) states, “The better performance of the more participatory projects seems to be related to the complex, site-specific livelihood systems prevalent in the study areas. These conditions call for a flexible approach and responsiveness to diverse, often unexpected situations. Blueprint approaches pursued by the technocratic, hierar-chical organizations are poorly suited to such conditions. The NGO and NGO/government collaborative projects devoted time and resources to organizing communities to establish locally acceptable social arrangements for watershed interventions.” Table 1 provides a more detailed chronology of WSD programs and policies in India, outlin-ing influential programs, guidelines, and policies, as well as the variety of ministries involved.
Wasteland Development Programme (IWDP), focused on technical interventions to promote soil and water conser-vation measures in drought-prone areas and on install-ing water-harvesting structures (Shah 2001; Kerr 2002; Planning Commission 2012). Overall, WSD projects improved crop yields, especially irrigated areas, but net returns were fairly low. Additionally, benefits were found to be unequally distributed between land-owning and non-land owning households.
Non-governmental organizations became more active as PIAs in the early 1990s. These NGOs lacked the budget of India’s main WSD PIAs – the MoRD and the Ministry of Agriculture (MoA). As a result, they concentrated fund-ing and staff time on only a handful of projects, whereas government funding supported hundreds of villages with little staff capacity for any individual village (Kerr 2002). Various bilateral programs, like the Indo-German Water-shed Development Programme (IGWDP), were instru-mental in providing NGOs with funding and flexibility to test emerging concepts and methodologies in participa-tory watershed development. The IGWDP, for example, promoted a participatory approach developed by WOTR
Table 1 | Chronology of government WSd programs and guidelines in India
YEAR pRogRAM/polICY/gUIdElInE
MAjoR objECTIVE(S) RElEVAnT InSTITUTIon
1973–74 Drought Prone Area Programme (DPAP)3
Promote economic development and mainstreaming of drought-prone areas through soil and moisture conservation measures.
ministry of Rural Develop-ment (moRD)
1977–78 Desert Development Programme (DDP)4
minimize adverse effects of drought and desertification through reforestation.
moRD
1989–90 Integrated Wasteland Development Programme (IWDP)5
Regenerate degraded non-forest land through silvipasture and soil and water conservation on the village and micro-watershed scale.
moRD
1989 Integrated Afforestation and Eco-Development scheme (IAEPs)6
Restore and regenerate the ecological balance of degraded forests on a watershed basis using a participatory approach.
ministry of Environment & Forests (moEF) and state Forest Department
1990–91 National Watershed Development Project for Rainfed Areas (NWD-PRA)7
Promote sustainable natural resource management, enhance agricultural production, restore the ecological balance, reduce regional disparities, and create sustained employment opportuni-ties in rainfed areas.
ministry of Agriculture (moA)
1992 Indo-German Watershed Development Pro-gramme8
Rehabilitate micro-watersheds for the purpose of regeneration of natural resources and sustainable livelihoods, using a participa-tory approach.
National Bank for Agriculture and Rural Development (NA-BARD) and the Watershed Organisation trust (WOtR)
1994 Guidelines for Watershed Development9
Provide common guidelines for WsD focused on the watershed scale and having a participatory focus (Represented around a third of the GOI’s investment in micro-watersheds and sought to leverage the success of NGOs).
moRD

6 |
1.1 Challenges for data collection and refining WSdDespite the growth in WSD projects and funding over the past thirty years, it is unclear how successful WSD has been. Government and third party evaluations of WSD to date have lacked consistency both in data collection and methodology. The Parthasarathy Technical Committee
report (DoLR 2006) found that the quality of data has been highly variable across WSD projects. The Parthasarathy report also found evaluations lacked a rigorous methodol-ogy. In terms of data collection, evaluations tend to focus on aggregating project-level data, reporting on key biophysical and welfare indicators, and making recommendations. For example, the MoRD commissioned the Centre for Rural Studies (Singh et al. 2010) to evaluate WSD programs
Table 1 | Chronology of government WSd programs and guidelines in India (Cont.)
YEAR pRogRAM/polICY/gUIdElInE
MAjoR objECTIVE(S) RElEVAnT InSTITUTIon
1999–2000 Watershed Development Fund10
Provide financial support to scale up successful participatory WsD projects in 100 priority districts; promote a more unified strategy to WsD.
moA and National Bank for Agriculture and Rural Devel-opment (NABARD)
2001 common Guidelines for Watershed Development (Revised)11
update the 1994 WsD guidelines to have a more participatory and project- specific focus with greater flexibility in implemen-tation. Applicable to IWDP, DPAP, DDP, and other programs notified by GOI.
moRD
2002 National Afforestation Programme12
Develop forest resources using a participatory approach and build capacity of fringe communities.Formulated by the merger of IAEPs and three other forestry programs to reduce the multiplicity of schemes.
moEF
2003 hariyali Guidelines13 Integrate community institutions more meaningfully in DPP, DPAP, and IWDP and simplify procedures.
moRD
2005 mahatma Gandhi National Rural Employ-ment Guarantee scheme (mGNREGs)14
Enhance livelihood security in rural areas by providing at least 100 days of guaranteed wage employment a year to every house-hold whose adult members volunteer to do unskilled manual work (e.g. soil and water conservation, afforestation, and land development).
moRD
2006 Parthasarathy committee report15
the Parthasarathy committee was established as a technical committee to evaluate the DPAP, DDP, and IWDP. In 2006, the committee released a report that served as a review of India’s Watershed Program. the committee’s report serves as the basis of the Neeranchal Guidelines and the NRAA.
moRD
2006 National Rainfed Area Authority (NRAA)16
create common guidelines for all WsD schemes under the differ-ent ministries for the development of rainfed farming systems.
Planning commission
2008 common Guidelines for Watershed Development (Neeranchal) released17
Promote a fresh framework to guide all WsD projects in all departments and ministries.
National Rainfed Area Au-thority (NRAA) and Planning commission
2009 Integrated Watershed management Programme (IWmP)18
consolidated three programs: IWDP, DPAP, and DPP. Programs adopted a cluster approach focusing on a cluster of micro-water-sheds (1000 ha to 5000 ha scale).
moRD
2011 Revised common Guidelines for Watershed Development released19
Provide amendments to the 2008 guidelines based on clarifica-tions and suggestions from concerned ministries, departments, state governments, and NGOs.
NRAA and Planning com-mission
2013 Revisions added to 2008 common Guidelines (known as Neeranchal Guidelines)20
Add new features to the 2008 common Guidelines to ensure mo-mentum to the IWmP while strengthening its innovative features.
moRD

Watershed Development in India: Economic valuation and Adaptation considerations
WORKING PAPER | December 2013 | 7
between 1998–2002.This study used government and third party reports and based WSD effectiveness on results from a cross-comparison of indicators including (but not limited to) groundwater level, surface water, irrigation facility, water regeneration capacity, land use pattern, cropping pattern, livestock production, employment generation, income generation, and debt reduction. Third-party evalua-tions have also followed this trend (Kuppannan and Suresh Kumar 2009). While overall, evaluation efforts to date have been useful for gaining a general sense of WSD perfor-mance and have justified significant expansion of funding and projects, better valuation and guidance for data collec-tion could shed light on how to better target WSD funding, how to optimize WSD interventions to produce the greatest benefits to society, and how to stimulate local investment.
One major challenge for improving data collection efforts is that over the past thirty years, there have been nine guidelines (Reddy 2006) for WSD, and multiple minis-tries, programs, and policies have been administering and implementing WSD projects. This situation highlights not only the attention and funding WSD receives, but also its fragmented nature. With regard to the large amount of funding WSD projects receive, India’s Twelfth Five Year Plan states, “Each of these [programs] is conceived and implemented in departmental silos and there is no unified mechanism for coordination and convergence. As a result, these programs do not lead to ‘area development’; poten-tial synergies are lost; and investments, interventions, and results remain sub-optimal.’ (Planning Commission 2012).
1.2 The need for economic valuationEconomic valuation can better guide WSD program devel-opment and implementation, as well as raise awareness of the benefits of ecosystem restoration for food security and poverty alleviation in India. Talberth et al. (2013) state that decision-support tools like BCA can be used to help development decision-makers decide on public infrastructure investments, including both ecosystem (or green infrastructure) and man-made (or gray infrastruc-ture) components. As WSD promotes restoration and conservation of ecosystems for provision of ecosystem services, valuation can potentially be used to decide on portfolios of WSD interventions and target funding. There are well-established valuation methods that can capture both market and non-market benefits of ecosystems, including agricultural productivity increases, water filtra-tion and storage, biodiversity and habitat improvement, and health improvements due to better nutrition and water supply (for more information on market and non-
there is a common recognition now in India that WsD must be holistic and focus on restoring the ecological balance of rain-fed areas that have been degraded over time. many interven-tions included in WsD by organizations like WOtR are focused on restoring ecosystem health as ecosystems provide a wealth of services that underpin agricultural production, such as soil nutrient cycling, pollination, and carbon sequestration. While improvements in crop and livestock yields are targeted benefits of WsD, there are also other market and non-market benefits associated with WsD interventions that can be captured through economic valuation:
Market benefits are benefits that have an explicit market price. For example, an improvement in crop and livestock yields is a market benefit as increased yields can be sold directly to consumers at an established price. market prices represent the value society places on goods and services and consumption preferences.
non-market benefits are benefits that do not have an ex-plicit market price. Ecosystems provide a variety of non-market benefits such as carbon sequestration, habitat provision, and recreation. In terms of WsD, for example, improvements in agricultural production and diversity help to improve human and livestock nutrition, leading to multiple health benefits. Additionally, afforestation and reforestation efforts sequester carbon, which helps to mitigate climate change. As market prices are not explicit, these benefits are often neglected or undervalued in decision-making.
the economic valuation of both market and non-market ben-efits is based on the welfare provided by the flow of ecosystem services (Wielgus et al. 2002). Often, valuations of public investment and development programs neglect non-market benefits. the valuation of these benefits, however, can assist policy- and decision- makers with development decisions, establishing funding priorities, and increasing public awareness of the value of an ecosystem-based approach to rural development. Economists have developed several reputable methods for quantifying non-market benefits, including stated preference, revealed preference, and benefits transfer approaches.
Box 1 | Accounting for benefits of an ecosystem-based approach to Watershed development
market benefits, see Box 1). Benefit-cost analysis and other decision-support tools can capture these benefits and allow comparison with project costs. As a result, valuation can provide decision-makers with a more holistic picture for how to develop WSD programs. Economic valuation can also be used to compare different WSD programs or projects, provide insights on how to better coordinate government and third-party efforts, and determine how to

8 |
Table 2 | overview of recent economic valuations of watershed development in India
AUThoR(S) REgIon METhodologY WhAT WAS VAlUEd KEY RESUlTS
chatuverdi, v., 2004. cost-benefit analysis of watershed development: An exploratory study in Gujarat. Development support centre. Research Report. Bopal, Ahmed-abad.
Gujarat Benefit-cost analysis of eight WsD projects over a ten-year period, using questionnaire-based surveys and focus group discus-sions, exploring the distribution of benefits.
Benefits include returns from agri-culture and horticulture; costs include investments under-taken in soil and moisture conser-vation and water harvesting only.
Average benefit-cost ratio was 8.56. the average benefit from the WsD project
(calculated as the difference between profit before and after watershed development) in normal rainfall years was greater than in drought years.
Profit for marginal farmers is much lower than for small or big farmers. Profits were also higher for well-owners than for non-well-owners.
Joshi, P.K., Jha, A.K., Wani, s.P., Joshi, l., shiyani, R.l., 2005. meta-analysis to assess impact of watershed programme and people’s participation. comprehen-sive Assessment Research Report 8. colombo, sri lanka: comprehensive As-sessment secretariat.
India meta-analysis of 311 WsD case studies
the study attempted to documentefficiency, equity, and sustainability benefits. Four important indicators were identified to demonstrate sustain-ability benefits. these included(i) increased water storage capac-
ity, which augmented irrigation; (ii) increased cropping intensity;(iii) reduced runoff, which en-
hanced groundwater recharge; and
(iv) reduced soil loss.
mean benefit-cost ratio of a WsD program in India was 2.14
the internal rate of return was 22 percent. the performance of the WsD program
was best for programs that targeted low and medium income groups, were jointly implemented by the state and central gov-ernment, had effective people’s participa-tion, and had rainfall ranging between 700–1,000 mm.
lack of appropriate institutional support is impeding the tapping of potential benefits associated+ with these programs.
sahu, s. 2008. cost-benefit analysis of par-ticipatory natural resource management: A study of watershed development initiative in Indian village. munich Personal RePEc Archive. Paper no. 17134.
Rajasthan Benefit-cost analysis projecting benefits for 30 years.
Benefits from agricultural and live-stock production, self-help group savings, and wage employment; costs include intervention capital and administrative costs.
Benefit-cost ratio ranged from 1.97 to 2.34
Palanisami, K., Kumar, D.s., Wani, s.P., Giordano, m., 2009. Evaluation of watershed development programmes in India using economic surplus method. Agricultural Eco-nomics Research Review. vol 22, July–December 2009: 197–207.
tamil Nadu
Economic surplus used to measure the aggregated social ben-efits of a research proj-ect and distributional impacts for a cluster of 10 watersheds.
costs include capital and Operation and maintenance (O&m) costs of WsD interventions towards water-shed. Benefits are based on con-sumer and producer surplus from being able to consume products at a lower market price and being able to sell products at a higher market price.
Benefit-cost ratio of 1.93 People’s participation (e.g. in Panchayati
Raj Institutions, local user groups, and NGOs) along with institutional support from different levels of government should be ensured to make the program more par-ticipatory, interactive, and cost-effective.
Internal rate of return of 25 percent.
Kale, G., manekar, v.l., Porey, P.D., 2012. Water-shed development project justification by economic evaluation: a case study of Kachhighati Watershed in Aurangabad District, maharashtra. Ish Journal of hydraulic Engineering. vol. 18 (2): 101–111.
maha-rashtra
Benefit-cost analysis; Present value analysis assuming sustain-ability of the project will be a minimum of 35 years.
costs include capital and adminis-trative costs of all WsD interven-tions; Benefits include increased income from agriculture, livestock, and fodder production, and savings from self-help groups.
Benefit-cost ratio based on the total present value of costs (tPvc) and the total present value of benefits (tPvB) is calculated as 7.1658.
Average annual benefit-cost ratio based on present values during the first 5-year block period (1997–2001) is 3.1397, whereas that in the second 5-year block period (2002–2006) after the implementation of project is 5.2870.
Economic evaluation as a tool is found effective for the financial validation of watershed projects.

Watershed Development in India: Economic valuation and Adaptation considerations
WORKING PAPER | December 2013 | 9
optimize WSD interventions to maximize benefits. Devel-oping this type of understanding is important given the huge investments made both by the GOI and bilateral and corporate funders (Kale et al. 2012).
The economic valuation literature appears to be expand-ing with valuations of WSD projects having been con-ducted in Tamil Nadu, Rajasthan, Maharashtra, and Gujarat. Table 2 provides an overview of recent economic valuation studies, their methodologies, and key results. There are still gaps in the knowledge base of watershed development, such as understanding the distributional impacts of WSD and how to optimize interventions to generate the greatest benefits. Additionally, valuation lit-erature is largely silent on the non-market and co-benefits generated by WSD projects that promote ecosystem res-toration as a way to improve food production and human welfare. Co-benefits include market and non-market benefits such as habitat provision, biodiversity improve-ment, carbon sequestration, improved education, female empowerment, and improved human health and nutrition.
In the following two sections we explore some of the data collection considerations and challenges for economic valu-ation of WSD projects. We also present methods and results from a BCA of a participatory WSD project implemented by WOTR to shed light on the usefulness of valuation.
II. EConoMIC VAlUATIon And WATERShEd dEVElopMEnTIn 2012 WRI partnered with WOTR to evaluate one of their WSD projects and gain more insight into the data collection challenges that PIAs face. In this section we pro-vide an overview of a typical WSD project through the lens of an ex-post BCA. WOTR has been actively implementing WSD projects since its inception in 1993, using a partici-patory approach. Their projects have been held as success stories all over the globe. To date, WOTR has directly implemented over 380 projects covering almost 260,000 hectares in six Indian states (WOTR 2012b). The selected watershed was Kumbharwadi, one of WOTR’s first partici-patory WSD projects.
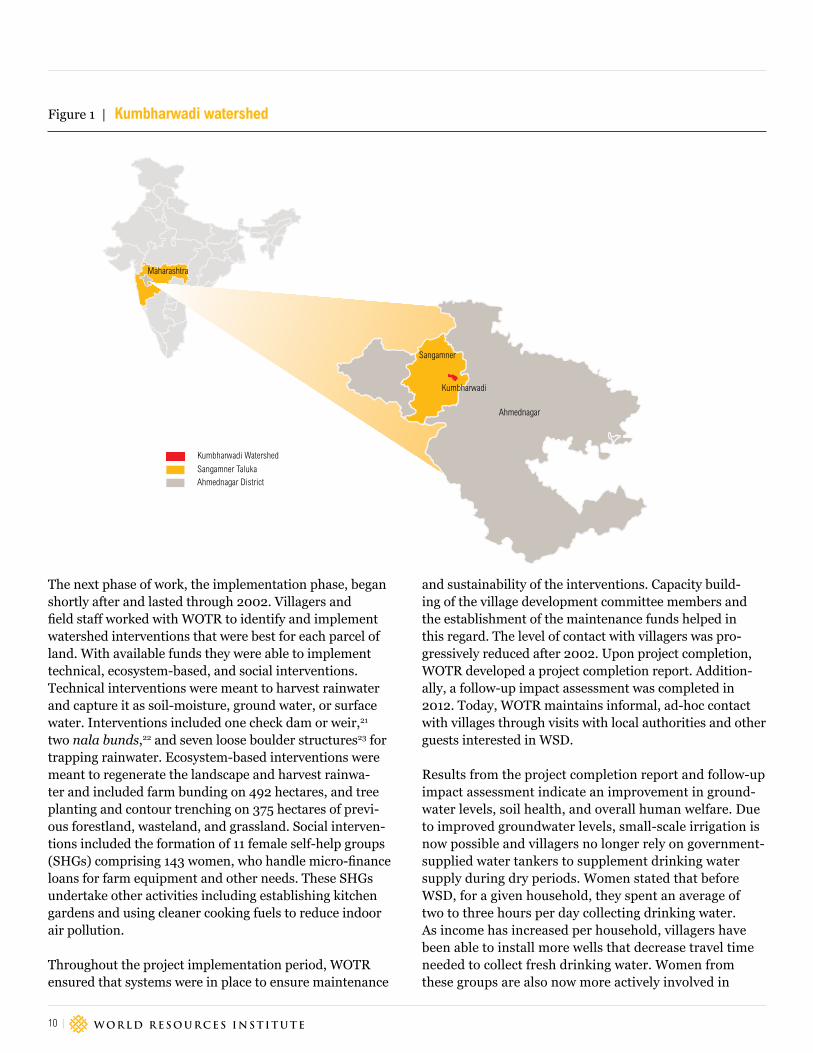
Kumbharwadi is a rainfed watershed lying in the rain-shadow region of Ahmednagar district in Maharashtra state (see Figure 1). Total area is 910 hectares and the terrain is hilly, making irrigation difficult. Rainfall occurs primarily during the monsoon period from June through October, with average annual rainfall at 476 mm, although the region has experienced less rainfall in the past three
years. Rainfall intensity also varies – the area sometimes experiences periods of high intensity rainfall (50–75 mm/hour) which contributes to high soil erosion. Two villages lie within the watershed: Kumbharwadi and Jondalwadi. Kumbharwadi village constitutes the majority of valley land and includes the highest proportion of landowners. Jondalwadi village lies on the ridge or hilly area of the Kumbharwadi watershed and includes a tribal community who mostly rent land.
There are 171 households currently living in the water-shed with an average family size of 5.78. This number has remained stable over (at least) the past 15 years. Before the WSD project began, Kumbharwadi was extremely degraded due to poor land management and unsustainable livestock practices. Agricultural production was only possible for 6–7 months per year. During the remaining period, villagers migrated for work. Women also had to travel, sometimes long distances, for fuel wood and drinking water. During the dry season, villagers relied on about 25–30 govern-ment-supplied water tankers per year to supplement drink-ing water needs. Over 50 percent of land was categorized as wasteland due to poor management practices, overgrazing, and weather stressors (WOTR 2012a).
The program was funded by the German Bank for Development and the German Agency for Technical Cooperation, and the funds were routed through NABARD and WOTR.
WOTR began work in Kumbharwadi in two phases between 1998 and 2002. The first phase was a capacity building phase that lasted 18 months. During this phase, all villagers were required to undergo hands-on train-ing based on the principle of ‘learning by doing’ to learn about basic conservation, sustainable land management, and maintenance of all WSD interventions. Initially, Kumbharwadi residents were trained in watershed activi-ties on a small area of 250 hectares in the ‘learning by doing’ approach to implementation. Additionally, WOTR engaged all land-owning families in planning interven-tions on their property. Village labor was entirely volun-tary (termed shramdan) during the capacity-building phase. WOTR also helped set up a representative Village Watershed Committee to serve as the main project imple-menter and represent all villagers. All major decisions must be approved by this Committee. At the beginning of the project, WOTR also started a maintenance fund which essentially serves as a revolving fund which can be used to provide loans to farmers for agricultural purposes and support operation and maintenance (O&M) costs.
10 |
The next phase of work, the implementation phase, began shortly after and lasted through 2002. Villagers and field staff worked with WOTR to identify and implement watershed interventions that were best for each parcel of land. With available funds they were able to implement technical, ecosystem-based, and social interventions. Technical interventions were meant to harvest rainwater and capture it as soil-moisture, ground water, or surface water. Interventions included one check dam or weir,21 two nala bunds,22 and seven loose boulder structures23 for trapping rainwater. Ecosystem-based interventions were meant to regenerate the landscape and harvest rainwa-ter and included farm bunding on 492 hectares, and tree planting and contour trenching on 375 hectares of previ-ous forestland, wasteland, and grassland. Social interven-tions included the formation of 11 female self-help groups (SHGs) comprising 143 women, who handle micro-finance loans for farm equipment and other needs. These SHGs undertake other activities including establishing kitchen gardens and using cleaner cooking fuels to reduce indoor air pollution.
Throughout the project implementation period, WOTR ensured that systems were in place to ensure maintenance
and sustainability of the interventions. Capacity build-ing of the village development committee members and the establishment of the maintenance funds helped in this regard. The level of contact with villagers was pro-gressively reduced after 2002. Upon project completion, WOTR developed a project completion report. Addition-ally, a follow-up impact assessment was completed in 2012. Today, WOTR maintains informal, ad-hoc contact with villages through visits with local authorities and other guests interested in WSD.
Results from the project completion report and follow-up impact assessment indicate an improvement in ground-water levels, soil health, and overall human welfare. Due to improved groundwater levels, small-scale irrigation is now possible and villagers no longer rely on government-supplied water tankers to supplement drinking water supply during dry periods. Women stated that before WSD, for a given household, they spent an average of two to three hours per day collecting drinking water. As income has increased per household, villagers have been able to install more wells that decrease travel time needed to collect fresh drinking water. Women from these groups are also now more actively involved in
Figure 1 | Kumbharwadi watershed
maharashtra
Kumbharwadi Watershed
sangamner talukaAhmednagar District
sangamner
Kumbharwadi
Ahmednagar

Watershed Development in India: Economic valuation and Adaptation considerations
WORKING PAPER | December 2013 | 11
village decision-making processes for developmental decisions as a result of the self-help groups. Improved crop production has been one of the largest benefits for Kumbharwadi, as net agricultural income has increased dramatically from $69,000 per year to almost $625,000 per year for the watershed. The jump in agricultural income is largely due to the following factors: cultivable area has expanded as areas previously classified as waste-land can now be cultivated; crop yields have improved with better agricultural practices and use of small-scale irrigation; and villagers have been able to switch from grain crops to cash crops which have a higher price per unit sold. The value of cropland has correspondingly increased and villagers no longer migrate for work as they are able to sustain agricultural employment in the watershed year-round. As fodder availability and agricul-tural incomes have improved, villagers have also invested more in cross-bred cattle as opposed to indigenous cattle. As crossbred cattle have higher milk yields, livestock income has correspondingly increased.
Table 3 presents a summary of changes in key indicators based on three reports conducted by WOTR: a project feasibility report conducted before the start of project in 1998, a project completion report conducted in 2003, and a follow-up impact assessment conducted in 2012 (WOTR 2012a). Changes in these indicators have led to the gen-eration of multiple market and non-market benefits, as shown in Table 4.
Table 3 | Impact indicators from WSd in Kumbharwadi watershed
IMpACT IndICAToR UnIT REpoRTIng YEAR
1998 2002 2010-11
Government supplied water tankers
Number/year
25–30 0 0
Average depth of water table below ground level
meters 6.5 3.5 3
land under irrigation (perennial)
hectares 0 9.72 50
total cropped area hectares 457 510 566
variety of crops grown dur-ing Rabi24 season
hectares 4 14 25
value of cropland Rs/hectare 15,000 65,000 65,000
Wells Number 63 85 91
Agricultural employment months/yr 3–4 8–9 12
Agricultural wage rate Rs 25 65 225
Table 4 | Example market and non-market benefits of WSd in Kumbharwadi
MARKET bEnEfITS non-MARKET bEnEfITS
Improved crop sales carbon sequestration
Improved livestock sales habitat improvement/biodiversity
Avoided travel cost for migratory work Improved nutrition and health
Avoided travel cost for drinking water Improved diversity in diet
Avoided cost of government supplied water tankers
Increased enrolment in education
Improved fuel wood and fodder supplies
Female empowerment
community development
Improved resilience to drought
Pollination
Water filtration
2.1 benefit-cost Analysis of Kumbharwadi Watershed: Methodology and ResultsThere are several approaches25 available to evaluate WSD projects that incorporate economic valuation of costs and/or benefits. A report by Palanisami et al. (2009) provides details on other methodologies applicable to WSD. Table 2 also provides information on approaches that have been used for recent WSD valuations. Perhaps one of the most useful and most commonly used approaches, however, for presenting results from ex-post valuations is benefit-cost analysis (BCA). Benefit-cost analysis is a decision-support tool commonly used to make investment decisions as it allows easy comparison of project costs and benefits. To explore and compare costs of a WSD project with both market and non-market benefits, we conducted a BCA using the following steps:1. Define valuation objective2. Identify and estimate costs of the project3. Identify and estimate benefits of the project (market
and non-market)4. Conduct an uncertainty/sensitivity analysis5. Compare costs and benefits using net present value
and benefit-cost ratio
Net present value (NPV) and benefit-cost ratio (BCR) are also commonly used indicators of project success applica-ble to BCA. Net Present Value is the sum of present values of a series of annual cash flows (total present value cost subtracted from total present value benefits) whereas BCR is the ratio of total present value benefits over a project’s lifetime to total present value costs.

12 |
We reviewed primary data on Kumbharwadi including the WOTR 1998, 2003, and 2012 reports. To fill in gaps in data, interviews were conducted with WOTR field staff and villagers through three separate site visits and a litera-ture review was conducted of WSD evaluations in India.
2.1.1 Define valuation objectiveWRI and WOTR worked together to define the valuation objective: compare the marginal costs and benefits of a WSD project over and above a business-as-usual scenario to determine if WSD provides greater economic benefits. As WOTR’s projects are rooted in regenerating degraded ecosystems to improve the supply of ecosystem services (e.g. agricultural production, biodiversity), we aimed to get a better sense of both market and non-market ben-efits of the project. Kumbharwadi watershed was selected because it had at least ten years’ worth of data and three data points to construct benefit and cost estimates. Our analysis period was set to fifteen years: from the project initiation year in 1998 through 2012.
2.1.2 Identify and estimate costsTo estimate total project cost it is important to consider not only costs incurred by the PIA, but also other invest-ments made, including government grants and subsidies. The total cost of the project should include staff time and capital for capacity building, technical, ecosystem-based, and social interventions, and O&M costs covered by grant funding.26 For Kumbharwadi, capacity building costs were $13,251 and covered staffing, training, and capital costs for efforts undertaken during the 18-month capacity-building phase.
To support the maintenance fund, WOTR contributed an amount equal to 50 percent of the shramdan during the capacity building phase or $1,740, and an additional $8,063 during the implementation phase, out of project funds. An additional grant of $3,560 was contributed by NABARD to the maintenance fund. Villagers were also required to contribute 100 rupees per year per household for the first three years of the project, an amount equiva-lent to over $2,000.
Capital costs and additional labor payments for installa-tion of WSD interventions (i.e. equipment and installation costs) were roughly $110,000, and project management costs amounted to roughly $51,300. An additional $3,753 of grant funding was spent on women’s development, namely support for the self-help groups. Operation and Maintenance costs were assumed to be equal to the total
interest earned on the total capital amount through 2012 divided by the total project period 1998–2012, or roughly $659 per year. These O&M costs were assumed to begin after project completion, so were incurred from 2003–2012.
Opportunity costs of WSD projects should be considered in conducting a BCA, such as the opportunity cost of land conversion and lost income from pre-WSD activities including agricultural labor and migratory labor. As land conversion occurred primarily on unproductive wasteland in the Kumbharwadi watershed, we assume no opportu-nity cost of land conversion. To calculate the opportunity costs of lost income we essentially constructed a ‘business-as-usual’ (BAU) scenario to represent benefits and costs that we would have expected to see without WSD inter-ventions. As such, we calculated both the expected income that would have been earned without WSD interventions from agricultural and livestock operations, and that from migratory labor. Based on a literature review of average net agricultural income growth rates for India, we assume that net agricultural and livestock income would have grown at a rate of between 4–24 percent for agriculture and 3.8 percent for livestock (Chand 2006; Mishra and Panda 2006; Otte et al. 2012).27 It is possible that growth rates could be negative but we assume positive growth rates based on general agricultural and livestock produc-tion in India, to be conservative. The opportunity cost (or income foregone) from business-as-usual agricultural and livestock operations ranged from $1.06 to $1.16 million and $0.46 to $0.83 million, respectively.
For migratory income, interviewees stated that on aver-age, one person per household needed to migrate for work, generally six to seven months out of the year, before the WSD project began in 1998. Workers were able to earn between $550 and $850 per year (working six days a week, eight to nine hours a day).28 In total, the value of lost migratory labor income in the period 1998–2012 is between $0.97 and $1.75 million. Migratory income sub-tracts for travel and living expenses.29
Government subsidy data should be considered in cir-cumstances where funding goes beyond what a typical watershed would receive, if it did not receive WSD inter-ventions. In the case of Kumbharwadi, we assume no addi-tional support from subsidies was provided. Overall, the total cost of the WSD project ranged from $2.69 to $3.95 million (for a summary, see Table 5). Table 1 in Appendix 1 presents a summary of unit costs and total costs.

Watershed Development in India: Economic valuation and Adaptation considerations
WORKING PAPER | December 2013 | 13
2.1.3 Identify and estimate benefitsProject benefits were primarily estimated based on data on key indicators for WOTR reports from 1998, 2003, and 2012, and WOTR and Kumbharwadi resident interviews. Additional direct benefits include increased income due to improvements in crop and livestock yields, avoided travel costs for migratory work and fetching drinking water, and avoided government supplied water tankers. While the project also improved fuel wood and fodder supplies, improved nutrition, increased enrollment in education, improved female empowerment, and supported greater community development, we were not able to value these benefits. The project also generated numerous co-benefits including habitat improvement, carbon sequestration from afforestation and reforestation interventions, and enhanced resilience to weather changes. Of these, we were able to value carbon sequestration using a benefits trans-fer approach.
Net annual income from agriculture and livestock increased dramatically between 1998 and 2012.We assumed a linear trend in net income growth based on net agricultural income calculated for project report years 1998, 2002, and 2010–11. Data on livestock and agricultural yields, market prices, and production costs varied across WOTR’s three project reports. As a result, the calculation methods varied for estimating net agricul-tural income. For example, the feasibility report provided detailed data on crop yields by crop type, market prices, and production costs, making calculations easy. However, the project completion and impact assessment reports provided more limited data, reporting only on total annual production by major crop category and number of live-stock. For livestock, the project reports provided data on livestock quantities by animal type and milk yields, but did not provide data on production costs and mar-ket prices. Where market price and production cost data were not available, we reviewed studies from neighboring projects and other WOTR reports, as well as interviews with Kumbharwadi watershed residents to supplement Kumbharwadi’s reports. For example, WOTR had con-ducted a detailed report on livestock in 2012 (Rao and Mathur) which provided production cost and market price estimates, as well as livestock yields for non-milk provid-ing animals. We were also able to determine agricultural market prices based on data from a neighboring village, Sarole Pathar. Appendix 1 provides data from Kumbhar-wadi’s reports along with assumptions and calculations for agricultural and livestock income. Overall, total income earned from agriculture was equal to $6.21 million over
the 15 year project period. Total income from livestock ranged from $2.21 to $3.03 million.
Due to improved groundwater table levels, villagers nei-ther travel to collect drinking water any longer nor rely on government-supplied water tankers. These avoided costs can be counted as a benefit to WSD interventions. To esti-mate avoided costs of supplying water tankers, we inter-viewed Kumbharwadi watershed residents to determine the number of water tankers they received per year from the GOI. Interviews revealed that on average, watershed residents were supplied with 25 to 30 water tankers per year at a cost of roughly $16–26 per tanker. To estimate the avoided costs of travel time, we interviewed a subset of women, as women are generally responsible for fetching drinking water and cooking. We assumed that the oppor-tunity cost of this time is equal to the wage they could have earned through the MNREGS program. Table 6 and Appendix 1 summarize total benefits and parameters used to calculate these benefits.
A co-benefit of the afforestation and reforestation inter-ventions is carbon sequestration (see Table 1 of Appen-dix 1). We estimated the amount of carbon storage using a benefits transfer approach. Mondel et al. (2005) attempted to value carbon sequestration from a project in the state of Gujarat that involved restoration of degraded lands or wasteland. They estimated year-wise quantities of carbon sequestration in tons per hectare. We applied their carbon storage estimates which we assume would be similar to carbon storage potential for Kumbharwadi, as afforestation and reforestation occurred on degraded land. We assumed a linear trend in carbon storage based on their point estimates and multiplied these values by the total area of afforestation/reforestation interventions. Additionally, we multiplied this value by the survival rate of trees planted, which WOTR assumes to be on the order of 50 to 70 percent.30 To determine the economic value of this carbon sequestration, we multiplied total tons of carbon sequestered by the avoided social cost of carbon using estimates from Tol (2007) of roughly $25 per ton of carbon. Overall, we estimate that the social benefits of carbon sequestered through this project from 1998 through 2012 are $1.0 to $1.4 million. We did not include this benefit in the NPV and BCR analysis as this was based on benefits transfer and is highly uncertain – however it is important to point out that forests have greater social value beyond preventing erosion and building soil nutri-ents. Other co-benefits of the WSD project are mentioned in Table 2, but due to data constraints, we are not able to value these benefits.

14 |
2.1.4 uncertainty and sensitivity analysisThere are several sources of data uncertainty in our analy-sis. While we relied primarily on WOTR reports for Kumb-harwadi that are based on direct project monitoring and evaluation, the studies reported on different indicators or were missing data. To fill in data gaps, we referenced project reports from nearby watersheds and conducted interviews with WOTR field staff and Kumbharwadi residents. As a result, there is uncertainty associated with these estimates. This applies mainly to benefits, as there is less uncertainty around capital costs for interventions. To account for uncertainty related to data and our assump-tions, we constructed two scenarios: Scenario 1 whereby costs are maximized and benefits are minimized; and Scenario 2 whereby costs are minimized and benefits are maximized. Appendix 1 shows parameters by scenario.
2.1.5 compare costs and benefits: results and data collection considerationsTo compare costs and benefits, we calculated the NPV of all costs which is equal to total present value costs from 1998 through 2012 subtracted from total present value benefits from 1998 through 2012. All values were adjusted to 2012 US dollar values by first adjusting for inflation using the Consumer Price Index annual average for agri-cultural laborers provided by the Reserve Bank of India. Values were also converted to 2012 US dollars using an average exchange rate for 2012 of US $0.02 per Indian rupee.31We estimate that total present value costs from 1998 through 2012 ranged from $2.69 to $3.95 million. Total present value benefits, excluding the avoided social cost from carbon sequestration, ranged from $9.02 to $10.13 million for the same period. Table 3 and Table 4 summarize components included in the BCA. Additional detail on parameters used to calculate these values is provided in Appendix 1. The NPV of the WSD project in Kumbharwadi ranged from $5.07 to $7.43 million. This equates to benefits of $5,573 to $8,172 per hectare treated or $29,650 to $43,479 per household. Table 7 highlights results from the economic analysis for both scenarios. The benefit-cost ratio ranged from 2.28 to 3.76.
Results indicate that the overall gains for this WSD project are positive in both scenarios. Additionally, benefits were maintained over time, even after the project ended in 2002 when WOTR scaled down its participation. While efforts were made to be conservative with estimates, we note there might be additional costs to the effort that were not included due to difficulty in finding data. These
include potential government subsidies or payments for afforestation and reforestation efforts on public land that supported ecosystem services like reduced soil erosion. Conversely, there are also multiple benefits derived from ecosystem restoration that were not captured in the study but are stated in Table 4.
The process of conducting the BCA highlighted important data collection challenges. For example, the quality of the baseline data is often questionable and more often than not, project completion and impact assessment reports do not report on the same indicators as the baseline reports. Project implementing agencies are often limited in terms of staff time and financial resources, and choose to focus the limited funding on implementing more projects rather than the monitoring and evaluation of projects after their completion. Generally very cursory assessments are carried out, only to fulfill project obligations rather than derive any real lessons from the implementation efforts. This trend is unlikely to change unless such data collections and analyses receive a much higher priority and emphasis from govern-ments and bi-lateral agencies monitoring these grants. If monitoring and data collection efforts are done thoroughly, this data can potentially lead to some very useful insights and lessons being drawn at the time of project completion. A time-series of data at regular intervals could lead to even more useful conclusions with regard to the impacts of the activities, effectiveness of implementation strategies, and also cost-benefit analyses. Palanisami et al. (2009) notes that while PIAs might see more value in implementing more WSD projects, mid-course corrections informed by project evaluations can improve benefits substantially. Data should be collected before the project begins to establish a baseline, and could be followed by data collection mid-way through the project, post project completion, and at regular intervals following completion to ensure benefits are main-tained long-term and unintended negative externalities or consequences are avoided. Such insights would not only be extremely useful for the PIA in evaluating its own perfor-mance, but would also serve as a wealth of data for research and policy interventions. Consistency of data collection is key and it is ideal that data on the same indicators (e.g. crop yields) are collected for each project report to track tends.
Another data collection challenge relates to understand-ing non-market and co-benefits. There are several poten-tial additional benefits not included in the BCA, such as benefits of habitat improvement, improved biodiversity, improved enrolment in education, and improved human health. As we noted earlier, carbon sequestration is also an additional benefit that we estimate could provide an

Watershed Development in India: Economic valuation and Adaptation considerations
WORKING PAPER | December 2013 | 15
income improves from WSD interventions, many farmers are interested in switching to crossbred cattle that have higher milk yields but are more expensive and are not useful for ploughing. However, the long-term benefits and consequences of higher-yielding non-indigenous crop and livestock varieties are not completely understood or well-studied, and could actually lead to negative impacts for villagers. These types of unintended results are referred to as ‘maladaptation’ – programs designed to improve communities’ adaptive capacity to different stressors can actually lead to negative results.
By promoting better data collection and evaluation of WSD projects, an economic valuation as shared above could be expanded to evaluate other considerations including: the distribution of benefits between land-owning and non-landowning classes; addi-tional co-benefits of WSD projects such as biodiver-sity, decreased mortality and morbidity rates due to improved nutrition, and improvements in education; and how to optimize a portfolio of WSD interventions to generate the greatest improvements to human welfare.
Table 5 | Kumbharwadi watershed total project costs 1998–2012
CoSTS ToTAl CoSTS
capacity building phase costs $13,251
maintenance fund costs
NABARD grant $3,559
WOtR contribution $9,804
villager contribution $2,029
Area treatment costs
crop cultivation $31,277
hortipasture $1,582
Grassland with trees $14,116
Aftercare $1,890
Afforestation $33,776
Reforestation $11,507
supervision $4,209
Drainage line treatments
loose boulder $680
check weir $4,832
Rep nala bund $5,700
supervision of rep nala bund $523
Project management costs $51,307
Women’s development costs $3,753
Annual O&m for common structures $6,592
Opportunity costs
migratory labor income – scenario 1 $1,752,408
migratory labor income – scenario 2 $970,083
BAu* agricultural income – scenario 1 $1,163,378
BAu agricultural income – scenario 2 $1,063,064
BAu livestock income – scenario 1 $834,209
BAu livestock income – scenario 2 $459,046
Total Costs – Scenario 1 (1998–2012) $3,950,380
Total Costs – Scenario 2 (1998–2012) $2,692,576
*BAu – Business As usual
Table 6 | Kumbharwadi watershed total project benefits 1998–2012 ($US)
ToTAl bEnEfITS
bEnEfIT SCEnARIo 1 SCEnARIo 2
Net agricultural income $6,208,416 $6,208,1416
Net livestock income $2,218,643 $3,026,056
Avoided travel costs for drinking water $588,261 $882,392
Avoided water tanker costs for drinking water
$5,200 $10,140
ToTAl bEnEfITS $9,020,520 $10,127,004
Table 7 | net present value results (excluding carbon sequestration): 1998–2012 ($US, 2012)
SCEnARIo npV npV pER hoUSEhold
npV pER hECTARE
Scenario 1 (low benefits, high costs)
$5,070,140 $29,650 $5,573
Scenario 2 (high benefits, low costs)
$7,434,951 $43,479 $8,172
additional $1.0 to $1.4 million in social benefits. Valuation methodologies are available to calculate these benefits but better data collection is needed.
Another data collection challenge relates to determining whether perceived benefits in agricultural and livestock income are actually long-term benefits. For example, once

16 |
While we conducted an ex-post analysis, economic valu-ation is also a useful tool for adapting interventions and development strategies over time. As some PIAs are begin-ning to create new programs and projects around climate change adaptation, the next section provides an overview of WOTR’s new climate change adaptation project and provides a discussion of additional data collection and economic valuation considerations for WSD in relation to climate change.
III. ClIMATE ChAngE AdApTATIon ConSIdERATIonS foR EConoMIC VAlUATIonClimate change is expected to impact rainfed arid and semi-arid regions mainly through changes in monsoon rainfall and through temperature changes that impact eco-system service provision. Incomes, which have improved due to WSD, have been shown to be unstable in the face of even mild fluctuations in annual rainfall and tempera-ture fluctuations. For example, in 2012, annual average monsoon rainfall was 12 percent lower across India which could lead to a 12 percent drop in food grain and oilseed production. This is the country’s fourth drought in 12 years (Bajaj 2012). In Maharashtra, it is estimated that the 2012 drought could result in as much as a 50 percent reduction in agricultural income for some farmers (Pallavi et al. 2013). While country- and regional-level modeling of estimated climate change impacts on India has been con-ducted, modeling at the watershed level is difficult because rainfed regions experience localized micro-climates. The IPCC (2007) defines Climate Change Adaptation (CCA) as “initiatives and measures to reduce vulnerability of natural and human systems against actual or expected cli-mate change effects. Various types of adaptation exist, e.g. anticipatory and reactive, private and public, and autono-mous and planned.”
There is a lack of understanding of how restored ecosystems are reducing or increasing costs of contending with climate uncertainty to WSD villages. The most recent version of the GOI’s WSD guidelines neither include guidance on the extent to which WSD interventions should be adjusted, nor on how to design or implement WSD programs to promote resilience and adaptation to climate change. While WSD projects finance interventions that arguably build resilience to climate change (e.g. water-budgeting infrastructure such as drip irrigation), organizations like WOTR are begin-ning to undertake additional measures to address climate
change. WOTR is one of the first WSD implementing orga-nizations in India to develop a CCA strategy.
3.1 WoTR’s Climate Change Adaptation projectRecent anecdotal evidence suggests that many of WOTR’s WSD projects have been able to withstand impacts of drought, changes in monsoon rainfall, erratic precipita-tion, and unusual temperature extremes changes better than watersheds not using a participatory, ecosystem-based approach (Nair 2013). However, recent and pro-jected climatic trends might decrease the benefits that communities receive from these programs. Moreover, there is a chance that these programs could increase their vulnerability because they present a development pathway that depends heavily on water availability.32 As a result, between 2005 and 2008, WOTR began reorienting its strategy, approach, focus, interventions, and measurable indicators, in order to better equip poor communities to adapt to climate change. Through internal evaluations as well as active engagement with stakeholders, WOTR set forth six new strategic objectives:
1. Enhance the capacities of vulnerable communities to adapt to climate change and mitigate its impacts with a view to reducing poverty and improving wellbeing on a sustainable and equitable basis.
2. Implement interventions that not only contribute to climate change adaptation but also contribute to drudgery reduction, hardship mitigation, and reduc-tion of the carbon footprint.
3. Ensure adaptive measures are replicable and scalable to facilitate widespread adoption and implementation in rural and urban areas.
4. Develop appropriate tool kits as well as indicators that catalyze adaptive behavior as well as track prog-ress and impacts of activities.
5. Generate, capture, archive, analyze, and disseminate experiential knowledge, best practices, and processes that are implementation-focused and oriented towards large-scale replication, up-scaling, and sustainability.
6. Engage with the policy-makers to create an enabling institutional framework that incentivizes adaptive and ameliorative behavior.

Watershed Development in India: Economic valuation and Adaptation considerations
WORKING PAPER | December 2013 | 17
To address these objectives, WOTR developed a CCA project, which became active in 2009, with support from the Swiss Agency for Development and Cooperation (SDC) and NAB-ARD. The CCA project included a new suite of interventions that would be tested in 25 villages (see Table 6). The project was first based in the Akole and Sangamner talukas (blocks) of the Ahmednagar district of Maharashtra state. These areas represent different agro-ecological and climatic zones and are culturally and ethnically diverse. These areas also repre-sent the bulk of vulnerable and poor communities in rainfed agrarian India. The experience gained, insights acquired, and lessons drawn from this project would thus have widespread relevance and applicability. In 2011, the project was extended to 24 more villages in different agro-ecological zones in the states of Maharashtra, Madhya Pradesh, and Andhra Pradesh where WOTR has been active for many years. The objective of extending the project was not only to bring the benefits of the adaptation measures to vulnerable communi-ties in other states in the country as well, but also test the
replicability and scalability of the interventions. The project is expected to extend up to mid-2014.The locations of the 49 CCA projects are presented in Figure 2.
CCA interventions were chosen in consultation with WOTR’s project partners – SDC and NABARD – as well as with its knowledge partners – Indian Meteorologi-cal Department, the World Agroforestry Centre, Central Research Institute for Dryland Agriculture (CRIDA), and the Mahatma Phule Krishi Vidyapeeth (MPKV).
Table 8 provides an overview of WOTR’s CCA interven-tions and their potential market and non-market benefits. Out of the 25 villages first selected, 15 had had no previous WSD interventions, so WOTR also implemented typical area, social, and technical interventions including drain-age line interventions, soil and water conservation mea-sures, and self-help groups.
Figure 2 | Watershed organisation Trust Climate Change Adaptation project locations
madhya Pradesh
Total Villages : 49districts/blocks : 5/7Area (ha) : 30,106population : 46,915
Niwas taluka mandla District total villages: 8 Area: 2,859 ha.
tallakondapally taluka mehboobnagar District total villages: 3 Area: 2,290 ha.
Atmaur taluka Kurnool District total villages: 3 Area: 2,041 ha.
Akole, sangamner taluka Ahmednar District total villages: 25 Area: 18,514 ha.
Aurangabad, Paithan taluka Aurangabad District total villages: 10 Area: 4,402 ha.
maharashtra
Andhra Pradesh
Project Blocks
Project DistrictsProject states

18 |
Table 8 | CCA interventions
CCA InTERVEnTIon CoMponEnTS poTEnTIAl MARKET bEnEfIT poTEnTIAl non-MARKET bEnEfIT
Agro-meteorology – WOtR partnered with the Indian meteorological Depart-ment to install automated weather stations to provide farmers with frequent weather and crop advisories to enable them to bet-ter plan and manage their operations.
Automated weather stations local and crop-specific
weather advisories based on the weather predictions training of youth to
read data and display it on daily weather information boards
Improved crop yields (or reduced loss in crop yields due to climatic events) due to reduced pest infestations
Improved community knowledge of weather and other crop risks (e.g. pests)
Sustainable Climate Smart Ag-riculture – A variety of interventions designed to increase adaptive capacities of farmers by expanding on traditional WsD agriculture interventions through training, crop diversification, and crop intensification.
sustainable agriculture demonstrations Exposure visits training courses
Increased agricultural produc-tivity and decrease in input costs Reduced crop losses due to
agricultural diversification Reduced production costs for
agriculture
Improved farmer knowledge and skills development Improved biodiversity Reduced pollution due to reduced
fertilizer and chemical runoff
Water budgeting – A variety of inter-ventions designed to reduce overall water usage through small-scale irrigation and matching of water availability with crop-livestock-systems.
small-scale or micro- irrigation Water balance studies training courses
Improved crop yields Avoided cost of water capture
and need for water tankers
Improved farmer knowledge and skill development Reduced pollution due to reduced
fertilizer and chemical runoff Avoided travel costs for drinking
water
biodiversity – A variety of interventions designed to improve ecosystem health, increase residents’ awareness of local flora and fauna for provision of ecosys-tem services (e.g. food, water, energy, and health), and facilitate protection of indigenous and local rights.
Biodiversity registers and participatory map-ping Biodiversity awareness
festivals Biodiversity committee
formation and training courses
Increased income from sale of indigenous seeds, plant material, and medicines Improved agricultural yields
due to increase in pollination and natural pest and disease control services
Improved traditional knowledge base of local flora and fauna Improved public health/nutrition
disaster risk reduction – Designed to build the capacity of watershed resi-dents to better plan for, mobilize for, and respond to disasters.
Awareness campaigns village sensitization to
motivate preparation of disaster management plans
Avoided costs of post-disas-ter management Avoided costs of crop and
livestock losses during disasters
Improved capacity to adapt and respond to shocks Improved public health
Renewable energy – solar energy technologies for households, farming, and streetlights
solar hot water chulahs solar street lights solar water pumps
Reduced fuel wood for cooking Reduced use of fossil fuel
sources Employment generation for
managing local energy and service centers
Improved public health due to reduced indoor air pollution Avoided carbon emissions from
reduced fuel wood burning Avoided travel time for finding fuel
wood Avoided time spent pumping water and
cooking with fuel wood
livelihood diversification – A variety of interventions designed to provide alter-native income sources beyond agriculture and livestock that are more climate-resilient
Formation of farmer producer companies Off-farm livelihoods
including honey harvest-ing, marketing of rice, and oilseed processing Rural tourism
Improved income due to increased employment opportunities
Improved habitat as ecosystem preservation and protection is emphasized Diversified risk as the new livelihoods
are less sensitive to climatic factors Improved traditional knowledge base
of local flora and fauna

Watershed Development in India: Economic valuation and Adaptation considerations
WORKING PAPER | December 2013 | 19
CCA InTERVEnTIon CoMponEnTS poTEnTIAl MARKET bEnEfIT poTEnTIAl non-MARKET bEnEfIT
livestock – A variety of interventions designed to revise farmers’ focus on livestock to concentrate on indigenous species and training in local veterinary services.
Backyard poultry training of para-vets Fodder cultivation
demonstrations Development of
education materials on benefits of indigenous crops and livestock
Improved livestock income Avoided cost of veterinary
services Improved employment op-
portunities for women
Improved education and knowledge of livestock Improved public health and nutrition Female empowerment
healthy attractive villages – A vari-ety of interventions designed to reduce/ better manage waste generated in the village and in the process beautify the village and improve the quality of life, health, and hygiene in the village.
vermi-composting Kitchen gardens Bins for non-biodegrad-
able waste
Avoided fertilizer purchases Improved vegetable production
for consumption purposes Reduced nutrient and chemi-
cal runoff from non-organic fertilizers
Reduced pollution of water due to reduced fertilizer and chemical runoff Improved public health and education
Table 8 | CCA interventions (Cont.)
Given the difficulties in encouraging villagers to adopt new practices, WOTR focuses on promoting community accep-tance and feedback to implement CCA interventions. Com-munity acceptance is promoted through training and edu-cation of community members on the tangible benefits (e.g. reduced drudgery, improved yield of crops, access to water for irrigation and domestic uses, and firewood availability) and user-friendliness of the methodologies and practices.
To supplement its CCA methodology, WOTR is developing a suite of participatory tools and methodologies. It has developed the Community Driven Vulnerability Evalua-tion – Programme Designer (CoDriVE-PD), for adaptation planning which focuses on incorporating climate vulner-ability into project design and implementation. CoDriVE-PD is a qualitative tool informed by surveys with com-munity members to assess the status and risks of climate change to five types of capital: natural, physical, social, human, and financial. CoDriVE-PD aims to gauge how WSD and CCA interventions are contributing to climate change vulnerability reduction and inform which interven-tions are implemented and how. As climate data is lacking in these regions, the tool will also provide information on historic and current climate trends which could inform an economic valuation.
Another tool that has been developed by WOTR is the CoDriVE – Visual Integrator. This tool engages communi-ties to work together to create a 3-D scaled relief model of their environmental space (using enlarged toposheets) complete with relevant relief and landscape features, water bodies, land uses, biodiversity, likely hazards, etc.
It enables them to plan for resource conservation, risk reduction, disaster management, and adaptive sustain-able development on a continued basis. Apart from these tools, methodologies for establishing local bio-diversity registers, disaster risk reduction, and a tool for assessment of vulnerability of resources critical for livelihoods are also being developed.
3.2 Economic Valuation and CCAOverall, WOTR plans to use the CCA project and the CoDriVE-PD to design more effective implementation strategies and to collect data for outreach and evaluation. As new interventions aimed at promoting adaptation to climate change and new programs are developed, PIAs and other WSD stakeholders can begin building better and more consistent data collection strategies into an economic valuation framework. There is now opportunity to aid PIAs in constructing a data collection strategy to ensure evaluations include economic data that can help them to better tailor their CCA approaches to address both near and long term risks.
Agencies like the International Institute for Environment and Development and the World Bank, which support WSD in India, now offer guidance on conducting eco-nomic analysis of adaptation projects. Chambwera et al. (2012) state, “Economic analysis is an integral part of adaptation research, planning and action, rather than a stand-alone activity.” A recent report by the World Bank (2010b) states, “Experience with climate events to date and past coping measures hold valuable lessons for the

20 |
future; but future adaptation requires new knowledge and improved access to information – otherwise the risk of adopting maladaptive actions that perpetuate vulnerability in the long-term is high. Most actions taken by vulnerable groups today are only short-term coping mechanisms; attention to long-term adaptation is generally weak.”
However, economic valuation of a CCA project could present additional challenges if the objective is to fore-cast costs and benefit of CCA interventions. One reason is that benefits and costs must be estimated for the future using scenarios of projected futures; historic data can-not be used to draw trends. Additionally, it is necessary to get some sense of climate stressors and how interven-tions can either lessen the impact of these stressors or mitigate them. Based on the methodology presented by Chambwera et al. (2012) for conducting an economic valuation of climate change adaptation projects, a basic economic valuation could build upon that from Section III using the following steps and considerations:
1. Define valuation objective: We assume here that the valuation objective is meant to understand the social costs and benefits of a CCA initiative and to maximize social welfare. Valuation efforts then should support the development of CCA interventions or a portfolio of interventions to help build resilience to climate change and to maximize social welfare.
2. Develop scenarios of hypothetical futures of climate impacts: To understand how the project will address climate change, it will be necessary to understand possible climate stressors in the future. Climate modeling can be difficult and costly for WSD imple-menting agencies. A key step in economic valuation of climate change adaptation projects will thus be building a stakeholder group that includes watershed residents or beneficiaries of WSD and CCA projects and implementing agency staff, in order to determine how they expect climate change to impact the project. Researchers can also engage academics, climate mod-elers, and other relevant experts to inform an analysis on how climate risks might impact a rainfed water-shed. This provides researchers with a less expensive alternative to climate modeling, by leveraging existing relationships with watershed residents, implement-ing agencies, and others. However, this method may be less robust than using climate models. Using a tool like WOTR’s CoDriVE-PD or simply through inter-view or surveys of villages, researchers can gain an understanding of the climate risks villagers faced over
the past few decades as well as the current climate risks they are facing on the project. Researchers can extrapolate this data to gather conclusions on near-term climate risks. There are multiple challenges in estimating long-term climate risks in these areas, but using regional or national climate modeling results combined with iterative surveys and/or interviews with watershed residents and implementing agency staff, researchers can improve climate predictions and estimated impacts on rainfed watersheds.
3. Identify and estimate project costs and benefits of the adaptation strategy: As with the BCA presented in Section III, researchers conducting an economic valuation should determine the total project costs and benefits, including both market and non-market benefits. In a recent report, the World Bank (2010a) stated, ‘Co-benefits of adaptation investments also need to be considered in the economic analysis. For example, improved agricultural land management practices to prepare for climate change can also lead to reduced erosion/siltation and carbon sequestra-tion.’ Researchers can leverage relationships with WSD stakeholders to work through identification of costs and benefits and collect this data. Addition-ally, as CCA interventions are likely to build on WSD interventions, researchers can use this is an oppor-tunity to do a more complete job of estimating costs and benefits and filling in data gaps. Where data is not available for the study site, researchers can use a benefits transfer approach to estimate non-market or co-benefits. Additionally, costs and benefits should be measured iteratively as some benefits take multiple years to accrue as they are dependent on rejuvenating ecosystems.
4. Conduct uncertainty/sensitivity analysis by devel-oping scenarios of climate impacts and changing the timeline based on interviews with stakehold-ers: Given the uncertainty in collecting data through surveys and in predicting climate forecasting and impacts on capital, it is important to develop dif-ferent scenarios. With our CBA, we varied both the estimated costs and benefits using a low and high range. For an economic valuation of a CCA project, it might be necessary to develop additional scenarios to reflect possible realities in terms of near-term climate impacts. If resources are available, analysts can use probabilistic modeling (e.g. Monte Carlo analysis) to test sensitivity of parameters.

Watershed Development in India: Economic valuation and Adaptation considerations
WORKING PAPER | December 2013 | 21
5. Compare costs and benefits: To compare costs and benefits for scenarios of hypothetical futures, indicators like net present value and benefit-cost ratio can be quantified by discounting projected costs and benefits to the present value. Depending on the amount of perceived uncertainty in climate modeling, it might be necessary to consider conduct-ing a valuation on the order of 10–20 years past the project start date. Choice of discount rate can be difficult, but it is a common approach to vary the discount rate as part of a sensitivity analysis (World Bank 2010a).
IV. dISCUSSIon And RESUlTSThis paper reviews experience with economic valuation of WSD projects and highlights data collection needs and challenges in relation to economic analysis and climate change. Challenges are highlighted through a benefit-cost analysis (BCA) of a WOTR-implemented project in the Kumbharwadi watershed and an overview of WOTR’s Climate Change Adaptation Project.
Results from a BCA that looked at the marginal ben-efits of WSD for the Kumbharwadi watershed indicate a successful investment. We considered both market and non-market benefits of WOTR’s suite of interventions over a 15-year time frame. Two scenarios were constructed to account for uncertainty in estimates. We estimate that total present value costs from 1998 through 2012 ranged from $2.69 to $3.95 million. Total present value benefits, excluding the avoided social cost from carbon sequestra-tion, ranged from $9.02 to $10.13 million for the same period. The NPV of the WSD project in Kumbharwadi ranged from $5.07 to $7.43 million, which equates to ben-efits of $5,573 to $8,172 per hectare treated or $29,650 to $43,479 for each of Kumbharwadi’s 171 households. The benefit-cost ratio ranged from 2.28 to 3.76.
The analysis was useful in identifying data collection chal-lenges for economic valuations of WSD projects, including:
Lack of consistency in data reporting for social, environmental, and economic indicators of WSD projects due to a lack of funding to support monitor-ing and evaluation activities by implementing agen-cies and a lack of knowledge of which data to collect to support economic valuation.
Lack of consistency in data collection as project impact assessments are often completed by different
research agencies and as a result, PIAs tend to regard the challenges of deriving meaningful results from WSD project data as an external problem.
Lack of acknowledgment of non-market and co-benefits that can help generate greater aware-ness of ecosystem services and societal benefits, as well as provide a broader picture of WSD impacts.
Lack of post-project impact assessments that can help determine whether perceived benefits are actually long-term benefits that contribute to resil-ience to drought and other factors.
While we were able to construct a BCA using WOTR’s reports and interviews with stakeholders, there are still several questions that need to be asked to determine the project’s overall effectiveness. Many of these were beyond the scope of this analysis but we consider these to be important next steps for expanding economic valuation to assess overall project effectiveness. Example questions include: How are benefits distributed between households, genders, and land-owning classes? Could there be a more optimal combination of interventions that would have resulted in greater income and welfare gains? Are there any negative impacts or maladaptations from WSD due to changes in, e.g. hydrogeological regimes? How does each individual intervention contribute to improvements in soil health, water quantity, and human welfare? How do government subsidy payments impact WSD?
Economic valuation is a useful tool that should be incor-porated into evaluations of WSD projects by government agencies and other PIAs. However, with the multitude of government incentive programs, implementing agencies, and support actors, data about WSD projects appear to be inconsistent and not conducive to answering complicated questions without site-specific surveys. Both government and third party actors like WOTR can begin reconsider-ing their data collection, monitoring, and evaluation procedures. Below we provide some final thoughts on the importance of economic valuation to the future of WSD, and considerations for improving and promoting eco-nomic valuation, especially in light of climate change.
Economic valuation, like WSD projects them-selves, should leverage the participatory process for data collection. For multiple reasons, data collection can be difficult for PIAs and research-ers conducting valuations. For example, the majority of PIA staff and funding resources are generally spent

22 |
on project implementation and improving welfare conditions immediately. Researchers, PIAs, and others interested in economic valuation should leverage the power of participatory programs to integrate villager and local knowledge into valuations and data collec-tion. In most cases, climate modeling is too expensive and too inaccurate, so implementing and government agencies are operating with poor knowledge of how changes to monsoon rainfall and temperature patterns will impact small watersheds. As a result, local knowl-edge is vital to understand how climate is impacting physical, social, and natural capital. WOTR’s CoDriVE-PD is an example of a useful qualitative research tool that can help those conducting valuations to under-stand possible climate risks and expected impacts on capital. In their 2013 report on adaptation and water projects, IIED found, “The feasibility and sustainability of any adaptation project or policy will not only depend on the net difference between aggregate costs and benefits, but also on how they are distributed between stakeholders, and on stakeholders’ willingness to be involved in the initiative. This is why a focus on stake-holders can deepen and enrich traditional economic approaches such as CBA.”
WSD valuations should consider how benefits are distributed among the economic and/or landowning classes, and genders. As poverty reduction is a stated goal by the GOI for its WSD pro-grams, it is important that valuations consider not only total benefits but how benefits are distributed. Addi-tionally, building an understanding of who benefits, and by how much, is needed to determine the level of villager dependence on, and vulnerability to, changes in ecosystem service provision (Naber et al. 2008). Distributional analysis can be captured through BCA by dividing beneficiaries according to classes of land own-ership or some other descriptor (e.g. gender or caste).
Economic valuations should consider market, non-market, and co-benefits of WSD projects. WSD projects are rooted in ecosystem restoration for the provision of ecosystem goods and services like crop production, water supply, erosion control, and many others. As these goods and services support human welfare and livelihoods in rainfed regions, and therefore support WSD goals, it is important that they are represented in project evaluations. Given two WSD interventions that might produce the same marketable benefit (e.g. improvement in crop yield),
if one provides greater environmental and/or social benefits, that intervention should be ranked higher. There are multiple valuation techniques available to capture these benefits, which rely on surveys of ben-eficiaries/stakeholders, developing proxy markets, and literature reviews to capture results reported in other sites.
Economic valuations can provide informa-tion for developing CCA interventions and strategies. Economic valuation can be useful for evaluating the effectiveness of CCA strategies and can be repeated at different intervals to help imple-menting agencies readjust their strategy if needed, or strengthen certain interventions. As a result, eco-nomic valuation can not only help create CCA strate-gies with limited climate forecasting knowledge, it can also help prevent maladaptation. Agriculture and livestock are specific areas of concern as increased income can lead to villagers relying on crossbred crops and livestock. While initially crossbred variet-ies improve income, to fully understand the benefits of WSD it is necessary, however, to understand whether there are any negative costs associated with farmers’ switching to these varieties that could decrease their resilience to climate change. Addition-ally, economic valuation can build interest in, and reinforce the rationale for, investing in strategies that increase agricultural production sustainably, restore ecosystem services, and build resilience to climate change.
Guidance is needed from WD funders and researchers to help WSD implementing agen-cies standardize data collection processes and reporting protocols. Most implementing agencies like WOTR already have data collection and report-ing protocols in place, but the robustness of this data varies based on time and resource constraints, as does knowledge of what is needed to conduct an economic valuation. Project implementing agen-cies like WOTR, which focus their efforts on putting interventions into place on-the-ground, can lever-age their field staff and watershed residents to help collect this data but need support and guidance on data collection and reporting. Guidance is specifically needed on which indicators are needed to conduct a robust economic analysis, how to calculate the rate of return for a given WSD intervention and how to optimize interventions to return the greatest utility to

Watershed Development in India: Economic valuation and Adaptation considerations
WORKING PAPER | December 2013 | 23
watershed villages, and how data should be reported. Entities that traditionally fund WSD, like the GOI and bi-lateral donors, can be instrumental in assisting with data collection efforts by providing guidance on data collection strategies and needs, and providing more support for ground-truthing surveys that look at impacts of specific interventions on crop yields, ground water levels, and distribution of wealth.
While BCA is not the only decision-making tool that is helpful, we hope this paper shows the importance of better data collection and coordination efforts. Overall, valuation efforts can lead to better decision-making and planning, increased awareness of ecosystem services,
and better distribution of benefits so that welfare con-tinues to improve for rural populations living in rainfed regions. In turn, valuation can help not only to address challenges that have halted progress for WSD in India, such as fragmentation of WSD programs, policies, and guidelines, but also help to build resilience to climate change.
Over time, WRI and WOTR hope to build upon this initial effort to conduct a valuation of a single watershed and review WOTR’s CCA strategy, to evaluate additional watersheds across the six states in which WOTR works and provide more strategic guidance on data collection and valuation.

24 |
bIblIogRAphYAhmad, J., Alam, D., haseen, s., 2011. ‘Impact of climate change on agriculture and food security in India’. International Journal of Agriculture, Environment and Biotechnology. vol. 4 (2): 129–137.
Bajaj, v., 2012. ‘Drought in India devastates crops and farmers‘. New York times. Retrieved from http://www.nytimes.com/2012/09/04/business/global/drought-in-india-devastates-crops-and-farmers.html?pagewanted=all on June 2, 2013.
Bhandari, P.m., Bhadwal, s., Kelkar, u., 2007. ‘Examining adaptation and mitigation opportunities in the context of the integrated watershed manage-ment programme of the Government of India’. mitigation and Adaptation strategies for Global change. vol. 12: 919–933.
Brooks, N., Anderson, s., Ayers, J., Burton, I., tellam, I., 2011. ‘tracking adaptation and measuring development’. IIED climate change Working Paper No. 1. November 2011.
chambwera, m., Baulcomb, c., lunduka, R., de Bresser, l., chaudhury, A., Wright, h., loga, D., and Dhakal, A., 2012. ‘stakeholder-focused cost benefit analysis in the water sector: A guidance report’. International Institute for Environment and Development (IIED), london, uK.
chand, R., 2006. ‘Growth in farm incomes and future prospects’. National centre for Agricultural Economics and Policy Research, Pusa, New Delhi. Retrieved from http://www.faidelhi.org/training%20programme/BF-April-06/Growth%20in%20Farm%20Incomes%20-%20Ramesh%20chand.pdf on February 13, 2013.
chatuverdi, v., 2004. ‘cost benefit analysis of watershed development: An exploratory study in Gujarat’. Research Report. Development support centre. Bopal, Ahmedabad.
Department of Agriculture and cooperation, 2012. National Watershed De-velopment Project for Rainfed Areas. ministry of Agriculture, GOI. Retrieved from: http://agricoop.nic.in/dacdivision/NWDPRA.pdf on January 2, 2013
Department of land Resources, 2013. Watershed management Programme. ministry of Rural Development, GOI. Retrieved from http://rural.nic.in/sites/downloads/our-schemes-glance/salientFeaturesIWmP.pdf on may 2, 2013.
Department of land Resources, 2012. ‘Guidelines for Watershed Develop-ment’ (Revised 2001). ministry of Rural Development, GOI. Retrieved from http://dolr.nic.in/dolr/guidewd.asp on January 2, 2013.
Department of land Resources, 2006. ‘From hariyali to Neeranchal: Report of the technical committee on Watershed Programmes in India’. ministry of Rural Development, GOI. Retrieved from http://www.indiawaterportal.org/sites/indiawaterportal.org/files/Parthasarathycommittee.pdf on June 10, 2013.
Department of land Resources, 2003. Guidelines for hariyali (2003). min-istry of Rural Development, GOI. Retrieved from http://dolr.nic.in/hariyal-iguidelines.htm.
Department of Rural Development, 2013. Integrated Watershed Development Programme. Government of India. Retrieved from http://www.rd.ap.gov.in/RtI_act/PDF%27s/RD_RtI_IWDP.pdf on January 2, 2013
Forests and Environment Department, 2013. Integrated Afforestation & Eco Development Project. Government of India. Retrieved from http://gujenvfor.gswan.gov.in/currentschemes/css-eco-develop-project-objectives-scheme.htm#objective on January 2, 2013.
Government of India, 2011. ‘common Guidelines for Watershed Development Projects – 2008’ (Revised edition 2011). National Rainfed Area Authority, Planning commission. New Delhi, India.
Intergovernmental Panel on climate change, 2007. ‘climate change 2007: Working Group III: mitigation of climate change’. IPcc Fourth Assessment Report: climate change 2007. Retrieved from http://www.ipcc.ch/publica-tions_and_data/ar4/wg3/en/annex1-ensglossary-a-d.html on may 29, 2013.
Joshi, P.K., Jha, A.K., Wani, s.P., Joshi, l., shiyani, R.l., 2005. ‘meta-analysis to assess impact of watershed program and people’s participa-tion’. comprehensive Assessment Research Report 8. colombo, sri lanka: comprehensive Assessment secretariat.
Kale, G., manekar, v.l., Porey, P.D., 2012. ‘Watershed development project justification by economic evaluation: a case study of Kachhighati Watershed in Aurangabad District, maharashtra’. Ish Journal of hydraulic Engineering. vol. 18 (2): 101–111.
Kerr, J., Pangare, G., Pangare, v.l., 2002. ‘Watershed development proj-ects in India: An evaluation’. International Food Policy Research Institute, Research Report 127. Washington Dc. Retrieved from: http://www.ifpri.org/sites/default/files/pubs/pubs/abstract/127/rr127.pdf on January 10, 2013.
Kuppannan, P., and suresh Kumar, D., 2009. ‘Impacts of watershed develop-ment programmes: experiences and evidences from tamil Nadu’. Agricultural Economics Research Review. 22, 387–396.
mani, R., 2009. the Parthasarathy committee report by technical commit-tee on watershed programmes in India (2006). Retrieved from http://www.indiawaterportal.org/articles/parthasarathy-committee-report-technical-committee-watershed-programmes-india-2006 on June 29, 2013.
ministry of Rural Development, 2013. the mahatma Gandhi National Rural Employment Guarantee Act. Retrieved from http://nrega.nic.in/ on may 20, 2013.
mishra, s., Panda, m., 2006. ‘Growth and poverty in maharashtra’. Indira Gandhi Institute of Development Research. mumbai, India. Retrieved from http://www.igidr.ac.in/pdf/publication/WP-2006-001 on February 13, 2013.
Naber, h., lange, G.m., hatziolos, m., 2008. ‘valuation of marine ecosystem services: A gap analysis’. Retrieved from http://www.cbd.int/marine/volun-tary-reports/vr-mc-wb-en.pdf on may 30, 2013.

Watershed Development in India: Economic valuation and Adaptation considerations
WORKING PAPER | December 2013 | 25
Nair, G., 2013. ‘Anna hazare and Popatrao Pawar’s Popatrao anti-drought club has company’. the Financial Express. vol. Iv, No. 11, April 14, 2012. Pune, India.
National Afforestation & Eco-Development Board 2009, ministry of Environment and Forests, 2009. Retrieved from envfor.nic.in/naeb/sch/NAP_glance.doc
National Bank for Agriculture and Rural Development, 2007. the Indo-German Watershed Development Programme, maharashtra. Retrieved from http://www.nabard.org/farm_sector/devp_maha.asp on June 29, 2013.
National Bank for Agriculture and Rural Development, 2006. Watershed Development Fund Guidelines. NABARD Rural Office. mumbai, India.
Otte, J., costales, J., Dijkman, J., Pica-ciamarra, u., Robinson, t., Ahuja, v., ly, c., Roland-holst, D., 2012. ‘livestock sector development for poverty reduction: an economic and policy perspective – livestock’s many virtues’. FAO, Rome.
Palanisami, K., Kumar, D.s., Wani, s.P., Giordano, m., 2009. ‘Evaluation of watershed development programmes in India using economic surplus method’. Agric Econ Res Rev. vol 22, July–December 2009: 197–207.
Pallavi, A., Deshmane, A., 2013. ‘Drought of equity’. Down to Earth, march 31, 2013. Retrieved from http://www.downtoearth.org.in/content/drought-equity on may 28, 2013.
Planning commission, 2012. twelfth Five Year Plan (2012–2017): Faster, more inclusive and sustainable growth. Government of India.Retrieved from http://planningcommission.gov.in/plans/planrel/12thplan/pdf/vol_1.pdf on January 2, 2013.
Press Information Bureau, 2005. Desert Development Programme. chapter 21 in Rural Development. Government of India. Retrieved from http://pib.nic.in/archieve/others/2005/nedocuments2005dec/ruraldevdec2005/chapter21.pdf on may 2, 2013.
Reddy, v.R., 2006. ‘Getting the implementation right: can the proposed watershed guidelines help?’ Economic and Political Weekly. vol. 41: 4292-4295.
Rural Development Department, haryana, 2013. Integrated Wasteland Development Programme. Government of India. Retrieved from http://www.haryanarural.gov.in/Detail-Iwdp.html on may 2, 2013.
sahu, s. 2008. ‘cost benefit analysis of participatory natural resource management: A study of watershed development initiative in Indian village’. munich Personal RePEc Archive. Paper no. 17134.
shah, A., 2001. ‘Who benefits from participatory watershed development? lessons from Gujarat’. International Institute for Environment and Develop-ment. Gatekeeper series no. 97.
singh, P., Behera, h.c., singh, A., 2010. ‘Impact and effectiveness of “Watershed Development Programmes” in India’. centre for Rural studies. mussoorie, India.
talberth, J., Gray, E., Yonavjak, l., Gartner, t., 2013. ‘Green versus gray: Nature’s solutions to infrastructure demands’. solutions. vol. 4 (1).
tol, R.s.J., 2007. the social cost of carbon: trends, outliers, and catastrophes. Economics Discussion Papers, No 2007-44, Kiel Institute for the World Economy.
turton, c., Farrington J., 1998. ‘Enhancing rural livelihoods through par-ticipatory watershed development in India’. Overseas Development Institute. Number 34, July 1998.
Watershed Organisation trust, 2012a. Kumbharwadi Watershed Development programme, District Ahmednagar, maharashtra. WOtR, Pune, India.
Watershed Organisation trust, 2012b. ‘Annual Report 2011–12: under the climate lens’. WOtR. Available at: http://www.wotr.org/wp-content/up-loads/2012/11/WOtR-Annual-Report-2011-2012-uploaded.pdf.
Wielgus, J., chadwick-Furman, N.E., Dubinsky, Z., shechter, m., Zeitouni, N., 2002. ‘Dose–response modeling of recreationally important coral-reef attributes: a review and potential application to the economic valuation of damage’. coral Reefs. vol. 21: 253–259.
Wilson, R., Amezaga, J., Gosain, A., Gupta, R., saigal, s., 2006. ‘Policy chal-lenges and recommendations for watershed development in India’. chapter 7 in Proceedings of the Asian Regional Workshop on Watershed management.
World Bank, 2010a. ‘mainstreaming adaptation to climate change in agricul-ture and natural resources management projects: Guidance Note 7’. World Bank climate change team Environmental Department.
World Bank, 2010b. ‘Economics of adaptation to climate change: social synthesis report’. the World Bank, Washington Dc.

26 |
APPENDIx 1: BENEFIt-cOst ANAlYsIs tABlEs
Table 1 | Kumbharwadi WSd Unit Costs ($US 2012)
CoSTS UnITS ToTAl UnITS CoST pER UnIT ($US 2012)
ToTAl CoSTS ($US 2012)
Capacity building phase costs Per month 18 $736 $13,251
Maintenance fund costs
NABARD contribution Per year 1 $3,559 $3,559
Free labor contribution Per year 1 $9,804 $9,804
villager contribution Per year 3 $676 $2,029
Area treatment costs
crop cultivation Per hectare 492.18 $64 $31,277
hortipasture Per hectare 15.6 $101 $1,582
Grassland with trees Per hectare 46.07 $306 $14,116
Aftercare Per hectare 96.05 $20 $1,890
Afforestation Per hectare 77 $439 $33,776
Reforestation Per hectare 141 $82 $11,507
supervision Per year 1 $4,209 $4,209
drainage line treatments
loose boulder Per structure 7 $97 $680
check weir Per structure 1 $4,832 $4,832
Rep nala bund Per structure 2 $2,850 $5,700
supervision of rep nala bund Per year 1 $523 $523
project management costs Per year 1 $51,307 $51,307
Women’s development costs Per year 1 $3,753 $3,754
Annual o&M for common structures Per year 10 $659 $6,592
opportunity costs
migratory labor income – scenario 1 Per year 15 $116,827 $1,752,408
migratory labor income – scenario 2 Per year 15 $64,672 $970,083
BAu agricultural income – scenario 1 Per project period 1 $1,163,378 $1,163,378
BAu agricultural income – scenario 2 Per project period 1 $1,063,064 $1,063,064
BAu livestock income – scenario 1 Per project period 1 $834,209 $834,209
BAu livestock income – scenario 2 Per project period 1 $459,046 $459,046
Total Costs – Scenario 1 – high costs, low benefits (1998–2012) $3,950,380
Total Costs – Scenario 2 – low costs, high benefits (1998–2012) $2,692,576

Watershed Development in India: Economic valuation and Adaptation considerations
WORKING PAPER | December 2013 | 27
Table 2 | Kumbharwadi WSd project benefits
UnITS ToTAl UnITS CoST pER UnIT ToTAl CoST
SCEnARIo 1 SCEnARIo 2 SCEnARIo 1 SCEnARIo 2 SCEnARIo 1 SCEnARIo 2
Net agricultural income1 n/r n/r n/r n/r n/r $6,208,416 $6,208,416
Net livestock income1 n/r n/r n/r n/r n/r $2,218,643 $2,218,643
Avoided travel costs for drinking water hours per year 124,830 187,245 $0.36 $0.36 $588,261 $882,392
Avoided water tanker costs for drinking water
per water tank/year
25 30 $16 $26 $5,200 $10,140
Total benefits $9,020,520 $10,127,004
n/r = not relevant1Agricultural and livestock incomes are calculated annually assuming a linear growth trend between 1998, 2002, and 2013, based on WOtR project report data for Kumbharwadi. see tables 3–5, and 8–11 for additional details. 2Kumbharwadi residents were paid a total of $4,000 during the capacity building phase for labor they contributed to implement interventions.
Table 3 | Scenario 1 parameters
SCEnARIo 1: loW bEnEfITS, hIgh CoSTS
UnIT 1998 2002 2010–11
Agriculture
Baseline annual agricultural income growth rate1 percent 1.56% 1.56% 1.56%
total cropped area hectares 470.77 510.48 565.5
livestock1
Baseline annual livestock income growth rate percent 4% 4% 4%
Indigenous cows (pre-project: 1998) number 159 n/a 45
crossbred cows (pre-project: 1998) number 93 n/a 377
Percent of indigenous cows used for milk percent 45% n/a 100%
milk yield – indigenous cow liter/yr per cow 496 n/a 496
milk yield – crossbred cow liter/yr per cow 1950 n/a 1950
Bullocks (pre-project: 1998) number 182 n/a 106
Bullocks sold per year percent 42% n/a 42%
Goats (pre-project: 1998) number 266 n/a 260
Goats sold per year percent 40% n/a 40%
hens for sale number per household 4 n/a 4
hens for eggs number per household 11 n/a 11
Eggs produced per hen number/hen per year 34 n/a 34
sheep for sale (pre-project: 1998) number 86 n/a 153
lambs produced per year for watershed (pre-project: 1998) number/year 216 n/a 381
Percentage of sheep sold percent 40% n/a 40%
Migration
migratory workers number/household 1 1 1
migratory labor period hours/year 1708 1708 1708
migratory wage rate $/hour 0.50 0.50 0.50

28 |
SCEnARIo 1: loW bEnEfITS, hIgh CoSTS
UnIT 1998 2002 2010–11
Expenses (travel and accommodation) $/person per year 211 211 211
Income from fodder sales $/person per year 40 40 40
Avoided costs of water tankers and collecting drinking water
Water tankers needed tankers/year 25 25 25
Water tanker cost $/tanker 16 16 16
time spent collecting drinking water hrs/household per year 730 730 730
value of time $/hour per person 0.38 0.38 0.38
Carbon storage
Afforestation/reforestation trees planted per hectare 196 n/a n/a
hortipasture trees planted per hectare 770.26 n/a n/a
Grassland trees planted per hectare 587 n/a n/a
survival rate of saplings percent 50% n/a n/a
social cost of carbon $/ton of carbon $30 n/a n/a
N/a = data not available
Table 4 | Scenario 2 parameters
SCEnARIo 2: hIgh bEnEfITS, loW CoSTS
UnIT 1998 2002 2010-11
Agriculture
Baseline annual agricultural income growth rate percent 0.29% 0.29%
total cropped area hectares 470.77 510.48 565.5
livestock
Indigenous cows (pre-project: 1998) number 159 n/a 45
crossbred cows (pre-project: 1998) number 93 n/a 377
Percent of indigenous cows used for milk percent 45% n/a 45%
milk yield - indigenous cow liter/yr per cow 600 n/a 600
milk yield - crossbred cow liter/yr per cow 1950 n/a 1950
Bullocks (pre-project: 1998) number 182 n/a 106
Bullocks sold per year percent 42% n/a 42%
Goats (pre-project: 1998) number 266 n/a 260
Goats sold per year percent 40% n/a 40%
hens for sale number per household 4 n/a 4
hens for eggs number per household 11 n/a 11
Eggs produced per hen number/hen per year 34 n/a 34
sheep for sale (pre-project: 1998) number 86 n/a 153
lambs produced per year for watershed (pre-project: 1998) number/year 216 n/a 381
Percentage of sheep sold percent 40% n/a 40%

Watershed Development in India: Economic valuation and Adaptation considerations
WORKING PAPER | December 2013 | 29
SCEnARIo 2: hIgh bEnEfITS, loW CoSTS
UnIT 1998 2002 2010-11
Migration
migratory workers number/household 1 1 1
migratory labor period hours/year 1708 1708 1708
migratory wage rate $/hour 0.38 0.38 0.38
Expenses (travel and accommodation) $/person per year 211 211 211
Income from fodder sales $/person per year 40 40 40
Avoided costs of water tankers and collecting drinking water
Water tankers needed tankers/year 30 30 30
Water tanker cost $/tanker 26 26 26
time spent collecting drinking water hrs/household per year 1095 1095 1095
value of time $/hour per person 0.38 0.38 0.38
Carbon storage
Afforestation/reforestation trees planted per hectare 196 n/a n/a
hortipasture trees planted per hectare 770.26 n/a n/a
Grassland trees planted per hectare 587 n/a n/a
survival rate of saplings percent 0% n/a n/a
social cost of carbon $/ton of carbon $30 n/a n/a
N/a = data not available
Table 5 | Market prices and production costs ($US 2012)
CATEgoRY UnIT 1998 2010-11
Market prices
milk $/liter $0.14 $0.37
Eggs $/egg $0.08 $0.08
Wool $/kg $0.36 $0.30
hens $/live bird $2.70 $7.50
lamb $/lamb $25.00 $60.00
Adult sheep $/sheep $50.00 $90.00
Goats $/goat $30.00 $55.00
Indigenous cows - scenario 11 $/cow n/a $40.00
Indigenous cows - scenario 21 $/cow n/a $80.00
crossbred cows - scenario 11 $/cow n/a $500.00
crossbred cows - scenario 21 $/cow n/a $800.00
Buffaloes - scenario 1 $/buffalo n/a $500.00
Buffaloes - scenario 2 $/buffalo n/a $600.00
CATEgoRY UnIT 1998 2010-11
Bullocks $/bullock $125.00 $600.00
production costs
sheep
labor $/animal $0.90 $0.90
medicine $/animal $0.60 $0.84
Fodder $/animal $1.08 $1.08
Wool shearing $/animal $0.27 $0.38
transport $/animal $0.36 $0.36
Dairy farming – crossbred
total (scenario 1) $/animal $10.84 $10.84
total (scenario 2) $/animal $204.20 $204.20
Dairy farming - indigenous; goats
Total $/animal $4.00 $4.00
1 Indigenous cows, crossbred cows, and buffaloes were not sold initially, so production costs were not collected for 1998.

30 |
Table 6 | pre-project (1998) agricultural production, costs, and market prices
VARIAblE AREA (hECT-ARES)
CRop YIEld (qUInTAl/hECTARE)
MARKET pRICE($US 2012/qUInTAl)
pRodUCTIon CoSTS ($US 2012/hECTARE)
Kharif – Irrigated
Bajra 48.28 13.07 $11 $90
Kharif – Rainfed
Bajra 219.36 3.02 $10 $24
Groundnut 24.61 4.29 $24 $50
Pulses 22.25 8.74 $24 $109
vegetables 39.38 150 $3 $240
Rabi – Irrigated
Jawar 10.5 6.86 $13 $50
Wheat 57.68 14.54 $13 $90
Rabi – Rainfed
Jawar 38.03 6.32 $12 $40
Bengal gram 7.28 6.52 $25 $92
source: WOtR Project Feasibility Report for Kumbharwadi
Table 7 | post-project (2002) agricultural production, costs, and market prices
AggRE-gATE pRo-dUCTIon ASSESS-MEnT
AREA (hECT-ARES)
CRop pRodUC-TIon (qUIn-TAlS)
MARKET RATE ($US 2012/qUInTAl)
pRodUC-TIon CoSTS 2012 ($US 2012/hECT-ARE)
cereals 409 5310 $13.97 $33.24
Pulses 32 300 $24.53 $22.28
Oil seeds 27 1350 $23.18 $25.88
vegetables 43 39370 $9.26 $0.00
source: WOtR completion report for Kumbharwadi
Table 8 | post project (2010-11) agricultural area and production costs
AggREgATE pRo-dUCTIon ASSESS-MEnT
AREA (hECTARES) pRodUCTIon CoSTS ($US 2012/hECTARE)
cereals 453 $33.24
Pulses 35 $22.28
Oil seeds 30 $25.88
vegetables 47 $19.11
source: WOtR Project Impact Assessment for Kumbharwadi
Table 9 | post-project Report (2010-11) agricultural area, production, and gross income
SEASon AREA UndER CUlTIVATIon
pRodUCTIon In TonS
gRoSS In-CoME
Kharif 185 1244 $103,600
Rabi 280 3759 $388,580
summer 50 1292 $150,518
source: WOtR Project Impact Assessment for Kumbharwadi
Table 10 | Estimated agricultural net income 1998–2012 (Thousands of $US 2012)
1998 1999 2000 2001 2002 2003 2004 2005 2006 2007 2008 2009 2010 2011 2012
BAu agricultural income – scenario 1 $69 $71 $72 $73 $74 $75 $76 $77 $79 $80 $81 $82 $84 $85 $86
BAu agricultural income – scenario 2 $69 $70 $70 $70 $70 $70 $71 $71 $71 $71 $71 $72 $72 $72 $72
WOtR agricultural income – scenarios 1&2 $69 $145 $220 $296 $371 $396 $422 $447 $473 $498 $523 $549 $574 $600 $625
Table 11 | Estimated livestock net income 1998–2012 (Thousands of $US 2012)
1998 1999 2000 2001 2002 2003 2004 2005 2006 2007 2008 2009 2010 2011 2012
BAu livestock income – scenario 1 $42 $44 $46 $47 $49 $51 $53 $55 $57 $59 $61 $64 $66 $69 $71
BAu livestock income – scenario 2 $23 $24 $25 $26 $27 $28 $29 $30 $31 $33 $34 $35 $36 $38 $39
WsD – scenario 1 $23 $41 $59 $77 $94 $112 $130 $148 $166 $184 $201 $219 $237 $255 $273
WsD – scenario 2 $42 $65 $88 $111 $133 $156 $179 $202 $225 $247 $270 $293 $316 $338 $361

Watershed Development in India: Economic valuation and Adaptation considerations
WORKING PAPER | December 2013 | 31
ENDNOtEs1 this calculation is based on average annual funding from 2009-10 through
2011-12 for DPAP, DDP, IWDP, and IWmP, as well as 2012 funding from NABARD, mGNREGs, corporate and bilateral funding. We assume corporate and bilateral funding are equal to roughly five percent of funding from central government schemes.
2 see http://www.wotr.org/wp-content/uploads/2012/12/WOtR-PNP-Practi-tioners-handbook-Final.pdf.
3 Bhandari et al. 2007.4 Press Information Bureau, 2005.5 Department of Rural Development, 2013 and Rural Development Depart-
ment, haryana, 2013.6 Forests and Environment Department, 2013.7 Department of Agriculture and cooperation, 2012. 8 NABARD, 2007.9 turton and Farrington, 1998.10 NABARD, 2006.11 Department of land Resources, 2012.12 National Afforestation & Eco-Development Board 2009.13 Department of land Resources, 2003.14 moRD, 2013.15 mani, 2009.16 GOI, 2011.17 GOI, 2011.18 Department of land Resources, 2013. 19 GOI, 2011.20 Planning commission, 2012. 21 A check dam is a small dam made of loose rock or wood used to control
water flow across a landscape in a channel or canal.22 A nala bund is an embankment constructed across a landscape to slow
the velocity of rainwater and encourage its percolation into groundwater reservoirs.
23 A loose boulder structure is a structure used to store water on the up-
stream-side and to reduce water velocity to reduce soil erosion. structures are made of layers of loose boulders.
24 cropping seasons in India include Rabi, Kharif, and summer crops. Rabi refers to crops sown in winter and harvested in the spring. Kharif refers to crops sown during the monsoon season, starting in June or July and harvested in the winter. crops grown between march and June are summer crops.
25 Evaluation approaches or decision-support tools include, e.g. benefit-cost analysis and cost-effectiveness analysis. Economic valuation is the process of monetizing costs and benefits which can then be compared to evaluate project effectiveness or decide upon the best policy action. cost-effectiveness analysis is useful for comparing different policy or project approaches to determine which will provide the greatest societal benefits at the least cost.
26 It should be noted that Kumbharwadi received financial support from government subsidies. WOtR staff state that subsidies covered some costs for housing, fertilizer, electricity, irrigation, and seeds, equipment, tractors, and diesel pumps. these subsidies are widely used in India, however, and most rural villages receive some support with or without WsD interven-tions. As a result, these costs were not included in the analysis.
27 Based on estimates for average growth in agricultural income and livestock income for rural villages in India and maharashtra, from chand (2006), mishra and Panda (2006) and Otte et al. (2012).
28 Annual income is based on wages earned working as a farm laborer, fodder sales (as employees are often allowed to sell surplus crops to others), and on living and travel expenses employees accrue.
29 the opportunity cost of lost migratory labor income is based on a survey of WOtR field staff and villagers based on their net income earned while working as sugarcane laborers. villagers were also able to earn a small amount of income from fodder sales from sugarcane – this cost is included.
30 Based on interviews with WOtR field staff in Kumbharwadi.31 We found the average monthly exchange rate for all months in 2012 from
us dollars to Indian rupees from www.x-rates.com. We took an average of these values to arrive at us$0.02 per 1 Indian rupee.
32 this is a relatively new concept in adaptation literature. For more informa-tion on tracking and assessing outcomes of adaptation interventions, please see Brooks et al. 2011.

copyright 2013 World Resources Institute. this work is licensed under the creative commons Attribution-Noncommercial-NoDerivative Works 3.0 license. to view a copy of the license, visit http://creativecommons.org/licenses/by-nc-nd/3.0/
chANGE ItWe use our research to influence government policies, business strategies, and civil society action. We test projects with communities, companies, and government agencies to build a strong evidence base. then, we work with partners to deliver change on the ground that alleviates poverty and strength-ens society. We hold ourselves accountable to ensure our outcomes will be bold and enduring.
scAlE ItWe don’t think small. Once tested, we work with partners to adopt and ex-pand our efforts regionally and globally. We engage with decision-makers to carry out our ideas and elevate our impact. We measure success through government and business actions that improve people’s lives and sustain a healthy environment.
ABOut WOtRthe Watershed Organisation trust (WOtR) is a not-for-profit NGO, founded in 1993, operating currently in six Indian states – maharashtra, Andhra Pradesh, madhya Pradesh, Rajasthan, Jharkhand, and Orissa. WOtR is rec-ognized widely as a premier institution in the field of participatory Watershed Development and climate change Adaptation. Its unique strength lies in its ‘on-field’ experience and in a systemic, participatory approach.the WOtR was initiated to support a large-scale multi-actor, multi-level, multi-sectoral, community-led watershed development program for poverty reduction called the Indo-German Watershed Development Program (IGWDP). It was launched in maharashtra, India, by Fr. herman Bacher s.J., co-founder and chairman of WOtR, and crispino lobo, co-founder and managing trustee.
the mandate taken up by WOtR is to reduce poverty through mobilizing the self-help capacities of individuals and communities to regenerate the eco-spaces or watersheds they live in, harvest rainwater wherever it falls, use it productively, undertake sustainable livelihoods, and do whatever else it takes to get them out of poverty.
ABOut thE AuthORsErin Gray, [email protected] (Research Associate, WRI) Arjuna srinidhi, [email protected] (Programme coordinator, WOtR)
10 G street, NE | Washington, Dc 20002 | www.WRI.org
AcKNOWlEDGmENtsthis report would not have been possible without guidance, review, and data from the following people at the Watershed Organisation trust: crispino lobo, marcella D’souza, smita mehetre, harshal Khade, Bhavana Rao, Prashant Kalaskar, Ganesh Rajapure, mihir mathur, Pradnya Ghag, suchita Awasthi, Girish Jathar, and the residents of Kumbharwadi watershed. At WRI, we would like to thank the following staff for their support and review: Robert Winterbottom, heather mcGray, Johan schaar, David tomberlin, John talberth, Ayesha Dinshaw, todd Gartner, and craig hanson. We would also like to thank Dr. Ganesh Kale of the Indian Institute of science, Bangalore, for his review and helpful insights.
ABOut WRIWRI is a global research organization that works closely with leaders to turn big ideas into action to sustain a healthy environment—the foundation of economic opportunity and human well-being.
our ChallengeNatural resources are at the foundation of economic opportunity and human well-being. But today, we are depleting Earth’s resources at rates that are not sustainable, endangering economies and people’s lives. People depend on clean water, fertile land, healthy forests, and a stable climate. livable cities and clean energy are essential for a sustainable planet. We must address these urgent, global challenges this decade.
our VisionWe envision an equitable and prosperous planet driven by the wise manage-ment of natural resources. We aspire to create a world where the actions of government, business, and communities combine to eliminate poverty and sustain the natural environment for all people.
our Approach
cOuNt ItWe start with data. We conduct independent research and draw on the latest technology to develop new insights and recommendations. Our rigorous analysis identifies risks, unveils opportunities, and informs smart strategies. We focus our efforts on influential and emerging economies where the future of sustainability will be determined.