Embed Size (px)
Citation preview

ERE8: Valuation
• Valuation theory • Total economic value• Indirect valuation methods
– Hedonic pricing– Travel cost method
• Direct valuation methods

Last week
• Renewable resources: Fisheries• Growth rates in biological resources• Steady-state harvest
– Perfect market – Open access
• Dynamic harvesting• Policy intervention

Economic Value
• Neo-classical revolution: Value is relative, value measures demand versus supply, value is based on consumption and production
• Basis of valuation: People‘s preferences, what people want
• Values depend on context– Supply, demand– Uncertainty: Something that is uncertain is worth
less, an uncertain loss is worth more– Uniqueness: Something that is unique is worth
more

What to value?• Individuals can derive value from
environmental goods from more sources than direct consumption
• Types of environmental services:– source of materials input: fossil fuel, wood
products, fish, water etc.– life-support services: liveable climatic
regime, breathable atmosphere– amenity services: recreation, wildlife
observation, scenic view, passive use values– sink for the assimilation of wastes

Why Valuation?• We must make choices about how to
manage the human impact on natural systems
• Greater use of a particular environmental service or greater protection of a specific natural system results in less of something else (trade-off)
• To make the most of scarce resources we must compare what is gained from an activity with what is sacrificed by undertaking that activity
• Why? To assess the net impact of changes

Uses of Economic Valuation
• Regulation can either seek optimum or not
• If an optimum is sought, the marginal external cost function must be estimated, and expressed in money
• Find optimum: Marginal benefit equals marginal cost (Cost-Benefit Analysis)– Ex ante, e.g., Pigou tax– Ex post, e.g., evaluation of policy
• Demonstrate value of environment• Extend national accounts

Pollution Damage(billions of US$)
Netherlands
Germany USA*
Air 0.5-0.8 19.3-21.5 21.7
Water 0.1-0.3 3.0 4.8
Noise 0.0 11.6 n.a.
Total 0.6-1.1 33.9 26.5
%GDP 0.3-0.5 2.9 0.8
* Damage avoided

Total economic value• Total economic value = Use value +
Intrinsic value• Total use value = Actual use value +
Option value + Quasi-option value– Option value = Value in potential use by self
+ Value in potential use by others + Value in potential use by future individuals
– Quasi-option value = Value of avoiding irreversibilities in the light of expected future knowledge
• Intrinsic value = Existence value

Existence Value
• Existence value is unrelated to any actual or potential use
• Existence value may be related to sympathy, or stewardship
• Existence value is not right-based, as rights are absolute, and values are relative
• People express, and seem to have existence values

Criterion for Cost-benefit Analysis
• „benefits“ and „costs“ are meaningless without a social welfare function– defines good an bad consequences
• In economics the criterion is the well-being of the members of society
• Well-being is defined as – the individuals‘ preferences and – their max. willingness to pay for gains or
(WTP)– their min. willingness to accept compensation
for losses (WTA)
Measures of changes in Welfare for
an Environmental Good
A
B
C
D E
I1
I2
q0
q1
Y0
Y1
Expenditure on private goods, Y
Quantity/quality of environmental good q
I3

WTP and WTAC• However, people view gains and losses differently• WTP is limited to an individual‘s income, WTAC is
unbounded • Confirmed by empirical studies, but not uncontested• Implies that surveys, policies need to be carefully designed • If an individual has the legal right, WTAC is the appropriate
concept• It can be difficult to determine property rights (public
goods)• Sometimes the current allocation is taken as the legal
entitlement– Improvements = WTP and reductions = WTAC

Direct & Indirect Valuation
• Direct methods (use and non-use values)– Hypothetical/constructed market
• Contingent valuation
• Indirect methods (use values)– Surrogate market
• Hedonic pricing• Travel cost

Hedonic analysis• The method uses a market good within which
the non-market good is implicitly traded• Households are attracted to localities offering
preferred combinations of amenities• The value of a piece of land is related to the
stream of benefits to be derived from the land– Obvious benefits: agricultural output or shelter– In addition: access to commercial amenities, to
environmental facilities, to the workplace and the environmental quality of the neighbourhood
• Given that different locations have varied environmental attributes, this will results in differences in property prices or wage rates
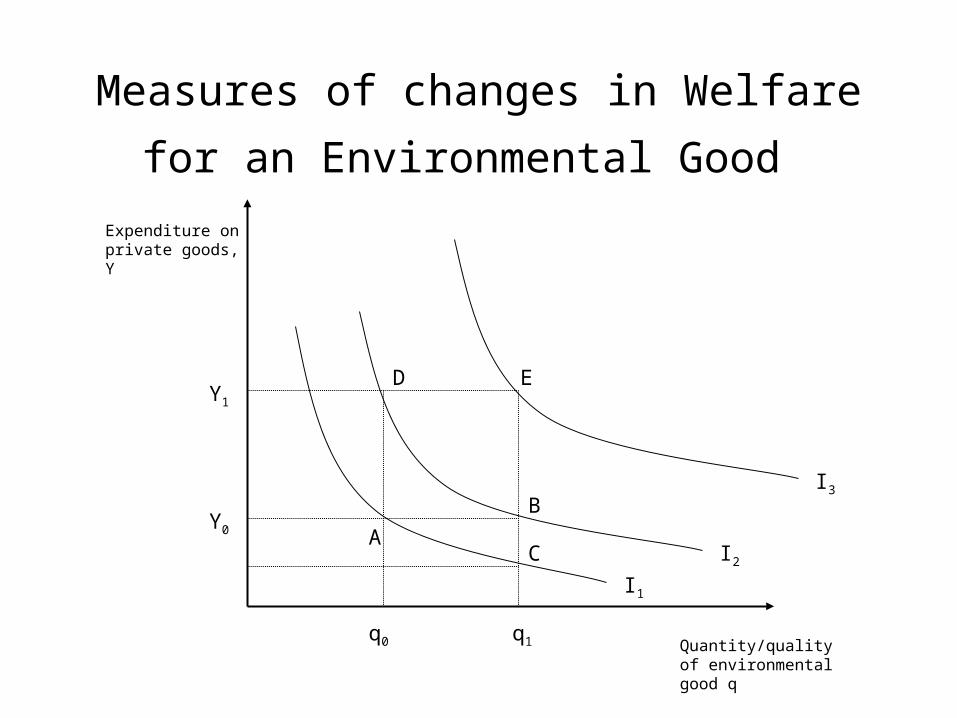
Hedonic analysis (2)
• In order to live in a location with higher levels of an amenity– Households pay higher house prices – Households accept lower wage rates– Cost differences reflect households’ implicit
valuation
• Method tries to find a relationship between variations in house prices or wage rates and variations in factors such as proximity to sites to environmental amenities or disamenities

Hedonic analysis (3)
i i i i(rent/ sqm)=f (p,n,e)
j j j j(wage/ hour) =f (w,em,e )
p=property characteristicsn=neighbourhood characteristicse=environmental characteristicsw=worker characteristicsem=employer characteristicse=environmental characteristics
Step 1: Estimate price differential due to the environment using multiple regression
Step 2: Derive marginal willingness to pay

Drawbacks• Markets are in equilibrium
– Rents and house prices have adjusted such that individuals are indifferent across locations
– Perfect information, no transaction or moving cost
• Assumes that households can buy exactly the amount of dwelling-related characteristics it wants
• The housing market is unified and not segmented
• Data intensive

Travel Cost Model
• Widely used for recreation• Natural areas seldom command a
price in the market• Basic premise: time and travel cost
expenses represent the „price“ of access to the site– WTP to visit the site
• Travel is a complement to recreation

Travel Cost Model – 2
• Application of TCM– Reservoir management, water supply,
wildlife, forests, outdoor recreation etc.
• History: Harold Hotelling 1947– Value of national parks
• Variations of the method– Simple zonal travel cost approach– Individual travel cost approach– Random utility approach

Zonal Travel Cost Approach
• Gives values of the site as a whole• Based on number of visits from
different distances– Travel and time costs increase with
distance– Gives information on „quantities“ and
„prices“– Construct a demand function of the site

Steps• Define a set of zones surrounding the
site• Collect number of visitors from each
zone in a certain period• Calculate visitation rates per population• Calculate round-trip distance and travel
time • Estimate visitors per period and derive
demand function

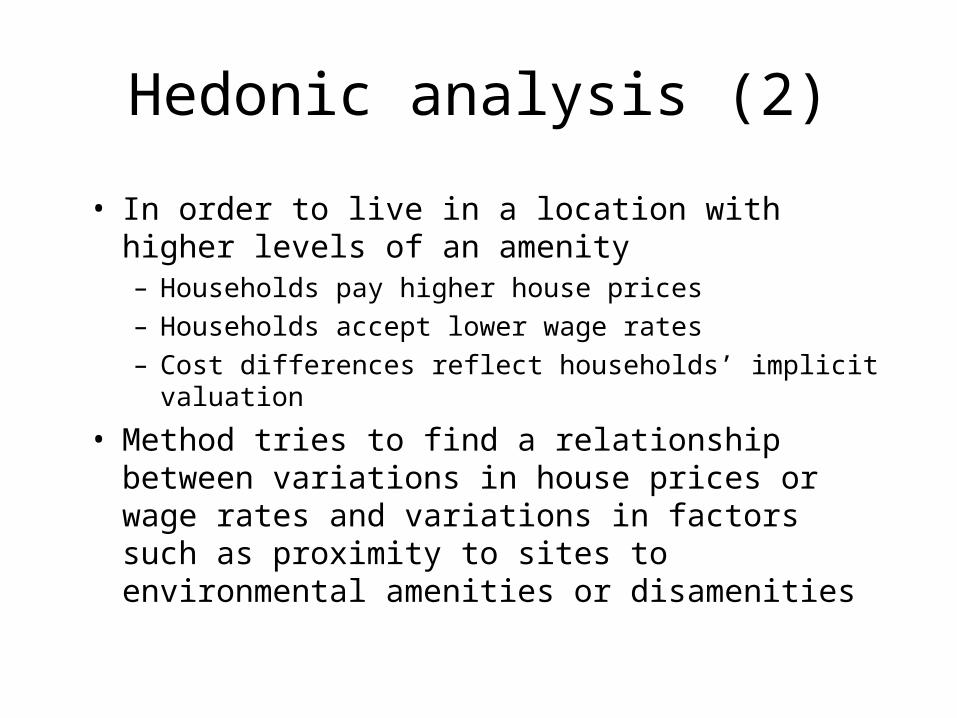
An Example
Zone Visits/Year Population
Visits/1000 Total travel costs
0 400 1000 400 0
1 400 2000 200 10.5
2 400 4000 100 21.0
3 400 8000 50 42.0
Visits/1000 = 300 – 7.755 * Travel Costs

An Entrance Fee of 10 Euro
Zone
Costs Visits/1000 Population
Visits
0 10.0 222 1000 222
1 20.5 141 2000 282
2 31.0 60 4000 240
3 52.0 0 8000 0
Total
744
So now we have two points on our demand curve.
Demand Curve
0
67
1600
744
272
0
5
10
15
20
25
30
35
40
45
Total Visitors
Addit
iona
l Cos
ts/T
rip

Drawbacks• Not data intensive, but a number
of shortcomings• Assumes that all residents in a
zone are the same• Individual data might be used
instead• More expensive• Sample selection bias, only visitors
are included

Other problems• Assumption that people respond to
changes in travel costs the same way they would respond to changes in admission price
• Opportunity cost of time• Single purpose trip • Substitute sites• Unable to look at most interesting policy
questions: changes in quality– Use random utility models instead

Constructed Markets
• Revealed preference methods can only estimate the use value of the environment, and only if that value affects behaviour in a measurable and interpretable manner
• For the rest, we have to use either hypothetical markets or experimental markets (together: constructed)
• Experimental markets have delivered little estimates (but a lot of insights), so the contingent valuation method remains – this is a stated preference method

Contingent Valuation (2)
• Interview people, ask them for their willingness to pay for certain environmental goods and services
• Advantage: Applicable to more than direct use value
• Disadvantages: Hypothetical, people are unfamiliar with the situation, all sorts of biases may occur, interview design is always hard

History• First applications in early 1960s to value outdoor
recreation• 1979 the Water Resource Council recommended CV
as one of 3 methods to determine project benefits• In the mid 1970s the EPA funded a research
program to determine the promise and problems of the method
• The Reagan Executive Order 12291 (1981) – All federal regulations on environmental policy should be
submitted to a Cost-Benefit Analysis
• 1989 governmental decision on legitimacy of non-use values for TEV and equal standing
• 1989 Exxon Valdez oil spill – value loss of non-use values for US citizens
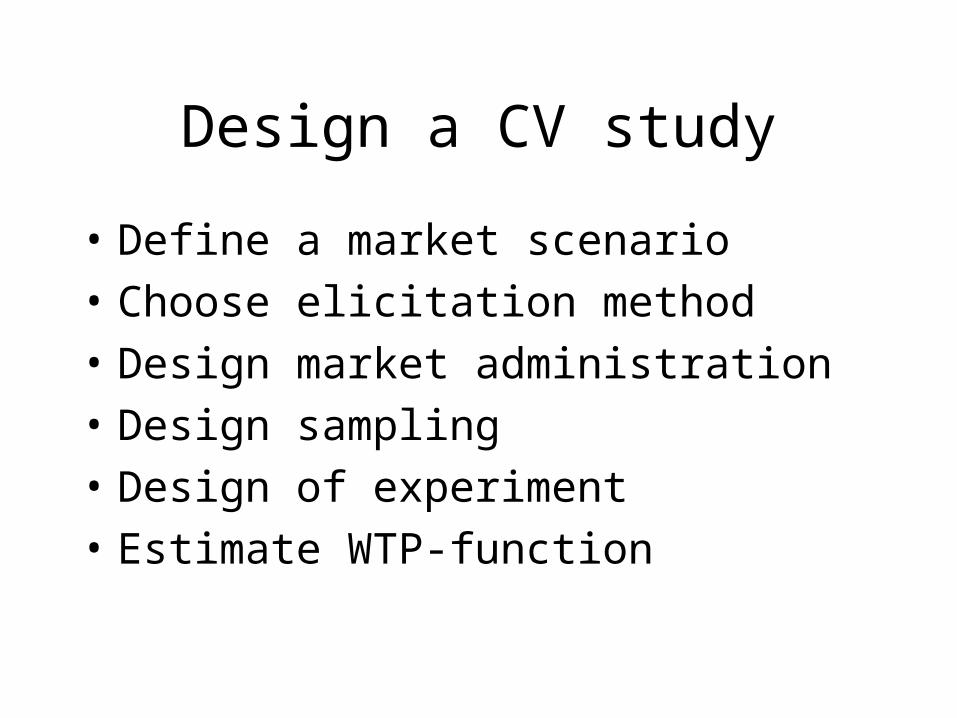
Design a CV study
• Define a market scenario• Choose elicitation method• Design market administration• Design sampling• Design of experiment• Estimate WTP-function

Potential Biases
• Incentive– Strategic– Compliance
• Implied value– Starting point– Range– Relational– Importance– Position
• Misspecification– Theoretical– Amenity– Context
• Embedding and warm glow

Incentive Biases
• The interviewee deliberately gives a false answer
• Strategic bias: Influence the outcome• Compliance/sponsor bias: Comply with
presumed expectations• Compliance/interview bias: Try to
please/impress the interviewer• Protest votes: Interviewees may object
to valuation per se, or to being interviewed

Implied Value Biases
• Starting point bias, in the bidding game• Range bias, in the payment card• Relational bias, if examples of other
contributions are mentioned• Importance bias: The fact that the
interviewer bothers to ask ...• Position bias, if multiple goods are
valued

Misspecification Biases -Context
• Misspecification of the market scenario• payment vehicle• property right: WTP/WTA• method of provision: like payment vehicle• budget constraint: ability to pay• elicitation: maximum WTP?• instrument: survey may confuse
interviewees• question order
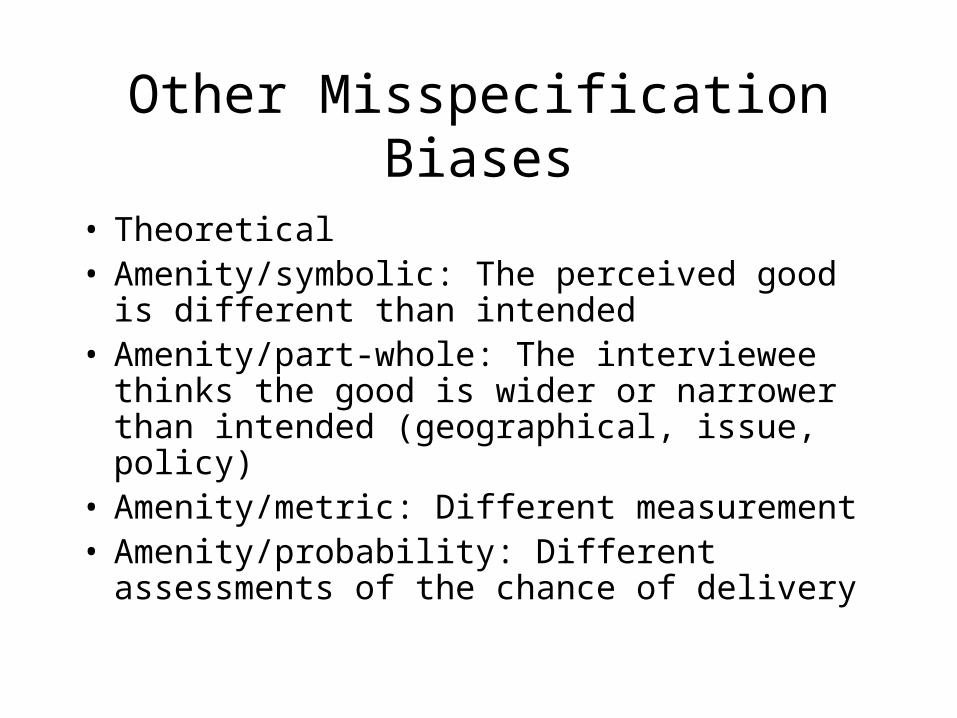
Other Misspecification Biases
• Theoretical• Amenity/symbolic: The perceived good
is different than intended• Amenity/part-whole: The interviewee
thinks the good is wider or narrower than intended (geographical, issue, policy)
• Amenity/metric: Different measurement• Amenity/probability: Different
assessments of the chance of delivery

Embedding• WTP for same good varies depending on
whether it is assessed on its own or embedded as part of a more inclusive package
• Kahnemann (1986)– WTP to prevent drop in fish population in all
Ontario lakes or small area respectively
• Scope effect• Sub-additivity effect• Possible explanations
– Substitution and satiation– Purchase of moral satisfaction (warm glow)