Embed Size (px)
Citation preview

Water Year Data Summary, 2005-2006
Ground Water
Chapter 3photo by Jeff Green
42

Water Year Data Summary, 2005-2006
ground water 43
Ground Water Level Network
2006(750 Obwells)
photo by Laurel Reeves

Water Year Data Summary, 2005-2006
Monitoring of ground water levels in Minnesota began in 1942 and, starting in 1947, was expanded by a cooperative program between the DNR and the United States Geological Survey (USGS). The number of observation wells (obwells) has remained constant at about 750 obwells over the last few water years. Data from these wells are used to assess ground water resources, determine long term trends, interpret impacts of pumping and climate, plan
Introduction
for water conservation, evaluate water conflicts, and otherwise manage the water resource. Soil and Water Conservation Districts (SWCD) and other cooperators under agreement with DNR Waters measure the wells monthly and report the readings to DNR Waters as part of the Ground Water Level Monitoring Program. Readings are also obtained from volunteers and electronic sources at other locations.
Hypothetical Unconfined and Confined Aquifer Systems
Figure 1
ground water44

Water Year Data Summary, 2005-2006
Aquifers
An aquifer is a water-saturated geologic formation which is sufficiently permeable to transmit economic quantities of water to wells and springs. Aquifers may exist under unconfined or confined conditions (Figure 1).
unconfined aquifers - In an unconfined aquifer, the ground water surface that separates the unsaturated and saturated zones is called the water table. The water table is exposed to the atmosphere through openings in the overlying unsaturated geologic materials. The water level inside the casing of a well placed in an unconfined aquifer will be at the same level as the water table. Unconfined aquifers may also be called water table or surficial aquifers.
For most of Minnesota, these aquifers are composed of glacial sand and gravel. Their areal extent is not always well defined nor is their hydraulic connection documented. They are often locally isolated pockets of glacial outwash deposited over an area of acres to square miles. Recharge to these units may be limited to rainfall over the area of the aquifer or augmented by ground water inflow. Consequently, care must be taken in extrapolating water table conditions based upon the measurements of a single water table well.
confined aquifers - When an aquifer is separated from the ground surface and atmosphere by a material of low permeability, the aquifer is confined. The water in a confined aquifer is under pressure, and therefore, when a well is installed in a confined aquifer, the water level in the well casing rises above the top of the aquifer. This aquifer type includes buried drift aquifers and most bedrock aquifers.
Buried drift aquifers consist of glacially deposited sands and gravels, over which a confining layer of clay or clay till was deposited. Their areal extent and hydraulic connections beneath the ground surface are often unknown; therefore, an obwell placed in one of these units may be representing an isolated system. Ground water investigations involving buried drift aquifers require considerable effort to evaluate the local interconnection between these aquifer units.
Bedrock aquifers are, as the name implies, geologic bedrock units which have porosity and permeability such that they meet the definition of an aquifer. Water in these units is either located in the spaces between the rock grains (such as sand grains) or in fractures within the more solid rock. While these aquifers can be unconfined, the ones measured in the ground water level monitoring network are generally bounded above and below by low-permeability confining units. Unlike buried drift aquifers, bedrock aquifers are fairly well defined in terms of their areal extent and the units are considered to be connected hydrologically throughout their occurrence.
Seasonal climatic changes affect the water levels in aquifer systems. Recharge, which is characterized by rising water levels, results as snow melt and precipitation infiltrate the soil and percolate to the saturated zone. Drawdown, characterized by the lowering of water levels, results as plants transpire soil water; ground water discharges into lakes, springs, and streams; or well pumping withdraws water from the aquifer. An unconfined aquifer generally responds more quickly to these changes than a confined aquifer since the water table is in more direct contact with the surface. However, the magnitude of change in water levels will usually be more pronounced in a confined aquifer.
ground water 45

Water Year Data Summary, 2005-2006
Statewide Summary
For many years, the DNR has maintained a network of observation wells throughout the state for the purpose of monitoring aquifer water levels. During the last few years, the DNR monitored water levels in approximately 750 wells. Water levels are usually recorded monthly from March through November. Figures 2, 3, 4 and 5 show the locations of these wells, identifying those that were placed in unconfined (water table) aquifers, in buried drift aquifers and in bedrock aquifers.
As reflected in observed ground water levels, several parts of the state experienced fairly dry conditions at times during Water Years 2003, 2004 and 2005. And then Water Year 2006 saw a rapid decline statewide into drought conditions. The impacts of this drought serve as the focus for this report on ground water levels. To this end, water levels were investigated over a timeframe from 1989 (the last major drought in Minnesota) to the present.
The remainder of this chapter discusses the ground water levels in unconfined and confined aquifers during Water Years 2005 (WY05) and 2006 (WY06). This discussion focuses on a comparison of obwell water levels in WY05 and WY06 to water levels over the timeframe noted above. Obwells were chosen to represent regions of the state that seemed to experience varying degrees of the 2006 drought. Hydrographs of these representative obwells illustrate the analysis (pages 52-68).
While drainage from an unconfined aquifer continues throughout the winter, recharge is restricted. In general, winter precipitation is stored as snowpack, and frozen soil prevents or slows the infiltration and percolation of spring snowmelt. By the end of winter, water tables would be expected to be at a low point. As the soil thaws and spring rains occur, the water table aquifers are recharged resulting in the higher water tables.
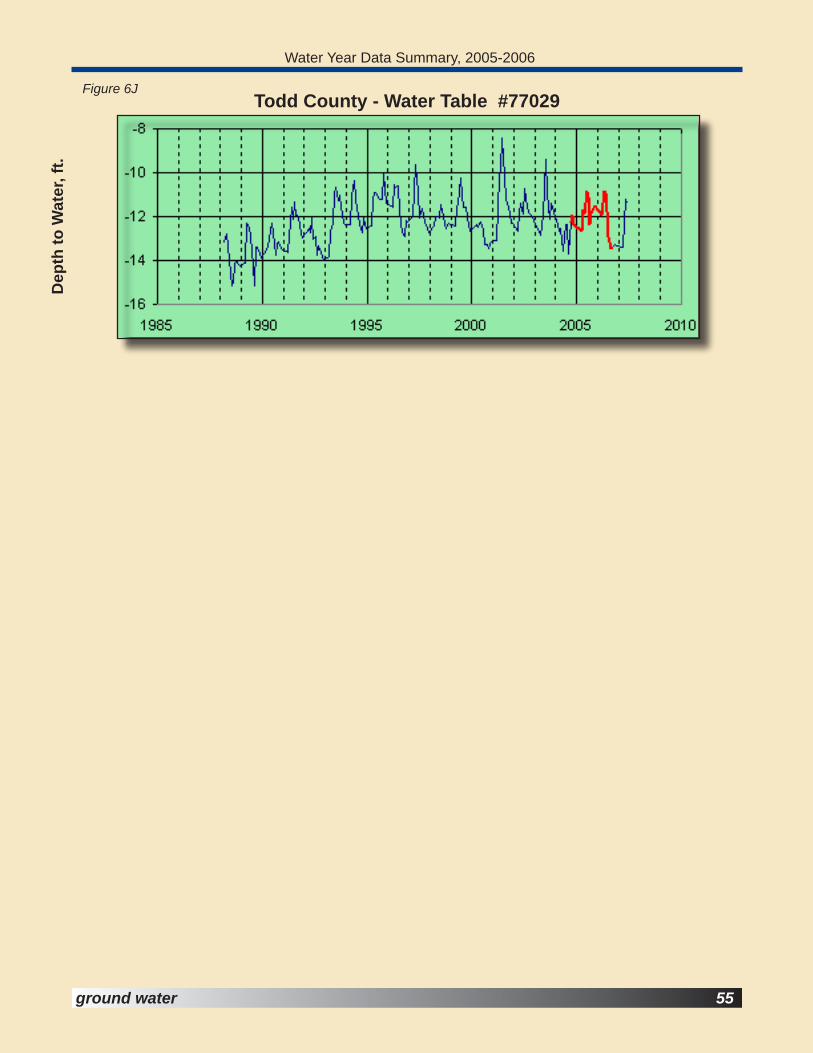
The approximate locations of the water table wells used in this report are shown in Figure 2. Hydrographs for these wells, over the period from 1989 to present, are shown in Figures 6A-6J. In this figure, the portion of the hydrograph representing WY05 and WY06 is shown in bold red and can easily be compared to previous water levels.
Unconfined (Water Table) Aquifers
ground water46
photo by Jeff Green
The hydrographs show that throughout the state, spring recharge in both WY05 and WY06 raised the water table to levels either equivalent to, or more generally, higher than in the immediately preceding few years. As summers progressed, water levels declined. As the drought presented itself in WY06 these summer declines
Figure 2

Water Year Data Summary, 2005-2006
ground water 47
lowered the water table to levels lower than those of WY05. An exception was in the west-central part of the state (represented by the Clay County obwell) where the drought was not as severe.
Even though the drought was severe in WY06, in general, the water table did not drop to levels to warrant major concern. There were, however, a few areas that showed some impact from the drought. In northwest Minnesota, as represented by the Clearwater County obwell, both WY05 and WY06 water table lows were slightly below those of 1989, but in the range of readings for the previous recent years. Also, the Todd County obwell, situated in an area where the drought was severe, registered a slightly low water level in WY06, but was still well above the levels of the 1989 drought. The Itasca County obwell indicated water table levels in WY06 that were lower than those of 1989. However, these levels were higher than the water table in 2003 and 2004 which was the low-point for a 4-year water level decline.
photo by Deb Rose
On site obwell drilling
photo by Laurel Reeves
Measuring water levels

Water Year Data Summary, 2005-2006
Water levels in confined aquifers may respond to changes in precipitation patterns differently than they would in water table aquifers – the presence of an overlying confining bed inhibits the movement of rain or snowmelt downward into the confined aquifer thereby delaying the recharge of the aquifer. During dry periods, the demand for increased water use from a confined aquifer will be reflected in declining water levels. As the dry period ends and precipitation returns to normal, recovery of water levels will be delayed due to the slow movement of water into the confined aquifer. Recovery may take two, three, or more years.
Wetter than normal periods may not cause rising water levels in confined aquifers for a few years because, again, of the slow water movement through the confining layers.
Confined Aquifers
ground water48
Buried Drift Aquifers
Under confined conditions, buried drift aquifers generally respond more slowly to seasonal inputs from snowmelt and precipitation than water table aquifers do. However, buried drift aquifers can be near the surface with their extent poorly defined and with some connection to adjacent unconfined aquifers. As a result, response of buried drift aquifers to recharge is determined by individual characteristics. The response is therefore difficult to predict.
The approximate locations of the buried drift wells used in this report are shown in Figure 3. Hydrographs for these wells, over the period from 1989 to present, are shown in Figure 7. In this figure, the portion of the hydrograph representing WY05 and WY06 is shown in bold red and can easily be compared to previous water levels.
Buried Drift Obwells
Figure 3
FormationAge
GlacialSedimentsQ
UA
T.
Decorah Shale
Glenwood Fm.
FranconiaFormation
OR
DO
VIC
IAN
Platteville Fm.
St. PeterSandstone
CA
MB
RIA
NP
c -
St. Lawrence Fm.
Jordan Sandstone
OneotaDolomiteP
rairi
e du
Chi
en G
roup Shakopee
Formation
Ironton Ss.
Galesville Ss.
HinckleySandstone
Mt. SimonSandstone
Eau ClaireFormation
Example of a generalized geologic column for the 7-county metropolitan area.

Water Year Data Summary, 2005-2006
Bedrock - Prairie du Chien and
Jordan Aquifers In past years, the Prairie du Chien and Jordan aquifers have been considered hydrologically linked and generally considered as one hydrologic unit. Conditions in the “Prairie du Chien/Jordan Aquifer” were considered to be to be represented by water level monitoring wells completed in the Prairie du Chien, the Jordan or in both the Prairie du Chien and Jordan formations.
Studies in recent years, especially those of the Minnesota Geological Survey (MGS), have begun to question the lumping of the two formations into one hydrologic unit. The information presented here relative to water levels in WY05 and WY06 is not meant to offer support for either the “lumping” or the “splitting” of these two geologic units; however, it appears in some cases that the two units are responding to the drought of ’06 in differing ways, and this will be discussed.
Locations of the Prairie du Chien (PDC) and Jordan (JDN) wells used in this report are shown in Figure 4. Wells identified by number are those wells for which hydrographs are shown in Figures 8A-9K which follow.
As in the case with water table wells, the buried drift hydrographs show that throughout the state, spring recharge in both WY05 and WY06 raised the water levels to equivalent, or more generally, higher levels than in the immediately preceding few years. As summers progressed, water levels declined. It is interesting to note that this summer decline was generally as great in WY05 as in WY06. Two exceptions were in the southwest (represented by Big Stone and Jackson County obwells) and in the north-central part of the state (Wadena and Hubbard Counties) where WY05 levels were in the normal range.
As summers progressed, water levels declined. As the drought developed in WY06 these summer declines lowered the water levels to lower levels than those of WY05. An exception was in the west-central part of the state (represented by the Clay County obwell) where the drought was not as severe.
The most dramatic mid-summer 2006 water level declines occurred in the central and north-central parts of the state. This is shown in the Meeker, Wadena, Hubbard and Aitkin Counties’ hydrographs.
Nearly all of the buried drift aquifer hydro-graphs show the beginnings of, or nearly com- plete, return to water levels similar to those before the onset of the drought. In a couple of cases where the last available reading in WY06 did not show recovery, subsequent readings in WY07 confirm the recovery.
49ground water
photo by DNR Waters

Water Year Data Summary, 2005-2006
For this report there were adequate numbers of wells distributed around the metro area to allow the JDN and PDC aquifer levels to be looked at separately. One exception was in Dakota County where totally JDN wells were not available. Look- ing at many of the wells completed in both the PDC and JDN in Dakota County, it appeared as if they were responding to climatic events in a manner similar to JDN wells. Consequently, in examining the Jordan aquifer levels in the metro area, one PDC/JDN well in southern Dakota County was included.
Jordan Aquifer
Water levels in the Jordan aquifer system throughout the metro area generally showed summertime declines below recent levels in both WY05 and WY06. However, there were some exceptions in WY05. Hennepin County’s City of Bloomington and City of New Hope obwells and the St. Lawrence Creamery well in Rice County all showed minimal, or no summer declines during WY05.
The drought of 2006 manifested in extremely low water levels for parts of the metro Jordan aquifer system; this was represented by Hennepin
Water levels in the Prairie du Chien aquifer showed variable response to the conditions of WY05 and WY06. In Hennepin, Scott and Rice counties, water levels fluctuated in a manner similar to recent preceding years, with no appreciable declines in either water year. Dakota County PDC obwells showed a lot of variation: obwell 19005 in the north looked like a continuation of recently increasing water level trends. Obwells 19008 and 19029 exhibited severe water level declines; obwell 19007 showed a large decline in water level for summertime WY06, but this was in keeping with patterns of recent years. And, in northern Washington County, water levels showed a decline similar to those in Dakota County. It is interesting to note that the hydrograph for PDC well 82033 and JDN well 82031 are very similar. These two wells are located in close proximity and one would probably conclude that the two formations are functioning as one, interconnected aquifer.
Prairie du Chien
ground water50
County’s obwells at the City of Bloomington and City of New Hope, Rice County’s St. Lawrence Creamery, and the obwell in the Prairie du Chien/Jordan aquifer in southern Dakota County. However, all of these extreme declines ceased and water levels recovered as the wetter fall of WY07 began.
Figure 4Prairie du Chien &
Jordan Obwells

Water Year Data Summary, 2005-2006
Bedrock - Mt. Simon Aquifer
ground water 51
Figure 5 Mt. Simon Obwells
A couple of exceptions did occur, however. In the northern reaches of the aquifer, shown as the Isanti obwell, WY05 showed drawdowns far exceeding the previous years. There was no spring recovery and WY06 saw the water levels decline even more. In Washington County, WY06 water levels were drawn down to a point lower than any time in the preceding short history of that well. And finally, in the south metro, the Scott County obwell showed a situation where the springtime high levels in WY05 and WY06 did not show recovery to preceding levels and where WY06 water level declined to a new low.
One can also note on this Scott County hydro- graph that the Mt. Simon aquifer water levels in the Savage area are continuing their long-term decline. While some of this is climatically induced, part of the decline must be attributed to pressures exerted on this aquifer by increasing development in the area.
With some exceptions, the Mt. Simon aquifer is everywhere confined. It may respond as an unconfined aquifer in the atypical instances where the aquifer is adjacent to unconfined materials, such as along deeply incised buried glacial valleys.
Locations of the Mt. Simon wells used for this summary are shown in Figure 5. Hydrographs depicting representative water levels across the metro area are shown in Figures 10A-i.
Vertical exaggeration approximately 130x
Feet A
bove Mean S
ea Level
Many of the Mt. Simon obwells have a fairly short period of record. Consequently it is difficult to place the WY05 and WY06 readings in a long-term perspective. However, the data that are available provide a look at how the aquifer is responding to recent climate.
Generally the WY05 and WY06 Mt. Simon water levels fluctuated within the bounds of recent previous years, and springtime high water levels were similar to preceding recent spring times.
Generalized Twin Cities Metropolitan Area Geologic Cross-Section. Graphic by Metropolitan Council

Water Year Data Summary, 2005-2006D
epth
to
Wat
er, f
t.
Beltrami County - Water Table #4017
Big Stone County - Water Table #6000
Carlton County - Water Table #9028
ground water52
Figure 6A
Figure 6B
Figure 6C

Water Year Data Summary, 2005-2006D
epth
to
Wat
er, f
t.
Clay County - Water Table #14041
Clearwater County - Water Table #15003
Itasca County - Water Table #31000
ground water 53
Figure 6D
Figure 6E
Figure 6F

Water Year Data Summary, 2005-2006D
epth
to
Wat
er, f
t.
Jackson County - Water Table #32004
Marshall County - Water Table #45001
Meeker County - Water Table #47000
ground water54
Figure 6G
Figure 6H
Figure 6i
Water Year Data Summary, 2005-2006D
epth
to
Wat
er, f
t.
Todd County - Water Table #77029
ground water 55
Figure 6J

Water Year Data Summary, 2005-2006
Aitkin County - Buried Drift #1007
Big Stone County - Buried Drift #6007
Clay County - Buried Drift #14038
Dep
th t
o W
ater
, ft.
ground water56
Figure 7C
Figure 7B
Figure 7A

Water Year Data Summary, 2005-2006
Clearwater County - Buried Drift #15002
Dep
th t
o W
ater
, ft.
Hubbard County - Buried Drift #29032
Jackson County - Buried Drift #32003
ground water 57
Figure 7D
Figure 7E
Figure 7F

Water Year Data Summary, 2005-2006D
epth
to
Wat
er, f
t.
Meeker County - Buried Drift #47007
North St. Louis County - Buried Drift #69050
Marshall County - Buried Drift #45000
ground water58
Figure 7G
Figure 7H
Figure 7i

Water Year Data Summary, 2005-2006D
epth
to
Wat
er, f
t.
Todd County - Buried Drift #77034
Wadena County - Buried Drift #80029
Rice County - Buried Drift #66015
ground water 59
Figure 7J
Figure 7K
Figure 7L

Water Year Data Summary, 2005-2006D
epth
to
Wat
er, f
t.
Anoka County - Jordan #2012
Hennepin County - Jordan #27001
Hennepin County - Jordan #27011
ground water60
Figure 8A
Figure 8C
Figure 8B

Water Year Data Summary, 2005-2006D
epth
to
Wat
er, f
t.
Ramsey County - Jordan #62030
Olmsted County - Jordan #55000
Rice County - Jordan #82031
ground water 61
Figure 8E
Figure 8D
Figure 8F

Water Year Data Summary, 2005-2006
Dakota County - Prairie du Chien #19005
Dep
th t
o W
ater
, ft.
Dakota County - Prairie du Chien #19007
Dakota County - Prairie du Chien #19008
ground water62
Figure 9A
Figure 9B
Figure 9C

Water Year Data Summary, 2005-2006D
epth
to
Wat
er, f
t.
Dakota County - Prairie du Chien #19029
Hennepin County - Prairie du Chien #27036
Rice County - Prairie du Chien #66016
ground water 63
Figure 9D
Figure 9E
Figure 9F

Water Year Data Summary, 2005-2006D
epth
to
Wat
er, f
t.
Rice County - Prairie du Chien #66017
Scott County - Prairie du Chien #70008
Washington County - Prairie du Chien #82029
ground water64
Figure 9G
Figure 9H
Figure 9i

Water Year Data Summary, 2005-2006D
epth
to
Wat
er, f
t.
Washington County - Prairie du Chien #82033
Dakota County - Prairie du Chien/Jordan #19046
ground water 65
Figure 9J
Figure 9K

Water Year Data Summary, 2005-2006D
epth
to
Wat
er, f
t.
Anoka County - Mt. Simon #2028
Hennepin County - Mt. Simon #27004
Chisago County - Mt. Simon #13006
ground water66
Figure 10A
Figure 10B
Figure 10C

Water Year Data Summary, 2005-2006D
epth
to
Wat
er, f
t.
Hennepin County - Mt. Simon #27043
Isanti County (Cambridge) - Mt.Simon #30009
Ramsey County - Mt.Simon #62046
ground water 67
Figure 10D
Figure 10E
Figure 10F

Water Year Data Summary, 2005-2006D
epth
to
Wat
er, f
t.
Scott County (Savage) - Mt.Simon #70002/70030
ground water68
Washington County - Mt.Simon #82046
Wright County - Mt.Simon #86001
Figure 10G
Figure 10H
Figure 10i

Water Year Data Summary, 2005-2006
Data Available Online
Digital data for many Atlases and Assessments, including geographical information systems (GIS) and related resource data, can be downloaded over the internet. Some map images and documents are also available as portable document format (PDF) files. Digital data for many reports can be downloaded for use in GIS programs such as ArcView, ArcGIS, and EPPL7. Map viewers (at no or low cost) such as ArcExplorer can also be used to visualize the downloaded data. Some report digital data is not downloadable but is available on request.
An introduction to the recently completed county geologic atlas for Pope County (that part of the project published by DNR Waters) can be found in the September 2006 issue of the Minnesota Ground Water Association (pages 6 through 12). The full atlas report is published in two parts, Part A (Geology) and Part B (Ground Water and Pollution Sensitivity). The web page for the Pope County Geologic Atlas project lists the contents and provides links to the data.
Other county atlas and assessment report data, including MGS report data, can be accessed on the DNR Waters website here.
For more information on MGS atlas and assessment report data see the list of current publications on the MGS website.
Ground Water Data DNR Waters and the Minnesota Geological Survey (MGS) collaborate preparing the maps and reports of the County Geologic Atlases and Regional Hydrogeologic Assessments. The geologic data collection, mapping, and interpretation of the rock and sediment beneath the earth’s surface by the MGS provide the framework for ground water studies by DNR Waters of how water moves through those materials and interacts with water at the land’s surface. DNR Waters staff measure water levels in wells and collect water samples for chemical and isotopic analysis. They also use ground water level monitoring data, climatology records, water use permits, and geophysical study reports. Atlases and assessments are used in planning, environmental protection, and education. A better understanding of the physical environment and ground water systems enables better environmental decision-making.
County Geologic Atlas and Regional Hydrogeologic Assessment Program
Project Areas
ground water 69