Embed Size (px)
Citation preview

NREL is a national laboratory of the U.S. Department of Energy, Office of Energy Efficiency & Renewable Energy, operated by the Alliance for Sustainable Energy, LLC.
Contract No. DE-AC36-08GO28308
Water Use in Parabolic Trough Power Plants: Summary Results from WorleyParsons' Analyses C.S. Turchi, M.J. Wagner, and C.F. Kutscher
Technical Report NREL/TP-5500-49468 December 2010

NREL is a national laboratory of the U.S. Department of Energy, Office of Energy Efficiency & Renewable Energy, operated by the Alliance for Sustainable Energy, LLC.
National Renewable Energy Laboratory 1617 Cole Boulevard Golden, Colorado 80401 303-275-3000 • www.nrel.gov
Contract No. DE-AC36-08GO28308
Water Use in Parabolic Trough Power Plants: Summary Results from WorleyParsons' Analyses C.S. Turchi, M.J. Wagner, and C.F. Kutscher Prepared under Task No. SM10.1530
Technical Report NREL/TP-5500-49468 December 2010

NOTICE
This report was prepared as an account of work sponsored by an agency of the United States government. Neither the United States government nor any agency thereof, nor any of their employees, makes any warranty, express or implied, or assumes any legal liability or responsibility for the accuracy, completeness, or usefulness of any information, apparatus, product, or process disclosed, or represents that its use would not infringe privately owned rights. Reference herein to any specific commercial product, process, or service by trade name, trademark, manufacturer, or otherwise does not necessarily constitute or imply its endorsement, recommendation, or favoring by the United States government or any agency thereof. The views and opinions of authors expressed herein do not necessarily state or reflect those of the United States government or any agency thereof.
Available electronically at http://www.osti.gov/bridge
Available for a processing fee to U.S. Department of Energy and its contractors, in paper, from:
U.S. Department of Energy Office of Scientific and Technical Information
P.O. Box 62 Oak Ridge, TN 37831-0062 phone: 865.576.8401 fax: 865.576.5728 email: mailto:[email protected]
Available for sale to the public, in paper, from:
U.S. Department of Commerce National Technical Information Service 5285 Port Royal Road Springfield, VA 22161 phone: 800.553.6847 fax: 703.605.6900 email: [email protected] online ordering: http://www.ntis.gov/help/ordermethods.aspx
Cover Photos: (left to right) PIX 16416, PIX 17423, PIX 16560, PIX 17613, PIX 17436, PIX 17721
Printed on paper containing at least 50% wastepaper, including 10% post consumer waste.

iii
Table of Contents Summary ...................................................................................................................................................... 1
Background and Objectives ....................................................................................................................... 1
Steam Rankine Power Cycle ...................................................................................................................... 2
Cooling Options .......................................................................................................................................... 3
WorleyParsons Reports ............................................................................................................................. 7
Cost Assumptions ................................................................................................................................ 7
Design Basis ......................................................................................................................................... 7
Selection of Air-Cooled Condenser (ACC) Size ................................................................................ 8
Description of Study Sites ................................................................................................................. 11
Daggett, California Site ...................................................................................................................... 12
Las Vegas, Nevada Site ..................................................................................................................... 14
Alamosa, Colorado Site ..................................................................................................................... 16
Water Consumption ........................................................................................................................... 17
Analysis Using Solar Advisor Model (SAM) ........................................................................................... 19
Impact of Time-of-Delivery (TOD) Rates on Dry-Cooled Plant Revenue ............................................. 23
Conclusions ............................................................................................................................................... 25
References ................................................................................................................................................. 26
Acknowledgements .................................................................................................................................. 27
Appendix A ................................................................................................................................................ 28
Appendix B ................................................................................................................................................ 58
Appendix C ................................................................................................................................................ 77

iv
List of Figures Figure 1. Simple representation of a steam Rankine thermal power cycle. Cycle shows a cooling system
that uses water evaporation to condense the low-pressure steam coming from the turbine. .................. 3Figure 2. Representation of wet-bulb and dry-bulb temperature difference and the impact on condenser
temperature for a warm day. Wet-cooled systems can always achieve equal or lower condenser temperatures than dry-cooled systems. ................................................................................................... 4
Figure 3. Steam turbine power output as a function condenser temperature [3]. ......................................... 6Figure 4. Hybrid cooling systems use an air-cooled condenser and a wet-cooled condenser in parallel. .... 7Figure 5. Determining the optimum ITD for a plant with the Las Vegas climate file based on installed
cost per kW. ............................................................................................................................................ 8Figure 6. Determining the optimum ITD for a plant with the Alamosa climate file based on installed
cost per kW. ............................................................................................................................................ 9Figure 7. Impact of two different design assumptions on subsystem costs and plant output. .................... 10Figure 8. Dry-bulb temperature duration curves for several Southwest locations. ..................................... 12Figure 9. Estimated water consumption for the 13 cases. ........................................................................... 18Figure 10. Water consumption by different land-intensive activities in the Southwest. ............................. 19Figure 11. SAM simulations of a summer day at design point (top) and a spring day at lower ambient
temperatures (bottom) for wet- and dry-cooled plants. Constant-capacity design is assumed, i.e., the dry plant has a larger turbine and solar field to accommodate the lower cycle efficiency. .................. 22
Figure 12. Relative generation or revenue as a function of cooling type and TOD schedule for Alamosa (top) and Daggett (bottom) cases. The scale is relative to the wet-cooled, no TOD, values estimated by SAM. ............................................................................................................................................... 24
List of Tables Table 1. Characteristics of the different cooling methods. ........................................................................... 4Table 2. Summary of conditions evaluated by WorleyParsons. Consult the complete report for more
information. .......................................................................................................................................... 11Table 3. Comparison of wet- and dry-cooled parabolic trough plants in Daggett, California. ................... 13Table 4. Comparison of nominal 100-MW wet, hybrid, and dry cooling cases for the Las Vegas study
with constant heat input design assumption. ........................................................................................ 14Table 5. Comparison of 125-MW wet- and dry-cooling cases for Las Vegas, NV study with constant-
capacity design assumption. ................................................................................................................. 16Table 6. Comparison of wet-, hybrid-, and dry-cooling cases for the Alamosa, Colorado study. .............. 17Table 7. Financial assumptions used in SAM analysis. .............................................................................. 19Table 8. Summary of the WorleyParsons (WP) results and SAM estimates. SAM values were obtained
using the solar field area, turbine size and efficiency, and design-point temperatures from the WorleyParsons analyses. ...................................................................................................................... 21
Table 9. Change in generation by TOD period and the resulting impact on annual revenue resulting from the switch from wet to dry cooling, assuming Daggett and Alamosa climates using the TOD schedule for SCE. The Daggett cases assume constant capacity while the Alamosa cases assume constant heat input design (See Table 1). ................................................................................................................... 23

1
Water Use in Parabolic Trough Power Plants: Summary Results from WorleyParsons’ Analyses
Summary Water consumption for electric power generation is undergoing increasing scrutiny, with more emphasis being placed on low-water-use technologies. In 2009 and 2010, the National Renewable Energy Laboratory (NREL) contracted with WorleyParsons Group, Inc. (Golden, Colorado) to examine the efficiency and impact of dry and hybrid (both dry and wet operating in parallel) cooling systems on a nominal 100-MW parabolic trough concentrating solar power (CSP) plant. WorleyParsons analyzed 13 different cases spanning three different geographic locations (Daggett, California; Las Vegas, Nevada; and Alamosa, Colorado) and wet, dry, and hybrid cooling technologies to assess the performance, cost, and water use impacts of switching from wet to dry or hybrid cooling systems. NREL developed cases in its Solar Advisor Model (SAM) for each scenario to provide a comparison to the WorleyParsons designs. Although absolute estimates are listed at times, the emphasis of this analysis is on the relative cost and performance of wet-, dry-, and hybrid-cooled plants.
Our findings indicate that switching from 100% wet to 100% dry cooling will result in levelized cost of electricity (LCOE) increases of approximately 3% to 8% for parabolic trough plants throughout most of the southwestern United States. In cooler, high-altitude areas like Colorado’s San Luis Valley, WorleyParsons estimated the increase at only 2.5%, while SAM predicted a 4.4% difference. For the single case that included a no-storage design, the addition of thermal energy storage reduced the negative impact of dry cooling on LCOE. In all cases, the transition to dry cooling will reduce water consumption by over 90%. The remaining water consumption is split between steam-cycle maintenance and mirror washing. Utility time-of-delivery (TOD) schedules had similar impacts for wet- and dry-cooled plants, suggesting that TOD schedules have a relatively minor effect on the dry-cooling penalty.
Hybrid cooling can reduce the LCOE increase—but at a higher capital cost and operational complexity. The economics of hybrid cooling depend on water cost and climate: for example, in the Alamosa climate, hybrid cooling had no benefit, while there was a clear LCOE advantage for hybrid cooling over dry cooling for the Las Vegas site with storage. A more detailed study of hybrid cooling is the subject of a pending NREL publication.
Background and Objectives Utility-scale solar power plants are currently being proposed at numerous sites throughout the southwestern United States. Large central-station plants in this region take advantage of both excellent solar resource quality and economy of scale in construction and operation to produce electricity at the lowest cost of any CSP installation. While there are obvious local, regional, and global environmental benefits of large-scale solar power (e.g., jobs, low pollution, low fossil-fuel consumption, domestic resource, etc.), local environmental impacts must also be considered. The greatest local impacts relate to the use of land and water. This report focuses on water consumption at parabolic trough CSP plants.
Parabolic troughs represent the most mature of CSP technologies, with more than 500 MW of trough plants currently operating in the United States and Spain. In addition, approximately 1

2
gigawatt (GW) is under construction, with several GW of trough plants proposed for locations around the world [1]. Parabolic troughs offer a desirable blend of efficiency and proven performance that make them appealing to developers and financiers. In addition, thermal inertia and the ability to incorporate thermal energy storage allow trough (and power tower) plants to provide reliable, dispatchable generation that facilitates their integration into the electric grid.
The huge generation potential of CSP in the Southwest has led to a focus on the possible impact of extensive CSP deployment on water resources in the region. Because steam-cycle cooling accounts for over 90% of water consumption in a typical wet-cooled CSP power plant, minimizing cooling water use is the most important step in water conservation. In 2009 and 2010, NREL contracted with WorleyParsons Group (Golden, CO) to estimate the water use, performance, and cost impacts of switching from wet to dry cooling. Studies were performed for parabolic trough plants in three different locations: Daggett, California; Las Vegas, Nevada; and Alamosa, Colorado. Daggett and Alamosa were selected to represent two opposite climate extremes for the region, and the Las Vegas case was undertaken to assist with a specific U.S. Department of Energy (DOE) request. The WorleyParsons studies are included as appendices to this report. The three studies had differing assumptions that resulted in slightly different conclusions.
The specific objectives of this report are as follows:
• Summarize and consolidate the WorleyParsons work and provide a single publication reference;
• Reconcile the conclusions of the WorleyParsons work on the basis of the differing study assumptions;
• Compare the WorleyParsons results to estimates from SAM (available at https://www.nrel.gov/analysis/sam/) using the same plant size assumptions; and
• Incorporate TOD price schedules into the economic evaluation of wet- and dry-cooled plants.
The following section provides a brief overview of the importance of cooling for steam Rankine power plants; this review is targeted for those who are not experts in steam turbine design. This is followed by a review of the WorleyParsons results, and then the comparison analysis using SAM.
Steam Rankine Power Cycle Parabolic trough and power tower CSP technologies rely on steam Rankine power cycles that are essentially the same as those used in coal and nuclear power plants. These power cycles input high-quality thermal energy, produce electric power, and discharge low-quality heat (see Figure 1). The heat rejection phase in a Rankine power block uses a cooling system (a heat sink) to condense steam back into water. The water can then be efficiently pumped back to high pressure and returned to the boiler to produce high-pressure steam. The overall conversion efficiency of thermal energy into electricity directly depends on the temperatures of the heat source and the heat sink. In its simplest form, the ideal thermal cycle efficiency (the Carnot efficiency) is proportional to 1 minus the ratio of heat sink temperature to the heat source temperature, where the temperatures are defined on an absolute scale:

3
Thus, cycle efficiency is maximized when the highest possible heat source temperature and the lowest possible heat sink temperature are obtained. Because of this relationship, power plant developers seek a cooling system that provides the lowest possible heat sink temperature. In general, the most convenient low-temperature heat sink is provided by water—either directly in the case of once-through cooling with a body of water or indirectly through evaporation. Where water is scarce or expensive, the water-cooled design may not be practical. Notably, the vast majority of power plants (whether solar, coal, gas, or nuclear) that utilize a steam Rankine power cycle use water cooling.
Figure 1. Simple representation of a steam Rankine thermal power cycle. Cycle shows a cooling
system that uses water evaporation to condense the low-pressure steam coming from the turbine.
Cooling Options While water is the preferred medium for power-cycle cooling, its availability may be limited by policy or cost in some locations, especially throughout much of the arid Southwest. Under these conditions, the plant designer can opt for an air-cooled system or, if some water is available, a hybrid design that uses both air and water for cooling. An air-cooled condenser (ACC) condenses the steam by forcing ambient air over a bundle of finned tubes containing the steam that exits the turbine. A typical hybrid system includes both an ACC and a wet-cooled tower operating in parallel, and the size of each can be adjusted depending on the design intent. The design of these systems has been discussed elsewhere [2-4]; the attributes of each are summarized in Table 1.
1

4
Table 1. Characteristics of the different cooling methods.
Cooling Type
Advantages Disadvantages
Wet (cooling tower)
Lowest installed cost Low parasitic loads Best cooling (i.e., lowest cooling temperature), especially in arid climates; gives highest power cycle efficiency
High water consumption Water treatment and blowdown disposal required Cooling tower plume in cold weather
Dry (ACC)
No water consumption No water treatment required No cooling-tower or blowdown pond Lower O&M costs
More expensive equipment Higher parasitic loads Poorer cooling at high dry-bulb temps (cycle efficiency falls)
Hybrid
Reduced water consumption Potential for lower levelized energy cost compared to dry cooling Maintains good performance during hot weather
Complicated system involving wet and dry cooling; often highest capital cost Same disadvantages of wet system, but to lesser degree
A critical distinction between the effectiveness of wet- and dry-cooled systems relates to the minimum cooling temperature each technology can achieve. Dry-cooled processes rely on air cooling and are limited by the ambient dry-bulb temperature. In contrast, wet cooling processes use evaporation to reject heat and can achieve minimum temperatures that approach the ambient wet-bulb temperature. “Wet-bulb” refers to the temperature achieved by a moistened thermometer in flowing air and reflects the reduced temperature that is possible when evaporation from a surface is accounted for. The difference between wet-bulb and dry-bulb temperature depends on humidity: they are equal at 100% relative humidity, and wet-bulb is always lower than dry-bulb temperature in other conditions. Figure 2 depicts an example of how the wet-bulb and dry-bulb temperatures relate to the operating conditions of wet and dry condensers.
Figure 2. Representation of wet-bulb and dry-bulb temperature difference and the impact on
condenser temperature for a warm day. Wet-cooled systems can always achieve equal or lower condenser temperatures than dry-cooled systems.

5
A cooling tower can easily bring water to within 5°C of the wet-bulb temperature (known as the “approach temperature”). This cooling water is then used to condense the steam at a temperature typically a few degrees warmer, with the overall difference between the wet-bulb temperature and the condensate on the order of 10°C; that is, for a wet-bulb temperature of 24°C, a typical wet-cooled condenser may operate at 34°C (see Figure 2). In contrast, a dry-cooled condenser is designed to condense steam at a temperature above the dry-bulb temperature; this is denoted as the initial temperature difference (ITD). Because air has a low volumetric heat capacity, the heat transferred to the air results in a large temperature increase in the air as it passes through the ACC. (Higher air flow rates could reduce the temperature increase, but at a high cost in fan power. Similarly, larger ACC areas can be used, but also at a higher cost.) In the example shown in Figure 2, the dry-bulb temperature is 32°C, and even with an aggressive ITD temperature of 16°C, a dry-cooled condenser can only achieve a condenser temperature of 48°C. Wet-cooled condensers are normally designed with a closer approach than ACCs because the marginal cost of an ACC climbs dramatically as one nears the dry-bulb temperature. As previously shown, the efficiency of the Rankine steam cycle depends on the condenser temperature, so as condenser temperature climbs, power-cycle efficiency falls.
Figure 3 shows a typical response of cycle efficiency versus condenser temperature [3]. One can see that condenser temperature has a strong impact on plant output. Steam turbines are designed for optimum performance at the intended design conditions; two different turbine design curves are shown in Figure 3. A low-backpressure turbine, such as might be specified for a wet-cooled plant, has a higher efficiency—but only at low condenser temperatures. Performance falls rapidly as condenser temperature increases, but because wet-bulb temperature is normally relatively constant, this is not detrimental. In contrast, a high-backpressure turbine would be a better match for a dry-cooled plant running at conditions governed by the higher and more variable dry-bulb temperature. Such curves are commonly plotted versus condenser pressure, which is the “backpressure” seen by the turbine. Because the condenser holds saturated steam, either the temperature or pressure can be used to define the conditions.

6
Figure 3. Steam turbine power output as a function condenser temperature [3].
On hot summer afternoons dry cooling performance is at its least efficient. However these periods are often when electricity demand peaks and power generation is most valuable. Some utilities reward generation during these periods through TOD rates that provide cost incentives for on-peak generation. Hybrid cooling systems (Figure 4) have been proposed to allow for partial wet cooling during these periods. In hybrid systems, a wet-cooled condenser operates in parallel with a dry-cooled condenser. When the dry-bulb temperature is low, only the ACC is used. At high dry-bulb temperatures, the wet-cooled system is activated to reduce the cooling load on the ACC, thereby lowering the exit air temperature and allowing the steam to condense at a lower temperature closer to the air dry-bulb temperature. Such designs exchange water consumption for cycle efficiency.
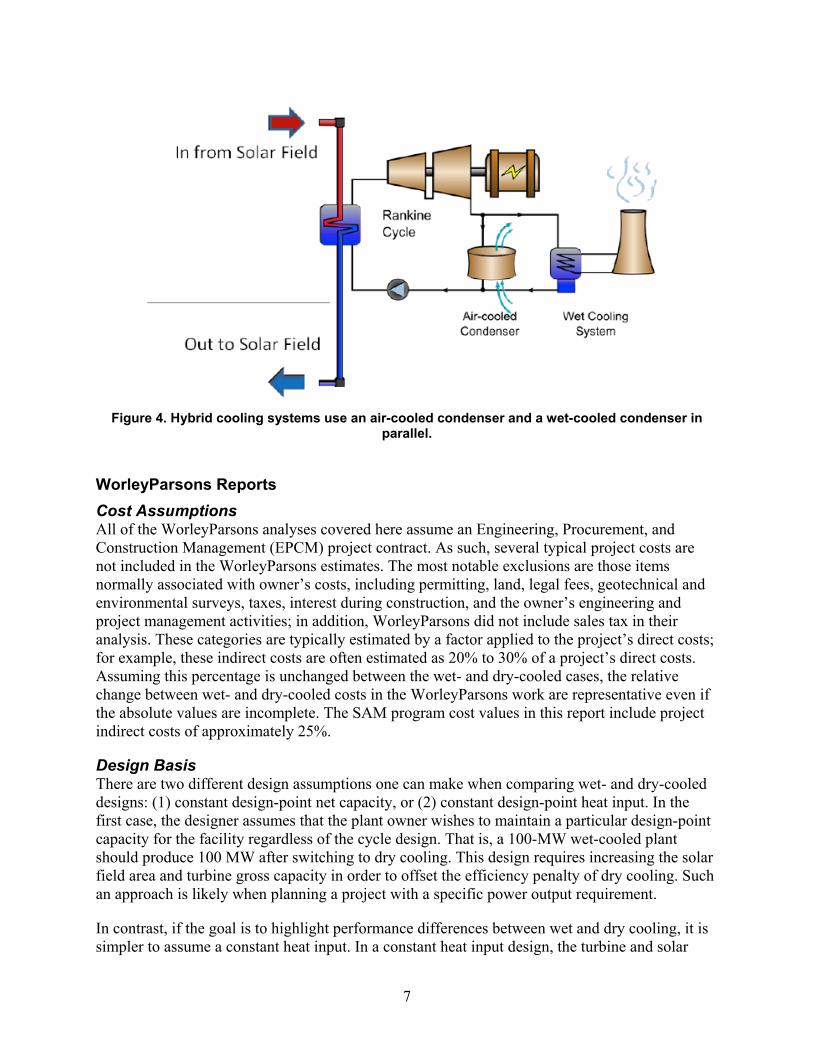
7
Figure 4. Hybrid cooling systems use an air-cooled condenser and a wet-cooled condenser in
parallel.
WorleyParsons Reports Cost Assumptions All of the WorleyParsons analyses covered here assume an Engineering, Procurement, and Construction Management (EPCM) project contract. As such, several typical project costs are not included in the WorleyParsons estimates. The most notable exclusions are those items normally associated with owner’s costs, including permitting, land, legal fees, geotechnical and environmental surveys, taxes, interest during construction, and the owner’s engineering and project management activities; in addition, WorleyParsons did not include sales tax in their analysis. These categories are typically estimated by a factor applied to the project’s direct costs; for example, these indirect costs are often estimated as 20% to 30% of a project’s direct costs. Assuming this percentage is unchanged between the wet- and dry-cooled cases, the relative change between wet- and dry-cooled costs in the WorleyParsons work are representative even if the absolute values are incomplete. The SAM program cost values in this report include project indirect costs of approximately 25%.
Design Basis There are two different design assumptions one can make when comparing wet- and dry-cooled designs: (1) constant design-point net capacity, or (2) constant design-point heat input. In the first case, the designer assumes that the plant owner wishes to maintain a particular design-point capacity for the facility regardless of the cycle design. That is, a 100-MW wet-cooled plant should produce 100 MW after switching to dry cooling. This design requires increasing the solar field area and turbine gross capacity in order to offset the efficiency penalty of dry cooling. Such an approach is likely when planning a project with a specific power output requirement.
In contrast, if the goal is to highlight performance differences between wet and dry cooling, it is simpler to assume a constant heat input. In a constant heat input design, the turbine and solar

8
field sizes are unchanged, and any performance difference results purely from the change of cooling system. This is an oversimplification, because even with no change to the turbine capacity, one is likely to optimize the turbine for the higher condenser temperatures expected from a dry-cooled system. For example, WorleyParsons adjusted turbine design parameters to account for a higher backpressure when modeling the dry-cooled plants.
Selection of Air-Cooled Condenser (ACC) Size WorleyParsons examined different ACC ITD design points to determine the optimum balance between plant capital cost and efficiency for the Las Vegas and Alamosa sites. The ITD analysis assumes a dry-cooled plant with a fixed solar field size operating at the selected design-point dry-bulb temperature. To select an optimum ITD for the Las Vegas site, GateCycle performance models were run at the design conditions, varying the ITD from 5°F to 40°F (2.8°C to 22°C). The net plant power from each run took into account the varying ACC fan power loads and steam turbine outputs. The total installed plant cost was adjusted for the different sizes of ACCs as defined by the ITD. The total plant cost and the plant cost per net kW are plotted as a function of the ACC ITD in Figure 5 below.
Figure 5. Determining the optimum ITD for a plant with the Las Vegas climate file based on
installed cost per kW.
As shown in Figure 5, total plant installed cost drops with ITD because a larger ITD leads to a smaller and less expensive ACC. However, ITD also affects plant efficiency and design-point capacity. The lowest cost per kW (net) at the design conditions was obtained using an ITD of 25°F (13.9°C), and this ITD was used in the Las Vegas cooling study. A similar analysis was
$9,000
$9,500
$10,000
$10,500
$11,000
$11,500
$12,000
$900
$950
$1,000
$1,050
$1,100
$1,150
$1,200
0 5 10 15 20 25 30 35 40 45
$/kw
at d
esig
n co
nditi
ons
mill
ion
$
Las Vegas site ITD (deg F)
Total Plant Installed Cost, Million $
Total Plant Installed Cost, $/kw

9
performed for the Colorado site (see Figure 6). The cost per kW was level from 20°F to 30°F ITD. The average was subsequently selected, which conveniently aligned with the 25°F ITD chosen for the Las Vegas site. Note that these ITDs are considerably lower than what would typically be used for a fossil plant. The lower ITD and commensurately larger ACC can be justified because trough plants operate at a lower steam temperature and are thus more sensitive to the heat rejection temperature. In addition, for an equivalent power output, it is more cost effective to invest in a larger ACC than a larger solar field.
For a specified ITD, one can calculate the temperature and pressure that will be achieved in the condenser at design-point conditions. Due to the lower design-point dry-bulb temperature in Colorado, a 25°F ITD resulted in a 1.27 psia (0.088 bar) steam turbine backpressure compared to a design turbine exhaust pressure of 2.60 psia (0.180 bar) in the Las Vegas study. According to WorleyParsons, the lowest steam turbine backpressure that can be reasonably achieved with an ACC is about 1 psia (0.07 bar). Thus, the Colorado site’s 100%-dry design approaches this limit, and there is no advantage to selecting a smaller ITD. For comparison, WorleyParsons assumes that wet-cooled systems can achieve minimum pressures as low as 0.5 psia (0.035 bar).
Figure 6. Determining the optimum ITD for a plant with the Alamosa climate file based on installed
cost per kW.
The ITDs selected above are optimized based on the design-point ambient temperature. Since this temperature is achieved only during a few of the hottest hours of the year, this method may not produce a system with an optimal LCOE. For this reason, WorleyParsons performed a parametric study based on the cost per MWh produced as opposed to cost per kW capacity. That analysis found a broad minima for ITDs from 25°F to 32°F (14°C to 18°C).
Based on the above analysis for Las Vegas and Colorado, WorleyParsons concluded that a 25°F (14°C) ITD was close to optimal for both sites. It should be noted that the 14°C ITD optimum
$8,000
$8,500
$9,000
$9,500
$10,000
$10,500
$11,000
$11,500
$800
$850
$900
$950
$1,000
$1,050
$1,100
$1,150
$1,200
0 10 20 30 40 50
Inst
alle
d C
ost,
$/kw
Inst
alle
d C
ost,
Mill
ion
$
Alamosa, CO site ITD (degF)
Total Installed Cost, million $
Total Installed Cost, $/kw

10
selected by WorleyParsons was based on solar field costs that are higher than the solar industry predicts [6]. Optimum ITD is a function of solar field and ACC cost, and a separate NREL analysis selected higher values for ITD [11]. WorleyParsons also noted the following:
• For a given duty and ITD, ACC manufacturers can reduce the fan parasitic load, at the expense of higher capital cost. Whether this is economically justified depends on the net/gross power metric, labor costs, hours of thermal energy storage (TES), etc.
• The optimization was performed for a trough plant with significant TES. A plant that has little or no TES would likely not warrant as aggressive an ITD because the steam turbine would not be operating at full load as often.
• Steam turbine exhaust selection, which is manufacturer-dependent, is as important as ITD selection and should be done simultaneously. Generally, a longer last-stage blade will improve turbine efficiency, but it will also limit the maximum backpressure the turbine can see. In this way, the turbine exhaust design can be optimized for the selected ITD WorleyParsons optimized the turbine design for each case using generic steam turbine guidelines.
• Spraying the ACC inlet air may be a cost-effective alternative to a hybrid parallel cooling system, depending on hours of operation, ambient conditions, water costs, water analysis, and other factors.
Traditional ACC designs use an ITD in the range of 30°F to 50°F (16°C to 28°C) [5]. The smaller ITD selected here means a more expensive ACC, but it also minimizes the additional solar field and turbine capacity needed to overcome the reduced efficiency of the dry-cooled plant. In a constant-capacity design, this “oversized” ACC combined with the larger solar field and gross turbine size allows the dry-cooled plant to generate more energy on an annual basis. Figure 7 shows the relative impact of the design assumption on subsystem costs and plant output when switching from 100% wet to 100% dry cooling with a 25°F (14°C) ITD. The data come from the Daggett (constant capacity) and Las Vegas (constant heat input) cases described later in this report.
Figure 7. Impact of two different design assumptions on subsystem costs and plant output.
11
As shown in Figure 7, the turbine and solar field are unchanged in the constant heat input design, and design-point performance and annual generation drop due to lower plant efficiency. The power block cost increases in both cases primarily due to the greater cost of an ACC versus a cooling tower. Although the power block cost increase is significant, its impact on installed plant cost is dwarfed by the cost of the larger solar field in the constant-capacity case (note that the installed plant cost of the constant heat input case increases much less than that of the constant-capacity case). This fact drives the rationale to install a large ACC in order to minimize the required increase in solar field.
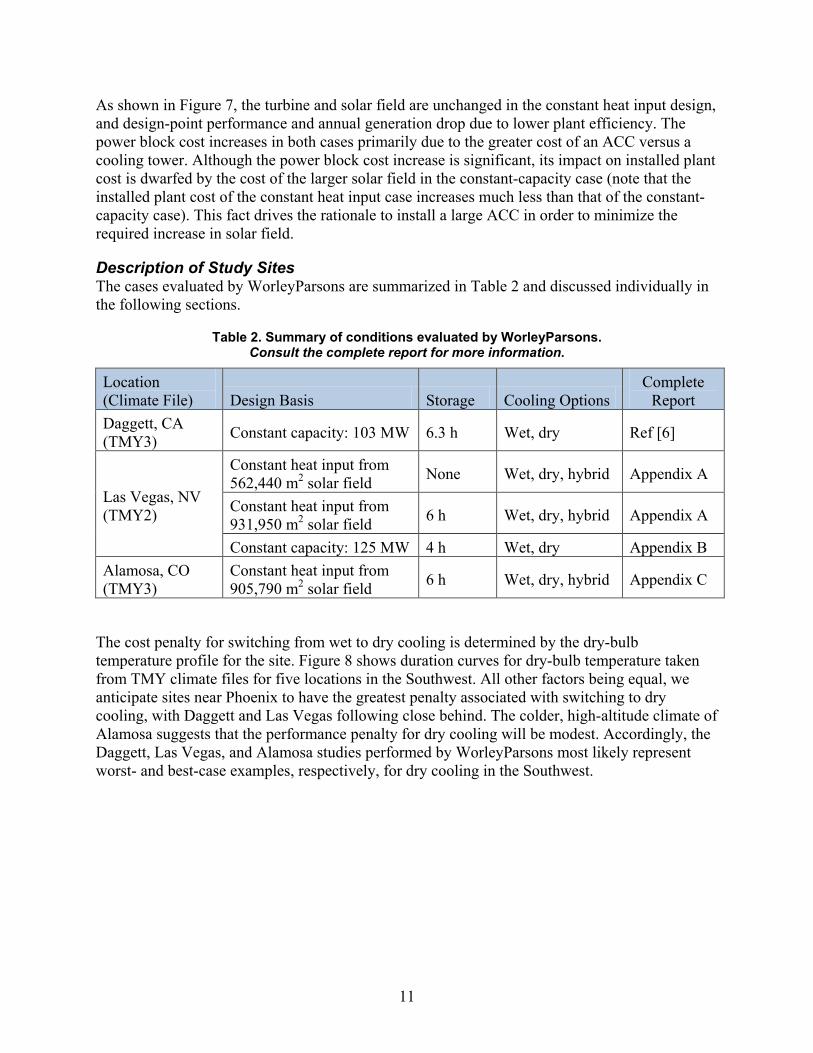
Description of Study Sites The cases evaluated by WorleyParsons are summarized in Table 2 and discussed individually in the following sections.
Table 2. Summary of conditions evaluated by WorleyParsons. Consult the complete report for more information.
Location (Climate File) Design Basis Storage Cooling Options
Complete Report
Daggett, CA (TMY3) Constant capacity: 103 MW 6.3 h Wet, dry Ref [6]
Las Vegas, NV (TMY2)
Constant heat input from 562,440 m2 solar field None Wet, dry, hybrid Appendix A
Constant heat input from 931,950 m2 solar field 6 h Wet, dry, hybrid Appendix A
Constant capacity: 125 MW 4 h Wet, dry Appendix B Alamosa, CO (TMY3)
Constant heat input from 905,790 m2 solar field 6 h Wet, dry, hybrid Appendix C
The cost penalty for switching from wet to dry cooling is determined by the dry-bulb temperature profile for the site. Figure 8 shows duration curves for dry-bulb temperature taken from TMY climate files for five locations in the Southwest. All other factors being equal, we anticipate sites near Phoenix to have the greatest penalty associated with switching to dry cooling, with Daggett and Las Vegas following close behind. The colder, high-altitude climate of Alamosa suggests that the performance penalty for dry cooling will be modest. Accordingly, the Daggett, Las Vegas, and Alamosa studies performed by WorleyParsons most likely represent worst- and best-case examples, respectively, for dry cooling in the Southwest.

12
Figure 8. Dry-bulb temperature duration curves for several Southwest locations.
Daggett, California Site The most extensive WorleyParsons analysis was provided for a trough plant located near Daggett, California. Daggett’s excellent solar resource and proximity to the Solar Electricity Generating Systems (SEGS) plants have made this the traditional site for NREL’s reference power plants. The primary purpose of the Daggett plant analysis was to develop a line-item cost model for the Solar Advisor Model [6]: this analysis assumed a constant-capacity constraint when comparing wet- and dry-cooled configurations. The WorleyParsons contract reports on the wet- and dry-cooled plants are available in reference [6]; the major assumptions and results are summarized below in Table 3.

13
Table 3. Comparison of wet- and dry-cooled parabolic trough plants in Daggett, California.
Design Parameters Wet-Cooled Design
Dry-Cooled Design
% Change
Power Block Net Capacity (MWe) 103 103 0 Thermal Energy Storage at Design Point (hours) 6.3 6.3 0 Design Conditions: DNI (W/m2) 1000 1000 0 Design Conditions: Wet-Bulb Temperature (°C) 21.8 - 0 Design Conditions: Dry-Bulb Temperature (°C) - 42.2 0 Size Parameters Turbine Gross Capacity (MWe) 118 120.5 +2.1% Plant Footprint (acres) 1018 1024 +0.6% Solar Field Area (m2) 987,540 1,062,750 +7.6% Thermal Storage Media (metric tonnes) 62,000 66,800 +7.8% Thermal Storage Size (MWh-t) 1988 2144 +7.8% Output Values Estimated by WorleyParsons Annual Net Electricity Generation (MWh) 426,717 438,790 +2.8% Capacity Factor (Based on 103 MWe Net) 47% 48% +2.8% Annual Water Consumption (m3) 1,530,000
(1240 acre-ft) 114,000
(90 acre-ft) -93%
Design Point Parasitic: HTF Circulation Pumps (MWe)
7.9 8.4 +6%
Design Point Parasitic: Cooling System (MWe) 2.0 3.6 +80% Design Point Parasitic: Total (MWe) 15.0 17.6 +17% Annual O&M Costs $11.8M $11.7M -1% Installed Cost ($M) 1,016 1,098 +8.0% The Daggett analysis shows greater annual generation provided by the dry-cooled plant. The dry-cooled plant produces more energy because the solar field and power block are oversized to maintain design-point generation at high ambient temperatures. At the lower ambient temperatures that characterize much of the year, this combination generates more energy than does the slightly smaller wet-cooled plant. Switching from wet to dry cooling raised plant installed cost by about 8% while supplying 2.8% more energy over the course of the year. The greater generation indicates that the change in LCOE will be less than 8%, although this calculation was not part of WorleyParsons’ scope.
The primary advantage of the dry-cooled system is the dramatic decrease in water consumption. Despite the larger solar field, the plant footprint and O&M costs are virtually unchanged due to elimination of the evaporation ponds and maintenance associated with the wet-cooling tower. Eliminating the evaporation ponds also produces a substantial savings in site improvement costs.

14
The major disadvantage of the dry-cooled plant is the higher installed cost. This elevated cost is due to two factors: (1) the greater cost of an ACC and (2) the requirement of a slightly larger solar field, turbine, and thermal storage system to maintain the design-point capacity in the face of the lower thermal cycle efficiency and greater parasitic losses. Plant parasitics increase by roughly 17% at design point, mostly due to the energy consumption of the cooling fans.
Las Vegas, Nevada Site While the Daggett study was performed primarily as a cost analysis, the later Las Vegas and Alamosa studies were undertaken expressly to examine cooling impacts. At NREL’s request, WorleyParsons examined wet-, dry-, and hybrid-cooled plant configurations for the Las Vegas area; this report is provided as Appendix A. As documented above, an ITD of 25°F (14°C) was selected for the dry-cooled case. The same ACC size was used for the dry and hybrid cases, while the hybrid system's wet-cooling tower was sized at 90% of the full wet-cooled system size. The hybrid-cooled analysis arbitrarily assumed a goal to reduce overall water consumption by 50%. The hybrid system was utilized during the periods of hottest dry-bulb temperatures, moving to lower dry-bulb temperatures until the specified 50% water usage limit was reached. The constant heat input assumption kept the solar field size fixed for all three cooling methods. WorleyParsons examined trough plants with and without thermal energy storage, which entailed two different solar field sizes. The steam turbine design was optimized for the anticipated backpressure from each of the different cooling approaches, and it exhibits slight differences between the cases. The results for the Las Vegas location are summarized in Table 4.
Table 4. Comparison of nominal 100-MW wet, hybrid, and dry cooling cases for the Las Vegas study with constant heat input design assumption.
Parameter (No Storage Case) 100% Wet-Cooled Hybrid Cooling 100% Dry-Cooled
Site Improvements ($) 23,979,000 19,365,000 -19% 16,723,000 -30% Solar Field & HTF System ($) 312,952,000 312,952,000 0% 312,952,000 0% Power Plant & Cooling System ($) 120,949,000 160,680,000 +33% 150,147,000 +24% Total Installed Cost ($) 528,140,000 564,831,000 +6.9% 550,419,000 +4.2% Gross Turbine Efficiency at Design 0.3771 0.3745 -0.7% 0.3576 -5.2% Net Plant Output at Design (MW) 100 98.71 -1.3% 93.11 -6.9% Annual Generation (MWh) 252,055 248,309 -1.5% 240,942 -4.4% LCOE (¢/kWh) * 18.6 19.8 +6.4% 20.1 +8.1%

15
Parameter (6 h Storage Case) Site Improvements ($) 30,941,000 24,442,000 -21% 21,816,000 -30% Solar Field & HTF System ($) 521,895,000 521,895,000 0% 521,895,000 0% Power Plant & Cooling System ($) 121,997,000 162,820,000 +33% 151,913,000 +24% Total Installed Cost ($) 961,123,000 996,843,000 +3.7% 982,085,000 +2.2% Gross Turbine Efficiency 0.3770 0.3744 -0.7% 0.3577 -5.1% Net Plant Output at Design (MW) 100 98.92 -1.1% 92.82 -7.2% Annual Generation (MWh) 396,062 395,070 -0.3% 377,000 -4.8% LCOE (¢/kWh) * 18.4 18.9 +3.2% 19.5 +6.3% * See Appendix A for financial assumptions Although the Daggett and 100-MW Las Vegas studies used different design assumptions, the overall conclusions of switching from 100% wet to 100% dry cooling are consistent. The greatest decrease in plant output occurs at design-point conditions; during the remainder of the year, the impact is less severe. The increase in LCOE for the Las Vegas plant with storage is 6.3%, which is consistent with the Daggett location estimate of less than 8%. The presence of storage helps mitigate the penalty of switching to dry cooling, perhaps because some generation is shifted into periods of lower dry-bulb temperature [7].
The hybrid cooling option reduces water consumption by 50% (as was defined by the analysis) and allows for turbine efficiency and annual generation to remain relatively unchanged. However, this design has the highest installed cost and operational complexity. For plants with storage, the hybrid plant LCOE falls roughly halfway between the wet and dry plant LCOE, whereas there is little LCOE advantage in hybrid cooling for plants without storage. When TOD factors influence revenue, the impact to LCOE is more complex. This issue will be considered in a later section.
WorleyParsons also considered a plant with the Las Vegas TMY2 climate file that had a nominal 125 MW capacity with 4 hours of storage (Table 5). This design was representative of a proposed project in Nevada. Unlike the 100-MW Las Vegas cases above, but consistent with the Daggett study, this design was considered under a constant-capacity assumption. The percent increase in installed cost and annual generation were very similar to those estimated for the Daggett case. The increase in LCOE was only 3.4%, which is much lower than that of the other dry-cooled Las Vegas cases (LCOE was not estimated for Daggett).

16
Table 5. Comparison of 125-MW wet- and dry-cooling cases for Las Vegas, NV study with constant-capacity design assumption.
Parameter (4 h Storage Case) 100% Wet-Cooled 100% Dry-Cooled
Total Installed Cost ($) 997,000,000 1,081,000,000 +8.4% Gross Turbine Efficiency at Design 0.378 0.358 -5.3% Net Plant Output at Design (MW) 125 125 - Annual Generation (MWh) 426,710 438,790 +2.8% LCOE (¢/kWh) * 18.0 18.6 +3.4%
* See Appendix B for financial assumptions
Comparing the Las Vegas cases, WorleyParsons was asked to quantify why the LCOE increase for the dry-cooled plant was 3.4% for the 125-MW/4 h TES case (Table 5) and 6.3% for the ~93-MW/6 h TES case (Table 4). Upon reviewing the data, WorleyParsons reported that several small effects combined to cause most of the difference:
1. Estimated O&M cost savings for the switch from wet to dry cooling were higher for the 125-MW plant.
2. Based on turbine curves, the annual average cycle efficiency of the 125-MW dry-cooled plant was slightly greater than that of the smaller dry-cooled plant, while the converse was true for the two wet-cooled designs. This produced a greater annual penalty for the dry-cooled design for the smaller plants.
3. Turbines and cooling systems scale with an exponent less than 1, while solar field scales linearly. This acts to reduce the influence of power block capital cost differential between larger wet- and dry-cooled plants.
4. The plants with more storage ran at their design capacity for a slightly greater fraction of the year. Dry-cooled plants experience more pronounced parasitic loads at design and thus averaged a slightly lower annual efficiency.
5. Lastly, the 125-MW plant analysis was carried out prior to the 100-MW cases. A more sophisticated algorithm was used in the latter cases, which is believed to have generated slightly better results.
In summary, the differences between the wet- and dry-cooling cases are subtle enough that slight changes in turbine selection and analysis approach can yield what appear to be significant changes in the relative costs. Based on the other cases and the SAM analysis shown later, the 6.3% differential is believed to be more representative of true costs.
Alamosa, Colorado Site The case for Alamosa, Colorado is significantly different from the other two sites because of its colder, high-altitude climate. The dry-bulb temperature rarely exceeds 30°C in Colorado’s San Luis Valley (see Figure 8), suggesting good potential for efficient dry cooling. The WorleyParsons results support this conclusion. Dry cooling is effective, and the hybrid-cooled system (when modeled) is rarely called into service. Under these conditions, it is unlikely that the benefits of the hybrid system justify its additional complexity.

17
Table 6. Comparison of wet-, hybrid-, and dry-cooling cases for the Alamosa, Colorado study.
Parameter (6 h Storage Case) 100% Wet-Cooled Hybrid Cooling 100% Dry-Cooled
Site Improvements ($) 34,501,000 19,616,000 -43% 18,483,000 -46% Solar Field & HTF System ($) 408,587,000 408,587,000 0% 408,587,000 0% Power Plant & Cooling System ($) 106,559,000 141,601,000 +33% 136,348,000 +28% Total Installed Cost ($) 816,524,000 838,653,000 +2.7% 831,798,000 +1.9% Gross Turbine Efficiency at Design 0.3858 0.3837 -0.5% 0.3772 -2.2% Net Plant Output atDesign (MW) 100 98.57 -1.4% 97.16 -2.8% Annual Generation (MWh) 367,602 363,219 -1.2% 361,778 -1.6% LCOE (¢/kWh) * 17.3 17.8 +2.9% 17.7 +2.3% * See Appendix C for financial assumptions
Dry cooling in the Alamosa climate adds only 2% to 3% to the installed cost and LCOE for the trough plant. Despite a weaker solar resource, the estimated installed cost and LCOE for Alamosa are lower than those of Las Vegas due to the lower labor rates associated with the Colorado location.
Water Consumption Figure 9 highlights a comparison of water consumption by the different plant designs considered by WorleyParsons. Switching to dry cooling reduces water consumption by more than 90% as it eliminates the cooling tower. In very hot climates, dry-cooled systems may require a small amount of cooling water to supply low-temperature cooling for turbine components, but this represents less than 0.3% of the original cooling water consumption. Steam-cycle water consumption increases slightly in dry-cooled plants due to the lower plant efficiency, but these effects are overwhelmed by eliminating the cooling tower.
The average water consumption per generation for the wet-cooled plants is 3.5 m3/MWh; for the dry-cooled plants, it is 0.3 m3/MWh. These values can be compared to water consumption at other wet-cooled Rankine cycle plants: about 2.2 m3/MWh for coal and 3.2 m3/MWh for nuclear, assuming closed-loop cooling towers with onsite evaporation ponds [8]. Compared to these plants, water consumption for the trough plants is higher due to lower cycle efficiency and more frequent startup and off-design operation. Lacking any specific site data, WorleyParsons’ assumed a fixed cooling tower cycles of concentration (COC) and water cost for all locations. COC depends on water quality and variations in COC will affect overall water consumption.
Water consumption for hybrid-cooled plants is a direct function of the operating strategy of the plant. Greater use of the wet-cooling tower leads to higher plant efficiency but higher water consumption. In the Las Vegas case, the hybrid plant was arbitrarily designed to reduce water consumption by half, and this strategy resulted in virtually no change in annual generation—

18
albeit at a higher capital cost. In the Alamosa case, the hybrid system was hardly used at all because of effective dry cooling.
Figure 9. Estimated water consumption for the 13 cases.
While water use by utility-scale CSP is an important consideration in plant design, it is interesting to compare CSP with other land-intensive activities. Figure 10 compares utility-scale solar plants to Southwestern agricultural products and golf courses in terms of water consumption [9, 10]. The wet-cooled CSP range includes parabolic trough and power tower technologies. Power towers are at the low end of the given range due to their higher thermal efficiency compared to trough plants. Dry-cooled CSP includes troughs, towers, and dish/engine systems. PV plants use water for panel washing only. In a relative sense, “growing megawatts” uses much less water than growing other commodities. Despite this favorable comparison, all water in the Southwest is precious, and all users should strive to minimize their consumption.

19
Figure 10. Water consumption by different land-intensive activities in the Southwest.
Analysis Using Solar Advisor Model (SAM) NREL’s Solar Advisor Model (SAM) is designed to run hourly simulations covering a full year. SAM was updated in 2010 with a new parabolic trough simulation that incorporates a power block model based more on physical properties and less on empirical curve fits, thereby allowing for better simulation of dry-cooling than previous SAM models. In addition, utility TOD rates are incorporated into the latest release of SAM. These new features were employed to examine the impact of dry cooling on LCOE when TOD rates are in effect.
LCOE is strongly dependent on the financial and incentive assumptions employed by the analyst, so it is critical to know these assumptions when comparing results from different studies. The assumptions used in SAM for the analyses in this report are summarized in Table 7.
Table 7. Financial assumptions used in SAM analysis.
Analysis Period (years) 30 US Investment Tax Credit 30% Inflation Rate 2.5% Federal Depreciation MACRS Real Discount Rate 8% Contingency on Direct Costs 10% Composite Income Tax Rate 40.2% Indirect Costs incl. Sales Tax 24.7%
Annual Insurance 0.5% Debt Fraction 42% Loan Term (years) 20 Minimum Return on Equity 15%
Loan Rate 8% Minimum Debt Service Coverage Ratio 1.4
Debt fraction was set at 42%, a value that minimizes LCOE based on the financial assumptions with the 30% ITC. Lastly, direct costs for SAM analyses follow those for the NREL reference plant as provided in reference [6], Table 3.
0.0
0.5
1.0
1.5
2.0
2.5
3.0
3.5
CSP (wet_cooled)
CSP (dry_cooled)
PV Alfalfa Cotton Fruit Trees Golf Courses
Acr
e-ft
/ a
cre
per
year

20
NREL created SAM cases for each of WorleyParsons’ analyses; a summary comparison is presented in Table 8. The SAM case files used for this report were set up to match the WorleyParsons assumptions as closely as possible—for example, by matching solar field area, storage hours, gross turbine capacity and efficiency, and reference conditions. It is important to note that the turbine design-point efficiency is a function of design-point ambient temperature, approach (or ITD), and reference direct normal radiation. When running SAM simulations, these parameters must be considered a set and should not be independently changed. The SAM code was used to estimate generation, water consumption, and LCOE.
On average, SAM underestimates generation by about 5% compared to WorleyParsons’ results. Agreement is best for the Daggett cases (within about 1%), while the Alamosa and no-storage Las Vegas cases disagree by about 9%. Variation between the two modeling approaches is not unexpected, and the SAM model appears to be slightly more conservative.
SAM’s water use estimates for the wet-cooled Daggett and Las Vegas plants are within 3% of WorleyParsons’ (normalized by estimated generation). SAM’s estimate for the wet-cooled Alamosa plant is about 12% higher than that of WorleyParsons. SAM consistently underestimates WorleyParsons’ water consumption for the dry-cooled plants by about 15% on average. Water estimates for the dry-cooled plants are dominated by mirror washing and steam-cycle makeup. Mirror wash rates are subjective, so some variation is expected. The assumption used in this SAM analysis was 0.6 liters of wash water per square meter of solar field and an annual wash interval of five days (73 washes per year). WorleyParsons’ values for Daggett were 0.81 L/m2 and 63 washes per year. The steam-cycle blowdown fraction was set at 0.023. Dry-cooled plant water use would match WorleyParsons’ value more closely if the SAM defaults for mirror washing and steam-cycle blowdown were increased. Hybrid cooling cases were not modeled with SAM.
The SAM cases predict that switching from wet to dry cooling would raise LCOE by 4.4% to 5.7% depending on location and plant design. The range estimated by WorleyParsons was 2.5% to 7.5%. The low end of the range corresponds to the cooler Alamosa location.

21
Table 8. Summary of the WorleyParsons (WP) results and SAM estimates. SAM values were obtained using the solar field area, turbine
size and efficiency, and design-point temperatures from the WorleyParsons analyses.
Notes:
• Daggett design turbine efficiencies are estimated by NREL and not provided by WorleyParsons.
• SAM generation values use a 100% plant availability to be consistent with WorleyParsons’ assumptions.
• SAM allows 105% turbine operation during TOD period 1 (although TOD periods vary by utility, TOD 1 normally corresponds to summer afternoons).
• WorleyParsons’ LCOE values do not include owner’s project costs or incentives, but assume a higher solar field cost than used by NREL in SAM (see [6]).
LocationDaggett
TMY3Daggett
TMY3Las Vegas
TMY2Las Vegas
TMY2Las Vegas
TMY2Las Vegas
TMY2Las Vegas
TMY2Las Vegas
TMY2Las Vegas
TMY2Las Vegas
TMY2Alamosa
TMY3Alamosa
TMY3Alamosa
TMY3Net Capacity (MW) 103 103 100 98.71 93.11 100 98.92 92.82 125 125 100 98.57 97.16Turbine Gross Capacity (MW) 118 120.5 109.01 108.26 103.38 114.42 113.62 108.57 142.2 145.1 113.9 113.27 111.34Cooling wet dry wet hybrid dry wet hybrid dry wet dry Wet Hybrid DryStorage (hrs) 6.3 6.3 0 0 0 6 6 6 4 4 6 6 6Solar Field Area (m2) 987,540 1,062,750 562,440 562,440 562,440 931,950 931,950 931,950 1,013,700 1,088,910 905,790 905,790 905,790 Design Dry-bulb Temp (C) - 42.2 43.6 43.6 43.6 43.6 - 43.6 29.3 29.3Design Wet-bulb Temp (C) 22 - 23 23 23 23 23.0 - 15.7 15.7Design ITD or Approach (C) 5.6 14 5.6 14 5.6 14 5.6 14 5.6 14Design Turbine Efficiency 0.3753 0.3552 0.3771 0.3745 0.3576 0.377 0.3744 0.3577 0.378 0.358 0.3858 0.3837 0.3772
WP design point parasitics (MW) 15 17.6 17.2 20.1SAM design point parasitics (MW) 14 18 15 21
WP annual Generation (MWh) 426,717 438,790 252,055 248,309 240,942 396,062 395,070 377,000 426,710 438,790 367,602 363,219 361,778 SAM annual Generation (MWh) 421,000 433,000 228,000 - 219,000 377,000 - 360,000 419,000 429,000 339,000 - 329,000
WP annual water use (m3) 1,530,000 114,000 935,000 460,000 75,000 1,470,000 709,000 110,000 1,634,000 128,000 1,134,000 111,000 95,000 SAM annual water use (m3) 1,541,000 100,000 832,000 - 52,000 1,354,000 - 85,000 1,496,000 100,000 1,170,000 - 79,000
WP LCOE (cents/kWh) - - 18.62 19.81 20.12 18.36 18.94 19.52 17.96 18.57 17.27 17.78 17.72SAM LCOE (Real, no TOD) 14.4 15.1 14.5 - 15.4 15.2 - 16.0 14.7 15.6 16.5 - 17.3SAM LCOE (Bid Price, SCE TOD) 12.8 13.5 12.4 - 13.0 13.5 - 14.3 12.8 13.6 14.6 - 15.2SAM LCOE (Bid Price, PG&E TOD) 13.5 14.2 13.6 - 14.4 14.3 - 15.0 13.5 14.3 15.5 - 16.2

22
SAM and WorleyParsons agree that for a constant-capacity design, a dry-cooled plant will produce more annual energy than a wet-cooled plant. Figure 11 illustrates how a dry-cooled plant can generate more energy over the course of a year. The data are taken from SAM simulations of the constant-capacity Daggett cases. The top chart shows a summer day when the plant is running at design-point conditions on a hot afternoon. Note that the dry plant efficiency is more affected than the wet plant by the high temperature of the afternoon. As intended by the constant-capacity design, generation on this date is virtually identical: 1806 MWh for the wet plant and 1803 MWh for the dry plant. In contrast, on a March date when ambient temperatures do not approach the design points, dry plant efficiency is only slightly impacted by daily temperature. On this date, the dry plant output of 1573 MWh exceeds the wet plant output of 1552 MWh. Because the design-point temperatures occur only a few days per year, the dry plant produces slightly more energy over the course of the year.
Figure 11. SAM simulations of a summer day at design point (top) and a spring day at lower ambient temperatures (bottom) for wet- and dry-cooled plants. Constant-capacity design is
assumed, i.e., the dry plant has a larger turbine and solar field to accommodate the lower cycle efficiency.
0.30
0.32
0.34
0.36
0.38
0.40
0.42
0
20
40
60
80
100
120
1 2 3 4 5 6 7 8 9 10 11 12 13 14 15 16 17 18 19 20 21 22 23 24
Pow
er B
lock
Gro
ss C
ycle
Eff
icie
ncy
Plan
t Net
Out
put (
MW
)
July Day - Design Point Conditions
Wet Plant Net Output (MW)
Dry Plant Net Output (MW)
Wet Plant Cycle Efficiency
Dry Plant Cycle Efficiency
0.30
0.32
0.34
0.36
0.38
0.40
0.42
0
20
40
60
80
100
120
1 2 3 4 5 6 7 8 9 10 11 12 13 14 15 16 17 18 19 20 21 22 23 24
Pow
er B
lock
Gro
ss C
ycle
Eff
icie
ncy
Plan
t Net
Out
put (
MW
)
March Day
Wet Plant Net Output (MW)
Dry Plant Net Output (MW)
Wet Plant Cycle Efficiency
Dry Plant Cycle Efficiency

23
Impact of Time-of-Delivery (TOD) Rates on Dry-Cooled Plant Revenue Many utilities offer varying rates for power based on when the power is produced. SAM allows users to input these TOD schedules and dispatch generation based on them. By tracking energy generation during each TOD period and applying TOD allocation factors, one can determine the revenue associated with each TOD period. Because several California utilities offer favorable TOD allocation factors for summer afternoons, solar plants in those locations receive a disproportionate amount of their revenue during the summer.
While summer-weighted TOD rates are generally favorable for solar plants, the relative penalty for dry cooling may be exacerbated by heavily weighted peak generation rates. To examine this possibility, SAM was used to compare the change in generation and revenue for plants in Daggett and Alamosa when switched from wet to dry cooling. The 2009 TOD rate schedules for Southern Cal Edison (SCE) and Pacific Gas & Electric (PG&E) were applied. The results presented in Table 8 show the change in generation by TOD periods due to the switch to a dry-cooled plant for an SCE schedule, which represents the most extreme TOD rates. For Alamosa, annual revenue falls 0.15% more than annual generation, while for the more challenging climate of Daggett, annual revenue lags annual generation by 0.43%. The observed differences were lesser for the PG&E TOD schedule. In the SAM simulations, the steam turbine is allowed to run at up to 105% of its design rating during TOD period 1 (summer weekday afternoons). Overdesign operation during this period allows the plant to maximize production—and revenue—during periods of highest demand. When overdesign operation was not allowed, the TOD schedules had a greater impact on relative revenue, but the difference was still less than 0.5%.
Table 9. Change in generation by TOD period and the resulting impact on annual revenue resulting from the switch from wet to dry cooling, assuming Daggett and Alamosa climates using the TOD schedule for SCE. The Daggett cases assume constant capacity while the Alamosa cases
assume constant heat input design (See Table 2).
Daggett, CA Alamosa,
CO
TOD Period
TOD Allocation
Factor Generation Change (%)
Generation Change (%)
1 3.13 1.04 -3.28 2 1.35 2.14 -3.06 3 0.75 2.15 -0.94 4 1.00 3.26 -3.20 5 0.83 4.26 -3.39 6 0.61 No gen. No gen. Annual Generation 2.79% -2.87% Annual Revenue 2.36% -3.02%
Figure 12 depicts the relative impact of changing cooling method and TOD schedule for the Alamosa and Daggett cases. On this figure, a value of 1.0 corresponds to the estimated annual generation or revenue for the wet-cooled plant with no TOD rates. For Alamosa, a dry-cooled plant of the same solar field size experiences a drop in annual generation due to its lower

24
efficiency. With no TOD rates, the drop in revenue exactly matches the drop in generation. Two points are significant: (1) in all cases, the TOD schedules result in an increase in revenue by favoring afternoon generation that coincides with solar availability, and (2) dry-cooling has 2.9% lower revenue versus wet cooling with or without TOD rates.
The Daggett plant conclusions are similar, but a slight additional penalty is seen in the dry-cooled case with TOD rates for this climate. Whereas the revenue increase is 2.8% without TOD rates, it ranges from only 2.4% (SCE) to 2.6% (PG&E) with TOD rates. For both studies, the SAM runs allow 105% turbine operation during TOD 1; the dry-cooling penalty would be slightly greater without this assumption.
Figure 12. Relative generation or revenue as a function of cooling type and TOD schedule for
Alamosa (top) and Daggett (bottom) cases. The scale is relative to the wet-cooled, no TOD, values estimated by SAM.
1.000 1.000
1.2891.224
0.971 0.971
1.2511.189
0.800
0.900
1.000
1.100
1.200
1.300
1.400
Generation Revenue: No TOD Rates Revenue: SCE Rates Revenue: PG&E Rates
Rel
ativ
e G
en. o
r Rev
enue
Alamosa, CO location (constant heat input design assumption)
Wet Dry
1.000 1.000
1.2671.209
1.028 1.028
1.2971.240
0.800
0.900
1.000
1.100
1.200
1.300
1.400
Generation Revenue: No TOD Rates Revenue: SCE Rates Revenue: PG&E Rates
Rel
ativ
e G
en. o
r Rev
enue
Daggett, CA location (constant capacity design assumption)
Wet Dry

25
Conclusions Water consumption for electric power generation is undergoing increasing scrutiny, and more emphasis is being placed on low-water-use technologies. For Rankine-cycle power plants such as those used in parabolic trough and power tower CSP systems, dry cooling offers the potential to reduce water consumption by over 90%. Hybrid cooling (i.e., parallel wet/dry) uses water during hot periods when dry cooling is less efficient to trade some water use for increased generation efficiency. WorleyParsons analyzed 13 different cases covering three different geographic locations and wet, dry, and hybrid cooling technologies to assess the performance, cost, and water use impacts of the transition from a wet to a dry or hybrid cooling system. NREL developed SAM cases for each scenario to allow for hourly modeling and provide comparison of SAM and WorleyParsons model results. The analysis led to the following conclusions:
• Two general design approaches can be employed when comparing alternative cooling systems: maintaining a constant plant capacity or maintaining a constant heat input (i.e., constant solar field size). The former is more representative of how developers and utilities would compare plant designs, while the latter better isolates the impact that the cooling system has on plant performance.
• For a constant-capacity plant assumption, 100% dry cooling increases capital cost by approximately 8%. The designer must balance the cost of the ACC versus the additional solar field, storage, and turbine capacities that are needed to maintain design-point power output. Due to the relatively high cost for additional solar field, a larger ACC (smaller ITD) than typical is recommended. WorleyParsons utilized an ITD of 14°C in these analyses. While the general ACC sizing rule is valid, studies using different solar field and ACC costs are optimized at higher ITD values [11].
• Constant-capacity designs yield an increase in annual generation for the dry-cooled case. This increase results from the good performance of the larger solar field and turbine during periods of lower dry-bulb temperature.
• The switch to dry cooling in the constant-capacity Daggett case caused no change in plant land usage. The larger solar field size was offset by elimination of the cooling tower evaporation ponds. Land area was not estimated for the other cases.
• The switch to dry cooling reduces annual O&M costs because maintenance costs for the ACC are less than the costs of water and water treatment for the wet cooling system.
• For a constant heat input assumption, 100% dry cooling increases capital cost approximately 2% to 4%, primarily due to the more expensive cooling system. Under this assumption, annual generation of the dry-cooled plant is about 2% to 5% lower than for the wet-cooled plant.
• For climates with dry-bulb temperatures exceeding 40°C, such as southern California and Nevada, WorleyParsons estimates the switch from wet to dry cooling increases the LCOE by approximately 3.5% to 7.5%. The increase for the relatively cool Colorado climate was only 2.5%. Thermal energy storage helped reduce the dry cooling penalty.

26
• SAM estimates the percent increase in LCOE from the switch from wet to dry cooling to be 4.5% to 5.7%, with the low end corresponding to the Alamosa location.
• Hybrid cooling economics looked best for the Las Vegas case with storage and had no benefit for the Alamosa case. It is likely that application of TOD rates will improve hybrid cooling economics, although this was not evaluated in the current study (see [11]).
• TOD schedules had only a minor impact on the economics of dry cooling.
In summary, these findings indicate that switching from 100% wet to 100% dry cooling will result in LCOE increases of approximately 3% to 8% for parabolic trough plants throughout most of the Southwest. In all cases, the transition to dry cooling will reduce water consumption by over 90%. The remaining water consumption is split between steam-cycle blowdown and mirror washing. Hybrid cooling can reduce the LCOE increase, but at higher capital cost. A more detailed analysis of hybrid cooling is provided in [11].
References [1] SolarPACES project lists available at http://www.nrel.gov/csp/solarpaces/
[2] Energy Demands on Water Resources, Report to Congress on the Interdependency of Energy and Water, U.S. Department of Energy, December 2006.
[3] Concentrating Solar Power Commercial Application Study: Reducing Water Consumption of Concentrating Solar Power Electricity Generation, Report to Congress, U.S. Department of Energy, 2009.
[4] Kelly, B., “Nexant Parabolic Trough Solar Power Plant Systems Analysis, Task 2: Comparison of Wet and Dry Rankine Cycle Heat Rejection,” Subcontract Report, NREL/SR-550-40163, July 2006.
[5] Wet & Dry Cooling Options for a 250 MW Solar Thermal Plant, PG&E Concentrating Solar Power Engineering Services, Prepared by: WorleyParsons Group, Inc., 2006.
[6] Turchi, C., “Parabolic Trough Reference Plant for Cost Modeling with the Solar Advisor Model (SAM),” Technical Report, NREL/TP-550-47605, July 2010.
[7] Sioshansi, R., and P. Denholm, “The Value of Concentrating Solar Power and Thermal Energy Storage,” National Renewable Energy Laboratory, NREL-TP-6A2-45833, February 2010.
[8] Klara, J., “Cost and Performance Baseline for Fossil Energy Plants,” DOE/NETL-2007/1281, Volume 1: Bituminous Coal and Natural Gas to Electricity, Revision 1, August 2007.; Water Requirements for Existing and Emerging Thermoelectric Plant Technologies, DOE/NETL-402/080108, April 2009.
[9] Blaney, H.F., “Monthly Consumptive Use of Water by Irrigated Crops and Natural Vegetation,” General Assembly of International Union of Geodsy and Geophysics, Toronto, Canada, 1957.

27
[10] Consumptive Use of Water by Major Crops in the Southwestern United States, United States Department of Agriculture, ARS Conservation Research Report 29, May 1982.
[11] Wagner, M.J., and C.F. Kutscher, “Assessing the Impact of Heat Rejection Technology on CSP Plant Revenue, SolarPACES 2010, Perpignan, France, September 21-24, 2010.
Acknowledgements The authors wish to thank the staff of WorleyParsons Group for their assistance with the original reports and subsequent questions. Engineers who assisted with the work included Ryan Bowers, Gary Aron, Dylan Ross, Robert Pieksma, and Rodney Gartner.

28
Appendix A Analysis of Wet, Dry, and Parallel Condensing Parabolic Trough Power Plants with Fixed Solar Heat Input WorleyParsons Group NREL-2-ME-REP-0003 October 19, 2009

Analysis of Wet, Dry, and Parallel Condensing Parabolic Trough Power Plants with Fixed Solar Heat Input NREL Task 2, Subtask 1&2 Draft Report NREL-2-ME-REP-0003 Rev 0
Prepared for: National Renewable Energy Lab
Prepared by: WorleyParsons Group, Inc.
1687 Cole Blvd, Suite 300 Golden, Colorado 80401 USA
October 19, 2009
29

NOTICE The information presented in this document was compiled and interpreted exclusively for the purposes stated in the document introduction. WorleyParsons provided this report for NREL solely for the purpose noted above. WorleyParsons has exercised reasonable skill, care, and diligence to assess the information acquired during the preparation of this report, but makes no guarantees or warranties as to the accuracy or completeness of this information. The information contained in this report is based upon, and limited by, the circumstances and conditions acknowledged herein, and upon information available at the time of its preparation. The information provided by others is believed to be accurate but cannot be guaranteed. WorleyParsons does not accept any responsibility for the use of this report for any purpose other than that stated in the document introduction and does not accept responsibility to any third party for the use in whole or in part of the contents of this report. Any alternative use, including that by a third party, or any reliance on, or decisions based on this document, is the responsibility of the alternative user or third party. No part of this publication may be reproduced, stored in a retrieval system or transmitted, in any form or by any means, electronic, mechanical, photocopying, recording or otherwise, without the prior permission of WorleyParsons. Any questions concerning the information or its interpretation should be directed to Rod Gartner, Project Manager.
30

TABLE OF CONTENTS 1. INTRODUCTION ............................................................................................................................ 4 2. DESIGN ASSUMPTIONS AND METHOD ..................................................................................... 4 3. CAPITAL COSTS ......................................................................................................................... 13 4. PERFORMANCE .......................................................................................................................... 15 5. WATER CONSUMPTION ............................................................................................................. 25 6 LEVELIZED COST OF ELECTRICITY ANALYSIS ..................................................................... 28 7 CONCLUSIONS AND RECOMMENDATIONS ............................................................................ 29
31

4
1. INTRODUCTION
The United States Department of Energy’s National Renewable Energy Laboratory (NREL) has elected WorleyParsons to determine the relative economic differences between similar Concentrating Solar Power (CSP) parabolic trough plants with varying cooling and storage designs. The base case is a 100 MWe net with a 100% wet condensing system while two alternate cases, having the same solar field size, utilize a 100% dry condensing system and a parallel wet/dry condensing system. These three cases are evaluated with 6 hours of thermal energy storage (TES) and no storage. Two sets of solar data were evaluated for the selected Nevada Test Site near Las Vegas. The goal of this study is to assist CSP plant developers in selecting an appropriate condensing system for their project based on water availability and levelized cost of electricity (LCOE). For each design case, WorleyParsons will provide overnight direct capital and reoccurring operations and maintenance (O&M) costs based on a preliminary engineering design effort which altogether yields a relative estimate accuracy of ±30%.
2. DESIGN ASSUMPTIONS AND METHOD
2.1 Ambient Conditions
Heat balance modeling requires design and off-design ambient conditions. The design conditions (see Table 2.1 below) are used to physically size the Rankine cycle equipment whereas the off-design conditions are used to model the performance of the plant while varying weather and turbine load. The design temperatures selected are the highest monthly 2% frequency dry and wet bulb temperatures for July and August. Historically these temperatures were exceeded 2% of the time. Table 2.1.1 Design conditions for Nellis Air Force Base, NV (2005 ASHRAE Handbook)
Parameter Units Value Elevation Above Sea Level ft 1880 Standard Atmospheric Pressure psia 13.725 Design Dry Bulb Temperature °F 109.8 Design Wet Bulb Temperature °F 72.8
Off-design ambient temperatures are extracted from a Class A Typical Metrological Year (TMY) 2 data file for Las Vegas, NV (WBAN No. 23169). This dataset provided hourly dry/wet bulb temperatures and solar radiation for a complete year which were ultimately used in performance modeling to arrive at the results. The application of the off-design temperatures is discussed later in the report. The 8760 hour dry bulb temperature data ranged from 24°F to 112°F. The temperature range across which SAM simulated operation of the steam turbine ranged from 38°F to 112°F. The figures 2.1.1 through 2.1.3 are scatter plots of 8760 hour dry bulb and coincident wet bulb temperatures. Figure 2.1.1 and 2.1.2 include overlays of plots of the hours during which the steam turbine is operating for the designs with and without Thermal Storage. Figure 2.1.3 includes an overlay of a plot of when the solar field is exporting heat.
32

5
Figure 2.1.1 Coincident power block operation with No TES depicted.
Dry Bulb & Coincident Wet Bulb TemperaturesPower Block Operation Shown For 100MW net CSP Trough Plant
Las Vegas, NV (TMY2 Data)
10
15
20
25
30
35
40
45
50
55
60
65
70
75
80
10 15 20 25 30 35 40 45 50 55 60 65 70 75 80 85 90 95 100 105 110 115 120
Dry Bulb Temperature (F)
Coin
cide
nt W
et B
ulb
Tem
pera
ture
(F)
UnfilteredPwr Blk Oper
33

6
Figure 2.1.2 Coincident power block operation with 6 hours of TES depicted.
Dry Bulb & Coincident Wet Bulb TemperaturesPower Block Operation Shown For 100MW net CSP Trough Plant with 6 hrs TES
Las Vegas, NV (TMY2 Data)
10
15
20
25
30
35
40
45
50
55
60
65
70
75
80
10 15 20 25 30 35 40 45 50 55 60 65 70 75 80 85 90 95 100 105 110 115 120
Dry Bulb Temperature (F)
Coin
cide
nt W
et B
ulb
Tem
pera
ture
(F)
UnfilteredPwr Blk Oper
34

7
Figure 2.1.3 Coincident solar field operation with 6 hours of TES depicted.
Dry Bulb & Coincident Wet Bulb TemperaturesSolar Field Operation Shown For 100MW net CSP Trough Plant
Las Vegas, NV (TMY2 Data)
10
15
20
25
30
35
40
45
50
55
60
65
70
75
80
10 15 20 25 30 35 40 45 50 55 60 65 70 75 80 85 90 95 100 105 110 115 120
Dry Bulb Temperature (F)
Coin
cide
nt W
et B
ulb
Tem
pera
ture
(F)
UnfilteredSolar Field Oper
35

8
Figure 2.1.4 illustrates the number of hours and the percent occurrence of 5 degree interval dry bulb temperatures from the 8760 hourly data. Figure 2.1.4
Annual Hours & Frequency of Dry Bulb Temperatures at 5 Degree RangesLas Vegas, Nevada, USA
0
100
200
300
400
500
600
700
800
900
1000
1100
25 30 35 40 45 50 55 60 65 70 75 80 85 90 95 100 105 110
Dry Bulb Temperature (F)
Hou
rs o
f Ann
ual O
ccur
ance
(hou
rs)
0%
1%
2%
3%
4%
5%
6%
7%
8%
9%
10%
11%
Freq
uenc
y of
Ann
ual O
ccur
ance
(%)
HoursFrequency
36

9
Figure 2.1.5 illustrates the number of hours of 5 degree interval dry bulb temperatures from the 8760 hourly data and the average coincident wet bulb temperature associated with each dry bulb interval. Figure 2.1.5
Annual Hours of Dry Bulb and Average Coincident Wet Bulb Temperaturesin 5 Degree Ranges
Las Vegas, Nevada, USA
0
100
200
300
400
500
600
700
800
900
1000
1100
25 30 35 40 45 50 55 60 65 70 75 80 85 90 95 100 105 110
Dry Bulb Temperature (F)
Hou
rs o
f Ann
ual O
ccur
ance
(hou
rs)
0
10
20
30
40
50
60
70
Coi
ncid
ent W
et B
ulb,
°F
HoursCoincident Wet Bulb
2.2 Wet Condensing
The wet condensing system consists of a steam surface condenser, circulating water pumps, an induced draft counter-flow cooling tower, and an underground & aboveground interconnecting pipe network. This type of condensing system allows for the lowest steam turbine operating back pressure and efficiency, at the expense of increased water consumption. The wet condensing system was modeled to utilize these advantages and was not configured with a higher backpressure similar to that of the dry systems to conserve water. The intent is to illustrate the impact of the increased performance of a wet condensing system on water consumption. The operation of the 100% wet condensing system was modeled to reduce steam turbine backpressure and maximize output as the ambient temperatures dropped rather than to minimize water consumption by operating the steam turbine at a higher back pressure. The cooling tower operation was modeled with 4 cycles of concentration. Without having site specific information, it is assumed that no pre or post water treatment is needed.
37

10
2.3 Dry Condensing
The dry condensing alternative utilizes an air cooled condenser (ACC) to cool the exhaust steam using a large array of fans that force air over finned tube heat exchangers. The heat is rejected directly to the atmosphere and no external water supply is needed for condensing the steam cycle exhaust steam. The initial temperature difference (ITD) is defined as the difference between the ambient air temperature at the design point and the steam condensation temperature within an ACC. The smaller the ITD, the more aggressive the design resulting in better steam turbine generator (STG) backpressure but at a higher capital and fan power consumption cost. An ITD of 25 °F was used in this study as a preliminary investigation suggests that this design is close to optimal in terms of cost vs. net plant generation for the proposed CSP plant. The operation of a 100% dry condensing system was modeled to minimize condensing pressure and maximize steam turbine output as ambient temperatures decreased.
2.4 Parallel Condensing
The parallel condensing system is a combination of wet and dry condensing systems. The steam turbine exhaust branches near the turbine exit and a duct runs to each condensing system. The steam flow naturally splits in proportion to the available condensing capacity of each system at the time. A parallel system is more expensive than a wet system and can be more expensive than a dry system depending on the design capacity of the parallel system. The goal of this study was to maximize the performance of the plant so the same size ACC was used for the parallel system as was used on the all dry system. The wet condensing portion is approximately 90% that of the all wet design. This large capacity wet portion allows the use of an efficient low back pressure steam turbine and the large ACC allows the wet system and corresponding water consumption to be curtailed as soon as possible with falling dry bulb temperatures. The operation of the parallel system was modeled to maximize performance at the expense of water consumption. The advantage of this system is that it can be operated with minimal water consumption at the expense of power production.
2.5 Solar Field Designs
Two solar field sizes were fixed throughout this study. One solar field size collects approximately 930 MWth of solar energy to output 100 MWe net to the grid with a 100% wet condensing Rankine power cycle with 6hrs of thermal energy storage. The other solar field collects 561 MWth for the same wet condensing design but without thermal energy storage. These same two solar field designs were used to evaluate the performance of the 100% dry and parallel condensing designs with and without thermal storage. Thus the heat input to steam cycles was the same for all the condensing designs utilizing thermal storage. Likewise the heat input to the steam cycles without thermal storage was the same for the three condensing designs but different than that for the designs with thermal storage.
2.6 Sizing Criteria
The steam turbine exhaust sections for all three condensing designs were optimized to minimize the exhaust losses at full load conditions. The steam turbine in the wet and parallel condensing designs, which operates at a lower back pressure, utilized an exhaust design with a larger 33.5” last stage blade length and corresponding annulus area than the dry condensing design which had the least exhaust losses with a smaller 26” last stage blade. The steam turbine inlet temperature and pressure was the same for all 6 designs. This modeling was done based on
38

11
WorleyParsons’ long term power plant experience and knowledge base, utilizing available steam turbine technology, but not tied to specific vendor design data.
The criteria in the following tables were used to size and estimate the costs of the three condensing systems for both the 6 hour thermal storage designs and the non thermal storage designs.
Table 2.6.1 Rankine cycle sizing criteria at design conditions for plants with TES.
Parameters Units Wet Parallel Dry Steam Turbine Exhaust Enthalpy Btu/lb 988.97 992.47 1018.8
Steam Turbine Exhaust Flow lb/hr 705,841 707,905 722,293
Steam Turbine Exhaust Back Pressure Inches HgA 1.28 1.40 2.53
Air Cooled Condenser Duty MMBtu/hr n/a 65 662
Cooling Tower Duty MMBtu/hr 646 584 n/a
Circulating Water Flow Rate gpm 64,500 58,200 n/a
Cooling Tower Approach °F 10 10 n/a
Cooling Tower Range °F 20 20 n/a
Condenser Terminal Temperature Difference (TTD) °F 7 10.5 n/a
Table 2.6.2 Rankine cycle sizing criteria at design conditions for plants with no TES.
Parameters Units Wet Parallel Dry Steam Turbine Exhaust Enthalpy Btu/lb 988.73 992.66 1018.82
Steam Turbine Exhaust Flow lb/hr 672,420 674,480 688,092
Steam Turbine Exhaust Back Pressure Inches HgA 1.28 1.40 2.53
Air Cooled Condenser Duty MMBtu/hr n/a 62 631
Cooling Tower Duty MMBtu/hr 616 556 n/a
Circulating Water Flow Rate gpm 61,400 55700 n/a
Cooling Tower Approach °F 10 10 n/a
Cooling Tower Range °F 20 20 n/a
Condenser Terminal Temperature Difference (TTD) °F 7 10.1 n/a
39

12
2.7 Method
Using the criteria given above, budgetary vendor cost and performance quotes for the cooling tower, ACC, surface condenser and steam turbine were obtained in order to determine impact on performance, capital cost, auxiliary loads, water consumption, and ultimately LCOE.
The performance portion of this study is necessary to arrive at a LCOE. Net plant output and water consumption are the primary performance inputs to an LCOE model. These parameters were estimated using four different calculation tools which ultimately were driven by three inputs: ambient dry bulb, ambient wet bulb, and steam cycle heat input.
Hourly ambient dry/wet bulb temperatures were obtained from the TMY2 weather dataset for Las Vegas NV, which also provided direct normal insolation (DNI) data used in NREL’s Solar Advisor Model (SAM). This SAM software provided the steam cycle heat input, also referred to as thermal energy to the power block (Q_PB), as well as thermal energy to storage (Q_to_ts) and thermal energy from storage (Q_from_ts). GateCycle was used to model the Rankine cycle behavior and initially determined the plant’s design point conditions. A unique GateCycle model was developed for the three condensing types. Several off-design heat balance models were independently run varying dry-bulb temperature, wet-bulb temperature, and steam cycle heat input. Model results were compiled and numerically fit into a three-variable interpolative lookup functions using Microsoft Excel tools to arrive at the various plots and tables presented herein.
Using this all-inclusive Excel spreadsheet, the inputs and equations were used to obtain cooling tower water makeup for every hour of a typical year. This same methodology was used to produce steam turbine electric gross output and Rankine cycle parasitic loads per hour. Solar system parasitic loads (i.e. HTF pumps, TES pumps, SCA drives, etc.) were calculated based on hourly heat input to the steam cycle, and heat input/output from the thermal energy storage (TES) system. The HTF pumps and TES pumps were assumed to be variable speed or variable frequency driven.
The results of the evaluation are presented in the following sections.
40
13
3. CAPITAL COSTS Capital costs have been determined using a combination of vendor budgetary proposals and WorleyParsons’ equipment, commodity, and installation labor database. The capital costs are within a +/- 30% confidence range based on a conceptual engineering effort.
The results illustrate the differences in capital cost between the wet, dry, and parallel condensing designs. The solar field effective mirror aperture area increased from 562,440 m2 without thermal storage to 931,950 m2 with thermal storage. The thermal energy storage, solar field civil-site work, balance of plant mechanical/electrical, HTF system, electrical, instrumentation/controls and all other cost items which makeup a complete CSP plant were adjusted as necessary in each design to accommodate the condensing system and thermal storage impacts.
The thermal energy storage equipment cost is based on a turnkey budgetary quote from the single commercially available salt storage vendor. An alternative cost savings approach would be to estimate the storage system from the ground up and compile vendor quotes for each sub-component (tanks, pumps, HX, etc.).
NREL has selected a 2.0 solar multiple. The solar multiple has a significant capital cost impact and is subject to the project developer's financial model.
Cost reflects NREL's selected 150-meter trough design. This trough is the most proven design with the most utility-scale installations; however, the associated materials and labor costs are higher than alternative emerging designs (i.e. 100-meter trough, or SkyFuel’s SkyTrough)
Labor rates are union-based for Las Vegas, Nevada with a productivity factor of 1.2. Alternatively, merit-shop based labor rates can significantly reduce costs.
3.1 Vender Quotes
WorleyParsons’ obtained budgetary quotes for the cooling tower, surface condenser, and air-cooled condenser. All other equipment and materials included in the makeup of a complete CSP trough plant were priced based on WorleyParsons’ extensive archive of past vendor quotes and previously constructed projects.
The following tables are a summary of the complete cost analysis showing the line items that build up the overall total installed capital cost for the 3 condensing options different options with and without thermal storage.
41

14
Table 3.1.1 Estimated capital cost summary for wet, parallel, and dry condensing plants with 6 hours of Thermal Storage.
Case 100% Wet Parallel 100% Dry Description 100% Wet-Cooled Parallel Case 100% Dry Cooled
Site Improvements $ 30,941,000 $ 24,442,000 $ 21,816,000 Solar Field $ 434,392,000 $ 434,392,000 $ 434,392,000 HTF System $ 87,503,000 $ 87,503,000 $ 87,503,000 Thermal Energy Storage $ 187,100,000 $ 187,100,000 $ 187,100,000 Fossil Backup $ - $ - $ - Power Plant $ 121,997,000 $ 162,820,000 $ 151,913,000 EPCM Costs $ 29,001,000 $ 29,001,000 $ 29,001,000 Project, Land, Misc. $ - $ - $ - %DC's Sales Tax Applies $ - $ - $ - Subtotal $ 890,934,000 $ 925,258,000 $ 911,725,000 Contingency $ 70,189,000 $ 71,585,000 $ 70,360,000
TOTAL INSTALLED COST $ 961,123,000 $ 996,843,000 $ 982,085,000
Table 3.1.2 Estimated capital cost summary for wet, parallel, and dry condensing plants with No Thermal Storage.
Case 100% Wet Parallel 100% Dry Description 100% Wet-Cooled Parallel Case 100% Dry Cooled
Site Improvements $ 23,979,000 $ 19,365,000 $ 16,723,000 Solar Field $ 264,585,000 $ 264,585,000 $ 264,585,000 HTF System $ 48,367,000 $ 48,367,000 $ 48,367,000 Thermal Energy Storage $ - $ - $ - Fossil Backup $ - $ - $ - Power Plant $ 120,949,000 $ 160,680,000 $ 150,147,000 EPCM Costs $ 29,001,000 $ 29,001,000 $ 29,001,000 Project, Land, Misc. $ - $ - $ - %DC's Sales Tax Applies $ - $ - $ - Subtotal $ 486,881,000 $ 521,998,000 $ 508,823,000 Contingency $ 41,259,000 $ 42,833,000 $ 41,596,000
TOTAL INSTALLED COST $ 528,140,000
$ 564,831,000
$ 550,419,000
42

15
4. PERFORMANCE This section provides data tables and plot illustrations of the performance results for all cases. Fixing the solar heat input to the steam cycle for the base and alternate cases allowed for a more direct comparison of the costs and performance.
For the designs with thermal storage, SAM sends the solar energy to storage until there is enough energy to operate the steam turbine at or near full load, after which the energy is sent to the power block. If thermal storage is not present, SAM operates the steam turbines at lower load points to avoid wasting energy. This is illustrated in Figures 4.0.1 and 4.0.2 below which shows the operating hours of the steam turbines at various load points. The steam turbine minimum operating load without thermal storage is 20 MWe whereas with thermal storage it is 70 MWe (Note:The parallel operation is very close to the wet operation and is not visible on these small charts).
Figure 4.0.1
Annual Hours of Net Generation at 5MWe Ranges100MWe Nominal Net CSP Trough Plant with No TES
Nevada, USA
0
500
1000
1500
2000
2500
10 15 20 25 30 35 40 45 50 55 60 65 70 75 80 85 90 95 100 105
Net Electric Generation (MWe)
Ope
ratio
n w
ithin
Net
Gen
erat
ion
Ran
ge (h
ours
)
Wet CondensingDry CondensingParallel Condensing
43

16
Figure 4.0.2
Annual Hours of Net Generation at 5MWe Ranges100MWe Nominal Net CSP Trough Plant with 6 Hrs TES
Nevada, USA
0
500
1000
1500
2000
2500
10 15 20 25 30 35 40 45 50 55 60 65 70 75 80 85 90 95 100 105 110 115
Net Electric Generation (MWe)
Ope
ratio
n w
ithin
Net
Gen
erat
ion
Ran
ge (h
ours
)
Wet CondensingDry CondensingParallel Condensing
4.1 Performance Results
Tables 4.1.1 and 4.1.2 summarizes the performance results for the wet, dry, and parallel condensing designs with and without thermal storage.
Table 4.1.1 Nevada Site Performance Summary with 6 hrs of thermal storage.
Performance Results Wet Parallel Dry Solar Input to Collector Field (MWth) 930.45 930.45 930.45 Design Steam Cycle Thermal Input (MWth) 303.49 303.49 303.49 Design Gross Steam Turbine Output (MWe) 114.42 113.62 108.57 Design Plant Parasitic Losses (MWe) 14.42 14.70 15.75 Plant Net Output (MWe) at Design Conditions 100 98.92 92.82 Design Gross Steam Turbine Efficiency (%) 37.70 37.44 35.77 STG Gross Annual Generation (MWe-hrs/yr) 429,320 427,190 411,927 Plant Net Annual Generation (MWe-hrs/yr) 396,062 395,070 377,000 Annual Backfeed Electricity (MWe-hrs/yr) 3,283 3,283 3,283
44

17
Table 4.1.2 Nevada Site Performance Summary with no thermal storage.
Performance Results Wet Parallel Dry Solar Input to Collector Field (MWth) 561.25 561.25 561.25 Design Steam Cycle Thermal Input (MWth) 289.08 289.08 289.08 Design Gross Steam Turbine Output (MWe) 109.01 108.26 103.38 Design Plant Parasitic Losses (MWe) 9.01 9.55 10.27 Plant Net Output (MWe) at Design Conditions 100 98.71 93.11 Design Gross Steam Turbine Efficiency (%) 37.71 37.45 35.76 STG Gross Annual Generation (MWe-hrs/yr) 252,055 248,309 240,942 Plant Net Annual Generation (MWe-hrs/yr) 231,459 229,041 219,840 Annual Backfeed Electricity (MWe-hrs/yr) 2,052 2,052 2,052
Charts 4.1.1 through 4.1.4 illustrate annual net generation distribution as function of ambient dry bulb temperature. The plant net generation shown in these plots represents the electric energy produced for export to the grid and does not include plant auxiliary power that may be purchased from the grid when the plant is offline.
Charts 4.1.5 and 4.1.6 illustrate the plant’s average net output as a function of the ambient dry bulb temperature. SAM’s default Southern California Edison (SCE) dispatch structure was used in all cases with TES. The trends recognized in the plots below are entirely driven by SAM’s use of the storage dispatch profile.
45

18
Figure 4.1.1 Net Energy production at different ambient temperatures for different cooling technologies without Thermal Storage
Annual Electric Energy Generation at 5 Degree Dry Bulb Temperature Ranges100MWe Nominal Net Design CSP Trough Plant with No TES
Nevada, USA
0
5
10
15
20
25
30
35
40
45
50
25 30 35 40 45 50 55 60 65 70 75 80 85 90 95 100 105 110
Dry Bulb Temperature (F)
Gen
erat
ed E
lect
ric P
ower
(MW
e-hr
s E+
03)
Wet Net GenDry Net GenParallel Net Gen
46

19
Figure 4.1.2 Net Energy production at different ambient temperatures for different cooling technologies with 6 hrs of Thermal Storage
Annual Electric Energy Generation at 5 Degree Dry Bulb Temperature Ranges100MWe Nominal Net Design CSP Trough Plant with 6 Hrs TES
Nevada, USA
0
5
10
15
20
25
30
35
40
45
50
25 30 35 40 45 50 55 60 65 70 75 80 85 90 95 100 105 110
Dry Bulb Temperature (F)
Gen
erat
ed E
lect
ric P
ower
(MW
e-hr
s E+
03)
Wet Net GenDry Net GenParallel Net Gen
47

20
Figure 4.1.3 Percentage of Net Energy production at different ambient temperatures for different cooling technologies without Thermal Storage
Fraction of Annual Net Generation Occuring at 5 Degree Dry Bulb Temperature Ranges100We Net Nominal CSP Trough Plant with No TES
Nevada, USA
0%
2%
4%
6%
8%
10%
12%
14%
25 30 35 40 45 50 55 60 65 70 75 80 85 90 95 100 105 110
Dry Bulb Temperature (F)
Frac
tion
of A
nnua
l Net
Gen
erat
ion
(MW
e-hr
/MW
e-hr
)
Wet Net GenerationDry Net GenerationParallel Net Generation
48

21
Figure 4.1.4 Percentage of Net Energy production at different ambient temperatures for different cooling technologies with 6 hrs of Thermal Storage.
Fraction of Annual Net Generation Occuring at 5 Degree Dry Bulb Temperature Ranges100We Net Nominal CSP Trough Plant with 6 Hrs TES
Nevada, USA
0%
2%
4%
6%
8%
10%
12%
14%
25 30 35 40 45 50 55 60 65 70 75 80 85 90 95 100 105 110
Dry Bulb Temperature (F)
Frac
tion
of A
nnua
l Net
Gen
erat
ion
(MW
e-hr
/MW
e-hr
)
Wet Net GenerationDry Net GenerationParallel Net Generation
49

22
Figure 4.1.5 Average Net Plant output at different ambient temperatures for different cooling technologies with 6 hrs of Thermal Storage.
Average Electric Power Generation at 5 Degree Dry Bulb Temperature Ranges100MWe Nominal Net CSP Trough Plant with 6 Hrs TES
Nevada, USA
0
20
40
60
80
100
120
25 30 35 40 45 50 55 60 65 70 75 80 85 90 95 100 105 110
Dry Bulb Temperature (F)
Aver
age
Elec
tric
Pow
er G
ener
atio
n (M
We)
Wet Gross PwrDry Gross PwrParallel Gross Pwr
50

23
Figure 4.1.6 Average Net Plant output at different ambient temperatures for different cooling technologies with no Thermal Storage.
Average Electric Power Generation at 5 Degree Dry Bulb Temperature Ranges100MWe Nominal Net CSP Trough Plant with No TES
Nevada, USA
0
20
40
60
80
100
120
25 30 35 40 45 50 55 60 65 70 75 80 85 90 95 100 105 110
Dry Bulb Temperature (F)
Aver
age
Elec
tric
Pow
er G
ener
atio
n (M
We)
Wet Gross PwrDry Gross PwrParallel Gross Pwr
51

24
4.2 Performance Discussion
Plants with a 100% wet condensing design will typically have a more efficient steam cycle across all load points and ambient temperatures. Moreover, this is especially true in dry climates with high ambient temperatures such as Nevada. A cooling tower’s performance is governed by the wet bulb temperature, whereas a dry cooling system’s capabilities are dictated by the dry bulb temperature. The 2% maximum design dry bulb for this Nevada site is 109.8°F whereas the wet bulb is only 72.8°F, providing a large performance advantage to wet condensing. On these hot days, a wet system is able to condense the steam turbine exhaust at a lower temperature, pressure, and enthalpy, resulting in more power extracted from the steam flow. The wet system was able to achieve a steam cycle efficiency of 37.7% at the design conditions, whereas the dry system could only achieve 35.8% even with a very large ACC designed with an aggressive ITD of 25.
For the same duty at fully capacity, an ACC will always have higher auxiliary loads than a wet system due to its larger number of fans. This further reduces the net plant output of the dry plant on hot days compared to a dry cooled plant. However, the dry bulb temperature drops faster than the wet bulb temperature with a reduction in overall ambient temperatures. As a result, the auxiliary loads of a dry condensing system drop quicker than those of wet system with the reduction in ambient temperatures.
These net output differences between the dry and wet cooled plants can be seen on figures 4.1.5 and 4.1.6. As the ambient temperatures decrease this difference is reduced because the delta between the wet and dry bulb temperatures is also reduced. Due to the inherent exhaust losses in the ACC ducting system, the dry cooled system can never achieve as low a steam turbine exhaust pressure as the wet cooled system.
Since a wet system is able to maintain a more consistent turbine exhaust pressure across the operating ambient temperature range, the exhaust velocities are also more constant. This allows a wet condensing system to operate closer to the peak efficiency point on the steam turbine exhaust loss curve more often than a dry condensing system.
The objective of a parallel system is to combine the hot day generating performance of the wet system with the water conserving benefits of the dry system on cooler days. As shown by the results herein, the wet design generates 5% more annual MWe-hrs than the dry, but less than 1% more than that of the parallel system. In other words the parallel cooled plant has the ability to generate nearly as much annual power as a 100% wet cooled plant while only consuming half the amount of water.
Figures 4.1.5 and 4.1.6 illustrates the different operating modes of a plant with and without thermal storage. With the thermal storage the steam turbine is not started until there is enough heat to operate at or near full load. Without thermal storage the turbine is operated whenever sufficient heat is available run at minimum load and on cooler days there is not enough to operate at full load.
52

25
5. WATER CONSUMPTION
This analysis compares the water consumption between the wet and dry designs on an annual consumption basis. The three-variable equation discussed in Section 2.5 was used to arrive at an annual cooling tower makeup flow for the wet condensing system. Other water consumers considered in this study include mirror washing, steam cycle makeup, and WSAC makeup (dry condensing system only).
Without having site specific information, raw water quality was assumed sufficient for cooling tower use with 4 cycles of concentration and therefore no pre or post water treatment is included. Cooling tower blowdown is discharged to onsite evaporation ponds. Electrostatic deionization and multimedia filtration equipment are included in the design to treat the raw water and produce demineralized (demin) water for steam cycle makeup and solar collector mirror washing. The water consumption table below identifies the water quality required by each consumer. Note that the demin water system rejects wastewater from the reverse osmosis process and backwash water from the multimedia filtration process. These reject quantities are included in the demin water consumption values below.
5.1 Cooling Tower
Cooling tower makeup is the largest user of water, primarily consuming it through evaporation and secondarily by blowdown rejection. Evaporation is a function of the cooling load and wet bulb temperatures. Blowdown is based on water quality (which assumes 4 cycles of concentration), evaporation, and cooling tower drift. The annual water consumption of the cooling towers was calculated as describe above. The circulating water system also provides the heat sink for the closed cooling water system that cools the auxiliary plant equipment.
5.2 Air Cooled Condenser
Utilizing a dry condensing system consumes minimal water compared to a wet system. The ACC is a closed loop system not having evaporation or blowdown. Steam cycle makeup is assumed to be slightly higher for the dry condensing system than the wet because obtaining optimal cycle water chemistry is more difficult with ACCs and therefore more blowdown is needed during start-up.. In the absence of a cool water source (i.e. cooling tower) a fin-fan cooler is needed to cool plant auxiliary equipment. In addition, a supplemental WSAC is used in parallel with the fin-fan cooler when ambient dry-bulb temperatures exceeds 85° F, as direct dry air cooling can not provide the 105° F auxiliary cooling temperature required by steam turbine lube oil, feedwater pumps, and the sample panel coolers. The WSAC, like a cooling tower, requires makeup water to replace blowdown, drift, and evaporation. The water consumption from the WASC has been included in the analysis.
53

26
Table 5.2.1 Estimated Annual Water Consumption with Thermal Storage (Acre-Feet/Year)
Water Consumers (water quality) Wet Condensing
Parallel Condensing
Dry Condensing
Cooling Tower Makeup (Raw) 1,112 496 0 Steam Cycle Operating Makeup (Demin) 21 21 21 Steam Cycle Makeup at Startup (Demin) 13 13 19 Mirror Wash Water (Demin) 46 46 46 Wet Surface air Cooler Makeup (Raw) 0 0 3 Totals 1,192 575 89
Table 5.2.2 Estimated Annual Water Consumption without Thermal Storage (Acre-Feet/Year)
Water Consumers (water quality) Wet Condensing
Parallel Condensing
Dry Condensing
Cooling Tower Makeup (Raw) 705 320 0 Steam Cycle Operating Makeup (Demin) 13 13 13 Steam Cycle Makeup at Startup (Demin) 13 13 19 Mirror Wash Water (Demin) 27 27 27 Wet Surface air Cooler Makeup (Raw) 0 0 2 Totals 758 373 61
Figure5.2
Estimated Annual Water ConsumptionFixed Solar Field Size for 100MW (net) CSP Trough Plant with/without TES
Las Vegas, NV
0
200
400
600
800
1,000
1,200
Wet, 6hrs TES Dry, 6hrs TES Parallel, 6hrs TES Wet, No TES Dry, No TES Parallel, No TES
Cooling Design Cases
Est.
Ann
ual W
ater
Con
sum
ptio
n (A
c-Ft
/Yr)
Mirror WashStartupBD QuenchCT Makeup
Note: WSAC makeup values are too small to display
54

27
5.3 Water Consumption Discussion Approximately 93% percent of the wet condensing plant’s annual water consumption is used by the cooling tower. With steam cycle makeup being the roughly the same for all three condensing systems and the WSAC only contributing a small 3 Acre-Feet/Yr to the dry systems (not shown on the bar graph), the secondary contributor to the dry/wet difference is mirror wash consumption. Since the solar filed sizes were held constant for each of condensing systems, the mirror wash consumption only changes with the addition of thermal storage and its consequential larger solar field. Altogether the wet condensing plant consumes about 13 times that of the dry condensing plant under the design parameters of this study. Both the thermal storage and non thermal storage parallel designs were able to reduce the cooling tower water consumption by approximately 55% and reduce the overall plant water consumption by about 52%. This reduction was obtained by simulating the operation of the plant for maximum plant output. Further water consumption could be obtained by shifting more of the condensing load from the surface condenser to the ACC. This would result in a reduction of plant net output but nonetheless could be a valuable operating option. Annual water consumption contributes to the operations and maintenance cost as a plant consumable. This reoccurring cost will ultimately contribute to the final LCOE analysis discussed in the next section.
55

28
6 LEVELIZED COST OF ELECTRICITY ANALYSIS
The levelized cost of electricity was determined by calculating the net present value of the nominal capital and operations and maintenance costs per year and discounting them back to the present. The net present value was them divided by the annual net output per year to determine the cost per MW–hr. The annual (O&M) costs are escalated 2009 dollars. The levelized annual costs and LCOEs are nominal dollars as the effects of inflation are not included in this analysis. The capital costs are assumed to occur entirely in 2009 and the annual costs are assumed to start with the plant operation in year 2013. The LCOE is based on the plant operating for 30 years through 2042. Other items such as capital financing, construction financing, taxes, renewable credits, financial incentives, debt ratios, depreciation, loan periods, etc. were not included as they were considered to be project and company specific. The intent of this analysis was to provide a technical LCOE based on the data in the tables below that would allow a comparison of the performance and costs of the various designs. Further economic considerations can be added to this data to obtain an economic or financial analysis for a specific project within a specific company. Table 6.0 Levelized cost of electricity model inputs and output summary. Discount rate: 5.25% Water Cost $/acre-ft $450 Commercial Operation Date: 2013 Economic Operating Life: 30 Plant O&M cost nominal escalation: 1.50%
Designs with 6 hr TES Wet Parallel Dry Plant Output (MW/yr) 396,062 395,070 377,000 Total Capex $961,123,000.00 $996,843,000.00 $982,085,000.00 Annual O&M Cost $11,333,902.00 $11,167,145.00 $10,889,096.00 NPV $1,086,559,740.50 $1,117,947,041.45 $1,099,671,773.95 Nominal Levelized Yearly Cost ($72,709,246) ($74,809,588) ($73,586,663) Nominal LCOE ($/MW-hr) ($183.58) ($189.36) ($195.19)
Designs without TES Wet Parallel Dry Plant Output (MW/yr) 231,459 229,041 219,840 Total Capex $528,140,000.00 $564,831,000.00 $550,419,000.00 Annual O&M Cost $9,292,383.00 $9,233,312.00 $9,035,758.00 NPV $643,944,622.77 $677,901,800.21 $661,186,634.55 Nominal Levelized Yearly Cost ($43,090,800) ($45,363,110) ($44,244,582) Nominal LCOE ($/MW-hr) ($186.17) ($198.06) ($201.26)
56

29
The wet condensing designs had the lowest LCOEs as they had the lowest capital costs and the highest annual energy production. The parallel designs while having the highest capital costs, had LCOEs between that of the Wet and the Dry designs due to the fact that the energy production of the parallel plants was close to that of the wet condensing plants. The relatively low annual generation of the dry condensing designs resulted in them having the highest LCOEs of all the condensing designs. This is all based on a $450/acre-foot water cost. As the cost of water rises or the quality of water diminishes the dry cooled plant LCOE will approach the wet cooled plant and in some extreme cases it will be less.
7 CONCLUSIONS AND RECOMMENDATIONS
The LCOE’s for all the designs are very close and well within the +/- 30% tolerance of this study. In a hot dry climate such a Nevada, it is expected that wet condensing designs would have better economic results with the cost of water used. In a cooler more humid climate the differences would be smaller and the dry designs may even have the lowest LCOEs. A parallel condensing plant is more complicated to operate but with that comes operational flexibility. This study simulated the operation of the parallel plant to maximize net power output. It could be operated to conserve more water and in doing so the performance and costs would approach that of the all dry plant. The relative LCOEs of these designs are good guidelines of what to expect from the different condensing technologies for the site evaluated and other sites with similar climates. More in depth analysis based on specific project criteria could be expected to yield increased efficiencies and lower LCOEs for any of the designs.
57

Appendix B Analysis of Wet and Dry Condensing 125 MW Parabolic Trough Power Plants WorleyParsons Group NREL-2-ME-REP-0002 September 29, 2009
58

Analysis of Wet and Dry Condensing 125 MW Parabolic Trough Power Plants NREL-2-ME-REP-0002 Rev 0
Prepared for: National Renewable Energy Lab
Prepared by: WorleyParsons Group, Inc.
1687 Cole Blvd, Suite 300 Golden, Colorado 80401 USA
September 29, 2009
59

NOTICE The information presented in this document was compiled and interpreted exclusively for the purposes stated in the document introduction. WorleyParsons provided this report for NREL solely for the purpose noted above. WorleyParsons has exercised reasonable skill, care, and diligence to assess the information acquired during the preparation of this report, but makes no guarantees or warranties as to the accuracy or completeness of this information. The information contained in this report is based upon, and limited by, the circumstances and conditions acknowledged herein, and upon information available at the time of its preparation. The information provided by others is believed to be accurate but cannot be guaranteed. WorleyParsons does not accept any responsibility for the use of this report for any purpose other than that stated in the document introduction and does not accept responsibility to any third party for the use in whole or in part of the contents of this report. Any alternative use, including that by a third party, or any reliance on, or decisions based on this document, is the responsibility of the alternative user or third party. No part of this publication may be reproduced, stored in a retrieval system or transmitted, in any form or by any means, electronic, mechanical, photocopying, recording or otherwise, without the prior permission of WorleyParsons. Any questions concerning the information or its interpretation should be directed to Rod Gartner, Project Manager.
60

TABLE OF CONTENTS 1. INTRODUCTION ............................................................................................................................. 4 2. DESIGN ASSUMPTIONS AND METHOD ...................................................................................... 4 3. CAPITAL COSTS ......................................................................................................................... 10 4. PERFORMANCE .......................................................................................................................... 11 5. WATER CONSUMPTION ............................................................................................................. 16 6 LEVELIZED COST OF ELECTRICTY ANALYSIS ....................................................................... 18
61

4
1. INTRODUCTION
The United States Department of Energy’s National Renewable Energy Laboratory (NREL) has elected WorleyParsons to determine the relative economic differences between a 125 MWe net Concentrated Solar Power (CSP) parabolic trough plant with 100% wet condensing and 100% dry condensing systems. The solar data is based on a Nevada site near Las Vegas and assumes 4 hours of thermal energy storage (TES) for both designs. This will allow future plant developers to determine the impact of site water availability and its associated condensing system options on plant levelized cost of electricity (LCOE). For each design case, WorleyParsons has provided relative overnight capital and fixed/variable operating & maintenance (O&M) costs based on a preliminary engineering design effort which altogether yields a relative estimate accuracy of ±30%.
2. DESIGN ASSUMPTIONS AND METHOD
2.1 Ambient Conditions
Heat balance modeling requires design and off-design ambient conditions. The design conditions (see Table 2.1 below) are used to physically size the Rankine cycle equipment whereas the off-design conditions are used to model the effects of the plant while varying weather and turbine load. The design temperatures selected for the 125MWe net plant are “Monthly Design” dry and wet bulb temperatures at a 2% frequency for July and August, respectively. Historically these temperatures were exceeded 2% of the time. Table 2.1 Design conditions for Nellis Air Force Base, NV (2005 ASHRAE Handbook)
Parameter Units Value Elevation Above Sea Level ft 1880 Standard Atmospheric Pressure psia 13.725 Design Dry Bulb Temperature °F 109.8 Design Wet Bulb Temperature °F 72.8
Off-design ambient temperatures are extracted from a Class A Typical Metrological Year (TMY) 2 data file for Las Vegas, NV (WBAN No. 23169). This dataset provided hourly dry/wet bulb temperatures and solar radiation for a complete year which were ultimately used in performance modeling to arrive at the results. The application of off-design temperatures is discussed later in the report.
62

5
Figure 2.1.1 Coincident power block operation depicted.
Dry Bulb & Coincident Wet Bulb TemperaturesLas Vegas, NV (TMY2 Data)
10
15
20
25
30
35
40
45
50
55
60
65
70
75
80
10 15 20 25 30 35 40 45 50 55 60 65 70 75 80 85 90 95 100 105 110 115 120
Dry Bulb Temperature (F)
Coi
ncid
ent W
et B
ulb
Tem
pera
ture
(F)
UnfilteredPwr Blk Oper
63

6
Figure 2.1.2 Coincident solar field operation depicted.
Dry Bulb & Coincident Wet Bulb TemperaturesLas Vegas, NV (TMY2 Data)
10
15
20
25
30
35
40
45
50
55
60
65
70
75
80
10 15 20 25 30 35 40 45 50 55 60 65 70 75 80 85 90 95 100 105 110 115 120
Dry Bulb Temperature (F)
Coi
ncid
ent W
et B
ulb
Tem
pera
ture
(F)
UnfilteredSolar Field Oper
64

7
Figure 2.1.3
Annual Hours & Frequency of Dry Bulb Temperatures at 5 Degree RangesLas Vegas, Nevada, USA
0
100
200
300
400
500
600
700
800
900
1000
1100
25 30 35 40 45 50 55 60 65 70 75 80 85 90 95 100 105 110
Dry Bulb Temperature (F)
Hou
rs o
f Ann
ual O
ccur
ance
(hou
rs)
0%
1%
2%
3%
4%
5%
6%
7%
8%
9%
10%
11%
Freq
uenc
y of
Ann
ual O
ccur
ance
(%)
HoursFrequency
Figure 2.1.4
Annual Hours of Dry Bulb and Average Coincident Wet Bulb Temperaturesin 5 Degree Ranges
Las Vegas, Nevada, USA
0
100
200
300
400
500
600
700
800
900
1000
1100
25 30 35 40 45 50 55 60 65 70 75 80 85 90 95 100 105 110
Dry Bulb Temperature (F)
Hou
rs o
f Ann
ual O
ccur
ance
(hou
rs)
0
10
20
30
40
50
60
70
Coi
ncid
ent W
et B
ulb,
°F
HoursCoincident Wet Bulb
65

8
2.2 Wet Condensing
The wet condensing system consists of a steam surface condenser, circulating water pumps, an induced draft counter-flow cooling tower, and an underground & aboveground interconnecting pipe network. This type of condensing system allows for the lowest steam turbine operating back pressure and efficiency, at the expense of increased water consumption. The wet condensing system was modeled to utilize these advantages and was not configured with a higher backpressure similar to that of the dry systems to conserve water. The intent is to illustrate the impact of the increased performance of a wet condensing system on water consumption. The operation of the 100% wet condensing system was modeled to reduce steam turbine backpressure and maximize output as the ambient temperatures dropped rather than to minimize water consumption by operating the steam turbine at a higher back pressure. The cooling tower operation was modeled with 4 cycles of concentration. Without having site specific information, it is assumed that no pre or post water treatment is needed.
2.3 Dry Condensing
The dry condensing alternative utilizes an air cooled condenser (ACC) to cool the exhaust steam using a large array of fans that force air over finned tube heat exchangers. The heat is rejected directly to the atmosphere and no external water supply is needed for condensing the steam cycle exhaust steam. The initial temperature difference (ITD) is defined as the difference between the ambient air temperature at the design point and the steam condensation temperature within an ACC. The smaller the ITD, the more aggressive the design resulting in better steam turbine generator (STG) backpressure but at a higher capital and fan power consumption cost. An ITD of 25 °F was used in this study as a preliminary investigation suggests that this design is close to optimal in terms of cost vs. net plant generation for the proposed CSP plant. The operation of a 100% dry condensing system was modeled to minimize condensing pressure and maximize steam turbine output as ambient temperatures decreased.
2.4 Sizing Criteria
The criteria in the following table were used to size and estimate the costs of the two condensing systems.
66

9
Table 2.4 Wet/Dry Design case sizing criteria.
Parameters Units Dry Wet Steam Turbine Exhaust Enthalpy Btu/lb 1018.4 988.2
Steam Turbine Exhaust Flow lb/hr 962946 874435
Steam Turbine Exhaust Back Pressure Inches HgA 5.0 2.57
Air Cooled Condenser Duty MMBtu/hr 882 n/a
Cooling Tower Duty MMBtu/hr n/a 801
Circulating Water Flow Rate gpm n/a 80,000
Cooling Tower Approach °F n/a 10
Cooling Tower Range °F n/a 20
Condenser Terminal Temperature Difference (TTD) °F n/a 7
2.5 Method
Using the criteria given above, budgetary vendor cost and performance quotes for the cooling tower, ACC, surface condenser and steam turbine were obtained in order to determine impact on performance, capital cost, auxiliary loads, water consumption, and ultimately levelized costs of electricity.
The performance portion of this study is necessary to arrive at a LCOE. Gross plant output, net plant output, and water consumption are the primary performance inputs to an LCOE model. These three parameters were estimated using four different calculation tools which ultimately were driven by three inputs: ambient dry bulb, ambient wet bulb, and steam cycle heat input.
Hourly ambient dry/wet bulb temperatures were obtained from the TMY2 weather dataset for Las Vegas NV, which also provided direct normal insolation (DNI) data used in NREL’s Solar Advisor Model (SAM). This SAM software provided the steam cycle heat input, also referred to as thermal energy to the power block (Q_PB), as well as thermal energy to storage (Q_to_ts) and thermal energy from storage (Q_from_ts). GateCycle was used to model the Rankine cycle behavior and initially determined the plant’s design point conditions. A unique GateCycle model was developed for the two condensing types. Several off-design heat balance models were independently run varying dry-bulb temperature, wet-bulb temperature, and steam cycle heat input. Model results were compiled and numerically fit into a three-variable equation using MathCAD and Microsoft Excel Visual Basic tools to arrive at the various plots and tables presented herein.
Using this all-inclusive Excel spreadsheet, the inputs and equations were used to obtain cooling tower water makeup for every hour of a typical year. This same methodology was used to produce steam turbine electric gross output and Rankine cycle parasitic loads per hour. Solar system parasitic loads (i.e. HTF pumps, TES pumps, SCA drives, etc.) were calculated based on hourly heat input to the steam cycle, and heat input/output from the thermal energy storage (TES) system.
The results of the evaluation are presented in the following sections.
67

10
3. CAPITAL COSTS Capital costs have been determined using a combination of vendor budgetary proposals and WorleyParsons’ equipment, commodity, and installation labor database. The capital costs are within a +/- 30% confidence range based on a conceptual engineering effort.
The results show a noticeable difference in capital cost between the wet and dry condensing designs. This difference is mainly attributed by the drop in cycle efficiency and increase in aux loads, altogether needing an increase in solar collectors to maintain a 125MW net output. The solar field effective mirror aperture area increased from 1,013,700 m2 (wet condensing) to 1,088,910 m2 (dry condensing). The thermal energy storage, solar field civil-site work, balance of plant mechanical/electrical, HTF system, electrical, instrumentation/controls and all other cost items which makeup a complete CSP plant were adjusted as necessary in each design to accommodate condensing system impacts.
Although the increase in solar collectors contributes to the majority of cost increase, the larger HTF system and much larger cooling equipment are also major cost contributors. Differences in operating costs and plant performance are discussed later.
3.1 Vender Quotes
WorleyParsons’ obtained budgetary quotes for the cooling tower, surface condenser, and air-cooled condenser. All other equipment and materials included in the makeup of a complete CSP trough plant were priced based on WorleyParsons’ extensive archive of past vendor quotes and previously constructed projects.
The following table is a summary of the complete cost analysis showing the line items that build up the overall total installed capital cost for the two different options.
Table 3.1 Estimated capital and O&M cost summary for dry and wet condensing 125MWe net plants.
COST ITEM Dry Condensing Wet Condensing Total Installed Capital (EPCM Basis) $1.081 Billion $997.2 Million Fixed & Variable O&M (% of Capital) $11.8 Million (1.09%) $12.2 Million (1.12%)
**labor rates based on union labor for Las Vegas, NV.
68

11
4. PERFORMANCE Since both designs require 125 MWe net electricity to the grid at design conditions, the less efficient dry condensing system will require more solar collectors to achieve the same net output. The dry condensing system has a higher turbine back pressure driven by steam saturation temperature which is based on the condenser’s ITD and the site’s dry-bulb temperature. This higher back pressure lowers the enthalpy delta that can be extracted from the low pressure (LP) steam turbine and therefore decreases the steam cycle efficiency. Increased gross power output is required to maintain net output; which is achieved by increasing steam flow and steam cycle heat input. Furthermore, because the ACC has significantly more fans than the cooling tower, the dry condensing system has higher auxiliary loads than the wet system; again requiring an increase in solar collectors. The dry condensing design also requires an air cooled heat exchanger (also known as fin-fan cooler) and a wet surface air cooler (WSAC) for auxiliary cooling, resulting in a further increase in auxiliary loads.
The steam turbine models were optimized in Gatecycle for the different operating conditions of each condensing design. SAM sends the solar energy to thermal storage until there is enough energy to operate the steam turbine at or near full load, after which the energy is sent to the power block. This is illustrated in Figure 4.0 below. Thus the steam turbine exhaust sections for both designs were optimized to minimize the exhaust losses at full load conditions. The steam turbine in the wet condensing design, which operates at a lower back pressure, utilized an exhaust design with a larger last stage blade length and annulus area than the design dry condensing design. This modeling was done based on WorleyParsons’ long term power plant experience and knowledge base, utilizing available steam turbine technology, but not tied to specific vendor design data.
69

12
Figure 4.0
Annual Hours of Net Generation at 5MWe Ranges125MWe Net CSP Trough Plant with 4 Hrs TES
Nevada, USA
0
200
400
600
800
1000
1200
1400
1600
1800
10 15 20 25 30 35 40 45 50 55 60 65 70 75 80 85 90 95 100
105
110
115
120
125
130
135
140
145 0.0
Net Electric Generation (MWe)
Ope
ratio
n w
ithin
Net
Gen
erat
ion
Ran
ge (h
ours
)
Wet CooledDry Cooled
4.1 Performance Results
Table 4.4 summarizes the performance analysis results for the wet and dry condensing designs.
Table 4.1 Nevada Site Performance Summary
Performance Results Dry Condensing Wet Condensing Solar Input to Collector Field (MWth) 1088 1012 Design Steam Cycle Thermal Input (MWth) 404.8 376.4 Design Gross Steam Turbine Output (MWe) 145.1 142.2 Design Plant Parasitic Losses (MWe) 20.1 17.2 Design Plant Net Output (MWe) 125 125 Design Gross Steam Turbine Efficiency (%) 35.8% 37.8% Design Point Net Solar Use Efficiency (%) 11.49% 12.35% Plant Net Annual Output (MWe-hrs/yr) 438,790 426,710 Plant Gross Annual Output (MWe-hrs/yr) 480,191 464,087 Annual Backfeed Electricity (MWe-hrs/yr) 3,792 3,757
70

13
4.2 Performance Discussion
The wet condensing plant with the more efficient steam cycle produces less total net MWe-hrs on an annual basis than the dry condensing plant. As stated previously, the auxiliary loads of the dry design are larger than those of the wet design and therefore the gross steam turbine output must be larger to compensate for these loads. The auxiliary loads of dry cooling are a function of the dry bulb temperature as opposed to wet cooling loads which are a function of the wet bulb. The wet condensing designs can achieve a lower steam turbine back pressure because the wet bulb is lower than the dry bulb. However, the dry bulb temperature drops faster than the wet bulb temperature with a reduction in overall ambient temperatures. As a result, the auxiliary loads of a dry condensing system drop quicker than those of wet system with the reduction in ambient temperatures. The combination of a larger gross steam turbine output and auxiliary loads that are reduced quicker with falling ambient temperatures results in higher net output for the dry condensing designs on days with lower ambient temperatures. The higher output on cooler days translates into higher overall MWe-hrs on an annual basis.
The following charts illustrate the manner in which the SAM model dispatches a solar plant with Thermal Storage. The plant net generation in these charts is the energy produced for export to the grid and does not include plant auxiliary power that may be purchased from the grid when the steam turbine is not operating.
Figure 4.2.1
Fraction of Annual Net Generation Occuring at 5 Degree Dry Bulb Temperature Ranges125MWe Net CSP Trough Plant with 4 Hrs TES
Nevada, USA
0%
2%
4%
6%
8%
10%
12%
14%
25 30 35 40 45 50 55 60 65 70 75 80 85 90 95 100 105 110
Dry Bulb Temperature (F)
Frac
tion
of A
nnua
l Net
Gen
erat
ion
(MW
e-hr
/MW
e-hr
)
Wet CooledDry Cooled
71

14
Figure 4.2.2
Annual Electric Energy Generation at 5 Degree Dry Bulb Temperature Ranges125MWe Net Wet Cooled CSP Trough Plant with 4 Hrs TES
Nevada, USA
0
10
20
30
40
50
60
25 30 35 40 45 50 55 60 65 70 75 80 85 90 95 100 105 110
Dry Bulb Temperature (F)
Gen
erat
ed E
lect
ric P
ower
(MW
e-hr
s E+
03)
Gross STG GenNet Gen
72
15
Figure 4.2.3
Annual Electric Energy Generation at 5 Degree Dry Bulb Temperature Ranges125MWe Net Dry Cooled CSP Trough Plant with 4 Hrs TES
Nevada, USA
0
10
20
30
40
50
60
25 30 35 40 45 50 55 60 65 70 75 80 85 90 95 100 105 110
Dry Bulb Temperature (F)
Gen
erat
ed E
lect
ric P
ower
(MW
e-hr
s E+
03)
Gross STG GenNet Gen
73

16
With thermal storage most of a solar plant’s operation is at or near full rated load. Because the plants are designed to output 125MWe at high ambient temperatures, At part load on the steam cycle side, when ambient temperatures are lower, the ACC performance is better than at high ambient (almost comparable to wet condensing performance). At part load (lower radiation but also lower dry bulb) the dry and wet plant cycle efficiencies (driven by back pressure) are much closer and the plant with the larger heat input produces more power. Altogether, dry plants generate more MWe-hrs per year because of their better part-load performance contributed by a larger mirror area and significantly better condensing performance.
5. WATER CONSUMPTION
This analysis compares the water consumption between the wet and dry designs on an annual consumption basis. The three-variable equation discussed in Section 2.5 was used to arrive at an annual cooling tower makeup flow for the wet condensing system. Other water consumers considered in this study include mirror washing, steam cycle makeup, and WSAC makeup (dry condensing system only).
Without having site specific information, raw water quality was assumed sufficient for cooling tower use with 4 cycles of concentration and therefore no pre or post water treatment is included. Cooling tower blowdown is discharged to onsite evaporation ponds. Electrostatic deionization and multimedia filtration equipment are included in the design to treat the raw water and produce demineralized (demin) water for steam cycle makeup and solar collector mirror washing. The water consumption table below identifies the water quality required by each consumer. Note that the demin water system rejects wastewater from the reverse osmosis process and backwash water from the multimedia filtration process. These reject quantities are included in the demin water consumption values below.
5.1 Cooling Tower
Cooling tower makeup is the largest user of water, primarily consuming it through evaporation and secondarily by blowdown rejection. Evaporation is a function of the cooling load and wet bulb temperatures. Blowdown is based on water quality (which assumes 4 cycles of concentration), evaporation, and cooling tower drift. The annual water consumption of the cooling towers was calculated as describe above. The circulating water system also provides the heat sink for the closed cooling water system that cools the auxiliary plant equipment.
5.2 Air Cooled Condenser
Utilizing a dry condensing system consumes minimal water compared to a wet system. The ACC is a closed loop system not having evaporation or blowdown. Steam cycle makeup is assumed to be slightly higher for the dry condensing system than the wet because obtaining optimal cycle water chemistry is more difficult with ACCs and therefore more blowdown is needed during start-up.. In the absence of a cool water source (i.e. cooling tower) a fin-fan cooler is needed to cool plant auxiliary equipment. In addition, a supplemental WSAC is used in parallel with the fin-fan cooler when ambient dry-bulb temperatures exceeds 85° F, as direct dry air cooling can not provide the 105° F auxiliary cooling temperature required by steam turbine lube oil, feedwater pumps, and the sample panel coolers. The WSAC, like a
74

17
cooling tower, requires makeup water to replace blowdown, drift, and evaporation. The water consumption from the WASC has been included in the analysis. Table 5.2 Estimated Annual Water Consumption (Acre-Feet/Year)
Water Consumers (water quality) Dry Condensing Wet Condensing Cooling Tower Makeup (Raw) 0 1,242 Steam Cycle Operating Makeup (Demin) 18 18 Steam Cycle Makeup at Startup (Demin) 13 13 Mirror Wash Water (Demin) 64 52 Wet Surface air Cooler Makeup (Raw) 3 0 Totals 104 1,325
Figure 5.2
Water Consumption Comparison125MW Net CSP Trough Plant with 4 Hrs Storage
Nevada, USA
0 100 200 300 400 500 600 700 800 900 1,000 1,100 1,200 1,300CT Mak
eup
BD Que
nch
Startup
Mirror W
ash
WSAC Mak
eup
Con
sum
ptio
n So
urce
Water Consumption (AC-Ft/Yr)
Dry CooledWet Cooled
75

18
5.3 Water Consumption Discussion Approximately 94% percent of the wet condensing plant’s annual water consumption is used by the cooling tower. With steam cycle makeup being the same for both condensing systems and the WSAC only contributing a small 3 Acre-Feet/Yr to the dry system, the secondary contributor to the dry/wet difference is mirror wash consumption. Mirror wash consumption is greater for the dry condensing plant due to its larger solar field. Altogether the wet condensing plant consumes more than 12 times that of the dry condensing plant under the design parameters of this study. Annual water consumption contributes to the operations and maintenance cost as a plant consumable. This reoccurring cost will ultimately contribute to the final LCOE analysis discussed in the next section.
6 LEVELIZED COST OF ELECTRICTY ANALYSIS
The levelized cost of electricity was determined by first determining the net present value of the capital and operations and maintenance cost per year and discounting them back to the present. The net present value was them divided by the annual output per year to determine the cost per MW –hr. The annual costs are in real 2009 dollars and escalated in real terms as shown in the spread sheet. The discount rate and inflation rate are inputs that can be easily modified. The capital cost was assumed to occur entirely in year 1. Table 6.0 Levelized cost of electricity model inputs and output summary.
Discount rate: 5.25% Water Cost $/acre-ft $450 Fuel Escalation rate: 0.00% Commercial Operation Date: 2013 Economic Life: 30 General Inflation: 1.00% Plant O&M cost nominal escalation: 1.50% Case: 4 Hr TES 100% wet 4 Hr TES 100% Dry Plant Output (MW/yr) 426,710 438,790 Total capex $997,200,000.00 $1,081,063,000.00 NPV $1,161,122,832.77 $1,234,192,779.84 Nominal Levelized Yearly Cost ($76,648,858.75) ($81,472,403.59) Levelized Cost of Electricity ($/MW-hr) ($179.63) ($185.68)
76
Appendix C Analysis of Wet, Dry, and Parallel Condensing Parabolic Trough Power Plants with Fixed Solar Heat Input San Luis Valley, Colorado Site WorleyParsons Group NREL-2-ME-REP-0004 May 10, 2010
77

Analysis of Wet, Dry, and Parallel Condensing Parabolic Trough Power Plants with Fixed Solar Heat Input San Luis Valley, Colorado Site NREL Task 2, MOD 2 Final Report - Colorado Site NREL-2-ME-REP-0004 Rev 1
Prepared for: National Renewable Energy Lab
Prepared by: WorleyParsons Group, Inc.
1687 Cole Blvd, Suite 300 Golden, Colorado 80401 USA
May 10, 2010
78

NOTICE The information presented in this document was compiled and interpreted exclusively for the purposes stated in the document introduction. WorleyParsons provided this report for NREL solely for the purpose noted above. WorleyParsons has exercised reasonable skill, care, and diligence to assess the information acquired during the preparation of this report, but makes no guarantees or warranties as to the accuracy or completeness of this information. The information contained in this report is based upon, and limited by, the circumstances and conditions acknowledged herein, and upon information available at the time of its preparation. The information provided by others is believed to be accurate but cannot be guaranteed. WorleyParsons does not accept any responsibility for the use of this report for any purpose other than that stated in the document introduction and does not accept responsibility to any third party for the use in whole or in part of the contents of this report. Any alternative use, including that by a third party, or any reliance on, or decisions based on this document, is the responsibility of the alternative user or third party. No part of this publication may be reproduced, stored in a retrieval system or transmitted, in any form or by any means, electronic, mechanical, photocopying, recording or otherwise, without the prior permission of WorleyParsons. Any questions concerning the information or its interpretation should be directed to Ryan Bowers, Project Manager.
79

TABLE OF CONTENTS 1. INTRODUCTION ............................................................................................................................. 4 2. DESIGN ASSUMPTIONS AND METHOD ...................................................................................... 4 3. CAPITAL COSTS ......................................................................................................................... 11 4. PERFORMANCE .......................................................................................................................... 12 5. WATER CONSUMPTION ............................................................................................................. 20 6 LEVELIZED COST OF ELECTRICITY ANALYSIS ...................................................................... 23 7 CONCLUSIONS AND RECOMMENDATIONS ............................................................................ 24
80

4
1. INTRODUCTION
The United States Department of Energy’s National Renewable Energy Laboratory (NREL) has elected WorleyParsons to determine the relative economic differences between similar Concentrating Solar Power (CSP) parabolic trough plants with varying cooling and storage designs. Similar to the previous cooling study for projects in Nevada, the purpose of this study is to understand the performance and cost impacts of cooling systems on parabolic trough solar power plants for projects in the San Luis Valley of Colorado. The base case is 100 MWe net with a 100% wet condensing system while two alternate cases, having the same solar field size and thermal input to the steam cycle, utilize a 100% dry condensing system and a parallel wet/dry condensing system. These three cases are evaluated with 6 hours of thermal energy storage (TES) where the storage system size is based on the 100% wet case and held constant across the other two cases. This methodology simplified the analysis, conversely the design net output could have been held constant and the solar field increased for the dry and parallel cases. The goal of this study is to assist CSP plant developers in selecting an appropriate condensing system for their project based on water availability and levelized cost of electricity (LCOE). For each design case, overnight direct capital and reoccurring operations and maintenance (O&M) costs will be estimated based on a preliminary engineering design effort which altogether yields an estimate accuracy of ±30%.
2. DESIGN ASSUMPTIONS AND METHOD
2.1 Ambient Conditions
Heat balance modeling requires design and off-design ambient conditions. The design conditions (see Table 2.1.1 below) are used to physically size the Rankine cycle equipment whereas the off-design conditions are used to model the performance of the plant while varying weather and turbine load. The design temperatures selected are the highest monthly 2% frequency dry and wet bulb temperatures for July and August. Historically these temperatures were exceeded 2% of the time. Table 2.1.1 Design conditions for Alamosa, CO (2005 ASHRAE Handbook)
Parameter Units Value Elevation Above Sea Level ft 7,536 Standard Atmospheric Pressure psia 11.11 Design Dry Bulb Temperature °F 84.7 Design Wet Bulb Temperature °F 60.2
Off-design ambient temperatures are extracted from a Class II Typical Metrological Year (TMY) 3 data file for Alamosa, CO (WMO No. 724620), located in the San Luis Valley of Colorado. This dataset provided hourly dry/wet bulb temperatures and solar radiation for a complete year which were ultimately used in performance modeling to arrive at the results. The application of the off-design temperatures is discussed later in the report. The 8760 hour dry bulb temperature data ranged from -26°F to 87°F. The temperature range across which NREL’s Solar Advisor Model (SAM) simulated operation of the steam turbine ranged from -3°F to 87°F.
81

5
The figures 2.1.1 through 2.1.2 are scatter plots of 8760 hour dry bulb and coincident wet bulb temperatures with overlays of the hours during which the steam turbine operates and solar field exports heat.
82

6
Figure 2.1.1 Dry bulb and coincident wet bulb temperatures during power block operation.
Dry Bulb & Coincident Wet Bulb TemperaturesPower Block Operation Shown For 100MW net CSP Trough Plant with 6 hrs TES
Alamosa, CO (TMY3 Data)
-30
-20
-10
0
10
20
30
40
50
60
70-30 -20 -10 0 10 20 30 40 50 60 70 80 90 100
Dry Bulb Temperature (F)
Coi
ncid
ent W
et B
ulb
Tem
pera
ture
(F)
8760 Hour DataPower Block Oper
83

7
Figure 2.1.2 Dry bulb and coincident wet bulb temperatures during solar field operation.
Dry Bulb & Coincident Wet Bulb TemperaturesSolar Field Operation Shown For 100MW net CSP Trough Plant with 6 hrs TES
Alamosa, CO (TMY3 Data)
-30
-20
-10
0
10
20
30
40
50
60
70-30 -20 -10 0 10 20 30 40 50 60 70 80 90 100
Dry Bulb Temperature (F)
Coi
ncid
ent W
et B
ulb
Tem
pera
ture
(F)
8760 Hour DataSolar Field Oper
84

8
Figure 2.1.3 illustrates the number of hours of 5 degree interval dry bulb temperatures from the 8760 hourly data and the average coincident wet bulb temperature associated with each dry bulb interval. Figure 2.1.3 Dry bulb and average coincident wet bulb frequency plot.
Annual Hours of Dry Bulb and Average Coincident Wet Bulb Temperaturesin 5 Degree Ranges
Alamosa, Colorado USA
0
100
200
300
400
500
600
700
800
900
1000
1100
-25 -20 -15 -10 -5 0 5 10 15 20 25 30 35 40 45 50 55 60 65 70 75 80 85
Dry Bulb Temperature (F)
Hou
rs o
f Ann
ual O
ccur
ance
(hou
rs)
-30
-20
-10
0
10
20
30
40
50
60
70
Coi
ncid
ent W
et B
ulb,
°F
Hours
Coincident Wet Bulb
2.2 Wet Condensing
The wet condensing system consists of a steam surface condenser, circulating water pumps, an induced draft counter-flow cooling tower, and an underground & aboveground interconnecting pipe network. This type of condensing system allows for the lowest steam turbine operating back pressure and highest efficiency, at the expense of water consumption. The wet condensing system was modeled to utilize these advantages and was not configured to match the higher backpressure obtained with the dry condensing system. The intent is to illustrate the impact of the increased performance of a wet condensing system on water consumption. The operation of the 100% wet condensing system was modeled to reduce steam turbine backpressure and maximize output as the ambient temperature dropped rather than to minimize water consumption by operating the steam turbine at a higher back pressure. The cooling tower operation was modeled with 4 cycles of concentration. Without having site specific water quality information, it was assumed that the water available is municipal quality and that no pre or post water treatment is needed.
85

9
2.3 Dry Condensing
The dry condensing alternative utilizes an air cooled condenser (ACC) to condense the exhaust steam using a large array of fans that force air over finned tube heat exchangers. The heat is rejected directly to the atmosphere and no external water supply is needed for condensing the steam cycle exhaust steam. The initial temperature difference (ITD) is defined as the difference between the ambient dry bulb temperature at the design point and the steam condensation temperature within the ACC. The smaller the ITD, the more aggressive the design, resulting in lower steam turbine generator (STG) backpressure but at a higher capital and fan power consumption cost. A preliminary investigation suggests that an ITD of 25 °F is close to optimal in terms of cost vs. net plant generation for the proposed CSP plant at the design ambient conditions. The operation of a 100% dry condensing system was modeled to minimize condensing pressure and maximize steam turbine output as ambient temperature decreased.
2.4 Parallel Condensing
The parallel condensing system is a combination of wet and dry condensing systems. The steam turbine exhaust branches near the turbine exit and a duct runs to each condensing system. The steam flow naturally splits in proportion to the available condensing capacity of each system. A parallel system is more expensive than a wet system and can be more expensive than a dry system depending on the design capacity of the parallel system. The same size ACC was used for the parallel system as the all dry system in order to increase annual generation. The duty of the parallel wet condensing portion is approximately 32% of the all wet design. The wet portion allows the steam turbine to operate at minimum back pressure at all dry bulb temperatures. The large ACC allows the wet system and corresponding water consumption to be curtailed as soon as possible with falling dry bulb temperature. The operation of the parallel system was modeled to maximize performance at the expense of water consumption. This design allows operation on hot summer days without an increase in steam turbine back pressure, compared to the all dry system.
2.5 Solar Field Designs
The solar field size is selected based on 100MWe net plant output, with a 100% wet condensing Rankine power cycle, 6hrs of thermal energy storage and a solar multiple of 2.0 at 1,000W/m2 design irradiance. This same solar field design was used to evaluate the performance of the 100% dry and parallel condensing designs. Thus the heat input to steam cycle was the same for all the condensing configurations.
2.6 Sizing Criteria
The steam turbine exhaust sections for all three condensing designs were optimized to minimize the exhaust losses at full load conditions. The steam turbines in the wet and parallel condensing designs, which operate at lower back pressures, utilized an exhaust design with a larger 37.5” last stage blade length and appropriate annulus area whereas the dry condensing design assumed a 33.5” last stage blade. The steam turbine inlet temperature and pressure was the same for all 3 designs. This exhaust section selection was based on generic steam turbine technology and not tied to specific vendor design data.
The criteria in the following tables were used to size and estimate the costs of the three condensing systems.
86

10
Table 2.6 Rankine cycle sizing criteria at design conditions.
Parameters Units Wet Parallel Dry Steam Turbine Exhaust Enthalpy Btu/lb 974.49 978.05 988.24
Steam Turbine Exhaust Flow lb/hr 678,343 680,159 684,741
Steam Turbine Exhaust Back Pressure
Inches HgA 1.819 2.036 2.56
Air Cooled Condenser Duty MMBtu/hr n/a 421 624
Cooling Tower Duty MMBtu/hr 620 199 n/a
Circulating Water Flow Rate gpm 61,930 19,860 n/a
Cooling Tower Approach °F 10 10 n/a
Cooling Tower Range °F 20 20 n/a
Condenser Terminal Temperature Difference (TTD) °F 7 10.75 n/a
2.7 Method
Using the criteria given above, budgetary vendor cost and performance quotes for the cooling tower, ACC, surface condenser and steam turbine were obtained in order to determine impact on performance, capital cost, auxiliary loads, water consumption, and ultimately LCOE.
The performance portion of this study is necessary to arrive at a LCOE. Net plant output and water consumption are the primary performance inputs to an LCOE model. These parameters were estimated using four different calculation tools which ultimately were driven by three inputs: ambient dry bulb, ambient wet bulb, and steam cycle heat input.
Hourly ambient dry/wet bulb temperatures were obtained from the TMY3 weather dataset for Alamosa, CO, which also provided direct normal insolation (DNI) data used in NREL’s Solar Advisor Model (SAM) program. SAM provided the steam cycle heat input, also referred to as thermal energy to the power block (Q_PB), as well as thermal energy to storage (Q_to_ts) and thermal energy from storage (Q_from_ts). GateCycle™ was used to model the Rankine cycle behavior and initially determined the plant’s design point conditions. A unique GateCycle™ model was developed for the three condensing configurations. Several off-design heat balance models were independently run varying dry-bulb temperature, wet-bulb temperature, and steam cycle heat input. Model results were compiled and numerically fit into a three-variable interpolative lookup function, using Microsoft Excel tools, to arrive at the various plots and tables presented herein.
Using this all-inclusive Excel spreadsheet, the inputs and equations were used to obtain cooling tower water makeup for every hour of a typical year. This same methodology was used to produce steam turbine electric gross output and Rankine cycle parasitic loads per hour. Solar system parasitic loads (i.e. HTF pumps, TES pumps, SCA drives, etc.) were calculated based on hourly heat input to the steam cycle, and heat input/output from the TES system. The HTF pumps and TES pumps were assumed to be variable speed driven.
The results of the evaluation are presented in the following sections.
87

11
3. CAPITAL COSTS Capital costs have been determined using a combination of vendor budgetary proposals and WorleyParsons’ equipment, commodity, and installation labor database. The capital costs are within a +/- 30% confidence range based on a conceptual engineering effort.
The results illustrate the differences in capital cost between the wet, dry, and parallel condensing designs. The solar field effective mirror aperture area for all cases is 905,790 m2. The thermal energy storage, solar field civil-site work, balance of plant mechanical/electrical, HTF system, electrical, instrumentation/controls and all other cost items which makeup a complete CSP plant were adjusted as necessary in each design to accommodate the condensing system and thermal storage impacts. Note, the higher Site Improvements cost associated with the 100% wet system is due to the significantly larger operational waste water evaporation pond.
The thermal energy storage equipment cost is based on a turnkey budgetary quote from the single commercially available salt storage vendor. An alternative cost savings approach would be to estimate the storage system from the ground up and compile vendor quotes for each sub-component (tanks, pumps, HX, etc.).
NREL has selected a 2.0 solar multiple to minimize LCOE, for plants with 6 hours of thermal storage. The solar multiple has a significant capital cost impact and is subject to further optimization, based on actual plant costs and the project developer's financial model.
Cost reflects NREL's selected 150-meter trough design. This trough is the most proven design with the most utility-scale installations; however, the associated materials and labor costs are higher than alternative emerging designs (i.e. 100-meter trough, or SkyFuel’s SkyTrough)
Labor rates are non-union merit-based for Pueblo, CO with a productivity factor of 1.2. This project’s average labor rate is 35% lower than the average hourly rate (union) used in the study of the Nevada Test Site CSP plant. This difference in labor is the driving factor behind the large capital savings between the NV and CO plants.
3.1 Vendor Quotes
WorleyParsons’ obtained budgetary quotes for the cooling tower, surface condenser, and air-cooled condenser. All other equipment and materials included in the makeup of a complete CSP trough plant were priced based on WorleyParsons’ extensive archive of past vendor quotes and previously constructed projects.
The following tables are a summary of the complete cost analysis showing the line items that build up the overall total installed capital cost for the three condensing options.
88

12
Table 3.1 Estimated capital cost summary for wet, parallel, and dry condensing plants.
Case 100% Wet Parallel 100% Dry Description 100% Wet-Cooled Parallel Case 100% Dry Cooled
Site Improvements $34,501,000 $19,615,958 $18,483,239 Solar Field $335,001,000 $335,001,000 $335,001,000 HTF System $73,585,928 $73,585,928 $73,585,928 Thermal Energy Storage $182,541,000 $182,541,000 $182,541,000 Fossil Backup - - - Power Plant $106,559,193 141,601,355 136,347,546 EPCM Costs $29,001,000 $29,001,000 $29,001,000 Project, Land, Misc. - - - %DC's Sales Tax - - - Subtotal $761,189,121 $781,346,241 $774,959,713 Contingency $55,795,000 $57,307,153 $56,838,739
TOTAL INSTALLED COST $816,524,000 $838,653,394 $831,798,452
4. PERFORMANCE
This section provides data tables and graphs of the performance results for all cases. Fixing the solar heat input to the steam cycle for the base and alternate cases allowed for a more direct comparison of the costs and performance.
For plants with thermal storage, SAM sends the solar energy to storage until there is enough energy to operate the steam turbine at or near full load, after which the energy is sent to the power block. If thermal storage is not present, SAM operates the steam turbines at lower load points to avoid wasting energy; however this study does not include plants without storage. This is illustrated in Figures 4.0 below which shows the operating hours of the steam turbines at various load points. The minimum steam turbine load used in this study is 20% of rated load. (Note: The parallel operation is very close to the wet operation and is not visible in some of the figures below).
89

13
Figure 4.0
Annual Hours of Net Generation at 5MWe Ranges100MWe Nominal Net CSP Trough Plant with 6 Hrs TES
San Luis Valley, CO
0
250
500
750
1000
1250
1500
1750
2000
2250
2500
2750
10 15 20 25 30 35 40 45 50 55 60 65 70 75 80 85 90 95 100 105 110 115
Net Electric Generation (MWe)
Ope
ratio
n w
ithin
Net
Gen
erat
ion
Ran
ge (h
ours
)
Wet Cooling
Dry Cooling
Parallel Cooling
4.1 Performance Results
Table 4.1 summarizes the performance results for the wet, dry, and parallel condensing designs.
Table 4.1 Colorado plant performance summary.
Performance Results Wet Parallel Dry Solar Input to Collector Field (MWth) 905.69 905.69 905.69 Design Steam Cycle Thermal Input (MWth) 295.40 295.40 295.40 Design Gross Steam Turbine Output (MWe) 113.90 113.27 111.34 Design Plant Parasitic Losses (MWe) 13.90 14.70 14.18 Plant Net Output (MWe) at Design Conditions 100.00 98.57 97.16 Design Gross Steam Turbine Efficiency (%) 38.58 38.37 37.72 STG Gross Annual Generation (MWe-hrs/yr) 397,245 388,906 387,435 Plant Net Annual Generation (MWe-hrs/yr) 367,602 363,219 361,778 Annual Backfeed Electricity (MWe-hrs/yr) 3,354 3,354 3,354
90

14
Figure 4.1.1 through 4.1.2 illustrates annual net generation distribution as function of ambient dry bulb temperature. The plant net generation shown in these plots represents the electric energy produced for export to the grid and does not include plant auxiliary power that may be purchased from the grid when the plant is offline.
Figure 4.1.3 illustrates the plant’s average net output as a function of the ambient dry bulb temperature. SAM’s default Southern California Edison (SCE) thermal storage time of day dispatch structure was used in all cases. The trends recognized in the plots below are entirely driven by SAM’s use of the storage dispatch profile.
91

15
Figure 4.1.1 Net energy production at different ambient temperatures for different condensing systems.
Annual Net Electric Energy Generation at 5 Degree Dry Bulb Temperature Ranges100MWe Nominal Net Design CSP Trough Plant with 6 Hrs TES
San Luis Valley, CO
0
5
10
15
20
25
30
35
40
45
50
-25 -20 -15 -10 -5 0 5 10 15 20 25 30 35 40 45 50 55 60 65 70 75 80 85
Dry Bulb Temperature (F)
Net
Gen
erat
ed E
lect
ric P
ower
(MW
e-hr
s E+
03)
Wet Cooling
Dry Cooling
Parallel Cooling
92

16
Figure 4.1.2 Percentage of net energy production at different ambient temperatures for different condensing systems.
Fraction of Annual Net Generation Occuring at 5 Degree Dry Bulb Temperature Ranges100We Net Nominal CSP Trough Plant with 6 Hrs TES
San Luis Valley, CO
0%
1%
2%
3%
4%
5%
6%
7%
8%
9%
10%
11%
12%
13%
14%
-25 -20 -15 -10 -5 0 5 10 15 20 25 30 35 40 45 50 55 60 65 70 75 80 85
Dry Bulb Temperature (F)
Frac
tion
of A
nnua
l Net
Gen
erat
ion
(MW
e-hr
/MW
e-hr
)
Wet Cooling
Dry Cooling
Parallel Cooling
93

17
Figure 4.1.3 Average Net Plant output at different ambient temperatures for different condensing systems.
Average Net Electric Power Generation at 5 Degree Dry Bulb Temperature Ranges100MWe Nominal Net CSP Trough Plant with 6 Hrs TES
San Luis Valley, CO
0
10
20
30
40
50
60
70
80
90
100
110
120
-25 -20 -15 -10 -5 0 5 10 15 20 25 30 35 40 45 50 55 60 65 70 75 80 85
Dry Bulb Temperature (F)
Ave
rage
Ele
ctric
Pow
er G
ener
atio
n (M
We)
Wet Cooling
Dry Cooling
Parallel Cooling
94

18
4.2 Performance Discussion
Plants with a 100% wet condensing design will typically have a more efficient steam cycle across all load points and ambient temperatures. Moreover, this is especially true in dry climates with high ambient temperatures such as Nevada. A cooling tower’s performance is governed by the wet bulb temperature, whereas a dry cooling system’s capabilities are dictated by the dry bulb temperature. The 2% maximum design dry bulb for this Colorado site is 84.7°F whereas the wet bulb is only 60.2°F. Although this provides a performance advantage to wet condensing, the advantage pales in comparison to hotter climates like Nevada. On these hot days, a wet system is able to condense the steam turbine exhaust at a lower temperature, pressure, and enthalpy, resulting in more power extracted from the steam flow. The wet system was able to achieve a steam cycle efficiency of 38.58% at the design conditions, whereas the dry system could only achieve 37.72% even with a very large ACC designed with an aggressive ITD of 25°F.
For the same duty at full capacity, an ACC with a 25°F ITD will typically have higher auxiliary loads than a wet system due to its larger number of fans. This further reduces the net plant output of the dry plant on hot days compared to the wet cooled plant. However, hotter dry-bulb temperatures generally have lower relative humidity and therefore the dry bulb temperature drops faster than the wet bulb temperature. As a result, the auxiliary loads of a dry condensing system drop quicker than those of wet system with the reduction in ambient temperature.
These net output differences between the dry and wet cooled plants can be seen on figure 4.1.3. Due to the inherent exhaust losses in the ACC ducting system, the dry cooled system can never achieve as low a steam turbine exhaust pressure as the wet cooled system. The minimum turbine exhaust pressure with an ACC is typically 2.0 in HgA due to these duct losses. At ambient temperatures below freezing, this minimum pressure is raised to 2.5” HgA to prevent freezing in the bundle tubes.
The cold Colorado climate also increases the heat loss in the HTF piping and receiver tubes. Higher heat loss will negatively impact plant start-up time, overall efficiency, freeze protection, and maintenance. Means to mitigate these impacts may include employing a gas-fired start-up heater, increasing HTF pipe insulation thickness or material properties, and/or effectively equipping all critical equipment with adequate heat tracing and/or insulation. In this study, the auxiliary gas-fired boiler size and operation have been increased above the Nevada site to protect the HTF from freezing (using a steam condensing to HTF heat exchanger). No insulation or start-up system adjustments are included beyond what is calculated by SAM.
Since a wet system is able to maintain a more consistent turbine exhaust pressure across the operating ambient temperature range, the exhaust velocities are also more constant. This allows a wet condensing system to operate closer to the peak efficiency point on the steam turbine exhaust loss curve more often than a dry condensing system. The parallel system also has this benefit over the dry condensing system.
The objective of a parallel system is to combine the hot day generating performance of the wet system with the water conserving benefits of the dry system on cooler days. At the San Luis Valley site, the summer dry bulb temperatures are low enough that the performance of the all dry design performance is not reduced significantly compared to the wet. The improved steam turbine efficiency of the parallel design yields higher annual gross steam generation compared to the dry, but it is offset by the increased auxiliary loads of the wet system’s fan and circulating water pumps.
95

19
Figure 4.1.3 illustrates the manner in which the SAM model simulates the operation of a CSP plant with thermal storage. With thermal storage the steam turbine is not started until there is enough heat to operate at or near full load. If the plant were to have no thermal storage the turbine would operate whenever sufficient heat is available to run at minimum load.
96

20
5. WATER CONSUMPTION
This analysis compares the water consumption between the wet, dry, and parallel cooling designs on an annual consumption basis. The three-variable equation discussed in Section 2.7 was used to arrive at an annual cooling tower makeup quantity for the wet condensing system. Other water consumers considered in this study include mirror washing and steam cycle makeup.
Without having site specific information, raw water quality was assumed sufficient for cooling tower use with 4 cycles of concentration and therefore no pre or post water treatment is included. Cooling tower blowdown is discharged to onsite evaporation ponds. Electrostatic deionization and multimedia filtration equipment are included in the design to treat the raw water and produce demineralized (demin) water for steam cycle makeup and solar collector mirror washing. The water consumption table below identifies the water quantity required by each consumer. Note that the demin water system rejects wastewater from the reverse osmosis process and backwash water from the multimedia filtration process. These reject quantities are included in the demin water consumption values below.
5.1 Cooling Tower
Cooling tower makeup is the largest user of water, primarily consuming it through evaporation and secondarily by blowdown rejection. Evaporation is a function of the cooling load and wet bulb temperatures. Blowdown is based on water quality (which assumes 4 cycles of concentration), evaporation, and cooling tower drift. The annual water consumption of the cooling towers was calculated as describe above. The circulating water system also provides the heat sink for the closed cooling water system that cools the auxiliary plant equipment. Due to the low ambient dry bulb and high precipitation frequency in the San Luis Valley compared to the Nevada site, evaporation ponds tend to require more surface area for the same reject flow rates than in hotter climates.
5.2 Air Cooled Condenser
Utilizing a dry condensing system consumes minimal water compared to a wet system. The ACC is a closed loop system not having evaporation or blowdown. Steam cycle makeup is assumed to be slightly higher for the dry condensing system than the wet because obtaining optimal cycle water chemistry is more difficult with ACCs and therefore more blowdown is needed during start-up. In the absence of a cooling water sink (i.e. cooling tower) am air-cooled heat exchanger (fin-fan) is needed to cool plant auxiliary equipment. In hot climates like Nevada where the ambient dry bulb temperature frequently (>2%) exceeds 85°F a supplemental wet surface air cooler (WSAC) is used in parallel with the fin-fan cooler to meet cold water temperature requirements that cannot be met by direct dry air cooling. This is not the case for cooler climates such as Alamosa CO, where dry bulb temperatures exceed 85°F less than 0.4% of the year. Therefore a fin-fan cooler can provide sufficient auxiliary cooling 100% of the time.
97

21
Table 5.2.1 Estimated Annual Water Consumption (Acre-Feet/Year)
Water Consumers (water quality) Wet Condensing
Parallel Condensing
Dry Condensing
Cooling Tower Makeup (Raw) 848 13 0 Steam Cycle Operating Makeup (Demin) 13 13 13 Steam Cycle Makeup at Startup (Demin) 13 19 19 Mirror Wash Water (Demin) 44 44 44 Totals 919 90 77
Figure 5.2
Estimated Annual Water Consumption100MW Nominal Net CSP Trough Plant with 6 hours TES
San Luis Valley, CO
0
100
200
300
400
500
600
700
800
900
1,000
Wet, 6hrs TES Dry, 6hrs TES Parallel, 6hrs TES
Cooling Design Cases
Ann
ual W
ater
Con
sum
ptio
n (A
c-Ft
/Yr)
Mirror WashStartupBD QuenchCT Makeup
5.3 Water Consumption Discussion Approximately 92% percent of the wet condensing plant’s annual water consumption is used by the cooling tower. Mirror wash water consumption is fixed for all cases since all cases have the same solar field size. Regardless of the cooling system employed, steam cycle makeup is roughly the same for all cases; with the exception of dry cooled start-up where ACCs take longer to pull full vacuum and obtain optimal steam cycle chemistry and therefore consume more steam cycle and quench water in the process. Altogether the wet condensing plant consumes about 12 times that of the dry condensing plant under the design parameters of this study. The parallel design only consumed 17% more water than the all dry system, but it did not yield any performance benefits. In addition, due to the infrequency of wet cooling operation in the parallel case, all auxiliary cooling loads are assumed to be cooled by a fin-
98

22
fan cooler while the cooling tower is presumably laid –up during the winter and shoulder months. This will save additional water and O&M costs for the parallel plant but the fin-fan cooler may consume more parasitic power compared to evaporative cooling, depending on configuration. Annual water consumption contributes to the operations and maintenance cost as a plant consumable. This reoccurring cost will ultimately contribute to the final LCOE analysis discussed in the next section.
99

23
6 LEVELIZED COST OF ELECTRICITY ANALYSIS
The levelized cost of electricity was determined by calculating the net present value of the nominal capital and operations and maintenance costs per year and discounting them back to the present. The net present value was them divided by the annual net output per year to determine the cost per MW–hr. The annual (O&M) costs are escalated 2009 dollars. The levelized annual costs and LCOE are nominal dollars as the effects of inflation are not included in this analysis. The capital costs are assumed to occur entirely in 2009 and the annual costs are assumed to start with the plant operation in year 2013. The LCOE is based on the plant operating for 30 years through 2042. Other items such as capital financing, construction financing, taxes, renewable credits, financial incentives, debt ratios, depreciation, loan periods, etc. were not included as they were considered to be project and company specific. The intent of this analysis was to provide a technical LCOE based on the data in the tables below that would allow a relative comparison of the performance and costs of the various cooling system designs. Further economic considerations can be added to this data to obtain an economic or financial analysis for a specific project within a specific company. Table 6.0 Levelized cost of electricity model inputs and output summary. Discount rate: 5.25% Water Cost $/acre-ft $450 Commercial Operation Date: 2013 Economic Operating Life: 30 Plant O&M cost nominal escalation: 1.50%
Designs with 6 hr TES Wet Parallel Dry
Plant Output (MW-hr/yr) 367,602 363,219 361,778 Total Capital Cost $816,524,000 $838,653,394 $831,798,452 Annual O&M Cost $11,296,625 $10,990,453 $10,972,639 NPV $948,603,278 $964,945,208 $958,159,692 Nominal Levelized Yearly Cost $63,477,622 $64,571,174 $64,117,108 Nominal LCOE ($/MW-hr) $172.68 $177.77 $177.23
100

24
The wet condensing design had the lowest LCOE as it had the lowest capital cost and the highest annual electricity production. The parallel design, while having more annual net generation than the dry design, did not produce enough generation to offset its higher capital costs. This resulted in the parallel case having the highest LCOE across all designs. As expected the dry design had a higher LCOE than the wet design, yet slightly lower than the parallel. This is all based on a $450/acre-foot water cost. As the cost of water rises or the quality of water diminishes the dry cooled plant LCOE will approach the wet cooled plant and in some extreme cases it will be less.
7 CONCLUSIONS AND RECOMMENDATIONS
The LCOE for all the designs are very close; the dry cooled plant increasing LCOE about 2.6% above the 100% wet configuration and the parallel plant LCOE is slightly higher than the 100% dry configuration. In dry climates such as Colorado and Nevada, it is expected that wet condensing designs would have better economic results with the cost of water assumed in this study. This is due to the fact that wet cooling can achieve a lower steam turbine exhaust pressure and the cooling equipment is less expensive. In more humid climates, the wet cooling is less efficient and thus the economic differences would be smaller. Cooler dry bulb temperatures reduce the negative impacts of dry cooling which is the reason that the LCOE difference between the wet and dry designs in Nevada is larger than that of the Colorado site. This study focused on the cooling technology differences and assumed that the water supplied to the plant was similar in quality to typical city tap water. The actual quality of the water available in remote sites where CSP plants would most likely be located could require very expensive water treatment systems that could drive the LCOE of the wet design higher than the dry design. Actual water supply and treatment costs need to be considered when performing a similar study for an actual project. A high level sensitivity analysis was performed to investigate the effect of varying the ACC ITD for the dry design on the total plant cost per MW-hr at full load in 5°F increments from 30°F to 85°F dry bulb. The lower ITD designs resulted in more annual generation but at higher initial capital costs. The ACCs with 25°F, 30°F, and 35°F ITDs were within 0.1% of each other, in $/MW-hr, whereas the 40°F ITD ACC was 0.7% higher. The optimum ACC ITD for a specific site will depend on the actual steam turbine selected and the last stage blade and annulus area options available for that turbine. In the San Luis Valley of Colorado, a parallel cooled CSP trough plant with an all dry ACC ITD of 25°F is not economically justified relative to an all dry design. The same large ACC used in the all dry design was used in the parallel design to minimize water consumption. However, the advantages of parallel cooling over dry cooling were not fully realized since there were few operating hours which benefited from wet cooling which did not offset the added expense and complexity of a parallel system. A high level sensitivity analysis was also performed on the parallel system which indicated a 0.8% improvement in $/MW-hr (vs. parallel configuration used in study) could be obtained by using an all dry ACC with a 40°F ITD and a larger wet cooling system (compared to parallel cooling configuration used in study). However, this improvement is accompanied by an approximate 130% increase in estimated annual water consumption, compared to the study’s parallel configuration
101
25
This study simulated the operation of the parallel plant to maximize net power output. It could be operated to conserve more water and in doing so the performance and operating costs would approach that of the all dry plant with the same size ACC. Since a 40°F ITD parallel design (ITD with wet portion turned off) would have a smaller ACC, trying to reduce water consumption by running the wet portion less will result in lower net output than doing the same with a 25°F ITD parallel design. This study does not consider market electricity price impacts. It is likely that power purchase agreements for some projects/locations may have a time-of-use payment structure for peak power which can make parallel cooling configurations more attractive than 100% dry cooled plants. The relative LCOE figures presented above are good guidelines of what to expect from the different condensing technologies for the site evaluated and other sites with similar climates. More in depth analysis based on specific project criteria is required in order to make a determination of the best cooling configuration for a San Luis Valley project.
102

F1147-E(10/2008)
REPORT DOCUMENTATION PAGE Form Approved OMB No. 0704-0188
The public reporting burden for this collection of information is estimated to average 1 hour per response, including the time for reviewing instructions, searching existing data sources, gathering and maintaining the data needed, and completing and reviewing the collection of information. Send comments regarding this burden estimate or any other aspect of this collection of information, including suggestions for reducing the burden, to Department of Defense, Executive Services and Communications Directorate (0704-0188). Respondents should be aware that notwithstanding any other provision of law, no person shall be subject to any penalty for failing to comply with a collection of information if it does not display a currently valid OMB control number. PLEASE DO NOT RETURN YOUR FORM TO THE ABOVE ORGANIZATION. 1. REPORT DATE (DD-MM-YYYY)
December 2010 2. REPORT TYPE
Technical report 3. DATES COVERED (From - To)
4. TITLE AND SUBTITLE
Water Use in Parabolic Trough Power Plants: Summary Results from WorleyParsons' Analyses
5a. CONTRACT NUMBER DE-AC36-08-GO28308
5b. GRANT NUMBER
5c. PROGRAM ELEMENT NUMBER
6. AUTHOR(S) C.S. Turchi, M.J. Wagner, and C.F. Kutscher
5d. PROJECT NUMBER NREL/TP-5500-49468
5e. TASK NUMBER SM10.1530
5f. WORK UNIT NUMBER
7. PERFORMING ORGANIZATION NAME(S) AND ADDRESS(ES) National Renewable Energy Laboratory 1617 Cole Blvd. Golden, CO 80401-3393
8. PERFORMING ORGANIZATION REPORT NUMBER NREL/TP-5500-49468
9. SPONSORING/MONITORING AGENCY NAME(S) AND ADDRESS(ES)
10. SPONSOR/MONITOR'S ACRONYM(S) NREL
11. SPONSORING/MONITORING AGENCY REPORT NUMBER
12. DISTRIBUTION AVAILABILITY STATEMENT National Technical Information Service U.S. Department of Commerce 5285 Port Royal Road Springfield, VA 22161
13. SUPPLEMENTARY NOTES
14. ABSTRACT (Maximum 200 Words) The National Renewable Energy Laboratory (NREL) contracted with WorleyParsons Group, Inc. to examine the effect of switching from evaporative cooling to alternative cooling systems on a nominal 100-MW parabolic trough concentrating solar power (CSP) plant. WorleyParsons analyzed 13 different cases spanning three different geographic locations (Daggett, California; Las Vegas, Nevada; and Alamosa, Colorado) to assess the performance, cost, and water use impacts of switching from wet to dry or hybrid cooling systems. NREL developed matching cases in its Solar Advisor Model (SAM) for each scenario to allow for hourly modeling and provide a comparison to the WorleyParsons results. Our findings indicate that switching from 100% wet to 100% dry cooling will result in levelized cost of electricity (LCOE) increases of approximately 3% to 8% for parabolic trough plants throughout most of the southwestern United States. In cooler, high-altitude areas like Colorado’s San Luis Valley, WorleyParsons estimated the increase at only 2.5%, while SAM predicted a 4.4% difference. In all cases, the transition to dry cooling will reduce water consumption by over 90%. Utility time-of-delivery (TOD) schedules had similar impacts for wet- and dry-cooled plants, suggesting that TOD schedules have a relatively minor effect on the dry-cooling penalty.
15. SUBJECT TERMS parabolic trough; water; dry cooling; CSP; solar
16. SECURITY CLASSIFICATION OF: 17. LIMITATION OF ABSTRACT
UL
18. NUMBER OF PAGES
19a. NAME OF RESPONSIBLE PERSON a. REPORT
Unclassified b. ABSTRACT Unclassified
c. THIS PAGE Unclassified 19b. TELEPHONE NUMBER (Include area code)
Standard Form 298 (Rev. 8/98) Prescribed by ANSI Std. Z39.18


![A closed parabolic trough solar collector · Parabolic trough[1] is the most mature technology for large scale exploitation of solar energy. Several power plants based on this technology](https://img.dokumen.tips/doc/110x75/5e7fd11c9fd6e952d2270d99/a-closed-parabolic-trough-solar-collector-parabolic-trough1-is-the-most-mature.jpg)