Embed Size (px)
Citation preview
Water Supply Board Briefing
Water Operations Department
January 12, 2016
Water Supply Briefing
• California Water Supply
• Current Water Supply
• Freeport Water Delivery
• Water Supply Projections
• El Niño Outlook 2016
2
California Water
Supply
California Water Supply
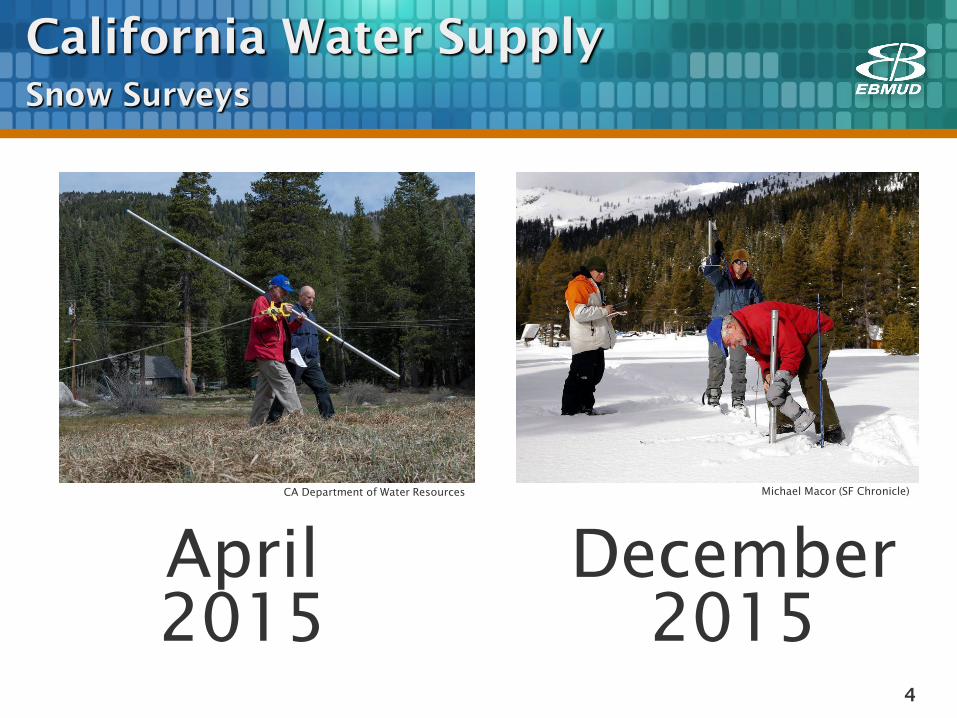
Snow Surveys
4
April
2015
December
2015
Michael Macor (SF Chronicle) CA Department of Water Resources
5
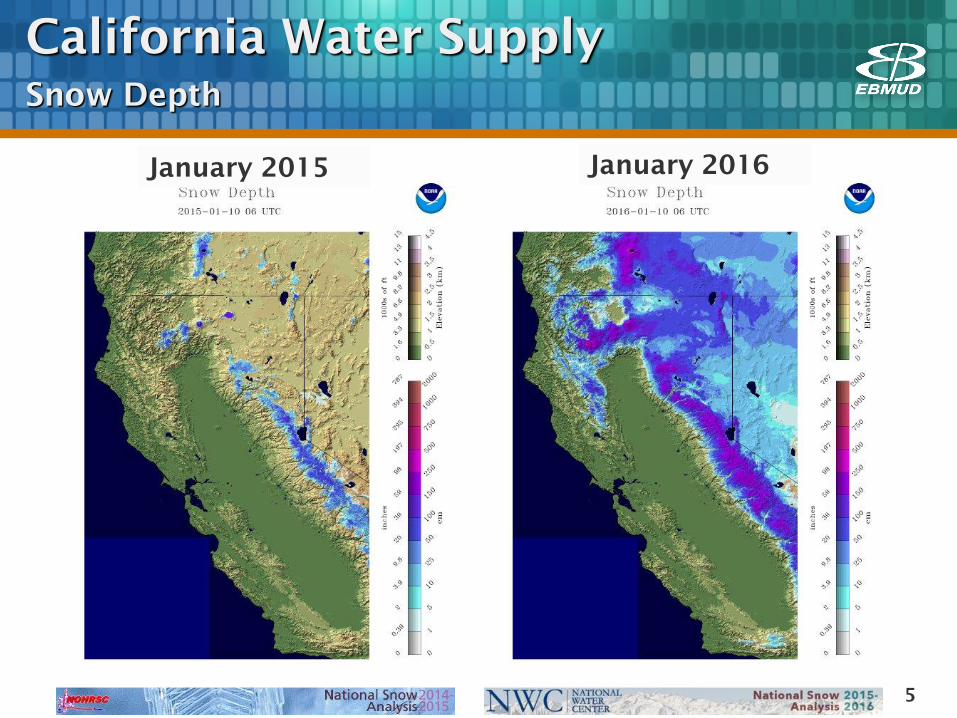
California Water Supply
Snow Depth
January 2015 January 2016
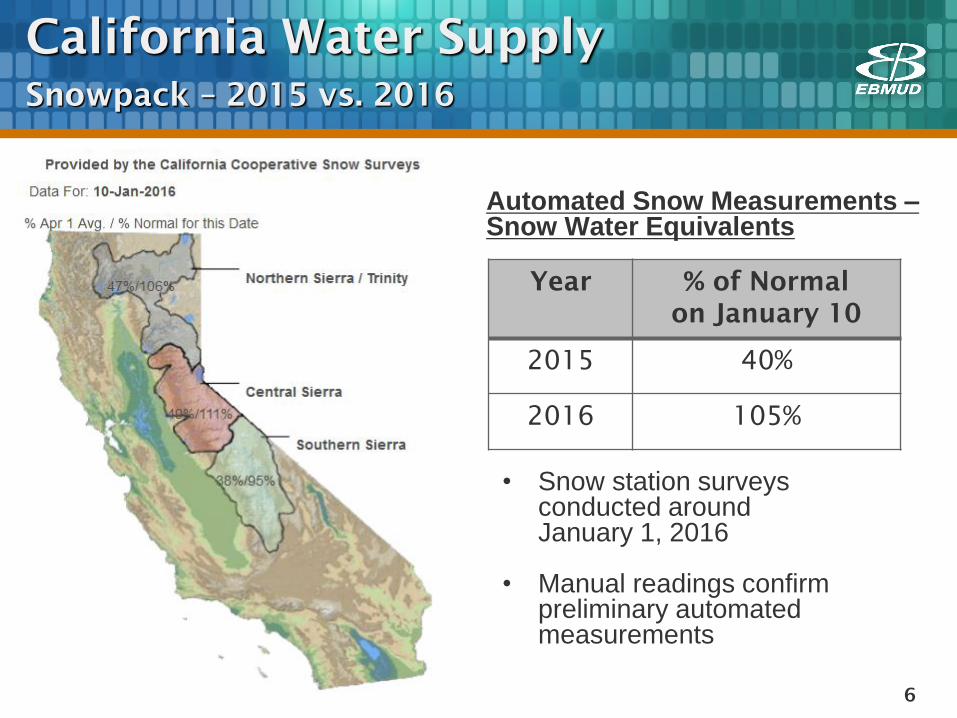
California Water Supply
Snowpack – 2015 vs. 2016
6
Automated Snow Measurements – Snow Water Equivalents
Year % of Normal
on January 10
2015 40%
2016 105%
• Snow station surveys conducted around January 1, 2016
• Manual readings confirm
preliminary automated measurements
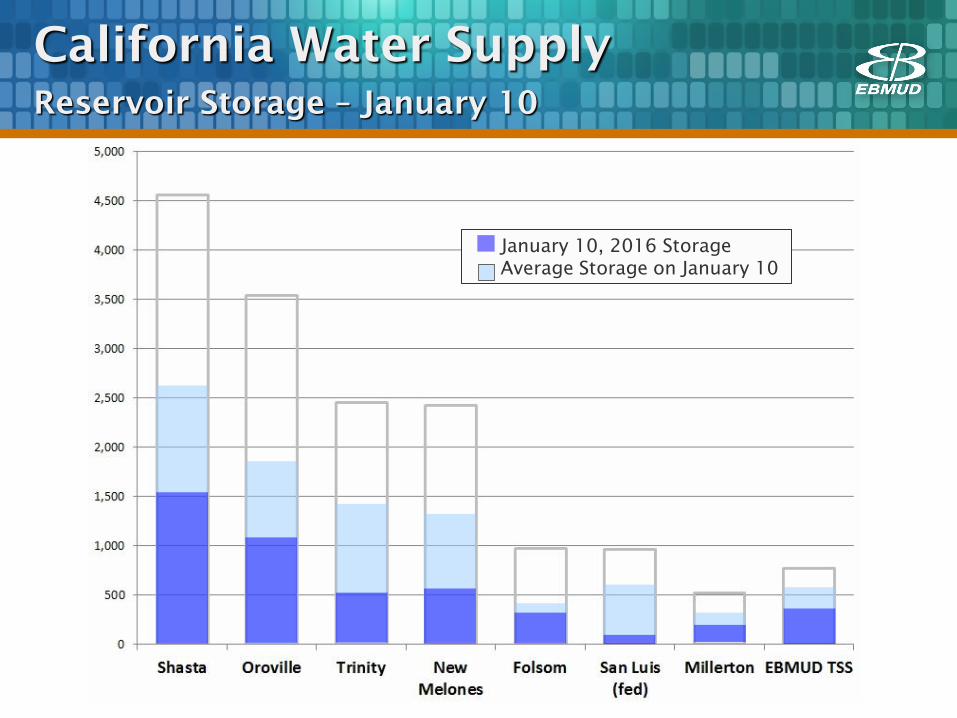
California Water Supply
Reservoir Storage – January 10
January 10, 2016 Storage
Average Storage on January 10
Current Water
Supply
8
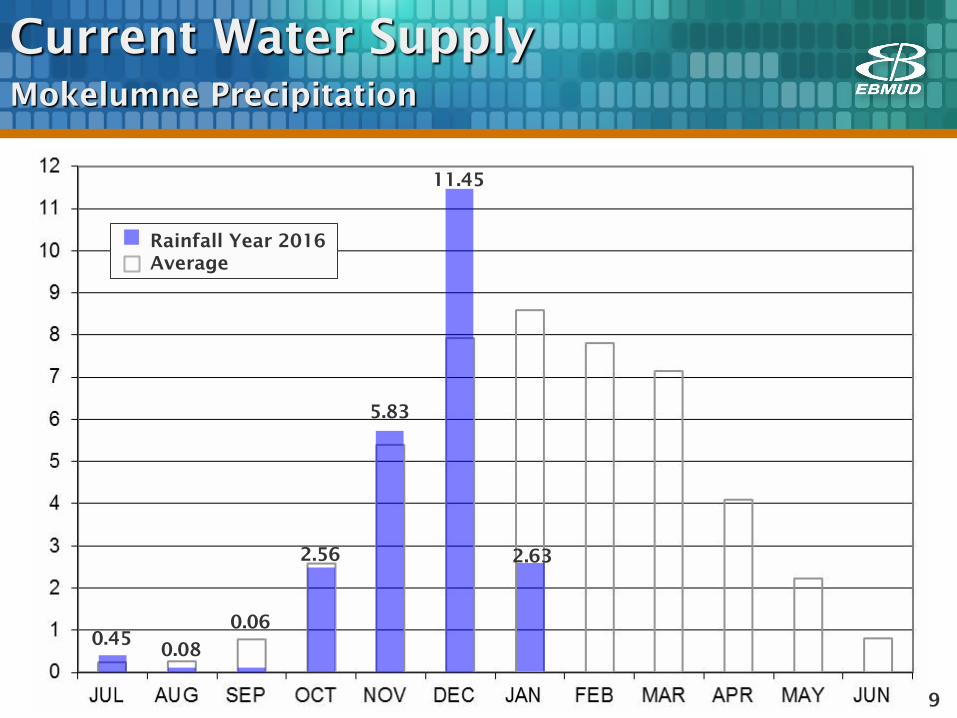
Current Water Supply
Mokelumne Precipitation
0.45 0.08
0.06
2.56
Rainfall Year 2016
Average
9
5.83
11.45
2.63
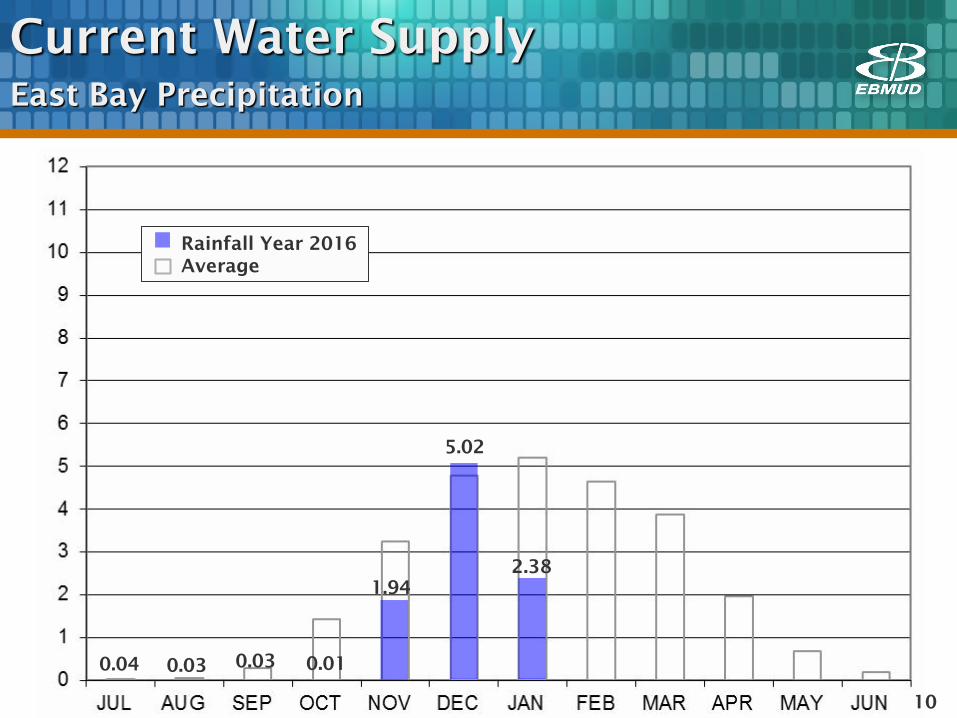
Current Water Supply
East Bay Precipitation
0.04 0.03 0.03 0.01
1.94
Rainfall Year 2016
Average
10
5.02
2.38
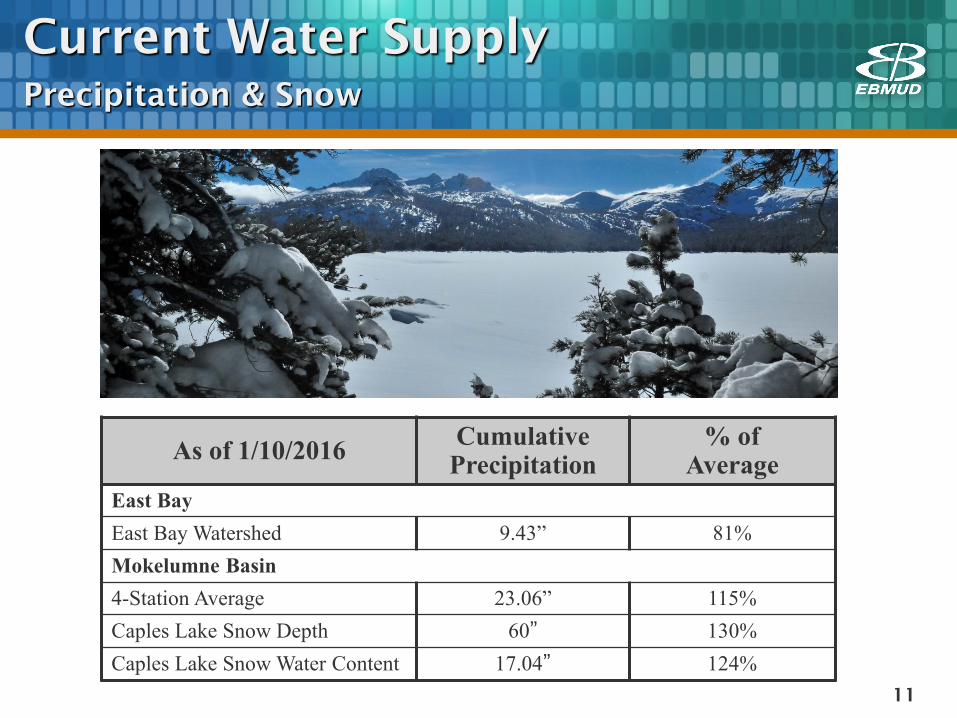
Current Water Supply
Precipitation & Snow
As of 1/10/2016 Cumulative
Precipitation % of
Average
East Bay
East Bay Watershed 9.43” 81%
Mokelumne Basin
4-Station Average 23.06” 115%
Caples Lake Snow Depth 60” 130%
Caples Lake Snow Water Content 17.04” 124%
11
Add current photos
December 8, 2015 December 21, 2015
12
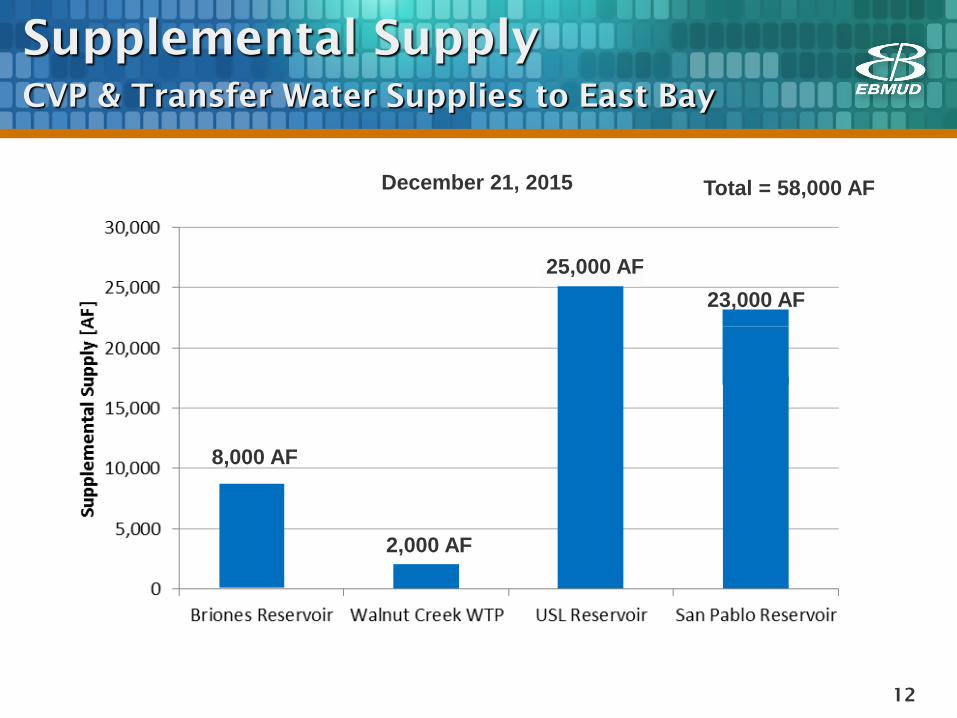
Supplemental Supply
CVP & Transfer Water Supplies to East Bay
2,000 AF
22,100 AF
8,000 AF
Total = 58,000 AF
23,000 AF
25,000 AF
13
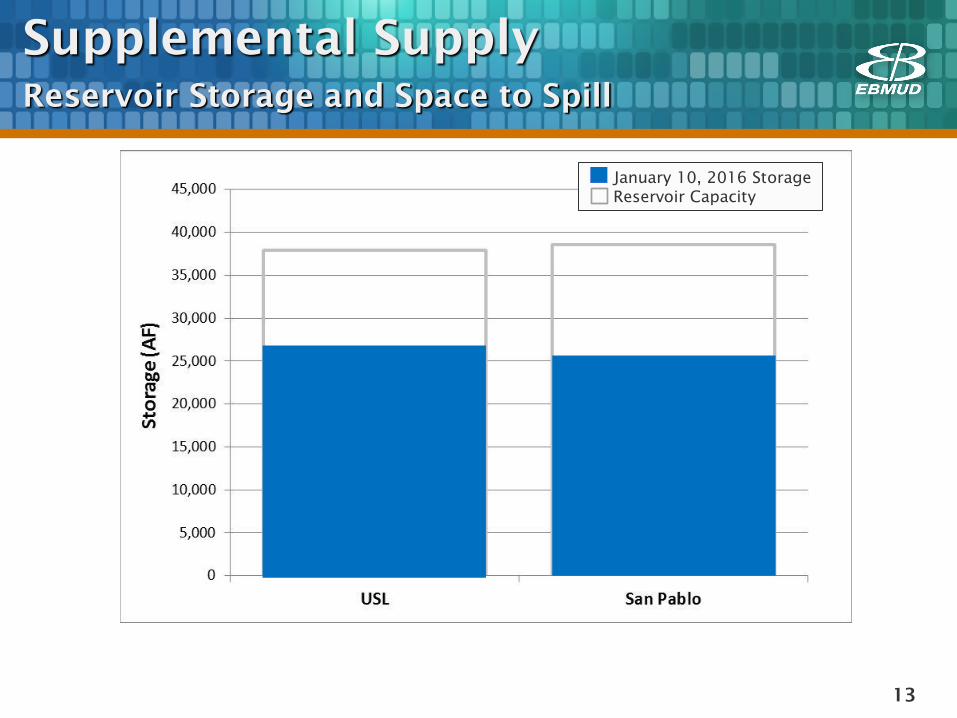
Supplemental Supply
Reservoir Storage and Space to Spill
January 10, 2016 Storage
Reservoir Capacity

Current Water Supply
Gross Water Production
14
100
150
200
250
300
1-Jul 1-Aug 1-Sep 1-Oct 1-Nov 1-Dec 1-Jan 1-Feb 1-Mar 1-Apr 1-May 1-Jun
gro
ss
wa
ter
pro
du
cti
on
(m
gd
)
3-Year Avg of FY 2005-2007
FY 2016
FY 2013 (184 MGD)
FY 2016 Operational Estimate (149 MGD)
15
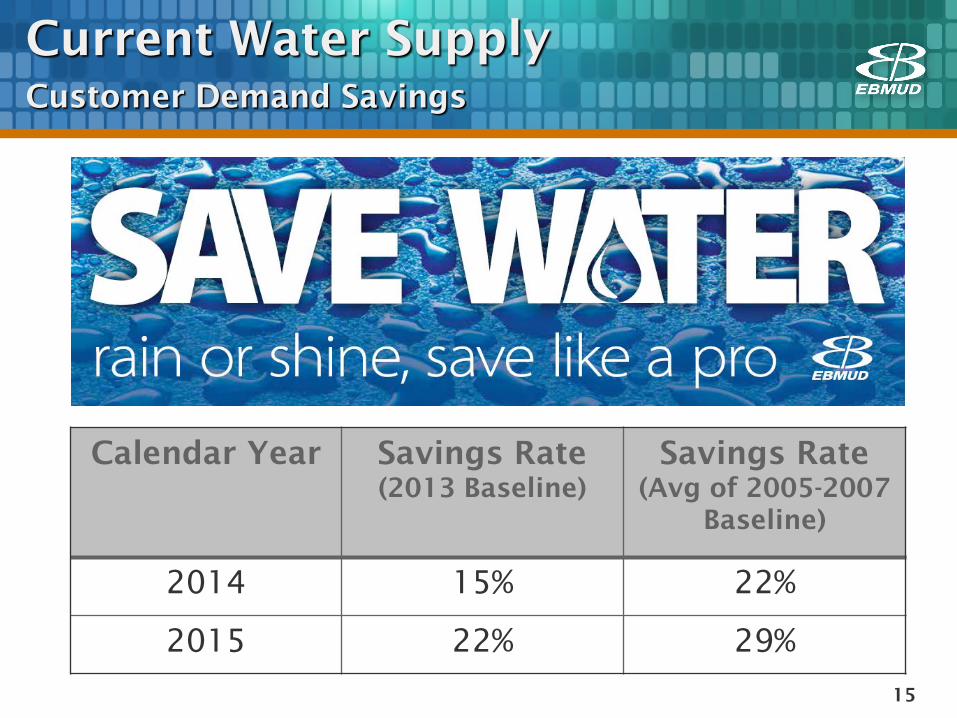
Current Water Supply
Customer Demand Savings
Calendar Year Savings Rate
(2013 Baseline)
Savings Rate
(Avg of 2005-2007
Baseline)
2014 15% 22%
2015 22% 29%
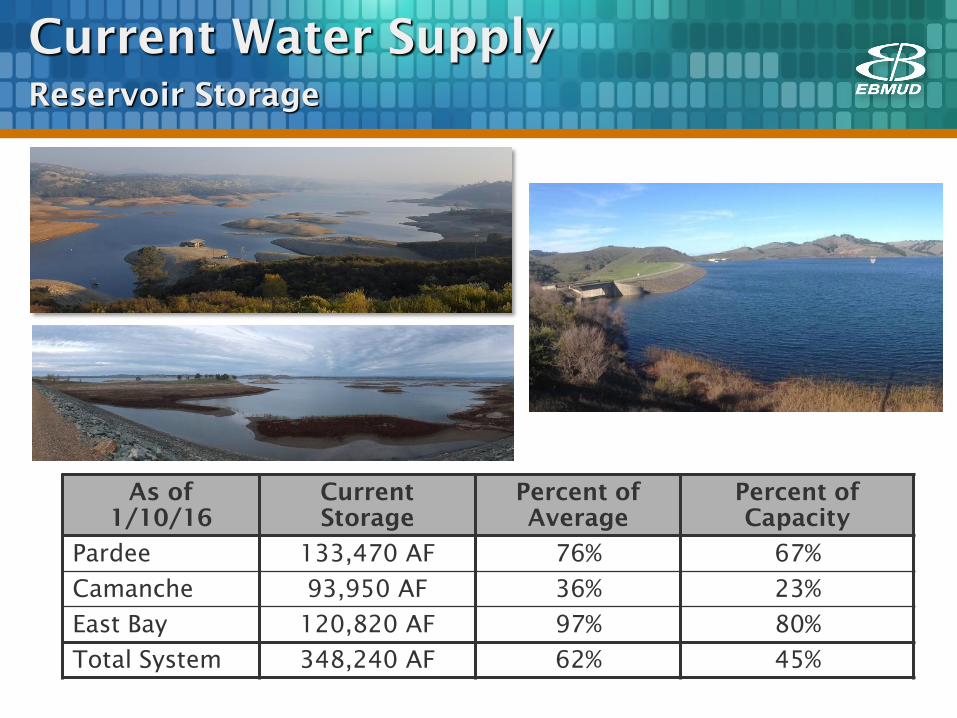
Current Water Supply
Reservoir Storage
As of
1/10/16
Current
Storage
Percent of
Average
Percent of
Capacity
Pardee 133,470 AF 76% 67%
Camanche 93,950 AF 36% 23%
East Bay 120,820 AF 97% 80%
Total System 348,240 AF 62% 45%

Water Supply
Projections

Water Supply Projections
(Runoff Projections as of January 10, 2016)
Forecast Annual Runoff
Total System Storage (on Sept 30, 2016)
90% Exceedence (9 of 10 years are wetter)
500 TAF 415 TAF
50% Exceedence (5 of 10 years are wetter)
760 TAF 630 TAF
10% Exceedence (1 of 10 years is wetter)
1,100 TAF 630 TAF
Average Year 745 TAF 630 TAF
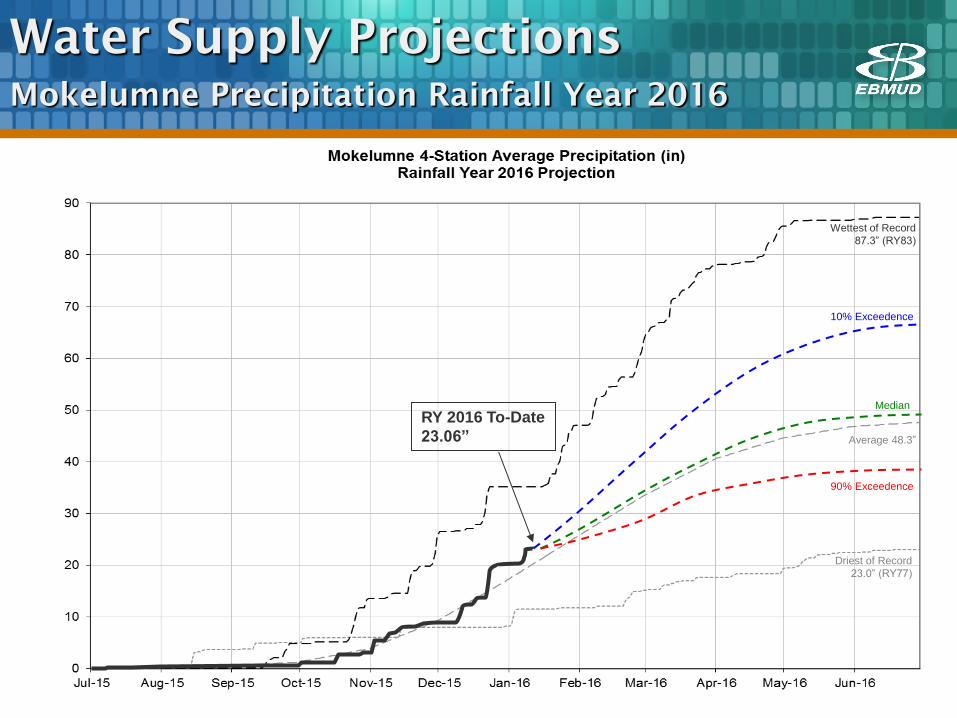
Water Supply Projections
Mokelumne Precipitation Rainfall Year 2016
Wettest of Record
87.3” (RY83)
Driest of Record
23.0” (RY77)
RY 2016 To-Date
23.06” Average 48.3”
10% Exceedence
90% Exceedence
Median

El Niño Outlook

21
El Niño Outlook
Definition of “El Niño”
Source: NOAA
22
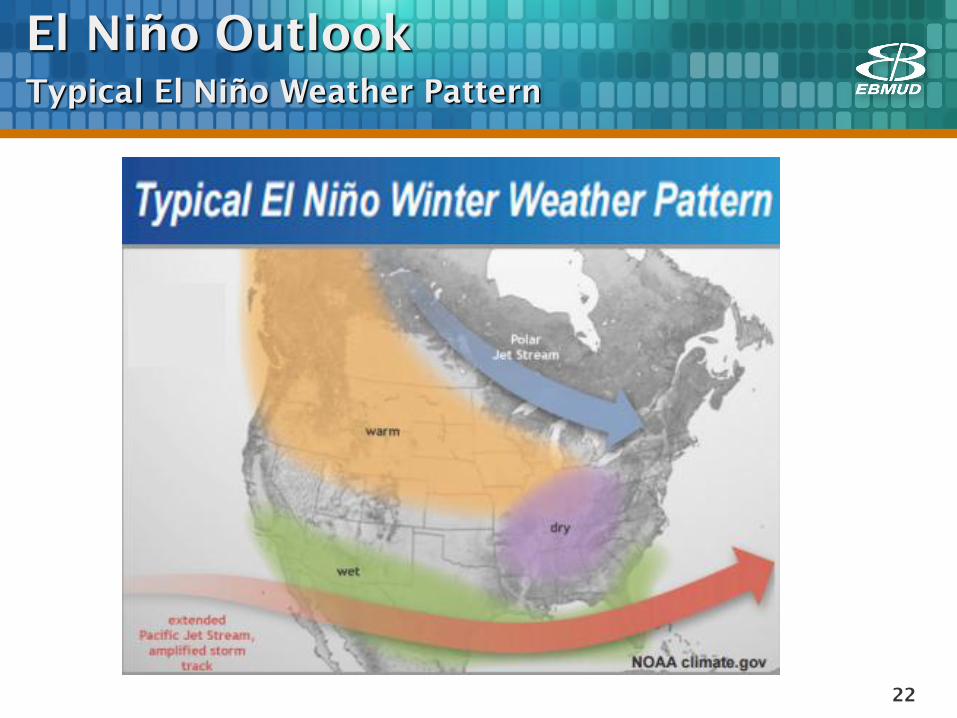
El Niño Outlook
Typical El Niño Weather Pattern
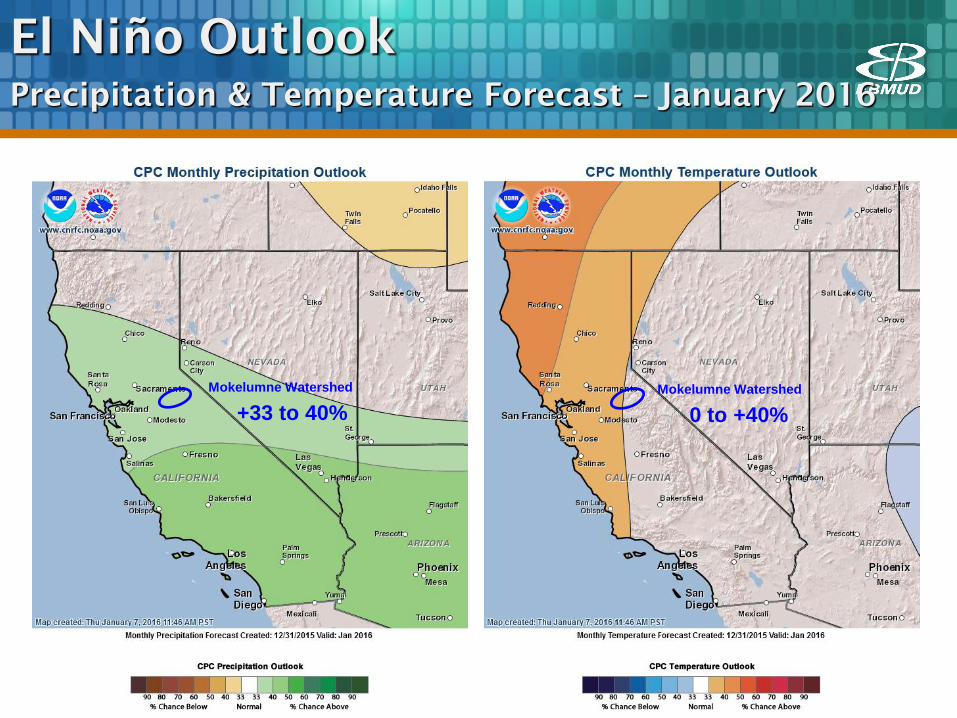
El Niño Outlook
Precipitation & Temperature Forecast – January 2016
Mokelumne Watershed
+33 to 40%
Mokelumne Watershed
0 to +40%
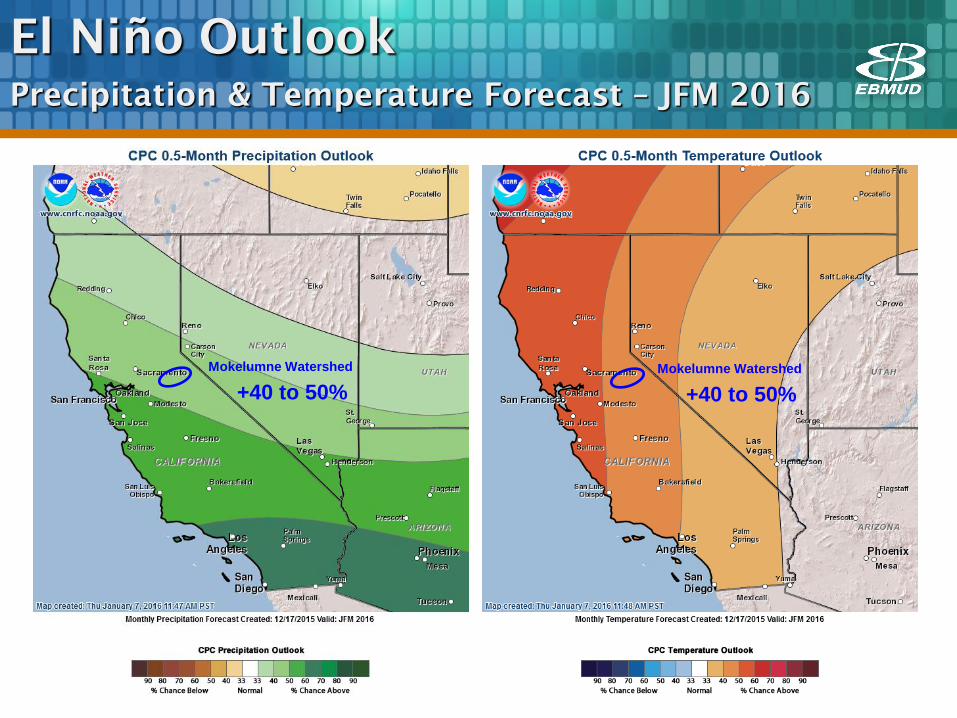
El Niño Outlook
Precipitation & Temperature Forecast – JFM 2016
Mokelumne Watershed
+40 to 50%
Mokelumne Watershed
+40 to 50%
25
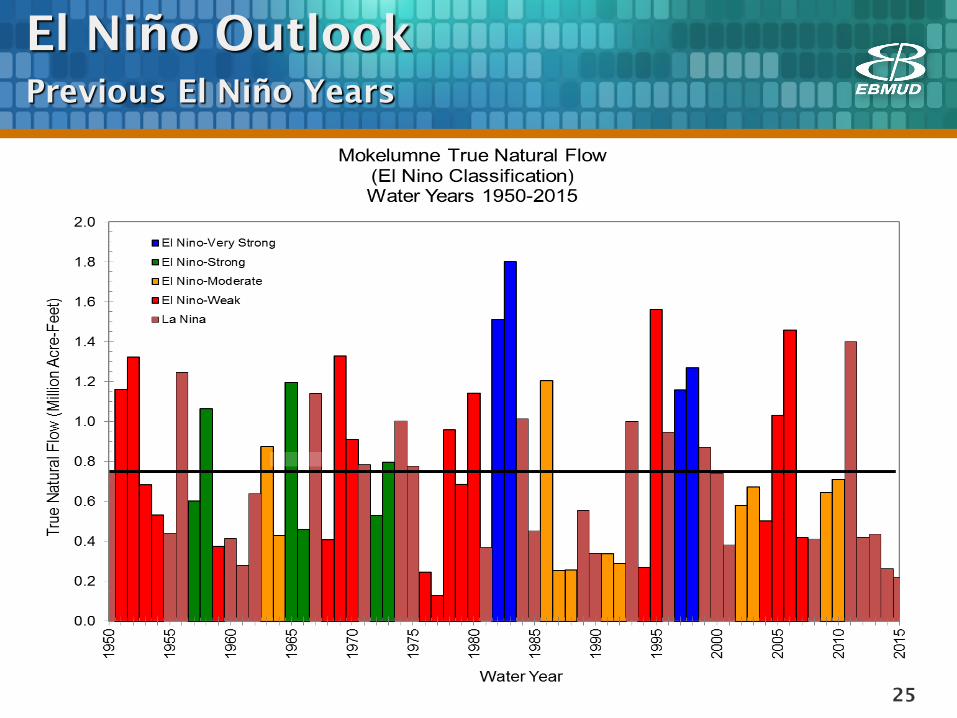
El Niño Outlook
Previous El Niño Years
26
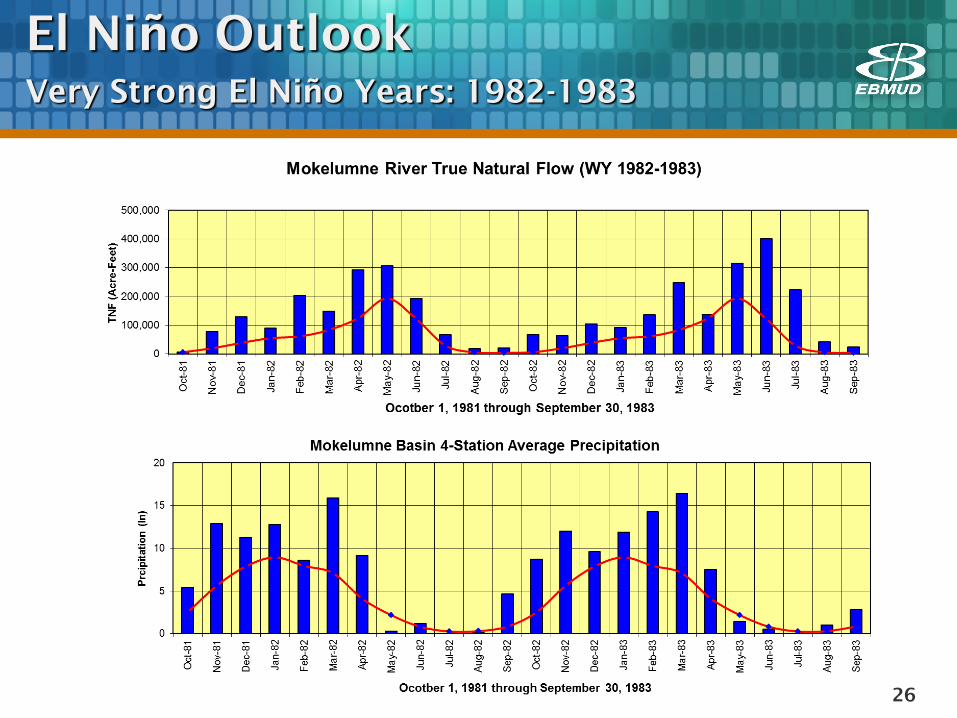
El Niño Outlook
Very Strong El Niño Years: 1982-1983
27
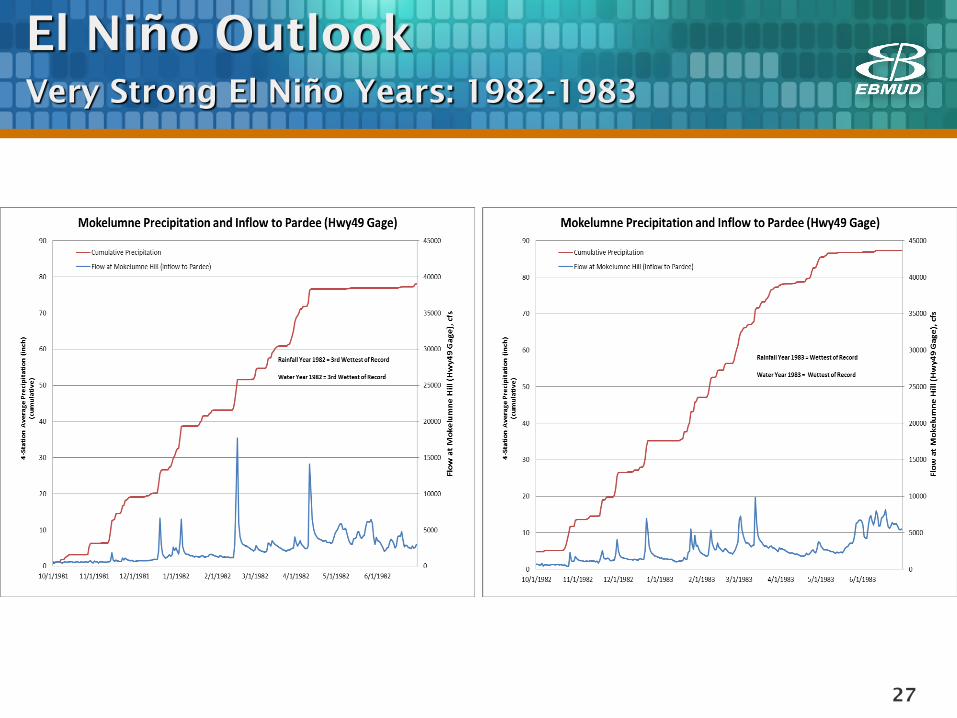
El Niño Outlook
Very Strong El Niño Years: 1982-1983

28
El Niño Outlook
Very Strong El Niño Years: 1997-1998
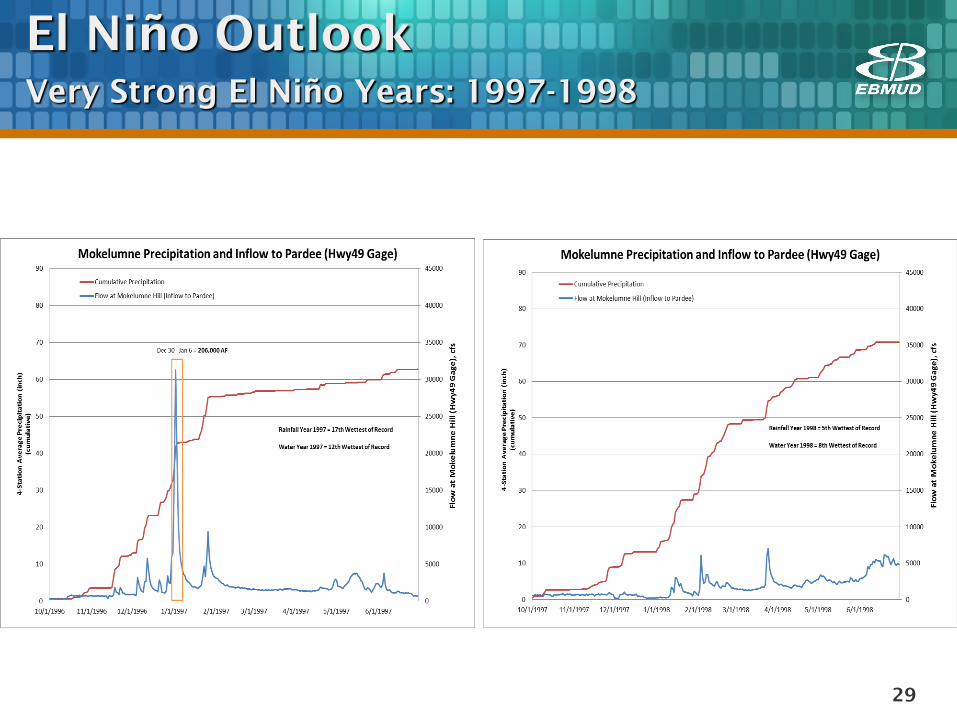
29
El Niño Outlook
Very Strong El Niño Years: 1997-1998
30
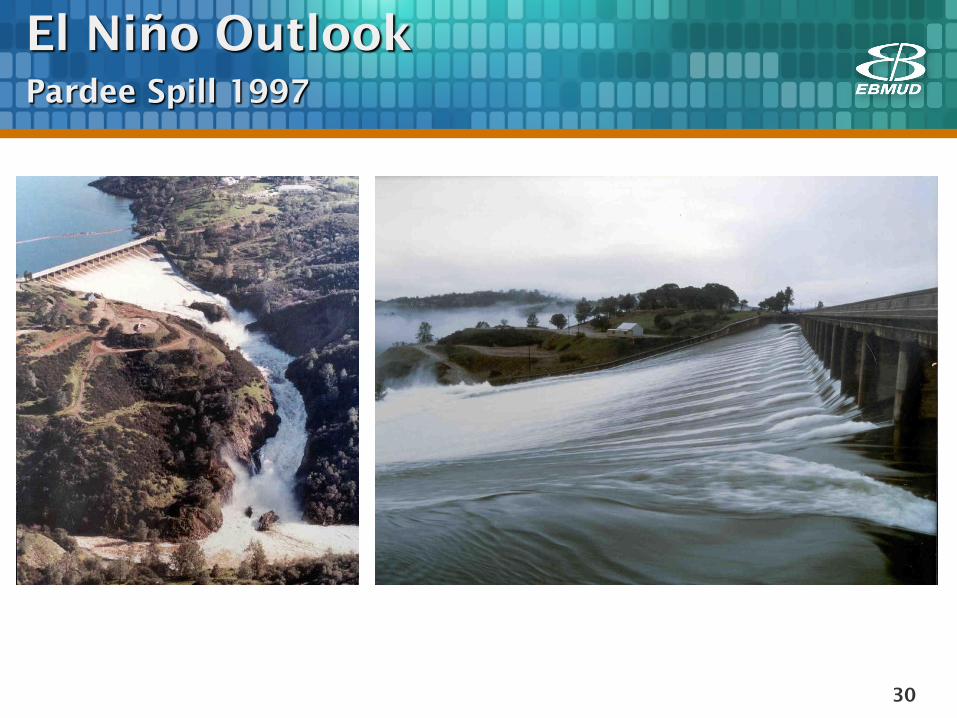
El Niño Outlook
Pardee Spill 1997
31
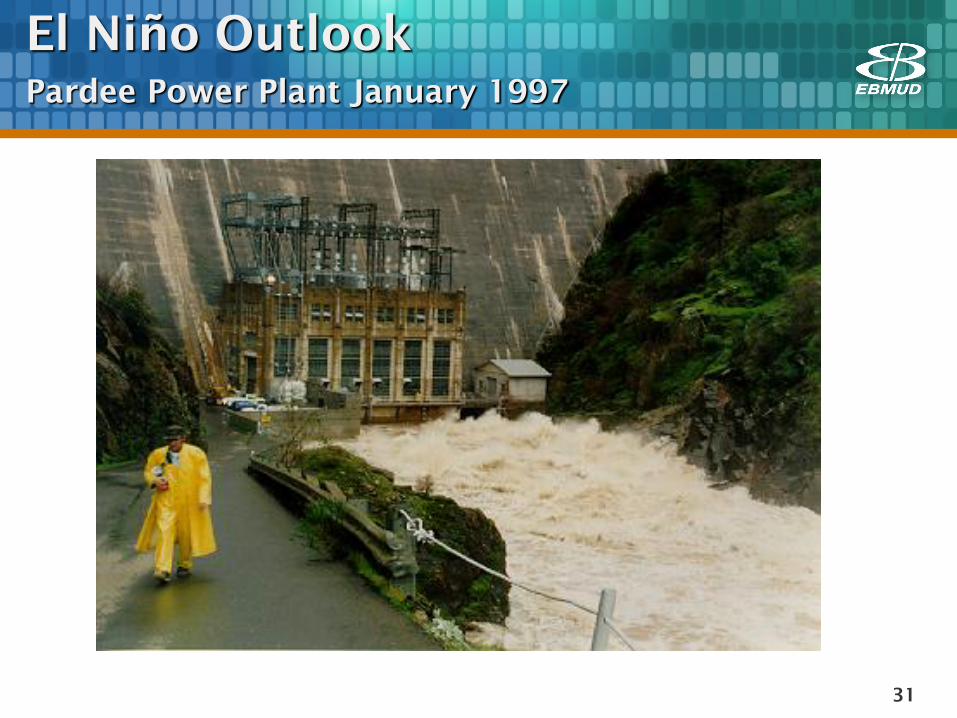
El Niño Outlook
Pardee Power Plant January 1997
32
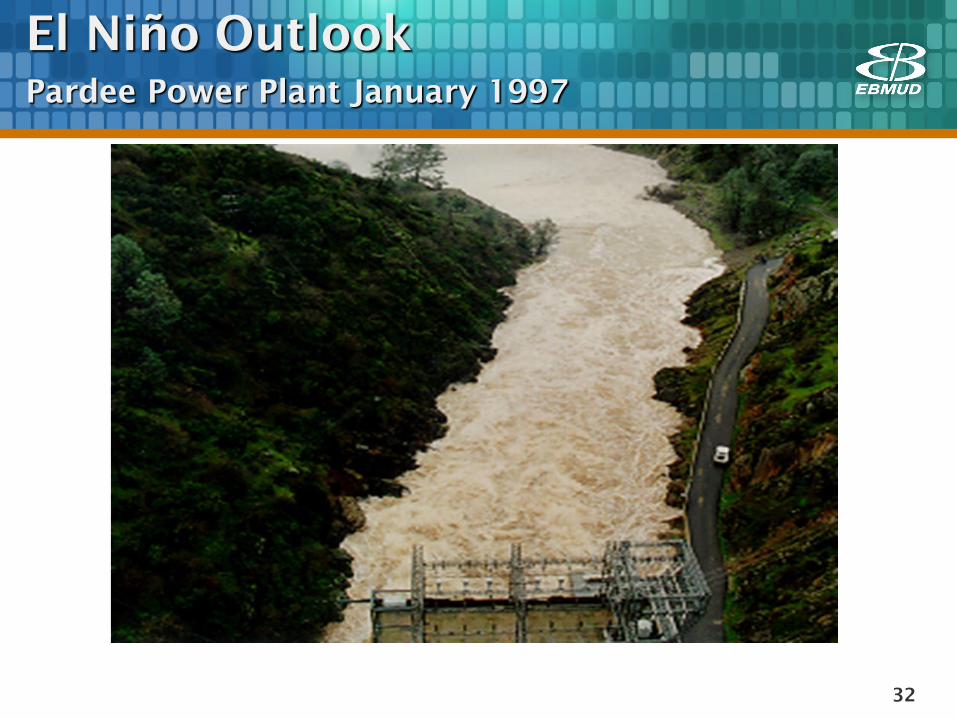
El Niño Outlook
Pardee Power Plant January 1997
33
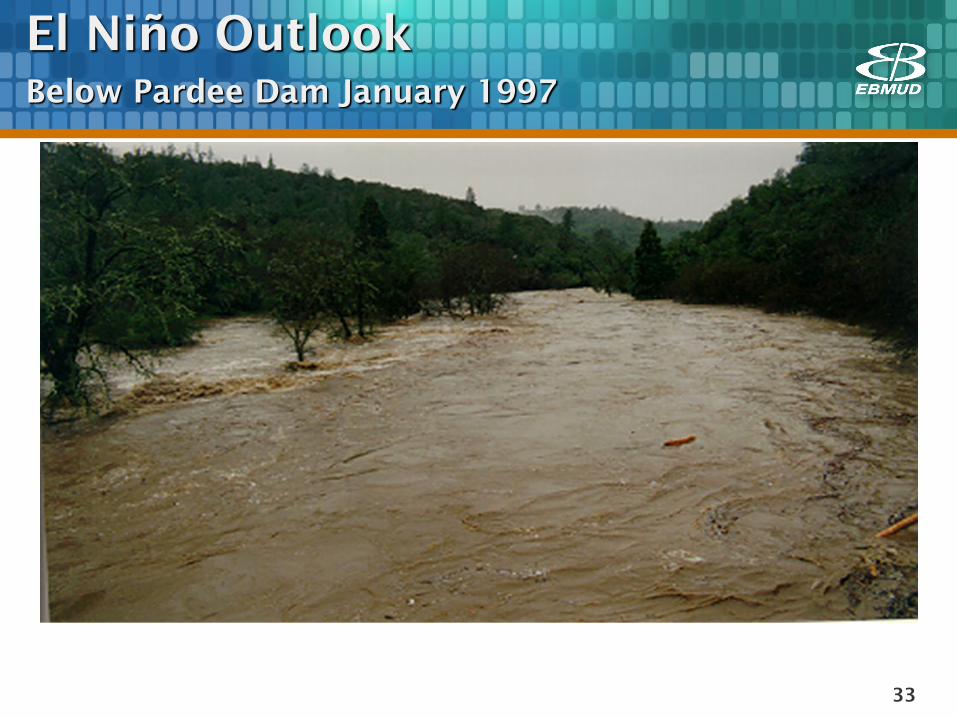
El Niño Outlook
Below Pardee Dam January 1997
34
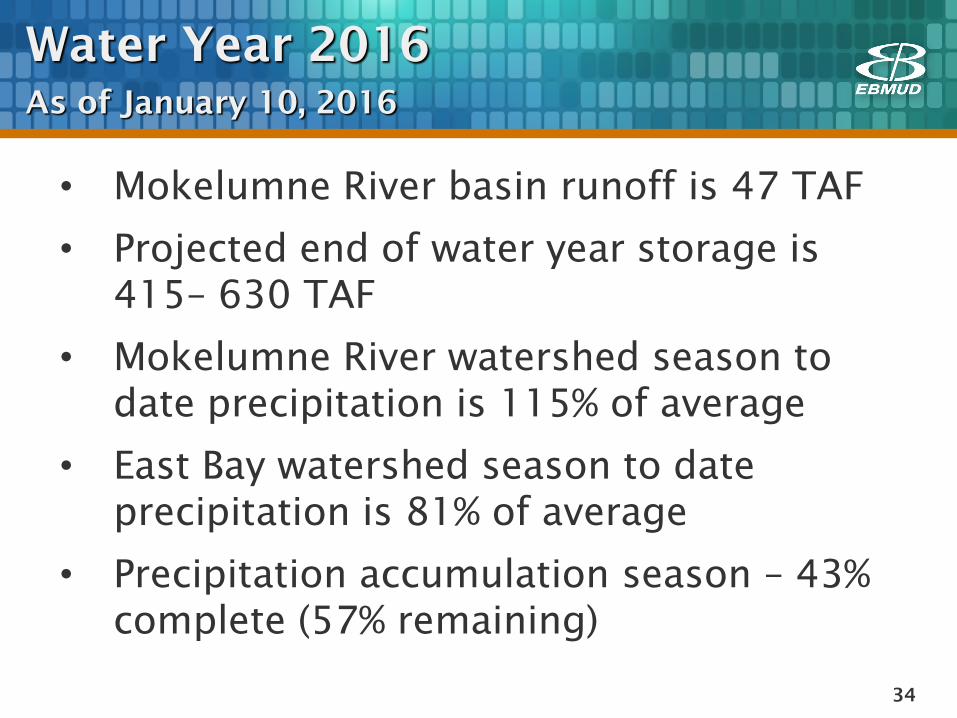
Water Year 2016
As of January 10, 2016
• Mokelumne River basin runoff is 47 TAF
• Projected end of water year storage is
415– 630 TAF
• Mokelumne River watershed season to
date precipitation is 115% of average
• East Bay watershed season to date
precipitation is 81% of average
• Precipitation accumulation season – 43%
complete (57% remaining)
35
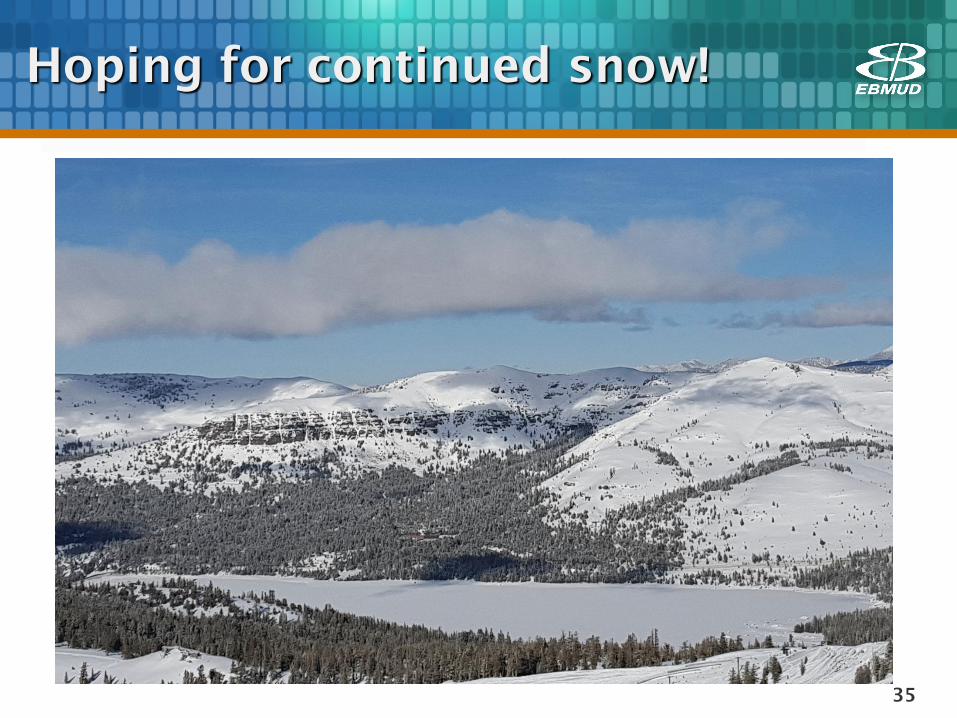
Hoping for continued snow!