Embed Size (px)
Citation preview

January 2017 Water Supply Briefing National Weather Service/Northwest River Forecast Center
Telephone Conference : 1-888-677-0012
Pass Code : 91999
2017 Briefing Dates:
Jan 5 – 10am Pacific Time
Feb 2 - 10am Pacific Time
March 2 - 10am Pacific Time
April 6 - 10am Daylight Savings Time
May 4 - 10am Daylight Savings Time
Kevin Berghoff, NWRFC [email protected]
(503)326-7291

Water Supply Forecast Briefing Outline
Review of 2016 Water Supply Season
Observed Conditions WY2017:
Precipitation
Temperature
Snowpack
Runoff
Future Conditions:
10 days of quantitative forecast precipitation (QPF)
10 days of quantitative forecast temperature (QTF)
Historical climate forcings appended thereafter
Climate Outlook
Modeling Changes, new products
Hydrologic
model states
Climate
Forcings

Climate Prediction Center 3 Month Seasonal Outlook issued 10/15/2015

Oceanic Nino Index (ONI) values since 1950
Peak ONI wy2016(NDJ)=2.3
Current ONI wy2017(SON)= -0.8

2016 Observed Runoff Volume Historical ONI Perspective

Precipitation Summary Water Year 2015 / 2016 comparison
84% 95%
Columbia River Basin abv The Dalles

Monthly Temperature Departures from Normal
Water Year 2015 / 2016 comparison
DIVISION NAME Oct Nov Dec Jan Feb Mar Apr May Jun Jul Aug Sep
Upper Snake River Basin abv American Falls Dam 5.8 -3.1 0.5 2 4.5 2.4 4.3 -0.1 3.6 -0.6 -0.4 -1.4
Clearwater River Basin 6.7 -1.3 1.5 2.8 6 2.5 6.8 2.9 3.4 0.3 1.6 0.2
Snake River Basin abv Ice Harbor Dam 6 -2.8 0.6 1.6 4.8 2.1 5.1 1 3.3 -0.6 0.4 -1
Flathead River Basin 4.2 -1.8 1.9 2.8 6.4 2.6 5.4 1.1 1.6 -1.5 -0.7 -1.5
Kootenai River Basin 4.9 -0.9 2.1 3.5 6.2 3.3 6.1 2.2 1.9 -0.8 0.8 -0.5
Columbia River Basin abv The Dalles 5.4 -2.1 1 2.1 5.2 2.3 5.5 1.6 2.4 -0.8 0.6 -1.1
2016 Monthly Temperature Departure from Normal - DegF

Observed Snowpack Conditions Water Year 2015 / 2016 comparison
Observed snow water equivalent (SWE) values provided by:
Natural Resources Conservation Service (NRCS) SNOTEL network
Environment Canada (EC) Automated Snow Pillow network
www.nwrfc.noaa.gov/snow
Apr 9, 2015 Apr 5, 2016

Observed Snowpack Conditions April - May 2016 comparison
Observed snow water equivalent (SWE) values provided by:
Natural Resources Conservation Service (NRCS) SNOTEL network
Environment Canada (EC) Automated Snow Pillow network
www.nwrfc.noaa.gov/snow
Apr 5, 2016 May 4, 2016

Observed Runoff Summary Water Year 2015 / 2016 comparison – Eastside of Cascades
2016
Oct –Sep
2016
Jan-Sep
2016
Apr-Sep
101 98 97
92 92 91
87 90 86
96 98 84
93 93 92
86 87 83
94 94 89
MCDQ2 Mica Dam
LYDM8 Libby Dam
HHWM8 Hungry
Horse
DWRI1
Dworshak
PALI1 Palisades
LGDW1 Lower
Granite
TDAO3 The Dalles
2015
Oct –Sep
2015
Jan-Sep
2015
Apr-Sep
109 107 104
85 82 74
92 88 64
79 75 45
93 91 87
73 69 56
86 82 69

Observed Runoff Summary Water Year 2015 / 2016 comparison – Westside of Cascades
2016
Oct –Sep
2016
Jan-Sep
2016
Apr-Sep
114 107 91
121 106 80
103 95 69
103 94 66
CONW1 Skagit R at Concrete
MYDW1 Mayfield Res - Cowlitz
MEHO3 N Santiam at Mehama
SLMO3 Willamette R at Salem
2015
Oct –Sep
2015
Jan-Sep
2015
Apr-Sep
103 88 64
92 77 51
83 63 50
79 62 52

Water Supply Forecast Briefing Outline
Review of 2016 Water Supply Season
Observed Conditions WY2017:
Precipitation
Temperature
Snowpack
Runoff
Future Conditions:
10 days of quantitative forecast precipitation (QPF)
10 days of quantitative forecast temperature (QTF)
Historical climate forcings appended thereafter
Climate Outlook
Modeling Changes, new products
Hydrologic
model states
Climate
Forcings

DIVISION NAME WY 2016
% NORM
WY 2017
% NORM
WY 2017
OBS (in)
Columbia River Basin above Grand Coulee Dam 101 118 14.9
Snake River Basin above Ice Harbor Dam 110 117 8.2
Columbia River Basin above The Dalles Dam 108 114 10.5
*Western Washington 121 108 40.8
*Western Oregon 138 137 36.6
Observed Seasonal Precipitation Water Year 2016 / 2017 Comparison
Monthly Temperature Departures from Normal
Water Year 2016 / 2017 comparison

Snowpack Summary Water Year 2016 / 2017 January Comparison
Jan 7, 2016 Jan 3, 2017

Current Adjusted Runoff Conditions Water Year 2017
Oct 1– Jan 2 UPPER COLUMBIA BASIN
MICA 130
DUNCAN 144
QUEENS BAY 187
LIBBY 151 HUNGRY HORSE 208 GRAND COULEE
SNAKE RIVER BASIN
JACKSON LAKE 152 PALISADES 123 DWORSHAK 123 LOWER COLUMBIA BASIN THE DALLES 136
Percent of Normal

Water Supply Forecast Briefing Outline
Review of 2016 Water Supply Season
Observed Conditions WY2017:
Precipitation
Temperature
Snowpack
Runoff
Future Conditions:
10 days of quantitative forecast precipitation (QPF)
10 days of quantitative forecast temperature (QTF)
Historical climate forcings appended thereafter
Climate Outlook
Modeling Changes, new products
Hydrologic
model states
Climate
Forcings
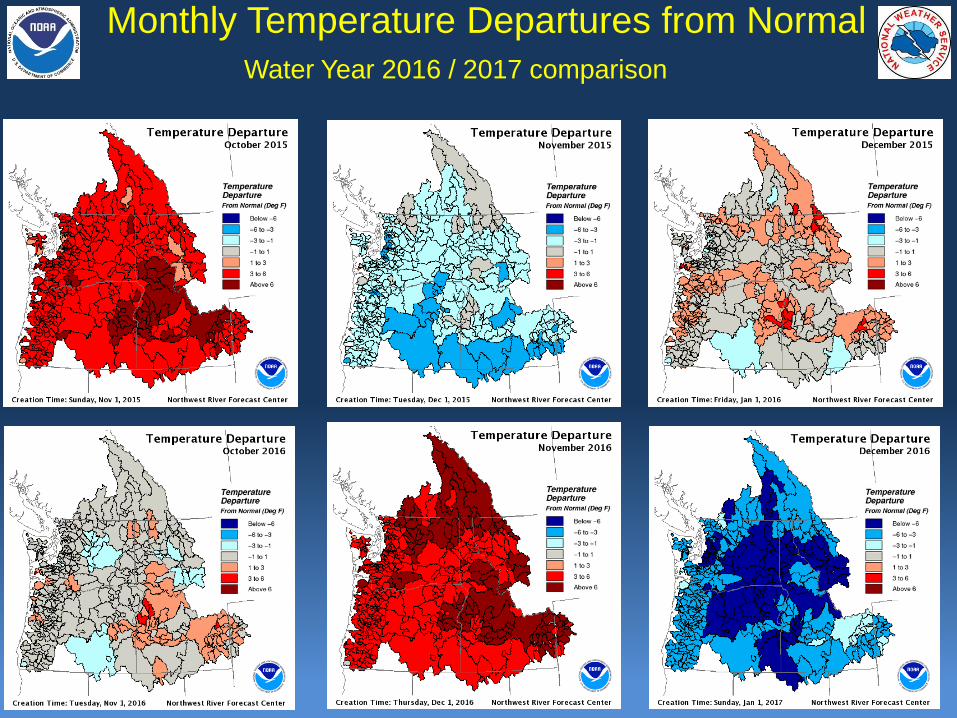
Current ENSO Discussion
ENSO Alert Status: La Nina Advisory
• Below average sea surface temperature (SST) anomalies in central
and eastern Pacific Ocean
• Transition to ENSO-neutral is favored during Jan-Mar 2017

IRI/CPC Plume Forecast
• Multi-model averages
indicate a transition to
ENSO-neutral during the
Northern Hemisphere
winter 2016-17.

CPC Climate Outlook Current Month Outlook Three Month Outlook
Precipitation
Temperature

Cumulative 10 Day Precipitation 1/3/2017 – 1/13/2017

Forecast Period Apr-Jul
Statistical Summary of ESP Water Supply Ensemble Traces Conveyed as Volume Exceedance Probabilities

NWRFC Water Supply Product Columbia River at The Dalles

Water Supply Forecasts Upper Columbia Basin
Jan 2017 Apr – Sep Forecast Kootenai River - Libby Dam 100%
Coeur d’Alene River
- Coeur d’Alene Lake 106%
SF Flathead River - Hungry Horse Dam 99%
Columbia River - Grand Coulee Dam 98%
Issued
Jan 3, 2017
Issued
Jan 3, 2017
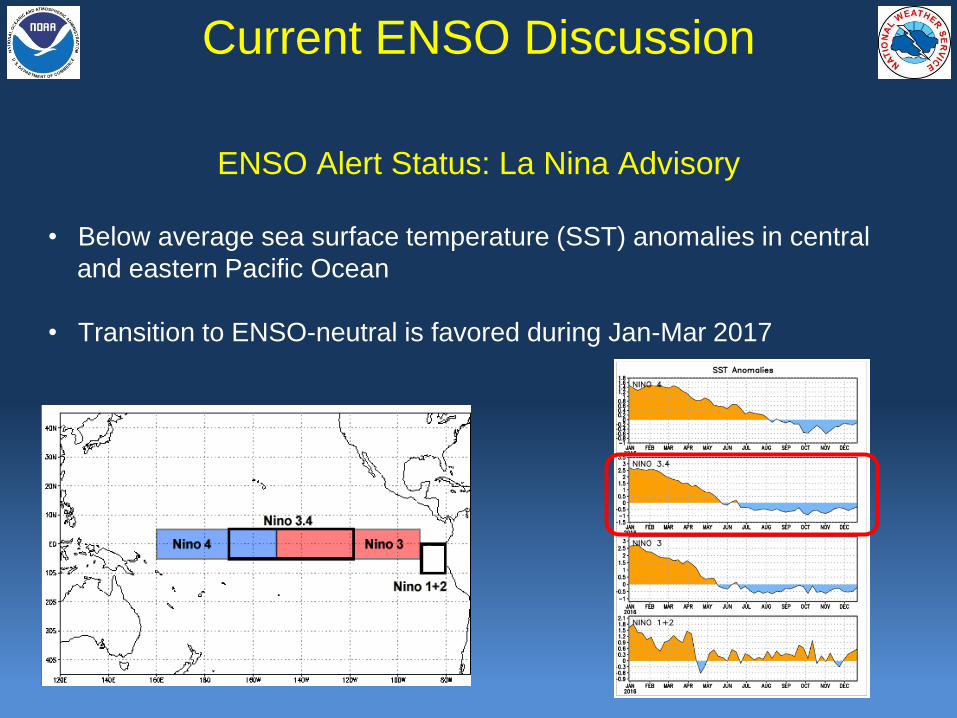
Water Supply Forecasts Snake River Basin and Columbia Mainstem
Jan 2017 Apr – Sep Forecast Upper Snake River - Jackson Lake Dam 120% Upper Snake River - Palisades Dam 134% NF Clearwater River - Dworshak Dam 113% Lower Snake River - Lower Granite Dam 110% Lower Columbia - The Dalles Dam 101%

Water Supply Forecasts Western Oregon and Washington Cascades
Jan 2016 Apr – Sep Forecast Skagit River - near Concrete 98% Cowlitz River - Mayfield Reservoir 106% North Santiam - At Mehama 104%
Willamette River - At Salem 96%
Jan 3, 2017

2017 ESP Volume Forecast Products

2017 ENSO Runoff Analysis Available mid to late Jan 2017
Current ESP volume forecast
Summary
• 2016wy Review Summary
• Very strong ENSO signal – tied with highest ONI value on record
• Slightly below normal precipitation
• Above normal temperatures
• Very rapid snowmelt in April
• Below normal runoff volume
• 2017wy Summary
• Above normal precipitation for Oct – Dec
• Substantially cooler temperatures in Dec
• Above normal snowpack in WA and OR Cascades, Upper Snake
• Near or below normal snowpack in Upper Columbia and Eastern WA
• ESP water supply volume forecast above normal in the Upper/Mid Snake
River Basin, near normal in Upper and Mainstem Columbia River.

NWRFC 2017 Water Supply Briefing Schedule
https://attendee.gotowebinar.com/rt/8111931086353869315

NWRFC Webpage Address Change
https://www.nwrfc.noaa.gov/rfc