Embed Size (px)
Citation preview

Water Resources of the Utica-Rome Area New York
GEOLOGICAL SURVEY WATER-SUPPLY PAPER 1499-C

Water Resources of the Utica-Rome Area New YorkBy H. N. HALBERG, O. P. HUNT, and F. H PAUSZEK
WATER RESOURCES OF INDUSTRIAL AREAS
GEOLOGICAL SURVEY WATER-SUPPLY PAPER 1499-C
UNITED STATES GOVERNMENT PRINTING OFFICE, WASHINGTON : 1962

UNITED STATES DEPARTMENT OF THE INTERIOR
STEWART L. UDALL, Secretary
GEOLOGICAL SURVEY
Thomas B. Nolan, Director
For sale by the Superintendent of Documents, U.S. Government Printing Office Washington 25, D.C.

CONTENTS
Page Abstract__ _ ____________________________________________________ C-1Introduction._____________________________________________________ 2
Location and extent of area_____________________________________ 3Physical features_--_--_--_-_-________-____-___________________ 4
Sources of surface water__-________________.________________________ 5Mohawk River_______________________-________________________ 5Oriskany Creek _______________________________________________ 14Sauquoit Creek______________________________________________ 18West Canada Creek__________________________________________ 19East Branch Fish Creek____________________________________ 20
Sources of ground water________-______--__--_______________________ 23Sand and gravel deposits.______________________________________ 23
Mohawk River lowland.___________________________________ 24Oriskany and Sauquoit Creek valleys________________________ 29
Other sources_________________________________________________ 33Public water-supply systems________________________________________ 35Summary of water used ____________________________________________ 38Possibility of further development___-_________-___-_________-_______ 41
Mohawk River lowland.. ______________________________________ 41Other potential sources_____-__--_______________________________ 42
Selected references_______________________________________________ 43Index _________________________ _\A _________________________________ 45
ILLUSTRATIONS
[Plates are in pocket]
PLATE 1. Map of Utica-Rome area showing generalized geology of the surficial deposits and locations of operating stream- gaging stations and selected wells.
2. Map of Utica-Rome area showing geology of the bedrock formations.
3. Sections showing unconsolidated deposits in the MohawkRiver channel between Rome and Frankfort.
PageFTGUKE 1. Outline map showing location and amount of major diversions
of water into the Utica-Rome area, 1953________________ C-72. Duration of streamflow records in the Utica-Rome area and
vicinity-__--____________________-_____-_-___-_-__--_ 83. Maximum, average, and minimum monthly and annual
observed discharge of the Mohawk River below Delta Dam near Rome, 1921-53..___._________________.-. 10
in

IV CONTENTS
PageFIGUBE 4. Duration curve of daily flow, Mohawk River below Delta
Dam, above West Canada Creek, and near Little Falls, 1928-53 .-- _ -- _ . C-11
5. Water-surface profile of selected floods on the Mohawk Riverfrom Delta Dam to Little Falls___ _____________________ 13
6. Temperature of Mohawk River water and air at Little Falls,October 1, 1956, to September 30, 1957_ ________________ 17
7. Annual diversion by the city of Rome from East Branch FishCreek, 1924^58____ 22
8. Duration curve of observed daily flow, East Branch FishCreek at Taberg, 1924-58----------------------------- 23
9. Magnitude and frequency of observed annual consecutive 7-day low flows, East Branch Fish Creek at Taberg, 1923- 58____-____________________-_-_-__-___-_----__-- 24
10. Concentrations of dissolved solids in and hardness of groundwater.________________________--_-____-__-__-------- 30
11. Source of and demand on the public water supplies _________ 3612. Dissolved solids and hardness of finished water from public
water supplies________________________________________ 38
TABLES
Page TABLE 1. Summary of streamflow data_______--_---____-_________-- C-9
2. Maximum, minimum, and average monthly and annual dis charges in Mohawk River basin, 1928-53._-___________-- 12
3. Chemical analyses of surface waters.---___________________ 154. Summary of chemical analyses, Mohawk River at Little Falls,
October 1956 to September 1957__. _-_-- _ 165. Geologic formations and their water-bearing properties------ 256. Chemical analyses of water from selected wells.____________ 317. Public water-supply systems._____.___-____-________-_--_ 378. Chemical analyses of finished water from major public water-
supply systems_-_----___-__-______--_________________ 379. Average use of water in the Utica-Rome area in 1954_ ______ 39
10. Industrial use of water, 1954____--__--__-_---_--------_-- 40

WATER RESOURCES OF INDUSTRIAL AREAS
WATER RESOURCES OF THE UTICA-ROME AREA, NEW YORK
By H. N. HALBEKG, O. P. HUNT, and F. H. PAUSZEK
ABSTRACT
The Utica-Rome area is along the Mohawk River and New York State Erie (Barge) Canal about midway between Lake Ontario and Albany. It encompasses about 390 square miles centered around the industrial cities of Utica and Rome.
The Mohawk River, its tributary West Canada Creek, and a system of reservoirs and diversions to maintain the flow in the barge-canal system, assure an ample water supply for the foreseeable needs of the area. The water from these sources is generally of good chemical quality requiring little treatment, although that from the Mohawk River is only fair and may require some treatment for sensitive industrial processes. Additional surface water is available from smaller streams in the area, particularly Oriskany and Sauquoit Creeks, but the water from these sources is hard, and has a dissolved-solids content of more than 250 ppm (parts per million). Ground water is available in moderate quantities from unconsolidated sand and gravel deposits in the river valleys and buried bedrock channels, and in small quantities from bedrock formations and less permeable unconsolidated deposits. The quality of water from sand and gravel, and bedrock ranges from good to poor. However, where necessary, the quality can be im proved with treatment.
The Mohawk River is the source of the largest quantity of water in the area. The flow of the stream below Delta Dam equals or exceeds 108 mgd (million gallons per day) 90 percent of the time, and at Little Falls it equals or exceeds 560 mgd 90 percent of the time. The flow between these two points is increased by additions from Oriskany, Sauquoit, and West Canada Creeks and from many smaller tributary streams. The flow is also increased by diversions from outside the area, from the Black and Chenango Rivers and West Canada Creek for im provement of navigation in the Erie (Barge) Canal, and from West Canada and East Branch Fish Creeks for the public supplies of Utica and Rome. Much of the public-supply water eventually reaches the river by way of sewerage and industrial waste-disposal systems. The total diversion from these sources aver ages more than 92 mgd. An estimated 18.5 mgd is withdrawn from the Mohawk River by industry, mostly for nonconsumptive uses.
Floods in the Utica-Rome area are not a frequent problem owing to the use of regulatory measures. The major streams fluctuate through a narrow range in stage and generally only a narrow strip along the streams is subject to flooding.
C-l

C-2 WATER RESOURCES OF INDUSTRIAL AREAS
Water-bearing sand and gravel deposits in the major river valleys are the principal sources of ground water, especially where they are recharged by infiltration from streams. The most important potential source is the deposit of sand and gravel underlying the extensive plain adjacent to the Mohawk River between Delta Reservoir and Rome. Maximum sustained yields from these deposits are not known; but moderate quantities of water, 300 gpm (gallons per minute) or less from a single well, can probably be obtained from some parts of the sand plain area, particularly in the vicinity of a buried bedrock channel that extends southwestward from Delta Reservoir. Similar quantities of ground water probably can be withdrawn from some parts of the flood plain of the Mohawk River between Rome and Frankfort and from the sand and gravel deposits filling the valley of Ninemile Creek below Holland Patent. The deposits underlying the flood plain of the Mohawk River generally are fine grained but in places contain interstratifled beds of coarser sand and gravel. The most productive part of the flood plain is at the east end near Frankfort. The deposits in Ninemile Creek valley also are generally fine grained; but where they are sufficiently thick, as over a buried bedrock valley southwest of Floyd, moderate quantities of water may be obtained.
Small to moderate quantities of water (150 gpm or less from a single well) can be obtained from sand and gravel deposits in the bottoms of Qriskany and Sauquoit Creek valleys, especially where the materials are coarse grained and are connected hydraulically with the streams. Small quantities of water (20 gpm or less from a single well) can be obtained from smaller areas of sand and gravel filling minor channels carved in the bedrock of the uplands and from some of the bedrock formations.
The depth to water in most wells in the Utica-Rome area ranges from 5 to 50 feet below the land surface. In general the water table is closer to the surface in the valley bottoms than in the uplands or along the sloping valley sides, where not otherwise affected by differences in geologic or hydrologic conditions. The water table is nearly fiat in the flood plain of the Mohawk River and stands generally only slightly higher than the adjacent river.
The amount of water used in the area is not large. The estimated average withdrawal was about 48.5 mgd in 1954. Of this, industry used the largest amount, requiring 60 percent or about 29 mgd. About one-third of the water used by industry was self supplied, the remainder was purchased from public water systems. Of the 48.5 mgd withdrawn, about 27.4 mgd was supplied by municipally owned systems, and 21.1 mgd was obtained from private sources. About 96 percent of the total was taken from surface sources, and 4 percent was drawn from ground-water sources. All the water for municipal supply and most of the water for industry was drawn from surface sources. The uses of water in this area are mostly nonconsumptive, and they cause little depletion of the supply. However, practically all withdrawal uses add dissolved solids or suspended matter to the water and decrease its usefulness for some purposes.
INTRODUCTION
The development of the water resources of the Utica-Rome area, to meet the increasing demands of municipal and industrial expansion, requires a knowledge of the occurrence and use of water. Information is required about sources of water, quantity available, chemical and physical quality, amount used, effect of use on the quantity and quality, and magnitude and frequency of floods.

UTICA-ROME AREA, NEW YORK C-3
The purpose of this report is to summarize the available data on the water resources of the area and to express them in general terms. The report should be useful for initial guidance in the planning of water-supply facilities by pointing out the sources of water, by describ ing their quantity and quality, and by giving ground-water and flood levels. It is not within the scope of this report to provide solutions for all possible water problems that may arise owing to the establish ment of new industries within the area, use of new processes within individual industries, and shifts and trends in population. Each individual problem may require its own detailed investigation and design study. The information contained in this report will serve as a foundation for individual studies and appraisals of local water potential.
Most of the basic data summarized in this report were collected over a period of years by the U.S. Geological Survey as part of pro grams conducted cooperatively with the New York State Departments of Commerce, Conservation, Health, and Public Works, and the New York Water Power and Control Commission. Thanks are due many individuals, well drillers, public officials, and industries for furnishing information from their files and for granting permission to the Geo logical Survey for the collection of field data at their installations. The authors especially wish to acknowledge the courtesy and coopera tion of Mr. L. J. Griswold, chief engineer, Board of Water Supply, City of Utica, and Mr. Ralph Hadlock, Associate County Agricultural Agent, New Hartford.
The report was prepared by H. N. Halberg, under the supervision of G. C. Taylor, Jr., district geologist; O. P. Hunt, under the direct supervision of A. W. Harrington, district engineer; and F. H. Pauszek, district chemist. R. V. Cushman was responsible for staff coordination, under the general supervision of C. C. McDonald, Chief, General Hydrology Branch.
LOCATION AND EXTENT OF AREA
The area covered by this report is along the Mohawk River and Erie (Barge) Canal, about midway between Lake Ontario and Albany. It encompasses about 390 square miles and includes the highly industrialized centers of Utica and Rome and the smaller in dustrial and rural communities south and north of these two cities (pi. 1). The area includes Floyd, Kirkland, Marcy, New Hartford, Utica, Westmorland, and Whitestown, and parts of Deerfield, Rome, and Trenton in Oneida County, and Frankfort and Schuyler in Herkimer County.

C-4 WATER RESOURCES OF INDUSTRIAL AREAS
PHYSICAL FEATURES
The Utica-Eome area is partly within the Mohawk valley lowland and partly in the north-central margin of the Allegheny plateau. The major topographic features are the valley of the Mohawk River trending northwest-southeast across the central part of the area, the prominent upland front of the Allegheny plateau south of the river, and the rolling upland plateau north of the river. These major features are largely the result of differential erosion of the underlying sedimentary rocks.
The Mohawk valley was carved out of the underlying soft Utica shale by preglacial and glacial streams. It is now partly filled with clay, sand, and gravel deposited during the earlier formative stages of the Great Lakes. These deposits underlie the modern flood plain of the river and form the conspicuous terraces that flank the flood plain, such as those in the part of the valley between Marcy and Oriskany. The plain is about 1 mile wide in the stretch between Rome and Frankfort. The plain also extends west of Rome where it is much wider. The flanking terraces are continuous with the valley fill in tho lower reaches of Ninemile, Oriskany and Sauquoit Creeks and were formed during the outflow of higher stages of the glacial Great Lakes. The surface deposits throughout the valley consist of sand and gravel with some silt and clay.
The northern front of the plateau south of the Mohawk valley rises abruptly from the inner edges of the sand and gravel terraces at an altitude of about 600 feet to summit altitudes of 1,380 feet near the southern border of the area. The bedrock is exposed in the deeply cut tributary valleys and along the steeper upland slopes. The plateau is underlain by more resistant sedimentary rocks consisting predominantly of limestone, dolomite, shale, and sandstone with sev eral intercalated beds of iron ore. The north-facing slope is deeply dissected by two large northward-flowing tributaries of the Mohawk River, Oriskany and Sauquoit Creeks.
The rolling plateau north of the river slopes gently from an altitude of 1,300 feet southward to an altitude of about 600 feet along the Mohawk River. It is underlain by the Utica and Frankfort shales, the latter being the more resistant and capping the higher hills. The plateau surface is scarred deeply by West Canada and Ninemile Creeks and several other smaller tributaries of the Mohawk River, exposing the underlying shale beds. Elsewhere in the upland area the bedrock is covered by a veneer of ground moraine (till).
The area is drained by the Mohawk River except the westernmost part, which is drained by the Oswego River, through Wood Creek and the drainage west of Rome (pi. 1). The Mohawk River enters

UTICA-ROME AREA, NEW YORK C-5
the area north of Eome and flows in a meandering path through the central part of the Utica-Eome area to the eastern edge at Frankfort. Within this reach it has a fall of only about 40 feet and within its wide flat valley is most of the industry in the area. In places some of the river water is diverted by the Erie (Barge) Canal, which parallels its course from Eome to the eastern border of the area. The main tributaries of the Mohawk Eiver within the area are Oriskany and Sauquoit Creeks, which enter from the south, and Ninemile Creek, which enters from the north. West Canada Creek forms the north eastern border of the area and enters the Mohawk Eiver to the east. During the navigation season, Mnemile Creek carries water that is diverted from West Canada Creek basin to the Erie (Barge) Canal. Industrial development has occurred primarily along the Mohawk Elver and to the south along Oriskany and Sauquoit Creeks.
SOURCES OF SURFACE WATER
The water resources of the Utica-Rome area are its most important natural resource. The Mohawk Eiver and its larger tributaries, Oriskany, Sauquoit, and West Canada Creeks, are the important sources of water in the area and assure an ample supply of good or improvable quality for all foreseeable needs. Additional surface water is obtained outside the area from East Branch Fish Creek in the Lake Ontario basin.
MOHAWK RIVER
The Mohawk Eiver is formed by the confluence of its east and west branches just north of the Utica-Eome area. About 9 miles downstream from this point it enters and flows through Delta Eeser- voir, the lower or outflow end of which is just within the report area (pi. 1). Immediately south of Eome, the Mohawk Eiver is intersected and crossed by the Erie (Barge) Canal, Division of the New York State Barge Canal System. The flow of the Mohawk Eiver is divided between an integrated canal and river system from Eome until the river becomes the canal at Frankfort just east of the report area. The canal is north of the river and parallel to it, receiving the water from all tributaries to the north; the river receives the flow of tributaries to the south.
The Mohawk Eiver is economically important to the thousands of people residing in the Utica-Eome area and to the State of New York. It supplies water for industrial use, recharges adjacent ground- water reservoirs, and provides a medium for sewage and waste dis posal. An estimated 18.5 mgd is withdrawn from the river by in dustries in Eome and Utica for cooling and process purposes. Most of this water is returned to the river after use.
633991 O 62 2

C-6 WATER RESOURCES OF INDUSTRIAL AREAS
The flow of the Mohawk River in the Utica-Rome area is regulated by the operation of Delta Reservoir and several diversions or feeders (Black River, Ninemile, and Oriskany Creek feeders) which bring water into the area in order to maintain a reasonably constant flow through the Erie (Barge) Canal during the canal operating season. Delta Reservoir was completed in 1912 and has a usable capacity of 21,000 million gallons. Water is diverted from the Black River at Forestport, about 11 miles northeast of the area, through Forestport feeder and Black River Canal (flowing south), into Delta Reservoir. Diversion for the 1953 water year averaged 16.6 mgd (25.7 cfs). (A water year begins on October 1 and ends on September 30, the dates selected to facilitate water studies.) Water also is diverted from the West Canada Creek basin at Trenton Falls through Ninemile feeder and reaches the Erie (Barge) Canal through Mnemile Creek about 7 miles northwest of Utica. Records of diversion through Ninemile feeder (navigation season only) have been collected by the Geologi cal Survey since 1919 at a gaging station near Holland Patent. The amount of diversion depends upon requirements for navigation. For example, during the 1938 and 1948 canal seasons, there was no di version; from June 15 to December 8 of the 1953 canal season, the diversion averaged 38 mgd (59.2 cfs). The maximum diversion oc curred from April 28 to October 30 of the 1941 canal season when the flow averaged 101 mgd (156 cfs). The canal season usually begins about mid-April and ends about December 1. Oriskany Creek feeder diverts water from the upper Chenango River basin into Oriskany Creek near Solsville. No record is available of the amount of the diversion. Water occasionally may be received from the Oswego River basin through the summit level of the Erie (Barge) Canal near Rome.
The flow of the Mohawk River in the Utica-Rome area also is in creased by diversions for the public water supplies of Utica and Rome which reach the river by way of public sewer and industrial waste- disposal systems. The amounts of these diversions are discussed under public water-supply systems. Figure 1 shows where water is diverted to the area and indicates the average amount of diversion in 1953 where records are available.
The flow of the Mohawk River is measured at gaging stations below Delta Dam, where the river enters the area, and below Rocky Rift Dam near Little Falls, about 19 miles east of the area. (See pi. 1; fig. 2, and table 1.) The New York State Department of Public Works also obtains records of stage at each lock in the Erie (Barge) Canal system.
The flow of the Mohawk River at the gage below Delta Dam is completely regulated by Delta Reservoir except during periods of

UTICA-ROME AREA, NEW YORK
75°35' 75°10'
43° 15'
BLACK RIVERBy way of Forestport feederf^
for Erie (Barge Average 16 Delta Reservoir
WEST CANADA CREEK By way of Ninemile feeder
for Erie (Barge) Canal Average 38 mgd
EAST BRANC For Rome
Average 11.7 mgd
WEST CANADA CREEKFor Utica water supply
Average 14.4 mgd
CHENANGO RIVER By way offoriskany Creek
feeder for Erie (Barge) CanaL/No record of di-
.Afersion
43°00' -
FIGURE 1. Outline map showing location and amount of major diversions of water intothe Utica-Rome area, 1953.
spilling. The pattern of regulation remained practically unchanged during the time records were collected, so that all records at this station represent conditions under the present pattern of diversion and storage. Average observed discharge for the 32-year period 1921-53 was 259 mgd (401 cfs). Observed monthly discharge (fig. 3) during this period ranged from a maximum of 1,034 mgd (1,600 cfs) to a minimum of 49.1 mgd (76 cfs).
The flow-duration curve, figure 4, shows the percentage of time the daily flow of Mohawk River below Delta Dam equaled or exceeded different quantities. For example, the curve indicates that the flow would be equal to or exceed 66 mgd (102 cfs) 99 percent of the time, and would be at least 108 mgd (167 cfs) 90 percent of the time. The flow would equal or exceed 259 mgd (401 cfs, average flow below Delta Dam) about 30 percent of the time. The flow during the summer and fall is maintained well above natural low-flow conditions in accordance with requirements for navigation.
No gaging stations are maintained on that part of the Mohawk River between Delta Dam and Little Falls and therefore no records of flow are available in the vicinity of Utica where the river leaves

0-8 WATER RESOURCES OF INDUSTRIAL AREAS
Period of record
:> o o o o o otl O -' CsJ CO ^ ID 3 CT CT CT CT CT CT
C
_l_l 1'////
:,:m
'////
=
/////
///A
-t
Drainage area in square miles
150
375
556
1348
189
112
Operating gaging stations
Mohawk River below Delta Dam, near Rome
West Canada Creek at Hinckley
Ninemile feeder near Holland Patent
West Canada Creek at Kast Bridge
Mohawk River near Little Falls
East Branch Fish Creek at Taberg
Oneida Creek at Oneida
Discontinued gaging stations
I
1
I
I
153
514
1306
63
140
145
146
46.6
4.62
4.44
4.5
.77
3.39
.30
1.10
Mohawk River near Ridge Mills near Rome
Mohawk River at Utica
Mohawk River at Little Falls
Ninemile Creek at Stittville
Oriskany Creek at Coleman
Oriskany Creek at Wood-road Bridge near Oriskany
Oriskany Creek at State dam near Oriskany
Sauquoit Creek at New York Mills
Nail Creek at Utica
Reels Creek near Deerfield
Reels Creek near Utica
Johnson Brook near Deerfield
Starch Factory Creek near New Hartford
Graf fenberg Creek near New Hartford
Sylvan Glen Creek near New Hartford
Continuous daily flow records Navigation season only In files of New .York State De- In reports of New York Statepartment of Public Works Engineer and Surveyor
FIGURE 2. Duration of streamflow records in the Utica-Rome area and vicinity.
the report area. However, records for the Mohawk River below Delta Dam and below Little Falls, together with records for West Canada Creek at Kast Bridge and Ninemile feeder near Holland Patent, have been used to synthesize a flow record for the Mohawk River above the mouth of West Canada Creek, a few miles east of the area. The record, as summarized in table 2, shows that monthly discharges ranged from 4,0f4 mgd (6,304 cfs) to 202 mgd (312 cfs). The flow- duration curve (fig. 4) represents probable flow conditions above the mouth of West Canada Creek and shows that the discharge would be equal to or greater than 170 mgd (263 cfs) 99 percent of the time and at least 248 mgd (384 cfs) 90 percent of the time.

TABL
E 1
. Su
mm
ary
of
stre
amfl
ow d
ata
Gag
ing
stat
ion
Moh
awk
Riv
er
belo
wD
elta
Dam
.M
ohaw
k R
iver
ne
arL
ittl
e Fa
lls.
Wes
t C
anad
a C
reek
at
Hin
ckle
y.W
est
Can
ada
Cre
ek a
tK
ast
Bri
dge.
Eas
t Bra
nch
Fish
Cre
ekat
Tab
erg.
Dra
inag
ear
ea (
sqm
i) 150
1,34
8
375
556
189
Ele
vati
onof
gag
e (f
eet
abov
e m
ean
sea
leve
l)
474.
00
310.
00
1, 13
4. 0
0
438.
99
490.
12
Peri
od o
f rec
ord
Dec
. 1,
19
19,
toSe
pt.
30, 1
953.
1O
ct.
1,
1927
, to
Sept
. 30
, 19
53.
June
14
, 19
19,
toSe
pt.
30,
1953
.O
ct.
1,
1920
, to
Sept
. 30
, 195
3.*
Apr
. 1,
19
23,
toSe
pt.
30,
1953
.
Ave
rage
flo
w
Qua
ntit
y (m
gd)
2259
1,81
5
2648 86
8
2354
Yea
rs 32 26 34 33 30
Max
imum
flo
w
Qua
ntit
y (m
gd)
5,53
0
si6,
400
11,1
00
13,2
00
8,79
0
Gag
e he
ight
(fee
t)
11.1
8
17.8
0
11.4
5
8.08
10.9
0
Dat
e
Oct
. 2,
194
5
Oct
. 3,
194
5
Oct
. 2,
194
5
Oct
. 2,
194
5
Oct
. 2,
194
5
Min
imum
dai
ly f
low
Qua
ntit
y (m
gd)
29 299 48 38 23.4
Dat
e
Jan.
17,
1931
Sept
. 2,
193
4....
Aug
. 31
, 1919
Sept
. 2,
19
29
Aug
. 15
-17,
194
9.
Bem
arks
Reg
ulat
ed.
Incl
udes
flo
w i
n E
rie
(Bar
ge)
Can
al.
Div
ersi
on
abov
e ga
geby
ci
ties
of
One
ida
and
Rom
e fo
r w
ater
supp
ly.
Dec
embe
r 19
19 t
o Se
ptem
ber
1926
fro
m r
epor
ts o
f S
tate
eng
inee
r an
d su
rvey
or.
Gag
e-he
ight
rea
ding
s on
ly p
rior
to
July
192
1.2
Una
djus
ted.
3 Fl
ow in
riv
er c
hann
el o
nly.
4 A
ddit
iona
l rec
ords
ava
ilabl
e M
ay 1
905
to D
ecem
ber
1909
(19
05-0
6, g
age
heig
hts
and
disc
harg
e m
easu
rem
ents
onl
y),
Janu
ary
1912
to
Dec
embe
r 19
13.

C-10 WATER RESOURCES OF INDUSTRIAL AREAS
1800^
1600-
1400-
1200-
1000-
800-
400-
200-
DISCHARGE, IN MILLION GALLONS PER DAY
11
1
is
r-i
ii8
EXPLANATION
Maximum Average Minimum
_
1|
58 5?88 88 XX 1i i1
-
IiJAN. FEB. MAR. APR. MAY JUNE JULY
1 I 85 >s8 I1
r-
1 ^
llAUG. SEPT. OCT. NOV. DEC. ANNUAL
FIGURE 3. Maximum, average, and minimum monthly and annual observed discharge of the Mohawk River below Delta Dam, near Rome, 1921-53.
Records of daily flow of the Mohawk River near Little Falls include diversion at Rocky Rift Dam into the Erie (Barge) Canal for power and lockage at lock 16, near St. Johnsville. The average flow for the 26-year period 1927-53 was 1,815 mgd (2,808 cfs).
Monthly flows during this period, as shown in table 2, ranged from 7,749 mgd (11,990 cfs) to 415 mgd (642 cfs). The minimum daily flow during 1927-53 was 299 mgd (463 cfs) on September 2,1934.
The flow-duration curve, figure 4, defines the flow characteristics of the Mohawk River at the Little Falls gaging station. The curve in dicates that there will be a flow of at least 400 mgd (619 cfs) available 99 percent of the time, and at least 560 mgd (866 cfs) 90 percent of the time. Discharges during summer and fall are maintained well above natural low flows by regulation of Delta Reservoir and of Hinckley Reservoir on West Canada Creek.
Floods on the Mohawk River have not caused much damage in the Utica-Rome area in recent years because of regulation by storage in Delta Reservoir and closing of head gates in feeder canals. They are discussed briefly, however, because the records are useful in design of intake structures and docks and in locating building sites in areas of potential flooding. The floods in this area are most likely to occur during March, April, and May, although the greatest flood of record in the upper Mohawk River basin since the completion of the Erie (Barge) Canal and storage reservoirs about 1918 was the flood of October 2, 1945. Other large floods during this period occurred in March 1936 and April 1950. Fragmentary records indicate that

UTICA-ROME AREA, NEW YORK
30,000
25,000
10,000
8000
5000
4000
O 1000
800 O
? 600
g 500-
< 400T
£ 300 H
10,000
8000s
6000
5000
4000
3000
2000 s
1000
800
600
500
400
300
200
100
80
60
50
40
30
20
X
s
\
\\
N
v
^
XMohawk River above West Canada Creek ^
\\ \\\
Mohawk River below , Delta Dam
. Mohawk River near Litte Falls
\
\
\
A
x\
\
Exam
\
\\
*s\
\
\
\
\
N
\
\
\
X
\
ss
-
s
\
-^ s.
Examp
Xj
X
\
pie: Flow of Mohawk River below/ Delta Dam equaled or exceeded 108 mgd for 90 percent of the time
e: Floequ"
/k
r
^ \
vof Me aled or cent of
^^
ip\e: f W0
\
haw exc< the
owo est exc
erce
X
k River near eded 560 m ime
~^^
f Mohawk R Canada Cree eeded 248 n t of the tim
XN\
Little Falls gd for 90
ver above k equaled gd for 90
s.
\20 40 60 80 90 95 98 99
PERCENT OF TIME DISCHARGE EQUALED OR EXCEEDED THAT SHOWN
FIGDBB 4. Duration curve of daily flow, Mohawk River below Delta Dam, above West Canada Creek, and near Little Falls, 1928-53.
greater floods than the 1945 flood occurred in 1901, 1902, 1904, and 1913, and that the greatest flood known occurred in the 1860's.
The profile of the water surface of the flood of October 1945 for the stretch of river between Delta Dam and Hanson Avenue Bridge at Little Falls (outside the area) is shown in figure 5. Also shown are the profiles of the floods of March 1936 and April 1950 for the stretch of river between Oriskany Bridge and Hanson Avenue Bridge in Little Falls. The peaks of the 1945 flood were reduced materially by storage in the reservoirs in the upper Mohawk River basin even though the latter were nearly full on October 1,1945, as the result of heavy rainfall in September. For example, the peak flow of the Mohawk Eiver above Delta Eeservoir was computed as 10,300 cfs at the town of North Western (from a drainage area of Y7.Y sq mi) and

C-12 WATER RESOURCES OF INDUSTRIAL AREAS
T l
5SS
« -J rt
SS2 3S3us IM" IM" -<
«N ,H * IM" -T
llfl
*

500
480
460
- «-
5 420 400
< 380 360
20
24
28
MILE
S BELOW D
ELTA
DAM
FIG
URE
5.
Wat
er-s
urf
ace
prof
ile o
f se
lect
ed f
lood
s on
the
Moh
awk
Riv
er f
rom
Del
ta D
am t
o L
ittl
e F
alls
.
4448
9 i * oo

C-14 WATER RESOURCES OF INDUSTRIAL AREAS
the peak outflow from Delta Reservoir (from a drainage area of 145 sq mi) was only 8,560 cf s.
The chemical quality of the water of the Mohawk Eiver in the Utica-Eome area is fair. Analyses of two water samples from the Mohawk Eiver taken in January 1955 just below Delta Eeservoir and at Utica 20 miles downstream showed an increase of dissolved solids from 84 to 195 ppm in the 20-mile stretch. The higher concentrations of dissolved solids reflect increases in concentrations of individual chemical constituents including calcium, magnesium, bicarbonate, and sulfate. As a result, hardness increased from 56 to 128 ppm. (Analyses are given in table 3.) The increases may be due in part to natural conditions, as the more mineralized water in Oriskany and Sauquoit Creeks joins the Mohawk Eiver between the points sampled, and in part to an increase of industrial and municipal pollution which alter the chemical character of the water. Both domestic and in dustrial pollution in this area are reported by the New York State Water Pollution Control Board (1952).
Downstream from the Utica-Eome area, a station for daily sampling of the Mohawk Eiver water was established near Little Falls in October 1956 and operated through September 1957. During this period, concentrations of dissolved solids and hardness fluctuated within a narrower range than at the locations in the Utica-Eome area (table 4).
The dissolved-solids content of water from the Mohawk Eiver probably is low enough for many industrial uses. But for sensitive industrial processes requiring soft water that is low in dissolved solids, suitable treatment would have to be applied. The temperature of the Mohawk Eiver water generally follows the same trend as the air temperature in the region. At the sampling station near Little Falls the water temperature fluctuated between 32° and 78° F from Octo ber 1,1956, to September 30, 1957 (fig. 6). The daily water tempera ture generally changed less than 3° F between successive days. In some sections the temperature of the river water may be affected by the inflow of industrial wastes.
ORISKANY CREEK
Oriskany Creek is the first major tributary stream on the south side of the Mohawk Eiver below Eome (pi. 1). It drains the north slope of the Allegheny plateau, rising in Oneida County at an altitude of 1,500 feet and entering the Mohawk Eiver about 6 miles northwest of Utica at an altitude of 410 feet. The two-thirds of Oriskany Creek drains an area of relatively steep slopes underlain by bedrock covered with thin till deposits. The lower one-third, below Clinton,

TABL
E 3
. C
hem
ical
ana
lyse
s of
sur
face
wat
er in
par
ts p
er m
illio
n, a
t poi
nts
in t
he U
tica
-Rom
e ar
ea
Stre
am a
nd lo
catio
n
Eas
t B
ranc
h Fi
sh
Cre
ek a
tT
'o'K
priy
Do ..
. ... ..
. ...
...
Moh
awk
Riv
er n
ear
Rom
e. .
. O
risk
any
Cre
ek
near
O
ris-
Do
..
.Sa
uquo
it C
reek
at N
ew H
art
fo
rd
Do
..
....
....
....
.....
Moh
awk
Riv
er n
ear
Utic
a ...
. W
est C
anad
a C
reek
at H
inck
-
Wes
t C
anad
a C
reek
at
Kas
t B
rid
ge
D
o
Dat
e of
co
llect
ion
Jan.
18
,195
5 A
pr.
7, 19
55
Jan.
19
,195
5
Jan.
17
,195
5 A
pr.
7, 1
955
Jan.
17
,195
5 A
pr.
7, 1
955
Jan.
17
,195
5
Apr
. 7,
195
5
Sep
t. 11
, 195
6 M
ay 2
7,19
57
Dis
ch
arge
(c
fs)
186
3,17
0 42
3
143
641 54
.6
366
905
842
486
1,28
0
Sil
ica
(SIO
,)
4.8
3.0
7.5
9.0
3.9
7.5
5.4
6.0
5.4
4.0
4.3
Iron
(Fe)
0.06
.0
9 .0
9
.06
.06
.15
.11
.23
.10
.18
.07
Man
ga
ne
se
(Mn)
0.00 .00
.00
.01
.00
.00
.00
.00
.00
.00
Cal
ci
um
(Ca) 8.7
5.2
19 79
59 87
60
40 4.8
15
17
Mag
ne
si
um
(Mg) 1.8
1.2
2.2
20 9.3
20 9.1
6.8 .3 1.3
2.5
So
diu
m(N
a)
3.
3! 6 14 4.
11
12 4.
81 <1
Po
tas
si
um
(K)
5 8 9 '2 9 4 6 5
Bic
ar
bon
at
e H
CO
3
29
12
55 239
1187 20
9 21
72
115 9 44
54
Sul-
fa
te
(804
)
10 7.3
15 82
48 122 56
43 12 7.
4 6.
5
Chl
o
ride
(Cl)
1.2 .2
2.0
3.5
6.0
3.5
4.0
7.0 .5 .8
.6
Flu
o-
ride (F)
0.1 .1
.1 .0
.1 .0 .1 .0 .1 .1 .1
Ni
tr
ate
(NO
i)
0.7
2.1
1.5
8.2
5.2
8.3
6.8
5.9
2.1 .7
1.
0
Dis
so
lved
so
lids
55
33 84 351
287
380
273
195 38 61
65
Har
dnes
s as
C
aCO
s
Cal
ci
um,
mag
ne
si
um 29
18
56 279
185
299
187
128 13 43
53
Non
- ca
r-
bon-
at
e 5 8 11 84
32 128 46
34 6 7 9
Spec
ific
con
du
ct
ance
(m
icro
- m
hos
at
25°
C)
69.9
41
.0
127
557
402
579
396
309 40
.7
93.9
10
7
pH 7.7
6.8
8.0
8.1
8.4
8.2
8.4
8.2
7.0
6.8
7.5
Col
or 2 4 5 5 5 3 3 4 5 22
12
Incl
udes
equ
ival
ent o
f 5 p
pm C
Os.
*Inc
lude
s eq
uiva
lent
of 3
ppm
CO
s.» N
a, 1
.1 pp
m;
K, 0
.5 p
pm.
* Na,
1.1
ppm
; K
, 0.4
ppm
.
9

C-16 WATER RESOURCES OF INDUSTRIAL AREAS
TABLE 4. Summary of chemical analyses, in parts per millic at Little Falls, October 1956 to September 195'
Constituents Minimum Silica (SiO2).__ _-_____-________-___-_-___.__---- 4. 2Iron (Fe) ____ __. _ __ ______ _ _ __ .
Magnesium (Mg)_.__ __ ______ ___ __ _ ___Sodium (Na) __ _ ___ ______ _ ____ _ __ ___Potassium (K) ______________ _________ ____Bicarbonate (HCOs) __-_-_--____-_ _______ __Sulfate (S'O4) -- - --Chloride (Cl)__ _____________________________Fluoride (F) _ _ _ _________ _ _ _ _ _ _Nitrate (NO3)___ ___ _ ___ __ _ _ ____ _Dissolved solids __ ___ _____ _ ___ _._ ______Hardness as calcium, magnesium (CaCO3)Oxygen consumed:
UnfilteredFiltered____ _ __ ________ _ ___ __
Specific conductance (micromhos at 25°C)____pH____ _ ___Color.---____ _
_____ .05274.04. 11. 1
-__ 79_-. 23
4.2. 0
1.4.___ 122___ 84
42
_ 1637.03
m, Mohau 7
Time wdghted- aserage
6. 4 . 14
31 5. 3 5.7 1.3
92 28 5.9
. 1 3. 3
138 101
7 4
231
9
;fc River
Maximum 11
.38 38 7.0 7.6 1. 7
104 37 7.8
. 2 4. 6
170 124
16 5
314 7.6
17
drains a nearly flat valley in which thick deposits of sand and gravel overlie the bedrock. Below Clinton the creek furnishes water to sev eral industries.
Water has been diverted into Oriskany Creek from the Chenango River basin through Oriskany Creek feeder at Solsville, about 8 miles outside the report area for more than 100 years. Incomplete records during 1954-58 indicate that the amount of water diverted averages about 6.5 mgd (10 cfs) during the summer months.
Although no gaging station is operated on Oriskany Creek, seven discharge measurements were made in 1954 and 1955 near Oriskany, where the drainage area is 145 square miles. These measured dis charges were correlated with discharges of gaged streams in the vicinity and on this basis, with the pattern of feeder operation during 1954-55, approximately low-flow duration data were computed. Tabulated below are the results of these correlations:
Percentage of time discharge was equaled or exceeded50 ___ ___ __ ....60 __ __ __ _.70 _ _____ __ _.__
Mgd Percentage of per time discharge was
square mile equaled or exceeded0. 50 SO
_ __ _ .40.32
90 ____ __ __ __ -95 __ _ _ _____
Mgd per
square mile_ _ _ 0.25
__ _ _ .19__ __ .16
Under the pattern of feeder operations during 1954-55, magnitude and frequency of annual low flows has been computed for this stream. These data, listed below, are also based on correlation methods using the regional low-flow frequency data for gaged streams in the vicinity.

OC
TOB
ER
N
OVE
MBE
R
DEC
EMBE
R
JAN
UA
RY
FE
BR
UA
RY
M
AR
CH
A
PR
IL
MA
Y
JU
N!J
ULY
A
UG
US
T SE
PTEM
BER
1956
19
57
FIG
URE
6. T
empe
ratu
re o
f M
ohaw
k R
iver
wat
er a
nd a
ir a
t L
ittl
e Fa
lls,
Oct
ober
1,
1956
, to
Sep
tem
ber
30,
1957
.

C-18 WATER RESOURCES OF INDUSTRIAL AREAS
Recurrence interval Annual minimum discharge (mgd) (years) 7-day SO-day
2_____.___.____.______._..____ 24.0 29.75_______..______________ 17.9 22.110__._____________________ 15.5 18.820___---____________________ 14.7 16.3
The chemical quality of the raw water from Oriskany Creek is poor. Two samples taken from the creek near Oriskany indicate a high concentration of dissolved solids, which originated probably from the solution of the several limestone formations underlying the area drained by Oriskany Creek and possibly from industrial wastes entering the stream above Oriskany. The water contains principally calcium, magnesium, bicarbonate, sulf ate, and lesser amounts of other cations and anions. (See table 3.) As a result, the water is hard, with both temporary (carbonate) and permanent (noncarbonate) hardness being present. The latter is especially objectionable because it forms a hard scale in boilers. In industrial processes in which the water might Be used for cleansing purposes, an objectionable scum would be formed by the reaction of calcium and magnesium with soaps. However, the quality can be substantially improved by treatment. The samples of January and April 1955 were taken at relatively low and high flows, 143 and 641 cfs, respectively, and the dilution effects of the higher flow can be noted in the generally lower content of included chemical constituents. Data on the water temperature of Oriskany Creek are not available; however, the temperature probably follows the characteristic cyclic seasonal trend of other streams in the area and averages about the mean air temperature of the region (48°F). The water temperature may be affected near the inflow of industrial and municipal wastes.
SAUQUOIT CHEEK
Sauquoit Creek rises in Oneida County about 10 miles south of Utica at an altitude of 1,450 feet and flows nortwestward to enter the Mohawk River 2 miles northwest of Utica (pi. 1). It drains 61 square miles on the slope of the Allegheny plateau. The drainage basin is chiefly rolling farmland and contains many small villages. The largest village in the basin, New York Mills, near the mouth of the stream, had a population of 3,366 in 1950. Above New Hartford the valley is narrow and has relatively steep-sided bedrock walls. Below New Hartford it is flat and is underlain by deposits of sand and gravel.
Continuous discharge records have not been collected for this stream; however, from November 1954 to September 1955, seven dis charge measurements were made of the base flow at New Hartford,

UTICA-ROME AREA, NEW YORK C-19
where the drainage area is 43 square miles. The minimum discharge measured was 9.6 mgd (14.9 cfs) on September 20,1955.
These discharge measurements were correlated with discharges of gaged streams in the vicinity and on this basis approximate low-flow characteristics were obtained for Sauquoit Creek. The following tabulation shows the probable flow in million gallons per day per square mile that would be equaled or exceeded for the selected per centages of time shown:
Percentage of time discharge was equaled or exceeded50 _____60 __ ______ _70
Mgd Percentage of j per time discharge was
square mile equaled or exceeded squt0. 68 80
.57_ .49
85 _90 _ _ _ _ _95
per e mile0.40 .37 .33 .29
The magnitude and frequency of annual low flows at New Hartford were also determined by correlation with nearby gaged streams. The listing below shows for given average recurrence intervals what mean discharge for 1, 7, and 30 days can be expected to occur as the lowest of the year.
Recurrence interval Annual minimum discharge (mgd) (years) l-day 7-day 30-day2......... _________________ 10.9 12.8 14.75__________________________ 9.2 10.5 12.010._._._._____._._____.__.. 8.5 9.6 10.920.___..._______.______ 8.1 8.8 9.8
The chemical composition of water from Sauquoit Creek (table 3) is about the same as that from Oriskany Creek, as both creeks drain areas underlain by similar rock formations. Solution of lime stone beds gives the water a relatively high mineral content. Anal yses of two samples collected from Sauquoit Creek at New Hartford indicate that the water was slightly higher in dissolved mineral mat ter than water from Oriskany Creek and had a higher noncarbonate hardness.
WEST CANADA CHEEK
West Canada Creek rises in the central Adirondack region, flows southwest through Hinckley Reservoir to a point about 6 miles below the reservoir (pi. 1) where it turns to flow southeast and south to join the Mohawk River at Herkimer. Above Hinckley Reservoir the creek drains an area of rugged topography underlain by crystal line bedrock. Below the reservoir the area drained is a gently sloping plateau underlain chiefly by sedimentary rocks. The main course of the stream in the latter area is confined to a narrow valley that

C-20 WATER RESOURCES OF INDUSTRIAL AREAS
is incised deeply into the underlying bedrock. Most of the drainage basin is outside the area considered in this report but the following discussion is included because of the diversions into the Utica-Rome area for public water supply and Erie (Barge) Canal operations and because the flow record was used in the computation of the previously mentioned synthetic record for the Mohawk River above the mouth of West Canada Creek.
Water is diverted from Hinckley Reservoir into the Utica-Rome area for the public supply of the city of Utica. The reservoir, which has a usable capacity of 25,000 million gallons, was completed in 1915 by the State of New York as a feeder reservoir for the Erie (Barge) Canal; but through acquisition of riparian rights on West Canada Creek prior to construction of the reservoir, the city of Utica has the right to divert about 50 mgd from Hinckley Reservoir. The present diversion for this purpose is about 14.4 mgd.
The flow of West Canada Creek has been gaged since June 1919 at Hinckley, 1 mile downstream from Hinckley Dam (pi. 1 and fig. 2). Discharge is completely regulated by Hinckley Reservoir, except for periods of spilling. Average discharge observed for the 34-year period 1919-53 was 648 mgd (1,002 cfs). Monthly discharges during this period ranged from 2,457 mgd (3,801 cfs) to 144 mgd (223 cfs); see tables 1 and 2. The minimum daily discharge during this period was 48 mgd (75 cfs) on August 31, 1919. Discharges during the summer and fall are maintained well above natural low flows in ac cordance with requirements for navigation.
The chemical quality of the water is excellent. The concentration of dissolved solids is low, generally less than 50 ppm. Calcium and magnesium comprise about one-tenth of the concentration of dissolved solids and the water is very soft. The concentrations of other cations and anions are low and have no significance insofar as the utility of the water is concerned. (See analysis in table 3.)
Moderate increases in the overall mineral content and the hardness from the quality at Hinckley have been noted at Kast Bridge about 20 miles downstream from the reservoir and 4 miles upstream from the confluence with the Mohawk River (table ,3). Such increases prob ably have resulted from the solution of the underlying dolomitic lime stone formations that form the creekbed below the reservoir. The chemical character of the water, however, remains excellent and the water is suitable for most purposes.
EAST BRANCH FISH CREEK
East Branch Fish Creek drains a large area of the Tug Hill plateau in Lewis and Oneida Counties and flows southward into Oneida Lake
UTICA-ROME AREA, NEW YORK C-21
by way of Fish and Wood Creeks. The area drained is outside the Utica-Eome area as considered in this report (pi. 1), but the stream is discussed here because it is the source of the public water supply for the city of Eome. Above Taberg the creek drains an area under lain by exposed shale bedrock and generally poorly sorted fine-grained surficial deposits. Below Taberg the surficial deposits are stratified and coarse grained.
Water diverted from East Branch Fish Creek above Taberg into the Utica-Rome area by the city of Rome for public supply, reaches the Mohawk River as sewage effluent. Figure 7 shows the annual diver sion by water years during 1924-58 and indicates a large increase in water use during the war-emergency years. The minimum average diversion of 8.2 mgd (12.7 cfs) occurred in the 1931 and 1932 water years; the maximum, 15.1 mgd (23.3 cfs), occurred during the 1948 water year.
Discharge records for East Branch Fish Creek at Taberg (drainage area, 189 square miles) have been collected since 1923 (fig. 2). Average observed discharge for the 35-year period 1923-58 was 351 mgd (543 cfs). The minimum observed daily discharge during the same period was 3.4 mgd (5.2 cfs) on August 14-17, 1949. Average diversion for water supply by the cities of Oneida and Rome for the 35-year period was about 13.6 mgd (21 cfs).
The flow characteristics, after diversion for water supply by the cities of Oneida and Rome, are shown by a flow-duration curve (fig. 8). This curve is based on observed discharges for the period October 1, 1923, to September 30, 1958. The curve shows the ap proximate quantity of water available for further development and can be useful in the solution of many design problems. For example, if a flow of 13 mgd (20 cfs) is required for industrial use, this quantity of water would be available about 99 percent of the time with present diversions (fig. 8).
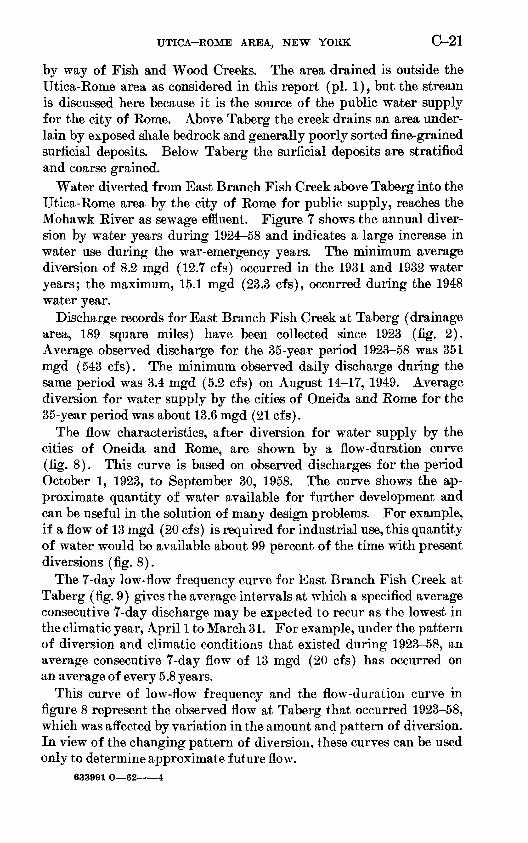
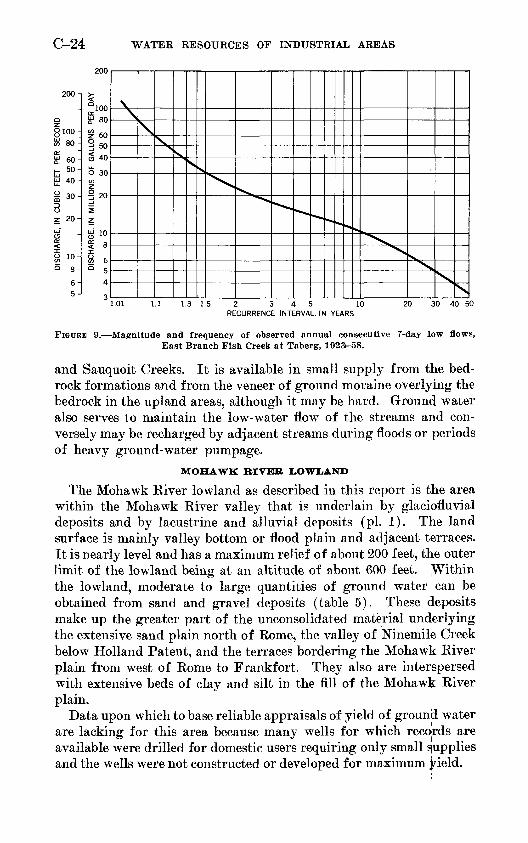
The 7-day low-flow frequency curve for East Branch Fish Creek at Taberg (fig. 9) gives the average intervals at which a specified average consecutive 7-day discharge may be expected to recur as the lowest in the climatic year, April 1 to March 31. For example, under the pattern of diversion and climatic conditions that existed during 1923-58, an average consecutive 7-day flow of 13 mgd (20 cfs) has occurred on an average of every 5.8 years.
This curve of low-flow frequency and the flow-duration curve in figure 8 represent the observed flow at Taberg that occurred 1923-58, which was affected by variation in the amount and pattern of diversion. In view of the changing pattern of diversion, these curves can be used only to determine approximate future flow.
633991 O 62 4

C-22 WATER RESOURCES OF INDUSTRIAL AREAS
1920 1930 1940 1950 1960
FIGDBE 7. Annual diversion by the city of Rome from Bast Branch Fish Creek, 1924-58.
The chemical quality of water samples from the East Branch Fish Creek taken at periods of low flow and high flow is available. (See table 3.) The chemical quality is excellent. Only moderate amounts

UTICA-ROME AREA, INEW YORK C-23
900
o
CL(/) HUU
O
3u_0 onr,
N MILLIONS I E
§ ^£ 70
% 60
° 50
3
X,\\\\\
\\ .\
A\
\
\v\x
;
1
s\\\\\\\s
ks\\\\\\v\"\
0.01 0.1 1 5 10 20 40 60 80 90 95 98 99 99.9 99.99
PERCENT OF TIME DISCHARGE EQUALED DR EXCEEDED THAT SHOWN
FIGURE 8. Duration curve, of observed dally flow, Bast Branch Fish Creek at Taberg,1924-58.
of mineral matter are present and the water is soft. Generally, the water is suitable for most purposes.
SOURCES OF GROUND WATER
SAND AND GRAVEL DEPOSITS
Ground water, of good or improvable quality is available in mod erate supply from sand and gravel deposits in the Mohawk Eiver lowland and from similar deposits in the lower valleys of Oriskany
C-24 WATER RESOURCES OF INDUSTRIAL AREAS
200-1
0100 £ 80 cc £ 60H- 50a 40
z 20-
603 50O 40 u_ O 30
1.1 2 345 10 RECURRENCE INTERVAL, IN YEARS
30 40 50
FIGURE 9. Magnitude and frequency of observed annual consecutive 7-day low flows, Bast Branch Fish Creek at Taberg, 1923-58.
and Sauquoit Creeks. It is available in small supply from the bed rock formations and from the veneer of ground moraine overlying the bedrock in the upland areas, although it may be hard. Ground water also serves to maintain the low-water flow of the streams and con versely may be recharged by adjacent streams during floods or periods of heavy ground-water pumpage.
MOHAWK RIVER LOWLAND
The Mohawk Kiver lowland as described in this report is the area within the Mohawk Eiver valley that is underlain by glaciofluvial deposits and by lacustrine and alluvial deposits (pi. 1). The land surface is mainly valley bottom or flood plain and adjacent terraces. It is nearly level and has a maximum relief of about 200 feet, ttye outer limit of the lowland being at an altitude of about 600 feet. ^Vithin the lowland, moderate to large quantities of ground water can be obtained from sand and gravel deposits (table 5). These deposits make up the greater part of the unconsolidated material underlying the extensive sand plain north of Rome, the valley of Ninemile Creek below Holland Patent, and the terraces bordering the Mohawk River plain from west of Rome to Frankfort. They also are interspersed with extensive beds of clay and silt in the fill of the Mohawk River plain.
Data upon which to base reliable appraisals of yield of ground water are lacking for this area because many wells for which records are available were drilled for domestic users requiring only small [supplies and the wells were not constructed or developed for maximum yield.

TABL
E 5.
Geo
logi
c fo
rmat
ions
in
the
Utic
a-R
ome
area
and
the
ir w
ater
-bea
ring
pro
pert
ies
(mod
ifie
d fr
om D
ale,
195
8 an
d K
ay,
1953
)
Age
Syst
em
Qua
tern
ary
Silu
rian
Ord
ovic
ian
Seri
es
Rec
ent
and
Plei
stoc
ene
Plei
stoc
ene
Cay
uga
Nia
gara
Upp
er
Ord
ovic
ian
Geo
logi
c un
it
Fine
-gra
ined
gla
ciof
luvi
al, l
acus
tr
ine
and
allu
vial
dep
osits
Med
ium
to
co
arse
-gra
ined
gla
ci
oflu
vial
and
del
taic
dep
osits
Gro
und
mor
aine
(til
l)
Man
lius
lim
esto
ne
Salina group
Ber
tie l
imes
tone
Cam
illus
sha
le
Ver
non
shal
e
Loc
kpor
t dol
omite
Cli
nton
gro
up
One
ida
cong
lom
erat
e
Fra
nkfo
rt
shal
e (i
nclu
des
Pul
aski
sha
le)
Uti
ca s
hale
Thi
ckne
ss
(fee
t)
70-1
50
10-1
40
1-40 15
0+ 30
200-
300
300
80 270
29 400-
500
300-
400
Ave
rage
de
pth
of
wel
ls
(fee
t)
68
67 10
100
86 67
114
127
Ran
ge i
n yi
eld
of
wel
ls
(gpm
)
2-40
10-2
90
1/2-
10 0-40
0-8
H-3
5
H-2
0
H-4
8
Ave
rage
yi
eld
of
wel
ls
(gpm
) 11 80 3 7
m m
5
7H
Cha
ract
er o
f mat
eria
l and
wat
er-b
eari
ng p
rope
rtie
s
Cla
y, s
ilt, a
nd s
and
form
ed in
tem
pora
ry la
kes
or b
y re
cent
str
eam
s.
Poor
aq
uife
r ge
nera
lly,
but
sand
be
ds
may
yi
eld
mod
erat
e su
pplie
s, e
spec
ially
whe
re r
echa
rged
by
near
by s
trea
ms.
Inte
rbed
ded
and
inte
rlen
sing
san
d an
d gr
avel
for
med
by
sort
ing
actio
n of
gla
cial
mel
t w
ater
. M
ost
prod
ucti
ve a
quif
er i
n ar
ea,
espe
cial
ly w
here
rec
harg
ed b
y ne
arby
str
eam
s.
Fur
nish
es g
ood-
qu
alit
y w
ater
, su
itabl
e fo
r m
ost
purp
oses
.
Het
erog
eneo
us m
ixtu
re r
angi
ng i
n gr
ain
size
fro
m c
lay
to b
ould
ers.
F
ound
mos
tly in
the
upl
ands
. Po
or a
quif
er b
ut fu
rnis
hes
enou
gh
wat
er f
rom
dug
wel
ls f
or d
omes
tic u
se.
Dar
k bl
ue f
ossi
lifer
ous
limes
tone
hav
ing
dark
sha
le p
artin
gs.
Fur
ni
shes
sm
all
to m
oder
ate
quan
titi
es o
f m
oder
atel
y ha
rd w
ater
.
Dra
b-co
lore
d, t
hin-
bedd
ed,
clay
ey l
imes
tone
. F
urni
shes
sm
all
to
mod
erat
e qu
anti
ties
of m
oder
atel
y ha
rd w
ater
.
Mot
tled
red
and
gre
en,
drab
-col
ored
sha
le a
nd t
hin-
bedd
ed l
ime
st
one
zone
s.
Yie
lds
suff
icie
nt w
ater
for
dom
estic
use
but
qua
lity
is
ver
y po
or.
Pur
plis
h-re
d sh
ale
spot
ted
wit
h gr
een,
and
thi
n be
ds o
f gre
en s
hale
an
d lim
esto
ne.
Yie
lds
suff
icie
nt w
ater
for
do
mes
tic u
se
but
qual
ity
is v
ery
poor
.
Dar
k-co
lore
d ne
arly
bla
ck d
olom
ite a
nd s
hale
. F
urni
shes
sm
all
quan
titi
es o
f po
or-q
ualit
y w
ater
.
Gre
en a
nd g
ray
shal
e an
d sa
ndst
one,
a f
ew d
olom
ite a
nd c
ongl
ome
ra
te b
eds,
and
sev
eral
thin
bed
s of
foss
ilife
rous
red
oolit
ic h
emat
ite
(iro
n or
e) .
Yie
lds
suff
icie
nt w
ater
for d
omes
tic p
urpo
ses.
W
ater
m
ay b
e ha
rd in
som
e pl
aces
.
Qua
rtz-
pebb
le
cong
lom
erat
e an
d cr
ossb
edde
d sa
ndst
one,
pyr
iti-
fe
rous
. R
elat
ivel
y un
impo
rtan
t aq
uife
r ow
ing
to t
hinn
ess.
Gra
y sa
ndy
shal
e, t
hin
beds
of
dolo
mite
and
cal
care
ous
sand
ston
e.
Fur
nish
es s
mal
l to
mod
erat
e qu
anti
ties
of
good
-qua
lity
wat
er.
Bla
ck a
nd g
ray
carb
onac
eous
sha
le c
onta
inin
g ca
lcar
eous
arg
illite
s.
Rel
iabl
e so
urce
of
smal
l to
mod
erat
e qu
anti
ties
of w
ater
. W
ater
ob
tain
ed f
rom
ope
ning
s al
ong
join
ts a
nd b
eddi
ng p
lane
s.
Wat
er
is o
f go
od q
uali
ty b
ut c
onta
ins
hydr
ogen
sul
fide
in
som
e pl
aces
.

C-26 WATER RESOURCE'S OF INDUSTRIAL AREAS
From the available data it would seem that the most important potential sources of ground water in the area are the deposits of sand and gravel underlying the extensive plain between Rome and Delta Reservoir. These sediments were carried southward into the area by glacial melt water and were probably deposited in several stages, partly as glaciofluvial terraces and partly as a delta of the glacial Mohawk River. The deposits are coarse grained to the north near Delta Reservoir and become finer grained southward. They are generally less than 40 feet thick except in the vicinity of a buried bedrock channel that extends southwestward from the south western part of Delta Reservoir, in which they reach a maximum known thickness of 90 feet. They are a potentially productive source of ground water because they are highly permeable and are saturated for most of their thickness. Water levels in wells tapping sand and gravel deposits in the plain north of Rome are commonly 10 to 30 feet below the land surface. Maximum sustained yields from the glaciofluvial deposits in this area are not known as they are tapped only by domestic wells, except for an 8-inch-diameter screened well at the State Fish Hatchery north of Rome that is reported to have yielded 290 gpm with a drawdown in water level of 13 feet. Yields of about the same magnitude or even greater can probably be ob tained from properly constructed wells elsewhere in the plain north of Rome.
The fill underlying the Mohawk River plain between Rome and Frankfort is the second most important source of ground water in the lowland. It occupies an older channel that was eroded deeply into the soft shales of the region. The maximum thickness of the valley fill ranges from about 70 feet at Rome to 150 feet at Frank fort. The deposits are thickest over the axis of the older eroded bedrock channel which seems to be south of the present river in the reach between Rome and Whitesboro and north of the Erie (Barge) Canal in the reach between Whitesboro and Frankfort. The sedi ments making up most of the valley fill were carried in by glacial melt water and deposited in the standing water bodies that were earlier glacial stages of the development of the Great Lakes. These are overlain generally by a veneer of flood-plain deposits of the present Mohawk River. Consequently the sediments are predominantly fine sand, silt, and clay, but they are interstratified in places with beds and lenses of coarser sand and gravel that were washed in by stronger currents (pi. 3). These water-bearing sand and gravel de posits yield moderate supplies to a few industrial and domestic wells and are potential sources of additional supplies. The yields of 9 wells between Rome and Frankfort penetrating sand and gravel ranged from 7 to 80 gpm.

TJTICA-ROME AREA, NEW YORK C-27
Most of the higher yielding wells are at the east end of the channel, between Utica and Frankfort. Most wells in the channel obtain water from beds or lenses of sand and gravel that underlie fine-grained mate rials and hence have little direct hydraulic connection with the Mohawk Kiver or the Erie (Barge) Canal. However, in this area long-sustained, moderate to large quantities of ground water can probably be obtained from properly constructed wells that penetrate coarse-grained deposits of appreciable thickness. These coarse grained deposits lie close to and are hydraulically connected with the river or canal, from which recharge can be effectively induced. For example, 1 well in the Mohawk Kiver channel at Frankfort yields 500 gpm and 2 wells at Ilion, about 2 miles east of Frankfort, have a combined yield of 400 gpm. Their sustained high production is due partly to induced infiltration from the Mohawk River. In the broad, featureless plain west of Rome drained by Wood Creek, which is the western continuation of the channel discussed above, the underlying deposits are of lacustrine origin and comprise primarily clay and silt. They commonly are not very permeable and, hence, do not yield water readily. However, a few wells yield small supplies from dis continuous beds of sand and gravel at the base of the fill in the deepest part of the channel near Coonrod.
The unconsolidated materials filling the valley of Ninemile Creek also are a potential source of moderate quantities of ground water. The deposits originated as a delta of an earlier glacial stream and extend in typical fan-shaped form from Holland Patent nearly to the Mohawk River. They are coarse grained and poorly sorted near the head of the delta and grade south westward into silt and medium- to fine-grained sand. The finer grained deposits underlie the broad sand plain south and west of Floyd as well as the irregular sand hills near Griffiss Air Force Base and the extensive flat-topped terrace or bench between Marcy and the Mohawk River. The unconsolidated deposits in Ninemile Creek valley range in thickness from 30 feet near the head of the delta at Holland Patent, and along its south edge, to 140 feet near the center of the delta front east of the airbase. The thickest deposits overlie a buried preglacial bedrock channel of an earlier Ninemile Creek whose axis lies north of the present creek and extends southwestward from a point just east of Floyd. The present Ninemile Creek has trenched the delta along its south side and cut through the sediments to bedrock in many places. As a result the upper beds are well drained, particularly in the reach of the delta be tween Holland Patent and Floyd, and conditions for storage of large quantities of water are poor. Moreover, because the streambed rests on bedrock, opportunities for induced recharge of stream water are poor.

C-28 WATER RESOURCES OF INDUSTRIAL AREAS
The most favorable area for development of moderate ground- water supplies in the valley of Ninemile Creek seems to be in the area of the buried bedrock channel from a point just east of Floyd to Griffiss Air Force Base. The sand and gravel filling of the channel in this area is a potentially productive source of water because the stratified deposits are thick, are saturated for much of their thickness, and in at least one area are crossed by Ninemile Creek, which is a potential source of induced recharge. Only a few wells tap the sand and gravel in Ninemile Creek valley. They supply sufficient water for domestic and agricultural needs, but their yields give no indication of the maximum available. Larger yields probably could be obtained if the wells were designed for higher productivity.
The depths to water in most wells in the sand and gravel deposits of the Mohawk River lowland range from 5 to 40 feet below the land surface. In general the water table is closer to the land surface in the valley bottoms than in the terraces or along the sloping valley sides. In the flat valley bottoms, such as the low plain west of Rome and the Mohawk River channel, the water table is nearly level and stands generally only slightly higher than the level of the adjacent stream. Under natural conditions it slopes toward the streams or open bodies of water such as swamps, ponds, and reservoirs. The maximum depth to the water table (about 50 feet) is in the riverward faces of the sand and gravel terraces, where the slopes are steep and well drained.
No record of the fluctuations of water levels has been collected in the Utica-Rome area. The water levels in wells in the area close to the Mohawk River and its larger tributaries are probably affected by changes in river level. Water levels in some wells may be affected by the pumping of nearby wells. Elsewhere in the Mohawk River low land, the fluctuations probably follow the general seasonal patterns of precipitation and evapotranspiration; the range of fluctuations is probably between 3 and 15 feet per year.
Observations of the water level during 1926-55 in a well tapping sand and gravel near Woodgate, about 17 miles north of the area, and observations at other wells in the State show that water levels commonly rise in early spring in response to infiltration from rain and melting snow. They decline in late spring, summer, and early fall in response to transpiration and evaporation during the grow ing season. Although water levels have fluctuated from year to year, the long-term levels have been stable, and there has been no regional lowering of ground-water levels. In the well at Woodgate, the water level declined to the lowest stage of record during the period of deficient precipitation and low temperatures in 1930-3J.

UTICA-ROME AREA, NEW YORK C-29
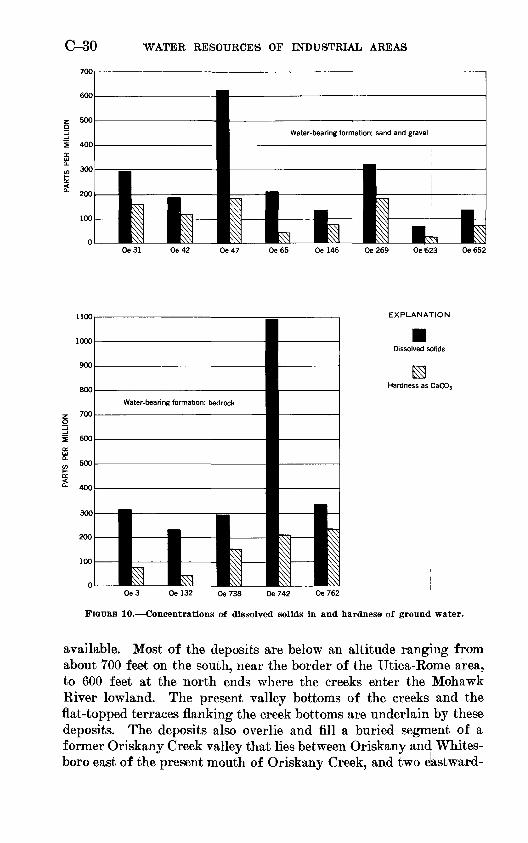
Only a few data are available on the chemical quality of ground water from sand and gravel aquifers in the Mohawk River lowland. In general, water from these deposits is less mineralized than water from the bedrock formations (fig. 10). The analyses given in table 6 show that the quality of the water from sand and gravel formations varies widely. The water contains moderate concentrations of dis solved solids, primarily calcium bicarbonate, and is soft to moderately hard. Water from sand and gravel forming the Ninemile Creek delta (wells Oe 146 and 652 on pi. 1) may be somewhat softer and less mineralized than water from sand and gravel in the Mohawk River channel. Iron concentrations are somewhat high and in wells Oe 42 and 269 were sufficiently high (more than 0.3 ppm) to cause discolora tion of laundry and deposition in boilers and cooking utensils. How ever, with the exception of that containing high concentrations of iron, the water is suitable for most uses. The iron content and hardness can be reduced with suitable treatment.
The water from well Oe 47, which penetrates sand in the Mohawk River channel, is abnormally high in dissolved mineral matter (627 ppm) and is hard; sodium and chloride are the predominant ions. The concentration of chloride .exceeds the generally recommended maximum limit of 250 ppm for domestic use of water. The abnormal concentration of these constituents may have resulted from the upward movement of water into the sand from the underlying bedrock forma tions, which contain scattered accumulations of salt water associated with natural gas.
No data are available on the temperature of ground water in the area. It is presumed to be fairly constant throughout the year, except in wells that receive water by infiltration from adjacent streams. The temperature of water in most wells probably varies seasonally between 45° and 52° F; the average is at)but the same as the average air tem perature of 47° F. Water from wells that receive infiltration from adjacent streams probably has a slightly greater range in temperature.
OKISKANY AND SAUQUOIT CREEK VAMJEYS
The unconsolidated deposits of glaciofluvial origin in the valleys of Oriskany and Sauquoit Creeks consist chiefly of sand and gravel which in some places are intercalated with lenses of silt and clay. The water-bearing beds of sand and gravel supply water to a few fairly large industrial wells and are potential sources of additional supplies.
Little is known of the character and water-yielding capacity of the valley-fill deposits in the valleys of Oriskany and Sauquoit Creeks, because records of only a few wells that obtain water from them are
C-30 WATER RESOURCE'S OF INDUSTRIAL AREAS
Oe 31 06 42 Oe 47 Oe 65 Oe 146 Oe 269 Oe 623 Oe 652
EXPLANATION
Dissolved solids
Hardness as CaC03
Oe 3 Oe 132 Oe 738 Oe 742 Oe 762
FIGUBH 10. Concentrations of dissolved solids in and hardness: of ground water.
available. Most of the deposits are below an altitude ranging from about 700 feet on the south, near the border of the Utica-Kome area, to 600 feet at the north ends where the creeks enter the Mohawk Kiver lowland. The present valley bottoms of the creeks and the flat-topped terraces flanking the creek bottoms are underlain by these deposits. The deposits also overlie and fill a buried segment of a former Oriskany Creek valley that lies between Oriskany and Whites- boro east of the present mouth of Oriskany Creek, and two eastward-

TABL
E 6
. C
hem
ical
ana
lyse
s, i
n pa
rts
per
mil
lion
, of
wat
er fr
om s
elec
ted
wel
ls in
the
Uti
ca-R
ome
area
Wel
l (p
l.l)
Dat
e of
co
llect
ion
Silic
a (S
i08)
Iron
(Fe)
Man
ga
ne
se
(Mn)
Cal
ci
um(C
a)
Mag
ne
si
um
(Mg)
So
dium
(Na)
Po
tas
si
um
(K)
Car
bo
nate
(C
O,)
Bic
ar
bona
te
(HC
03)
Sulf
ate
(S0
4)
Chl
o
ride
(C
l)
Fluo
- ri
de (F)
Ni
tr
ate
(NO
,)
Dis
so
lved
so
lids
Har
dnes
s as
C
aCO
s
Cal
ci
um,
mag
ne
sium
Non
- ca
r
bona
te
Spec
ific
co
n
duct
an
ce
(mic
ro-
mho
s at
25
PH
Col
or
Bed
rock
Oe
3
132-
73
8.
742.
762-
Mar
. 16
, 19
55.
1955
Mar
. 16
, 19
55.
d
o
1956
10 11 15 9.7
11
0.08
.2
4 .4
0 .1
9 .2
4
0.00
.0
0 .0
0 .0
0 .0
0
22
14
26
48
56
6.2
2.7
22
22
23
95
69
66
317 46
8 20
16
277
190
300
318
289
14
21
33
220 57
30 9.5
1.5
262 5.
0
0.6
.2
.2
1.
0 1.
7
2.9
6.
7 2.6
5.
2 .2
314
232
297
1,09
0 33
6
80
46
155
210
234
0 0 0 0 0
533
331
551
1,92
0 58
6
8.2
7.6
8.4
8.6
8.5
2 2 2 2
San
d an
d gr
avel
Oe 31.
42.
47.
65
.
146.
269- ..
623.
65
2.
Mar
. 18
, 19
55.
19
55
M
ar.
17,
1955
- M
ar.
18,
1955
. M
ar.
17,
1955
- M
ar.
23,
1955
. M
ar.
17,
1955
- d
o
8.7
9.8
11 6.5
8.3
11 7.4
13
.63
.74
1.96
.1
0 .5
4 .3
6 .3
4
0.01
.0
1 .0
0 .0
1 .0
0 .0
0 .0
1 .0
0
33
39
54
13
17
42
10
20
19 5.4
12 2.5
8.4
19 .3
5.
2
60
26
138 64
17
146.
9 6.4
15
12 4 6 2
240
163 92
188
119
216 34
11
7
54
27 3.1
3.1
6.1
11
10 6.0
12 4.5
28
8 6.5
4.5
74 1.0
1.0
0.1 .1
.1
.5
.1
.1
.1
.1
0.7
.1
.2
4.
2 .2
.2
.3
.3
292
189
627
212
134
322 69
13
6
160
120
154 43 77
'1
84
26
71
0 0 10
9 0 0 7 0 0
491
321
1,08
0 32
7 21
1 56
5 74.7
19
7
8.5
8.4
8.1
8.7
8.4
7.3
7.6
8.2
1 2 3 2 2 6 2
1 Na,
46
ppm
; K
, 0.
9 pp
m.
1 Inc
lude
s ha
rdne
ss o
f all
pol
yval
ent
catio
ns r
epor
ted.

C-32 WATER RESOURCE'S OF INDUSTRIAL AREAS!
trending buried valleys that seem to have connected Oriskany and Sauquoit Creeks before the last glaciation. The eastward-trending valleys underlie the present Mud Creek valley between Clinton and Utica and the depression occupied by the tracks of the Ejew York Central Railroad between Clark Mills and Utica, respectively. The coarsest deposits are those forming the terraces, but because they are poorly sorted and well drained, they probably would yield oiily small quantities of water to wells.
The most productive water-bearing beds are associated with the bottom deposits of the present creek valleys. In Sauquoit Creek valley between Willowvale and Whitesboro, the deposits consist of sand and gravel interfingered with silt and clay. They have accumu lated in the valley to a maximum known depth of more than 100 feet; of this thickness the coarser materials occur mostly in the upper and lower parts of the section; the finer grained materials are in the middle. An industrial plant 1 mile north of Willowvale has 3 wells about 500 to 600 feet from Sauquoit Creek. The wells range in depth from 112 to 132 feet and penetrate sand and gravel. Their yields range from 64 to 171 gpm, and they have a combined yield of 290 gpm. The percentage of fine-grained material (silt and clay) in the bottom deposits increases downstream from Willowvale, and several wells in the creek valley between New Hartford and Whitesboro obtain moderate supplies from shallow sand and gravel deposits overlying silt and clay.
Little information is available on the water-yielding capacity of the deposits in Oriskany Creek valley and in the buried channels tribu tary to the creek. The valley fill consists chiefly of fine sand, silt, and clay which in some places is interstratified with beds or lenses of sand and gravel. The deposits have accumulated to depths of at least 100 feet in many places. More than 100 feet of material has accumulated in the buried channel of Oriskany Creek near its mouth and more than 90 feet in the depression between Utica and Clark Mills. The water-bearing sand and gravel deposits yield moderate supplies to wells and should yield large sustained supplies to wells so situated as to induce infiltration from Oriskany Creek.
Ground water in sand and gravel deposits in the valleys of Oriskany and Sauquoit Creeks has about the same chemical quality as that in the Mohawk River lowland. It is moderately high in dissolved min eral matter, as shown by the analyses of water from wells Oe 31 and Oe 65 (table 6) and may be moderately hard. The hardness is due to the calcium and magnesium dissolved from limestone in the area and possibly from fragments of this rock which are included in the gravel beds. Water from well Oe 65 contains 1.96 ppm of iron, an especially high concentration of iron. The hardness of witter from

UTICA-RQME AREA, NEW YORK C-33
wells receiving water by infiltration from Oriskany and Sauquoit Creeks may be similar to that of water from the creeks. In addition, water from these wells may be adversely contaminated by industrial wastes in the stream water, particularly wells in the lower reaches of the creeks where contamination of the water is greatest.
OTHER SOURCES
The ground moraine and isolated bodies of sand and gravel that are the surficial deposits outside the areas discussed previously and the consolidated bedrock which underlies the entire Utica-Eome area are also sources of ground water.
Most of the uplands above an altitude of about 600 feet in the Utica-Eome area are covered by a mantle of ground moraine and small isolated bodies of sand and gravel. In the lowlands ground moraine occurs beneath the stratified deposits. The ground moraine is mostly till, a direct deposit of the glacial ice consisting generally of a clay matrix containing sand and boulders. The till in this area is tough and compact and is often called hardpan by well drillers and farmers. It commonly has a very low permeability. Owing to its low permeability, till generally yields less than 1 gpm to wells but is an important source of water in quantities adequate for homes and small farms. Probably the maximum yield that can be obtained from a well tapping till is between 200 and 2,000 gpd. The water is commonly obtained by means of large-diameter dug wells which provide large infiltration area and storage capacity.
Supplies adequate for the needs of rural homes, small municipalities, and industries requiring only small quantities of water may be obtained from some of the small bodies of sand and gravel that overlie the till in the gently sloping parts of the upland areas. Ordinarily this sand and gravel mantle is a recent deposit of streams draining the upland. Although thin and of small areal extent, the sand and gravel bodies may yield small to moderate amounts of water to shallow wells of proper construction, especially where they are adjacent to streams. One of two wells of the Westmoreland Water District finished in these sand and gravel bodies was pumped at the rate of 380 gpm, the other at 194 gpm. The specific capacities of the wells were 69 and 16 gpm per foot, respectively.
Where exposed, the bedrock consists of sedimentary rock forma tions composed principally of shale, sandstone, limestone, and dolomite. As described in table 5, they include the Utica and Frank fort shales, the Clinton group containing the red iron ores, the Lock- port dolomite, the Vernon and Camillus shales, and the Bertie and Manlius limestones. The well-known Utica and Frankfort shales

C-34 WATER RESOURCE'S OF INDUSTRIAL AREAS
underlie the bottom and sides of the Mohawk River lowland and the upland north of the Mohawk River. The Vernon and Camillus shales are the distinctive red and green shales that form the steep northern slope of the Allegheny plateau; the limestone formations are the distinctive capping of the plateau and underlie the highest areas in the southern part of the Utica-Rome area. The physical character istics and water-yielding capacity of the bedrock formations are shown in table 5 and their distribution is shown on plate 2. Limestone and dolomite beds of the Trenton group underlie the Utica shale in this area but are not exposed, although rocks of this group have been found in many deep wells.
Most ground water in the bedrock is transmitted through secondary openings along joints, bedding planes, and faults. As a result the yields of wells penetrating these formations range widely. The yields generally are small but are adequate for the needs of farms or house holds, and the wells are an important source of water in areas in which more productive aquifers are not available. The yields of 77 wells tapping the bedrock formations in the area average about 8 gpm and range from less than 1 to 75 gpm. Wells tapping the Clinton group yield, on the average, a little more water than the other forma tions ; 18 wells tapping the Clinton have an average yield of 9i/£ gpm, as compared with an average yield of 7^ gpm for 26 wells tapping the Utica shale. Wells tapping the other consolidated rock forma tions in the area generally yield less water than wells in the Utica shale. Few wells draw fresh water from depths greater than 250 feet. In fact, deeper drilling in the outcrop area of the Utica shale has tapped salt water and occasionally natural gas (Dale, 1953, p. 176- 182).
The chemical quality of water from the bedrock differs greatly from place to place, partly because of differences in geology. (See table 6.) The concentration of dissolved solids in water samples collected at scattered locations ranged from 232 to 1,090 ppm. The mineral matter consists principally of calcium, sodium, and bicarbonate and lesser amounts of magnesium. However, water from well Oe 742 (dissolved-solids content, 1,090 ppm) contained 220 ppm of sulfate and 262 ppm of chloride. Water from well Oe 762 contained 1.7 ppm of fluoride, which is slightly greater than the content recom mended for drinking water (U.S. Public Health Service, 1946). Moderately large amounts of mineral matter were present in water samples from three other wells (wells Oe 3, Oe 132, and Oe 738 in table 6), and water in these was soft and moderately hard. Because of the difference in chemical composition, a general evaluation of the chemical quality of water from bedrock cannot be made. However,

UTICA-ROME AREA, NEW YORK C-35
if water is present in sufficient quantity to be an important source of supply, the chemical quality can be improved by treatment to reduce 'hardness.
The water from the Utica and Frankfort shales commonly is moderately hard (wells Oe 3 and Oe 132 in table 6) and in some wells has a slightly sulfurous taste and odor. Salt water and natural gas from the limestone beds underlying the Utica shale occur in several wells in the Rome area (Dale, 1953, p. 176-182). Ground water from the Clinton group is generally suitable for most uses (well Oe 738, table 6), although water from the limy beds of the Clinton is hard.
Probably the water of poorest quality obtained from bedrock in Utica-Rome area is drawn from the Lockport dolomite and the over lying Vernon and Camillus shales. The Lockport dolomite yields water that is hard and has a noticeable hydrogen sulfide taste and odor. Also, high sulfate and chloride concentrations in the water from the Lockport dolomite are reported by many well owners. (See also well Oe 742, table 6.) No analyses of water from wells tapping the Vernon and Camillus shales are available, but a high mineral content and undesirable concentrations of sulfate and chloride have been reported in water from wells in the outcrop areas of these for mations. The sulfate and chloride are probably derived from beds of gypsum and salt, which occur in the Vernon and Camillus shales in the Utica-Rome area. The calcareous mud or tufa, known locally as horse bone, that is deposited near the head of the village of Clinton and Hamilton College reservoirs is derived from minerals dissolved from the Vernon and Camillus shales by circulating ground water. The water from many small brooks and tributary streams that origi nate in springs draining the slopes underlain by the Vernon and Camillus shales is moderately to very hard as shown by analyses reported by Dale (1953, p. 19-20). Water from the younger lime stones in the area (Bertie and Manlius limestones) may also be very hard. (See well Oe 762, table 6.)
PUBLIC WATER-SUPPLY SYSTEMS
Seven public water-supply systems in the Utica-Rome area serve about 92 percent of the population and some industries. All the systems are supplied by surface water. The two largest public water- supply systems are those of the cities of Utica and Rome (fig. 11).
These cities obtain most of their water from sources outside the Utica-Rome area. Descriptive data for public water-supply systems are summarized in table 7, and analyses of finished water are given in table 8.
Utica obtains its supply from Hinckley Reservoir on West Canada Creek and Graffenburg Reservoir southeast of the city. Hinckley

C-36 WATER RESOURCE'S OF INDUSTRIAL AREAS
75°35 75°10'
43° 15'
43° 00'
Hamilton College Resenxrirf^ O.d|5 mgd
Clinton Reservoir
l_4 Graffenburg Reservoir
Frankfort <7&VHerkimer
10123 MILES
FIGDEE 11. Source of and demand on the public water supplies.
Reservoir, constructed by the State in 1915 as a feeder reservoir for the Erie (Barge) Canal, has a capacity of 25,000 million gallons; and Graffenburg Reservoir, built in 1854, has a capacity of 654 million gallons. About 98 percent of the demand is obtained from Hinckley Reservoir, the city of Utica having the right to divert about 50 mgd. In addition to supplying the city, the water-supply system furnishes water to the villages of New Hartford, New York Mills, Oriskany, Whitesboro, and Yorkville and to suburban customers in the towns of Deerfield, Frankfort, Marcy, New Hartford, Schuyler, Trenton, and Whitestown.
The water from Hinckley and Graffenburg Reservoirs has the lowest mineral content and is the softest water (19 ppm, hardness as CaCO3 ) of any of the public supplies in the area (fig. 12 and table 8).
Rome takes its entire supply from East Branch Fish Creek in the Oneida River basin. The maximum daily use in 1954 was 17.8 mil lion gallons of which slightly less than half was used by industry. The present rated capacity of the system is 21 mgd, and it is being

UTICA-ROME AREA, NEW YORK C-37
TABLE 7. Public water-supply systems[Treatment: DC, chlorine gas disinfection; Dh, hypochlorlte disinfection; N, ammonlatlon; Ng, NHa gas;
S, sedimentation; Z, zeolite softening]
Public water- supplysystem
Clinton .........
Hamilton College.
Holland Patent.
Utica ........
Esti mated popu lation served (1954)
1,600 4,564
750
370 44,000
250 133, 170
Source of
water
Stream ..........Streams, wells
(auxiliary).
Stream ...............do...........
Streams, springs.
Rawwater
storage (million gallons)
19 10
27
.24 0 .15
26, 455
Treated water
storage (million gallons)
0 0
0
0 66 0 2.47
Treatment
DC Dh... .
DC ......DC, N, S...
DC, Ng, Z..
Daily use in 1954
Maxi mum (mgd)
1.35
17.80
19.62
Aver age
(mgd)
0.20 1.07
.06
.02 11.63
.015 14.44
Aver age per capita (gal lons)
125 235
SO
55 265 60
108
TABLE 8. Chemical analyses, in parts per million, of finished water from major public water-supply systems in the Utica-Rome areaipply systems
[Samples collected Jan. 27,1955]
Constituents
Silica (SiO2). ______ - ____ - _ __Iron (Fe), dissolved 3 __ _________ _______Iron (Fe), total _ _______ __________ __
Manganese (Mn), total ________________Calcium (Ca)_ _________ _____ _____Magnesium (Mg)_______ ______________Sodium and Potassium (Na + K)_________Bicarbonate (HCOs)-----------. - ___Carbonate (CO3) _ ___________ _______Sulfate (SO4) ____ ____-__-_-___-_-___Chloride (Cl) _______________________Fluoride (F)____.____ ______ __ _ __Nitrate (NO3)_- -----------------------Dissolved solids _________ __ ________Hardness as CaCOs, calcium, magnesium. _
Specific conductance (micromhos at 25° C). _____________________________
pH___________________________________Color_________________________________Temperature (°F) __ ______ _____ ____
Frankfort
7.2.01.04.01
48128.5
1616
354. 5.0
3.5230169 27
3498. 52
36
Rome
4.7.01.06.00
9. 11.93.7
280
102.5
. 11. 6
5930
8
75. 67.46
34
Utica i
6.3. 11. 18.00
6. 4. 8
2.21408.32.0
. 11.2
4919 8
50.26.7
1234
Utica 2
6. 5.01.09.01
268. 8
34161
0353.5.0
1.3200101
0
3328.03
33
i Mixture of finished water from Hlnckley Reservoir (West Canada Creek) and Qraflenburg Reservoir (springs).
* Finished water from Graflenburg Reservoir. ' In solution at time of analysis.
enlarged. Additional descriptive information is given in table 7. An analysis of the finished water indicates that the water is soft and has a low mineral content (table 8).

WATER RESOURCES OF INDUSTRIAL AREAS
Camden Frankfort Herkimer Oneida Rome Utica
FIGURE 12. Dissolved solids and hardness of finished water from public water supplies.
The village of Frankfort obtains its principal supply from Moyer Creek and has two wells as an auxiliary supply. The impounding reservoir on Moyer Creek has a capacity of 10 million gallons and the maximum demand by the village was 1.3 mgd in 1954. The finished water from the system is hard and contains more dissolved solids than most other public supply water in the area (fig. 12 and table 8). The village supplies water to 3 water districts serving about 400 people outside the village in the town of Frankfort. An additional 320 people in the town are supplied by the village of Ilion.
SUMMARY OF WATER USED
The estimated use of water in the Utica-Rome area averaged about 48.5 mgd in 1954 (table 9). About 57 percent, or 27.4 mgd, was supplied by municipally owned systems and 43 percent, or 21.1 mgd, was obtained from private sources. All the water for municipal supply and most of the water for industry was drawn from surface sources; only about 4 percent of the total was drawn from ground- water sources. Industry used the most water, requiring 60 percent or 29.1 mgd.
Of the 27.4 mgd furnished by public water supplies in 1954, about 35 percent was supplied to industry, about 43 percent was for domes tic use, and the remaining 22 percent was for all other uses. About 40 percent of the water delivered by the city of Utica was used by industry. In the city of Eome, 57 percent of the water was used for domestic purposes and 34 percent for industrial purposes.
About two-thirds of the 29.1 mgd used by industry in 1954 was self supplied; the other one-third was purchased from public-water
systems. Of the two-thirds that was self supplied, more than 99 per-

UTICA-ROME AREA, NEW YORK C-39
cent of the water was drawn from surface sources, the largest with drawals being from the Mohawk River and the Erie (Barge) Canal. The ready availability of these large sources in contrast to the low yield of most aquifers accounts for the greater use of surface water. The small amount of well water used (0.2 mgd) was mostly for light industries such as dairies and bottling plants. The largest single ground-water development for industrial purposes used an average of about 44,000 gpd in 1954.
TABLE 9. Average use of water in the Utica-Rome area in 1954, in milliongallons per day
Use
Domestic.. _ _____ ___. ___Public, commercial, and leakage _____Industrial- .__ __ ___ _ _____Agricultural (excluding domestic use on
farms) .
All uses______ _ _____ _ ___ ___
Public supply
All sur face water
11.7 5.9 9. 8
27.4
Self-supplied
Ground water
1.0
.2
. 8
2.0
Surface water
19. 1
19. 1
All sources
1.0
19. 3. 8
21. 1
All systems
12.7 5.9
29. 1. 8
48.5
Industry in the Utica-Rome area uses water for cooling and proc essing, for boiler feed, and for sanitary and service needs. The largest amount is used as process water for production of heavy metals, paper products, and textiles. The Rome Division of Revere Copper and Brass, Inc., uses more water than any other industry in the area. Table 10 shows the quantities of water used by the various types of industries in the area.
An estimated 15,700 persons live outside areas served by the public water-supply systems and obtain most of their water from privately owned wells and springs. About 10,000 of these people live in sub urban residences; the remaining 5,700 live on farms. The quantity of water used by this group of people is estimated to be 1 mgd, based on a per capita consumption of 65 gpd. This figure includes water for domestic use on farms but not for livestock or irrigation.
In the Utica-Rome area, water is used for agricultural purposes such as watering dairy cattle and poultry, irrigation, and domestic use on farms at an average rate of about 0.8 mgd, according to Ralph Hadlock, associate county agricultural agent; the principal use is by dairy cattle. During the growing season of 1954 about 6.2 million gallons was used for irrigation or about 17,000 gpd on a year-round basis. Water is applied entirely by sprinklers and is used principally

C-40 WATER RESOURCES OF INDUSTRIAL AREAS
to irrigate potatoes, beans, and other vegetables, forage crops, and pastures.
TABLE 10. Industrial use of water, 1954
Community and type of industry
City of Utica: Heavy-metal production .Light-metal productionFood processing _ _Beverages and breweries _Laundry and dry cleaning. Paper products _ _Textiles. ___Electrical equipment
Transportation..Public utilities
Total____.____-_--..__.___
Suburban Utica (supplied by city of Utica) :
Light-metal production _Food processingBeverages and breweries. _Paper products ._ _ _____
Miscellaneous. _ _ _ ___
Total........... ---.___
City of Rome: Heavy-metal production. _ _
Food processing _Laundry and dry cleaning. ...
Textiles. _______ _ _______
Total. __ ______________
Other communities: Heavy-metal production. _
Food processing. _ .__
Paper productsMiscellaneous. _
Total....... _____._.___._
Total, all communities _ _
Num ber of instal lations
9 8
35 5
13 2 5 3 3 1 1
10
95
2 6 9 3 1 2 1 2
26
8 4
10 3 1 1
10
37
4 1 6 2 2 5
20
178
Average use, (gpd)
All sources
1, 583, 000 643, 000 805, 000 725, 000 262, 000
1, 982, 000 7, 379, 000
636, 000 26, 000
204, 000 61, 000
172, 000
14, 478, 000
427, 000 268, 000
53, 000 51, 000 7,000
3, 328, 000 3,000
13, 000
4, 150, 000
8, 538, 000 1, 156, 000
105, 000 36,000 5,000
19, 000 81, 000
9, 940, 000
84, 000 20, 000 97, 000 46, 000
255, 000 8,000
510, 000
29, 078, 000
Public supply
1, 514, 000 643, 000 762, 000 725, 000 262, 000 192, 000 372, 000 636, 000
26, 000 204, 000
61, 000 172, 000
5, 569, 000
422, 000 266, 000
40, 000 51, 000 7,000
251, 000 3,000 6,000
1, 046, 000
1, 665, 000 1, 156, 000
102, 000 36, 000 5,000
19, 000 81, 000
3, 064, 000
80, 000
34, 000
1,000
115, 000
9, 794, 000
Private supply
69, 000
43, 000
1, 790, 000 7, 007, 000
8, 904, 000
5,000 2,000
13, 000
3, 077, 000
7,000
3, 104, 000
6, 873, 000
3,000
6, 876, 000
4,000 20, 000 63, 000 46, 000
255, 000 7,000
395, 000
19, 284, 000

UTICA-ROME AREA, NEW YORK C-41
More than half the water for livestock and domestic use on farms is drawn from springs; the remainder is obtained from wells. Farm ponds supply a small part of the water used for watering stock.
POSSIBILITY OF FURTHER DEVELOPMENT
Ample supplies of water are available in most of the Utica-Rome area for all uses. The Utica municipal supply is capable of furnish ing much more water to current or potential users than is presently demanded, by virtue of its right to divert 50 mgd from Hinckley Eeservoir. The present demand upon the public supply of the city of Rome is near the rated capacity of the present system, which is being enlarged.
The area can be supplied with much more surface water. The Mohawk Eiver and the Erie (Barge) Canal and its two feeders near the area, Delta and Hinckley Reservoirs, are the major sources. The larger tributaries of the Mohawk River within the area, Oriskany and Sauquoit Creeks, can supply moderate quantities of water.
Ground water is available in moderate quantities from extensive deposits of sand and gravel along the main river channels or in a few buried valleys. This is true especially if the bodies of coarse grained materials are in a position to be recharged with surface water.
The quality of the surface water is generally fair. Ground water from the unconsolidated deposits is generally of good quality and can be used for most purposes with little treatment.
MOHAWK RIVER LOWLAND
The Mohawk River is a source of water for large potential develop ment. The present withdrawal from the Mohawk River and Erie (Barge) Canal is only a small part of the flow, and much of the water withdrawn is not consumed. The flow below Delta Dam, where the river enters the area, equals or exceeds 108 mgd 90 percent of the time; and the flow at Little Falls, about 10 miles east of the point where the river leaves the Utica-Rome area, equals or exceeds 560 mgd 90 per cent of the time. The quality of the water is fair and is probably satisfactory for most uses or can be made satisfactory by suitable treatment. The Mohawk River is an important potential source of water for industrial, agricultural, and fire-fighting uses in its present condition. The impounded water in Delta Reservoir and the water in the Mohawk River are potential sources for municipal supply if treated.
The valley fill of the Mohawk River lowland includes many bodies of coarse-grained sand and gravel that are potential sources of ground water. The water generally is of good quality and is suitable for most uses without treatment. The most favorable areas of potential

C-42 WATER RESOURCES OF INDUSTRIAL AREAS
development are the extensive plains between Rome and Delta Reservoir, the flood plain of the Mohawk River between Rome and Frankfort, and the valley lowland of Mnemile Creek below Holland Patent. Deposits of sand and gravel underlying the northern part of the plain between Rome and Delta Reservoir are a potendally pro ductive source of moderate supplies of ground water because they are highly permeable and are saturated for most of their thickness. Available test data indicate that yields of about 300 gpm br larger can be obtained. The valley fill underlying the flood plain of the Mohawk River is mostly fine sand, clay, and silt; however in some places these fine-grained materials are interstratified with sand and gravel. Drill data and information from a few industrial wells indi cate that wells yielding as much as 500 gpm can be developed at sites where the sand and gravel aquifers are hydraulically connected with the river. Where the aquifers are not connected with the river, wells are likely to yield 80 gpm or less. The sand and gravel deposits in Ninemile Creek valley are a potentially productive source because they are thick and saturated throughout much of their thickness. Maximum sustained yields are not indicated from existing data. The most favorable area of potential development in Ninemile Creek valley is along the axis of a buried bedrock channel southwest of Floyd and north of the present creek.
OTHER POTENTIAL SOURCES
Several creeks and smaller streams tributary to the Mohawk River and draining the upland areas of the valley in the Utica-Rome area have well-sustained low flows and are important sources for potential development. Oriskany and Sauquoit Creeks are examples of such streams. Miscellaneous flow measurements on Sauquoit Creek, for example, show that the creek has a probable flow that equals or exceeds 0.33 mgd per square mile 90 percent of the time. The mineral con tent of water in streams draining the south slopes of the Mohawk valley is high and may require treatment before it can be used by industries and municipalities.
Coarse-grained sand and gravel deposits adjacent to the smaller streams may yield small to moderate quantities of water. These deposits are much smaller than those in the Mohawk River lowland, but where they are hydraulically connected with adjacent streams, they may yield dependable supplies. Industrial wells tapping sand and gravel deposits in the Oriskany and Sauquoit Creek valleys have yielded from 64 to 170 gpm. The water from these wells probably has a High content of dissolved solids.
The public water-supply may be the most satisfactory source of water for industrial use in the Utica-Rome area. The cities of Utica

UTICA-ROME AREA, NEW YORK C-43
and Rome now serve a large percentage of the industries. The capacities of the systems will exceed present peak demands for many years and the sources of water are adequate for expansion. The max imum daily use of water by the city of Utica in 1954 was less than half the 50 mgd that the city may divert from Hinckley Reservoir. The finished water from the public supply systems is of good quality and meets all U.S. Public Health Service standards for drinking water.
SELECTED REFERENCES
Dale, N. C., 1953, Geology and mineral resources of the Oriskany quadrangle:New York State Mus. Bull. 345,197 p.
Gillette, Tracy, 1947, The Clinton of western and central New York: New YorkState Mus. Bull. 341,191 p.
Kay, Marshall, 1953, Geology of the Utica quadrangle, New York: New YorkState Mus. Bull. 347,126 p.
Lewis, H. G., Brooking, E. F., Howe, F. B., and Kinsman, D. F., 1929, Soilsurvey, Herkimer County area, New York: U.S. Dept. Agr., Bur. Chemistryand Soils, ser. 1923, p. 1601-1648.
Lohr, E. W., and Love, S. K., 1954, The industrial utility of public water suppliesin the United States, part 1, States east of the Mississippi River: U.S. Geol.Survey Water-Supply Paper 1299, 639 p.
Maxon, E. T., Carr, M. E., arid Stevens, E. H., 1915, Soil survey of Oneida County,New York: U.S. Dept. Agr. Bur. Chemistry and Soils, Field Operations for1913, 59 p.
New York State Department of Commerce, 1950, New York State business facts,Mohawk valley area: New York State Dept. Commerce, 11 p.
New York State Department of Health, Water Pollution Control Board, 1950,Rules and classifications and standards of quality and purity for watersof New York State: New York State Dept. of Health, 15 p.
1951, Recommended classifications and assignments1 of standards of quality and purity for designated waters of New York State: Mohawk River drainage basin survey series, rept. 1, Sauquoit Creek drainage basin, 23 p.
1952, Recommended classifications' and assignments of standards' ofquality and purity for designated waters of New York State: Mohawk Riverdrainage basin survey series, rept. 2, Mohawk River drainage basin, 245 p.
Thomas, N. O., and Harbeck, G. E., Jr., 1956, Reservoirs in the United States:U.S. Geol. Survey Water-Supply Paper 1360-A, p. 1-99.
U.S. Geological Survey, issued annually, Quality of surface waters of the UnitedStates, parts 1-4, North Atlantic slope basins to St. Lawrence River basin:U.S. Geol. Survey Water-Supply Papers 1250, 1290.
issued annually, Surface-water supply of the United States, part 1, North Atlantic slope basins: U.S. Geol. Survey Water-Supply Papers 1001, 1031, 1051, 1081,1111,1141,1171, 1201, 1202, 1231, 1232, 1271, 1272,1331,1332, 1381.
issued annually, Water levels and artesian pressures in observation wells in the United States, part 1, Northeastern States: U.S. Geol. Survey Water- Supply Papers 777, 817, 840, 845, 886, 906, 936, 944, 986, 1016, 1023, 1071, 1096, 1126, 1156, 1165, 1191, 1221, 1265, 1321, 1404.
1951, Index of surface-water records, part 1, North Atlantic slope basins,to September 30,1955 : U.S. Geol. Survey Circ. 381, 30 p.
U.S. Public Health Service, 1946, Drinking water standards': reprint 2697, from Public Health Service Repts., vol. 61, No. 11, p. 12.

INDEX
PageAgriculture, water used for__________ C-39 Allegheny plateau.______________ 4 Alluvial deposits, yield from_________ 25
Bedrock, ground water from..________ 33-35 Bertie limestone.. _____________ 25,33
Camillus shale_______________ 25,33-34 quality of water from____________ 35
Chemical analyses of water samples, fromMohawk River..________ 14,15,16
from Oriskany Creek___________ 15 from West Canada Creek..._______ 15 well water in Utica-Rome area_.____ 31
Clinton group __________________ 25,33 quality of water from___________ 35
Coonrod____________________ 27
Delta Reservoir, capacity of _________ 6 Deltaic deposits, yield from....________ 25,27
East Branch Fish Creek, chemical quality ofwater.._______________ 22-23
discharge records.______________ 21 drainage area_______________ 20-21 flow-duration curve_____________ 21 source of Rome water supply _______ 36
Erie (Barge) Canal_____________..
Floods, on Mohawk River__________ 10-11 Floyd..._........___.................... 27Frankfort___________.________ 38Frankfort shale.._.._____________ 25,33
quality of water from____________ 35
Geologic formations, waterbearing properties- 25 Glaciofluvial deposits, yield from______ 25,26 Graffenburg Reservoir...____________ 36 Griffiss Air Force Base. ____________ 27 Ground water, in fill underlying Mohawk
River plain..____________ 26 in sand and gravel in Mohawk River
lowland____________._ 24-26 in sand and gravel in Ninemile Creek
valley.. .___________ 27 in sand and gravel in Oriskany Creek
valley ___________. _ 29-30,32 in sand and gravel in Saquoit Creek
valley....____________ 29-30,32 potential sources._____________ 41-43 sources-__________________ 23-24
Hinckley Reservoir..._________ 10,20,35-36 Holland Patent, gaging station near..____
Industrial water use_______________ 39,40 Irrigation, water used for____________ 3S
PageLacustrine deposits, yield from___ C-25,27 Location and extent of area_____.___. 3
Lockport dolomite.-._____________.. 25,33 quality of water from.________ .- 35
Manlius limestone ____________ 25,33-34Mohawk River, chemical quality of water.... 14
discharge records.. 12 economic importance____._ 5 flood plain.____._.-.. 4 floods on..._________________ 10-11 flow-duration curve_______ 7,11 gaging stations on. ______ 6 main tributaries___...- 5 regulation of flow_____.. 6 synthesized flow record __ 8,12 ternperature of water.....___ 14,17
Mohawk River lowland, quality of groundwater_____..___ 29
temperature of ground water... 29 water in underlying sediment. 24-26
Moyer Creek._ ...._.... . 38
Natural gas. ____-. ...._ 34,35New Hartford. _____. _____.. 36 New York Mills 18,36Ninemile Creek valley, wells in sand and
gravel..___ 28
Oneida conglomerate... 25Oriskany_______....___ . 36Oriskany Creek, chemical analysis of water 15
discharge measurements__ 16drainage area_ 14,16quality of water. __ _ 18temperature of water..__ 18
Physical features 4-5 Pollution.__.__ 14 Population, distribution of...___ 39 Public water-supply systems... 35-38 Pulaski shale. ._ 25Purpose of report__ ___ 3
Rocky Rift Dam....... ... 10Rome, industrial use of water_... 40
water supply....._ 21,35,36
Salina group___ 25 Salt water_____ . __ 34,35Sauquoit Creek, chemical analysis of water 15,19
discharge measurements__ 18-19 drainage area_-... 18
Sauquoit Creek valley, quality of ground waterfrom ___________ 32-33
Selected references____ 43C-45

O46 INDEX
PageSurface water, potential sources.._______ 41-43
sources of__..__.__________ 5
Till....... ..........water yields from.
Trenton group....__.
Utica, industrial use of water_________ 40 water supply _. _______________ 20,35
Utica shale.._______.-..._______ 25,33-34 quality of water from____________ 35
Utilization of water...______________ 38-41
Vemon shale_________________ 25,33-34 quality of water from____________ 35
PageWater levels, in Clinton group____ _ 25,34
in Mohawk valley fill..________... 26-27 in Ninemile Creek valley flll_...r j........ 28in Utica shale....____.. ___-... 34
West Canada Creek, chemical analysis ofwater.___..______ .... 15
discharge measurements______ 20 drainage area________ .. 1&-20 quality of water.__------___ .. 20
Westmoreland._________ .. 33 Whitesboro...._____.___._______ 36
Yorkville. 36
U. S. GOVERNMENT PRINTING OFFICE : 1962 O - 633991