Embed Size (px)
Citation preview
1
Water Resources Management Authority
NATIONAL WATER RESOURCES SITUATION REPORT FOR FY2015/2016
30TH JULY 2016
RReeppuubblliicc ooff KKeennyyaa
2
FOREWORD
This report outlines the achievements by Water Resources Management Authority
(WRMA) in the management of water resources during the financial year 2015/16. It gives
emphasis to what WRMA has achieved through its effort and in collaboration with
stakeholders in improving water resources management in terms of quantity and quality.
This has been realized through data collection, analysis, planning and studies.
WRMA is continuously improving its data monitoring network in order to avail more
reliable data to planners, designers, users, investors and regulators. This is done through
increased investments into water resources monitoring, infrastructural rehabilitation and
upgrading of existing network.
WRMA has started installing telemetric hydro-met monitoring stations for real time
data collection to reduce the lapses in decision making due to lack of timely data sourcing
and modelling. This will also assist in timely querying of inaccurate data. This is being
achieved through installation of automatic equipment that is using GSM technology on
transmission. The data collected will be displayed in web portals and data centres.
Real time data will also be crucial for setting early warning systems for water related
disasters like floods and droughts. This is a function which WRMA has fully embraced
and piloted in three sub-catchments. This will be taken to the next level in the coming
year.

3
TABLE OF CONTENTS
1 INTRODUCTION ........................................................................................................................ 5
1.1 Overview .............................................................................................................................. 5 1.1 This Report ............................................................................................................................. 7 1.2 Data Availability .................................................................................................................... 7
2 CLIMATE ..................................................................................................................................... 8
2.1 Description of Monitoring Network ......................................................................................... 8 2.2 Improvements to Network .................................................................................................... 10 2.3 Analysis of Rainfall, Evaporation & Climate ....................................................................... 12 2.4 Comments on Special Events ............................................................................................... 16 2.5 Special Studies...................................................................................................................... 16
3 SURFACE WATER RESOURCES .......................................................................................... 17
3.1 Description of Monitoring Network ..................................................................................... 17 3.2 Improvements to Network Infrastructure ............................................................................. 18 3.3 Improvements to Data Quality ............................................................................................. 19 3.4 Assessment of Surface Water Resources .............................................................................. 20
3.4.1 Mean Monthly Flows ................................................................................................... 20 3.4.2 Flow variability ............................................................................................................ 22 3.4.3 Trends for certain stations ............................................................................................ 25
3.5 Comments on Special Events ............................................................................................... 27 3.5.1 Flooding ....................................................................................................................... 27
Lake Victoria North...................................................................................................................... 27 3.5.2 Violation of the Reserve .............................................................................................. 29
3.6 Special Studies...................................................................................................................... 30
4 SURFACE WATER QUALITY ............................................................................................... 31
4.1 Description of Monitoring Network ..................................................................................... 31 Table 1: Surface Water Monitoring Stations ................................................................................ 31 4.3 Improvement to data Quality ................................................................................................ 33 4.4 Assessment of Surface Water Quality .................................................................................. 34 4.5 Comments on Special Events ................................................................................................. 40
5 GROUNDWATER RESOURCES ............................................................................................. 42
5.1. Description of Monitoring Network: .................................................................................... 42 5.3. Assessment of Groundwater .................................................................................................. 46
5.3.1. Water Levels .................................................................................................................. 46 5.3.2 Groundwater Quality ...................................................................................................... 56
5.4. Groundwater Recharge .......................................................................................................... 59 5.5. Special Events ....................................................................................................................... 59 5.6. Special Studies ...................................................................................................................... 59
5.3.3 Groundwater Assessment – RVCA ................................................................................ 62 5.3.4 Groundwater Assessment in ACA ............................................................................... 62
6 WATER USE .............................................................................................................................. 63
6.1 Permits .................................................................................................................................... 63 6.1.1Number of Permits issued ................................................................................................ 63 6.1.2 Type of permits issued ................................................................................................. 63
4
6.2 Water Use ............................................................................................................................... 63 6.2.1 PDB Reports ................................................................................................................... 63 6.2.2 Monthly water use .......................................................................................................... 67 6.2.3 Water use by permit category ......................................................................................... 68
6.3 Special Studies ....................................................................................................................... 68
7 EMERGING ISSUES................................................................................................................. 69
8 CONCLUSIONS ........................................................................................................................... 70
9 RECOMMENDATIONS ............................................................................................................. 71
10 ANNEXES ................................................................................................................................... 72
Annex 1 Categories of Monitoring Stations under the Regional CMS 72 Annex 2: CMS SURFACE WATER MONITORING STATIONS ............................................. 73 ANNEX 3 Instrumentation of Monitoring Boreholes ................................................................... 1 Annex 4: LVSCA WQ Data ........................................................................................................... 5 Annex 5: ENNCA WQ Data .......................................................................................................... 5 Annex 6: TCA Long term WQ Data .............................................................................................. 5 Annex 7: Turbidity, RVCA ............................................................................................................ 6 Annex 8: WQ Data for Stations in ACA ........................................................................................ 7 Annex 9: Sediment Loads, LVNCA ............................................................................................... 8
5
1 INTRODUCTION
1.1 Overview
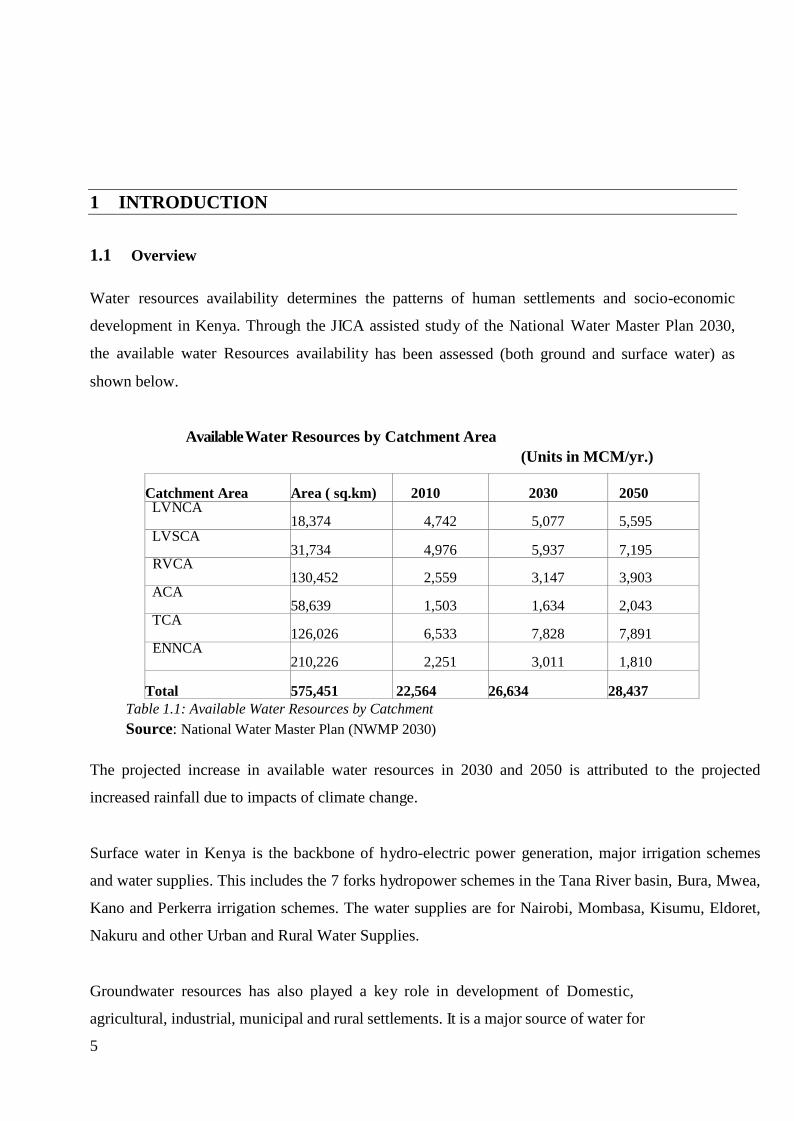
Water resources availability determines the patterns of human settlements and socio-economic
development in Kenya. Through the JICA assisted study of the National Water Master Plan 2030,
the available water Resources availability has been assessed (both ground and surface water) as
shown below.
Available Water Resources by Catchment Area
(Units in MCM/yr.)
Catchment Area
Area ( sq.km)
2010
2030
2050
LVNCA 18,374
4,742
5,077
5,595
LVSCA 31,734
4,976
5,937
7,195
RVCA 130,452
2,559
3,147
3,903
ACA 58,639
1,503
1,634
2,043
TCA 126,026
6,533
7,828
7,891
ENNCA 210,226
2,251
3,011
1,810
Total
575,451
22,564
26,634
28,437
Table 1.1: Available Water Resources by Catchment
Source: National Water Master Plan (NWMP 2030)
The projected increase in available water resources in 2030 and 2050 is attributed to the projected
increased rainfall due to impacts of climate change.
Surface water in Kenya is the backbone of hydro-electric power generation, major irrigation schemes
and water supplies. This includes the 7 forks hydropower schemes in the Tana River basin, Bura, Mwea,
Kano and Perkerra irrigation schemes. The water supplies are for Nairobi, Mombasa, Kisumu, Eldoret,
Nakuru and other Urban and Rural Water Supplies.
Groundwater resources has also played a key role in development of Domestic,
agricultural, industrial, municipal and rural settlements. It is a major source of water for
6
Mombasa, Nakuru and Nairobi. Most of the drinking water supplies especially in the rural arid
areas are sourced from groundwater systems.
The reliability of the water resources for different uses is highly dependent on the
physical and chemical composition. Point and non-point water pollution is a key
challenge in ensuring accessibility of safe water resources in Kenya. Water Resources
Management Authority (WRMA) ensures equitable access to water in right quality and
quantity for the production, environment and basic human needs. In some parts of the
country high levels of dissolved chemicals especially for groundwater makes it
unfavorable for portable water.
Water Resources Management Authority has the mandate to ensure that water resources
are conserved and protected against adverse impacts to ensure the availability in terms of
quality and quantity. Different approaches have been employed to achieve this amongst
them catchment rehabilitation programs, done in partnership with WRUAs though the
implementation of Sub- Catchment Management Plans. Another approach is Effluent
discharge Management of known effluent dischargers through application of effluent
discharge standards. A plan is developed through which an effluent discharger
progressively works towards meeting the standards within a specified timeline and
eventually obtaining an effluent Discharge permit.

7
1.2 This Report
This report outlines the achievements and experiences by WRMA in the management of water
resources during the financial year starting from 1st July 2015 to 30th June 2016
1.3 Data Availability
Hydrological data is usually collected, digitized, stored in the database and analyzed on demand
and used during compilation of water resources reports, decision making in determining applications
for water use among other uses. Every month a copy of regional data base is transmitted to the
national database for archiving and future retrieval. Data available include surface water, water
quality, groundwater and water use. Further, the data is analyzed to guide decision making.
Majority of the customers are served at the regional offices but a few visit the national offices for
data enquiry and advice. The WRMA hydrological year book provides meta data on available data in
WRMA data base for each monitoring station and can be viewed in our website;
The data available at different functional levels:
1. Sub regional office
Groundwater – Water levels
Surface Water – River Water levels, Rainfall, Evaporation
Water Quality, Point effluent discharges, and Pollution – in-situ water quality
measurements
Water use – Abstractions, authorization and permit data
2. Regional office
Groundwater – water levels, aquifer maps, borehole completion records,
Hydro- geological reports, special studies reports
Surface Water Quality and Pollution – in-situ measurements, laboratory analytical
Results, pollution surveys reports, status of water quality, special studies reports
Water- R i v e r water level and discharge, rainfall, evaporation, point/daily Effluent
Discharges, special studies reports
Water use – abstraction survey data, authorizations and permit data, self-assess on periodic
actual water abstractions
3. National office
National Data base containing the above data/reports from all the Regions and sub Region
8
2 CLIMATE
2.1 Description of Monitoring Network
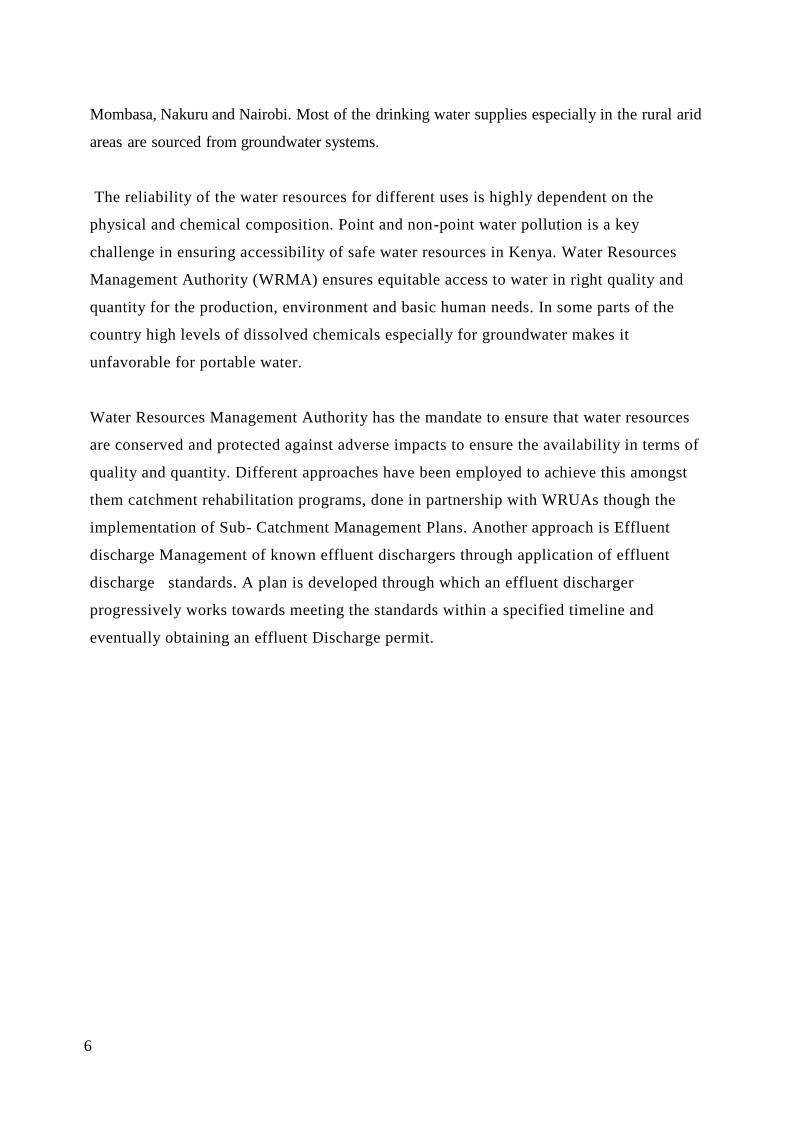
WRMA operates a weather monitoring network comprising of rainfall, evaporation and climate stations.
During the year under review, 166 of 270 rainfall stations were operational, 47 of 65 evaporation stations
were operational and 22 of 32 climate stations were operational.
Weather monitoring Stations
Rainfall No.
Operational
Evaporation No.
Operational
Climate No.
Operational
LVS 58 56 20 20 10 9
LVN 72 22 10 3 5 0
RVCA 22 18 7 6 4 4
Athi 47 28 10 5 2 0
Tana 45 27 14 11 2 0
ENNCA 26 15 4 2 9 9
Total 270 166 65 47 32 22
Table 2.1: Description of weather monitoring network
The weather monitoring stations operated by WRMA are strategically located at various parts in the
catchments. WRMA also obtains data from various stakeholders such as private institutions, government
and learning institutions. The data collected from these stations is used for modelling and planning purposes.
It is also available to the public at a fee.
9
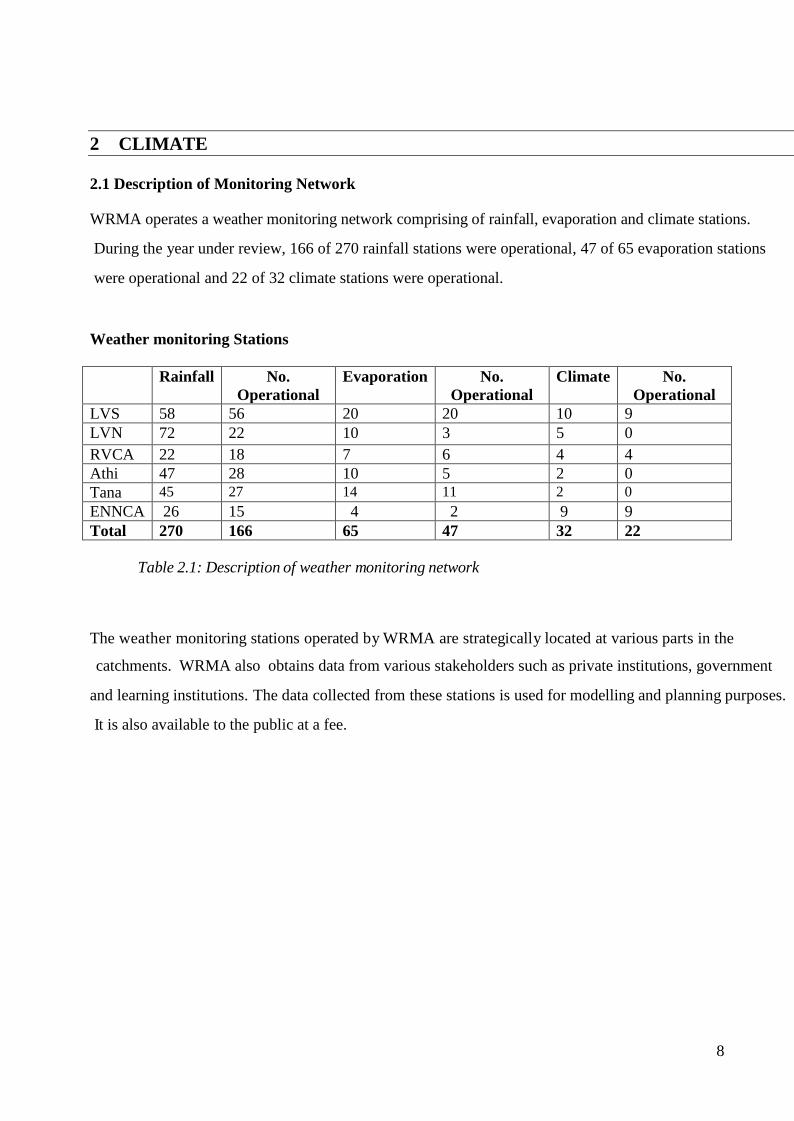
Figure 2.1: Rainfall monitoring network

10
2.2 Improvements to Network
Climatic monitoring frequently experiences losses due to flooding, ageing and vandalism. To
improve on this and maintain the integrity of data collected, WRMA has been regularly maintaining and
improving the monitoring network.
During the year under review, 15 rainfall stations were rehabilitated, 3 evaporation stations and 8
automatic climate station installed together with telemetric River gauging Stations. The RGS with
climate stations are 1GD03 Nyando, 1JG04 Sondu, 1KB05 Gucha Migori, RGS 1LA04 Mara,
3AH13 Sabaki, 4G01 Garissa and ----Njoro.
Rehabilitation of stations was carried out as follows:
LVSCA, at Bomet water supply, Mara WRUA mulot, Governors camp, Mpata, Olerai,
Ololaimutia, Talek gate, Keekorok lodge, Sekenani gate, Lemek, Nairotia, and Nyangores
forest.
In LVNCA, one rainfall station was installed at chesoni and onother relocated from new
bungoma to Chebosi Boys High School.
In RVCA one rainfall station was rehabilitated at Narok Water Supply
In Tana, 3 No. evaporation and 1 rainfall stations were rehabilitated.
In ENNCA, Middle Ewaso Ng’iro Sub Regional office got into an arrangement with Uhuru
Flowers located in the upper part of the sub region to be sharing rainfall and climatic data from
their station. The farm is to provide daily rainfall, temperature and humidity data.
Below are photographs of some of the installations.

11
Figure 2.2 Site preparation and fencing at Chebosi H. School Bungoma , Rain-gauge setting and sensitisation
of teacher
Tana region Office Sub-Met Station
Removal of pan Filling with water after rehabilitation
Figure 2.3: Rehabilitation of Tana office Sub-met station
SAGANA FISH FARM 9037096
Before Empting the Sagana water pan
Station During maintenance
Station After installing
Figure 2.4: rehabilitation of sagana water pan

12
2.3 Analysis of Rainfall, Evaporation & Climate
A comparative analysis of rainfall received from some of the rainfall monitoring stations during the
year under review is as shown below;
Athi Stations
Figure 2.5 Kieni Forest rainfall trend
Figure 2.6 Machakos Water Yard rainfall trend

13
ENNCA Stations
Nanyuki Sub Met Station
Figure 2.7 Nanyuki monthly rainfall for 2015/16
The data for the months of November 2015 and March 2015 were missing. However, the available
data showed that the months of August 2015 and February 2016 received the lowest rainfall of 42mm
while high rainfall of 160.3mm was recorded in October 2015. The long rain and short rain periods
received moderate rainfall.
Lake Victoria North Catchment Rainfall Trend
KEY
Series 1: Rainfall data for FY 20152016 Series 2: Rainfall data for FY 2014/2015 Figure 2.6 Kitale DWO rainfall comparison for 2 years

14
In Kitale the year under review experienced more rainfall than the previous year during long rains of
March to April. In the first half of the year the rains were less.
Rift Valley Catchment Rainfall trends
0
50
100
150
200
250
300
Jul-
15
Au
g-1
5
Sep
-15
Oct
-15
No
v-1
5
De
c-1
5
Jan
-16
Feb
-16
Mar
-16
Ap
r-1
6
May
-16
Jun
-16
Rai
nfa
ll (m
m/m
on
th)
Months
Rainfall stations
Naivasha DCs
Naivasha Yatch club
Engineer
WDD
Figure 2.7: Yearly rainfall comparison for 4 stations in Naivasha
In the Naivasha DC (9036002) Station, there was lower rainfall at the beginning of 2015 as compared
to 2016 the same period. However the rains subsided in February 2016 while in the same period in
2015, the rains continued. Most of the stations recorded high rainfall in the months of November and
December.
Tana Catchment Rainfall trends
Figure 2.8: Tana Region office rainfall comparison for 2 years

15
The highest rainfall occurred in quarter 2 at Embu Region rainfall station. Overall the year under
review recorded more rainfall than the previous year.
Figure 2.9 Tana region office evaporation comparison for 2 years
Evaporation at the Regional Office station indicates that the highest rainfall amounts occurred in
Quarter 2. Evaporation amounts during the report period were lower than similar period the previous
year.
Figure 2.10 DWO Muranga comparative quarterly rainfall for 4 years
During the report period, the highest rainfall amounts occurred in the 2nd quarter at Muranga whereas
the year 2012/2013 recorded the highest rainfall for quarter 4.
Lake Victoria South Catchment Area Rainfall comparison

16
The first quarter of the year experienced dry weather but the situation changed when the expected
elnino rains arrived in the month of November which continued to early January 2016. Again in the
season of the long rains, the catchment received medium to high rainfall. This implies that there was
enough water in the Rivers, pans and other storage facilities that satisfied the requirements for all
uses.
2.4 Comments on Special Events
No Extreme Events were recorded during the year under review
2.5 Special Studies
No studies were undertaken during the year under review.
17
3 SURFACE WATER RESOURCES
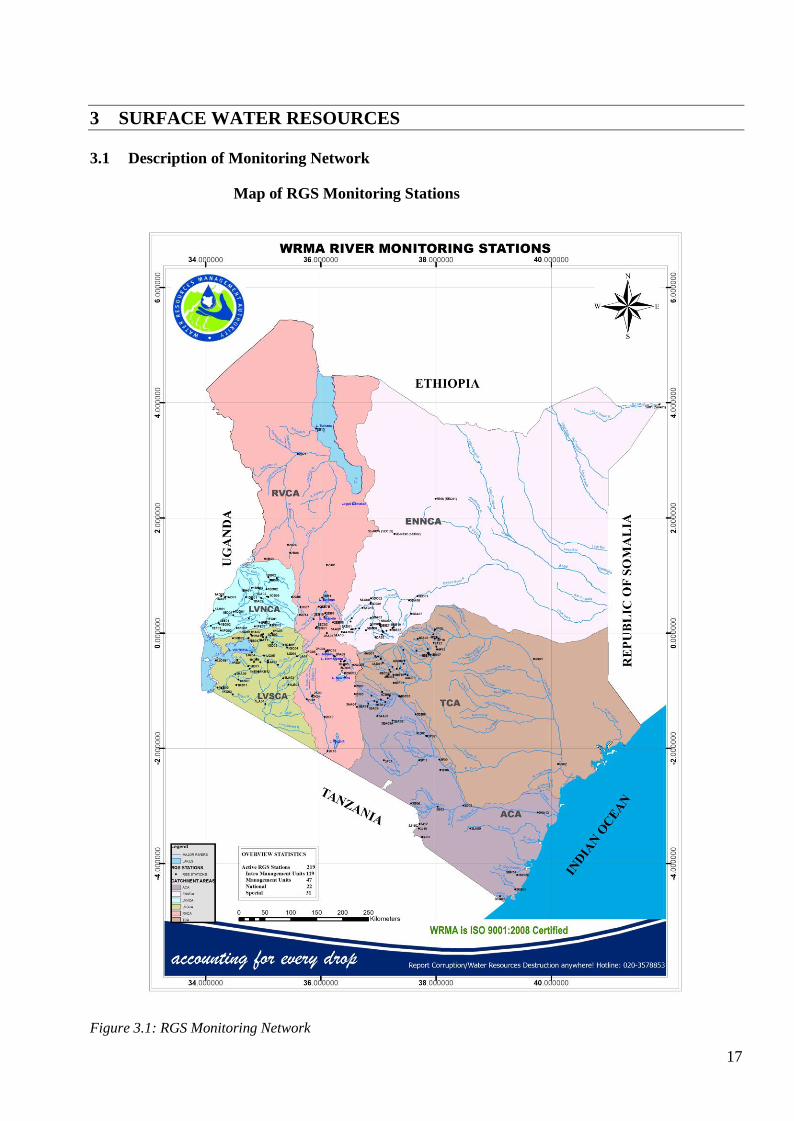
3.1 Description of Monitoring Network
Map of RGS Monitoring Stations
Figure 3.1: RGS Monitoring Network

18
CMS Monitoring Stations
REGION NATIONAL MU INTRA
MU
SPECIAL TOTAL % OPERATIONAL
LVN 5 6 10 7 28 75
LVS 5 13 19 1 38 85
RVCA 7 13 21 1 41 50
ACA 3 4 20 3 31 60
TCA 1 7 21 18 47 85
ENNCA 1 5 31 1 38 95
Total 22 48 122 31 223 75
Table 3.1: Monitoring network Categories per Region
3.2 Improvements to Network Infrastructure
During the year under review, 12 RGS were upgraded to telemetric status, nine (9) stations
rehabilitated and nine installed.
Automation of RGS 4G01 – Tana at Garissa
The Station Before Installation During Installation Completed Work
Figure 3.2:Installation work at RGS 4G01Tana River

19
Figure 3.3: Rehabilitation works of Yala at Bondo Station (1FG02) in LVSCA
Figure 3.4: Concrete post installed at Mwache 3 MB02 and Gauge reader being trained reading in Athi
Catchment.
3.3 Improvements to Data Quality
The availability of automatic equipment which log on hourly basis has ensured that all events are
captured in the upgraded stations mentioned earlier. However, this can only be sustained if the
stations are visited regularly and the batteries changed promptly to avoid losing data.
Gauging campaign is done to validate and improve rating equations. The gauging plan for the regions
entails sustained discharge measurement at the newly installed or rehabilitated stations in order to
develop and/or improve the rating curves. This was done quarterly by the Regions but the data needs
to be entered in the database for updating of the rating curves.
During the year under review, Tana catchment updated rating equations for 14 stations as follows:
20
Updated rating curves for 2015/16
S/N Station ID Station Name
1 4AD04 Gura
2 4BD06 South Mathioya
3 4BD07 North Mathioya
4 4BE01 Maragua
5 4BE03 Irati
6 4BE08 Gikigie
7 4BE09 Maragua
8 4BE10 Tana at Rukanga
9 4BF01 Saba Saba
10 4CB05 Thika
11 4DD02 Thiba
12 4F13 Tana at Grand Falls
13 4G01 Tana at Garissa
14 4G02 Tana at Garsen
Table 3.2: Stations with updated rating curve in Tana Catchment
Gauging campaigns
Figure 3.5: Flood flow monitoring by use of ADCP at Chania 4CA03 and Gura 4 AD01 in Tana Catchment
3.4 Assessment of Surface Water Resources
3.4.1 Mean Monthly Flows
ENNCA
Four different sub catchments were analysed in Ewaso Nyiro North and depicted different stream flow
characteristics throughout the year. Teleswani River had the highest flow recorded in the month of January
2016 which contrary to expectations of low because the month is normally dry. This could be attributed to the
rains experienced in the upper reaches at the onset of short rain period which extended to the month of
January.

21
Figure 3.6: Mean monthly flow at RGS 5BE05, Teleswani River
Nanyuki River desplayed a typical trend which conformed to the rainfall trend in the catchment with the
months of October, November and December receiving high flows. This river has has stable flow and does not
dry up at this point. The river flow diminishes downstream due to increased farming activities.
Figure 3.7: Mean monthly flow at RGS 5BE01, Nanyuki River
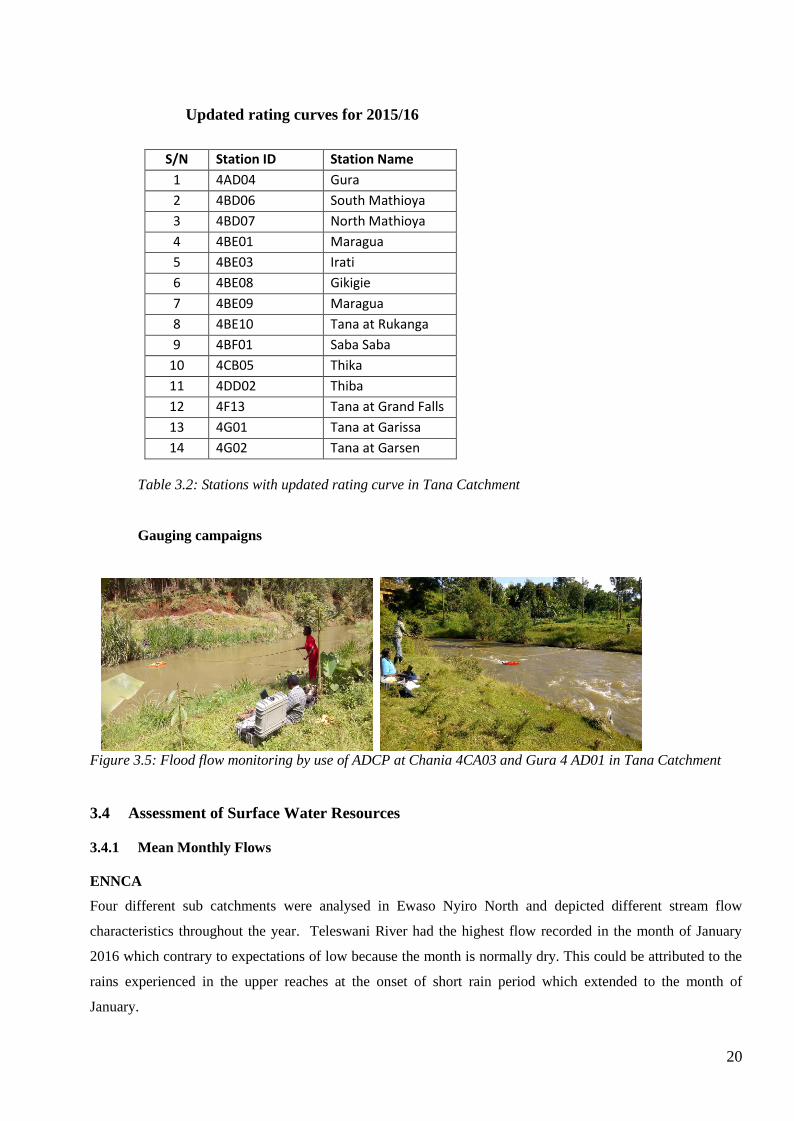
Ontulilii is a small river whose normal flow is normally less than 0.5m3/s. It desplayed similar characteristics
as Nanyuki River with high flows recorded during the OND period. The highest flows were recorded in the
month of November 2015 which had a mean flow of 0.63m3/s.
22
Figure 3.8: Mean monthly flow at RGS 5BE02, Ontulili River
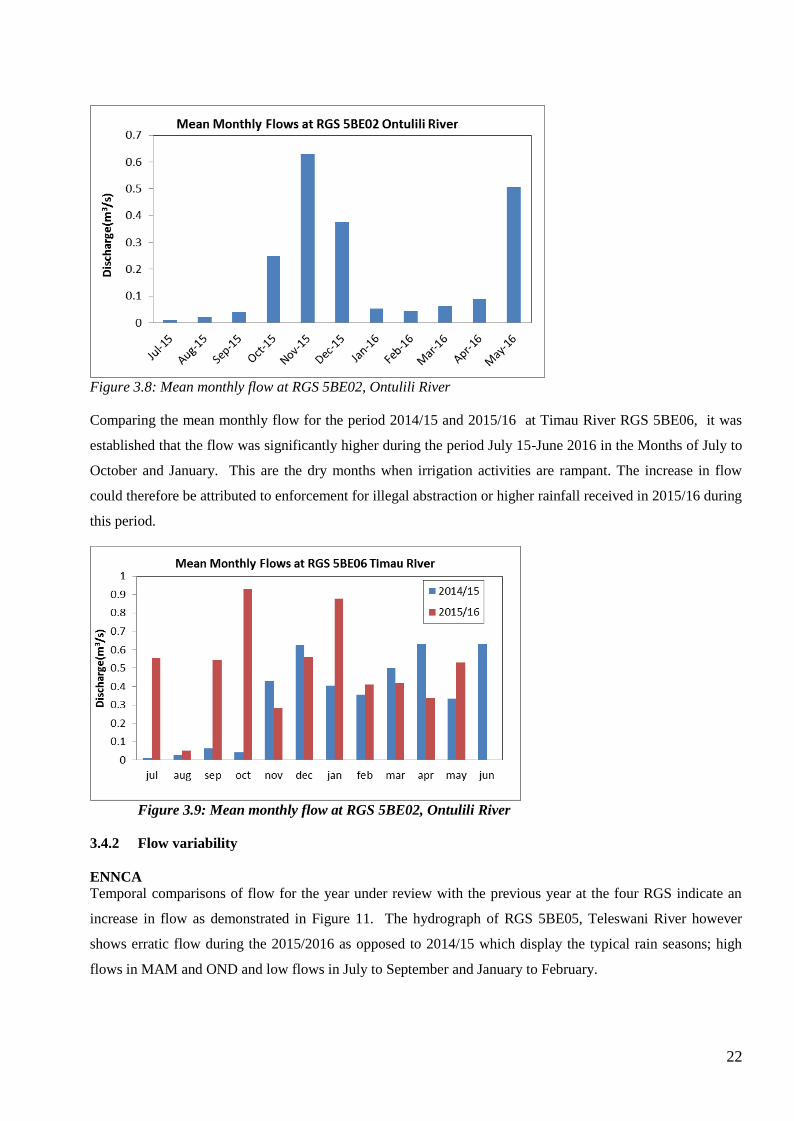
Comparing the mean monthly flow for the period 2014/15 and 2015/16 at Timau River RGS 5BE06, it was
established that the flow was significantly higher during the period July 15-June 2016 in the Months of July to
October and January. This are the dry months when irrigation activities are rampant. The increase in flow
could therefore be attributed to enforcement for illegal abstraction or higher rainfall received in 2015/16 during
this period.
Figure 3.9: Mean monthly flow at RGS 5BE02, Ontulili River
3.4.2 Flow variability
ENNCA
Temporal comparisons of flow for the year under review with the previous year at the four RGS indicate an
increase in flow as demonstrated in Figure 11. The hydrograph of RGS 5BE05, Teleswani River however
shows erratic flow during the 2015/2016 as opposed to 2014/15 which display the typical rain seasons; high
flows in MAM and OND and low flows in July to September and January to February.

23
Figure 3.10: Comparison of flow in 2014/5 and 2015/16 at Timau River
The flow characteristics in Timau, Nanyuki and Ontulili Rivers are shown in Figures 3.7, 3.8 and 3.9
respectively. Whereas the Nanyuki and Ontulili hydrographs depict clear seasonality, Timau flow is
erratic meaning that the flow could be ‘artificial’ and is controlled upstream. The River is susceptible
to over abstraction and violation of the reserve as seen in the months of July to October 2014 and the
same period in 2015 when the flow was almost zero.
Figure 3.10: Flow variability at Timau River RGS 5BE06
24
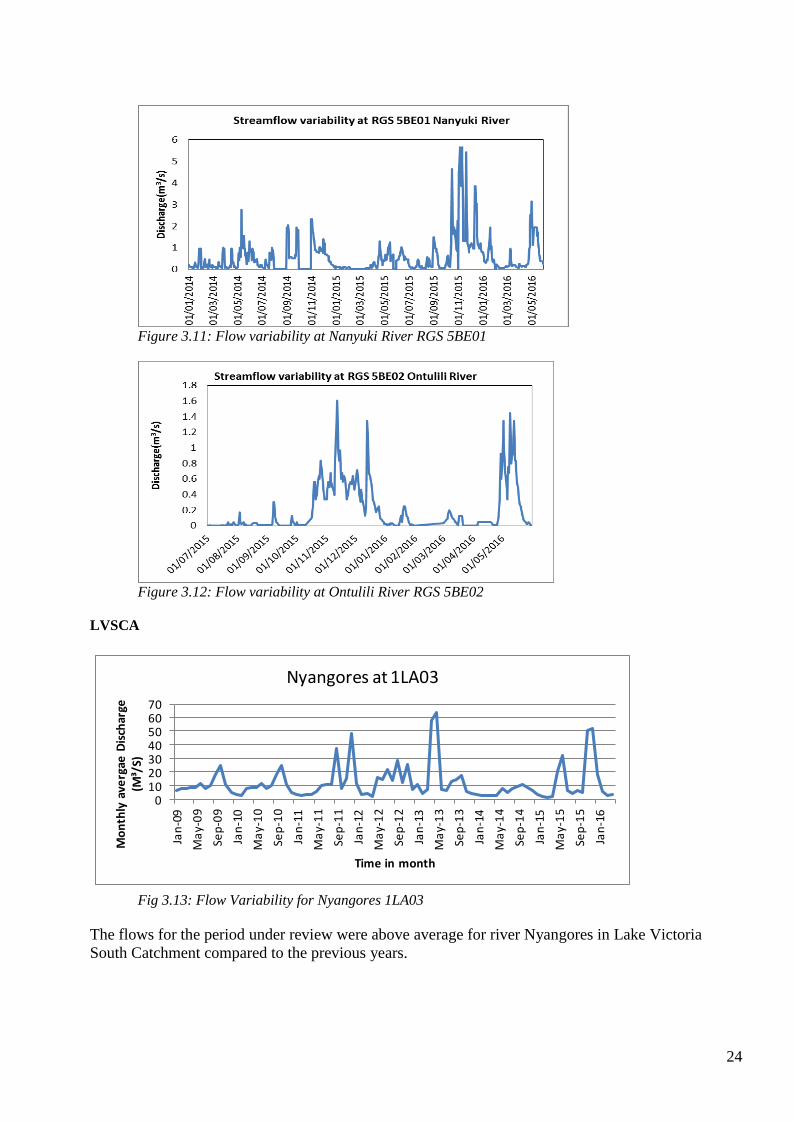
Figure 3.11: Flow variability at Nanyuki River RGS 5BE01
Figure 3.12: Flow variability at Ontulili River RGS 5BE02
LVSCA
010203040506070
Jan
-09
Ma
y-0
9
Sep
-09
Jan
-10
Ma
y-1
0
Sep
-10
Jan
-11
Ma
y-1
1
Sep
-11
Jan
-12
Ma
y-1
2
Sep
-12
Jan
-13
Ma
y-1
3
Sep
-13
Jan
-14
Ma
y-1
4
Sep
-14
Jan
-15
Ma
y-1
5
Sep
-15
Jan
-16
Mo
nth
ly a
verg
ae D
isch
arge
(M
³/S)
Time in month
Nyangores at 1LA03
Fig 3.13: Flow Variability for Nyangores 1LA03
The flows for the period under review were above average for river Nyangores in Lake Victoria
South Catchment compared to the previous years.
25
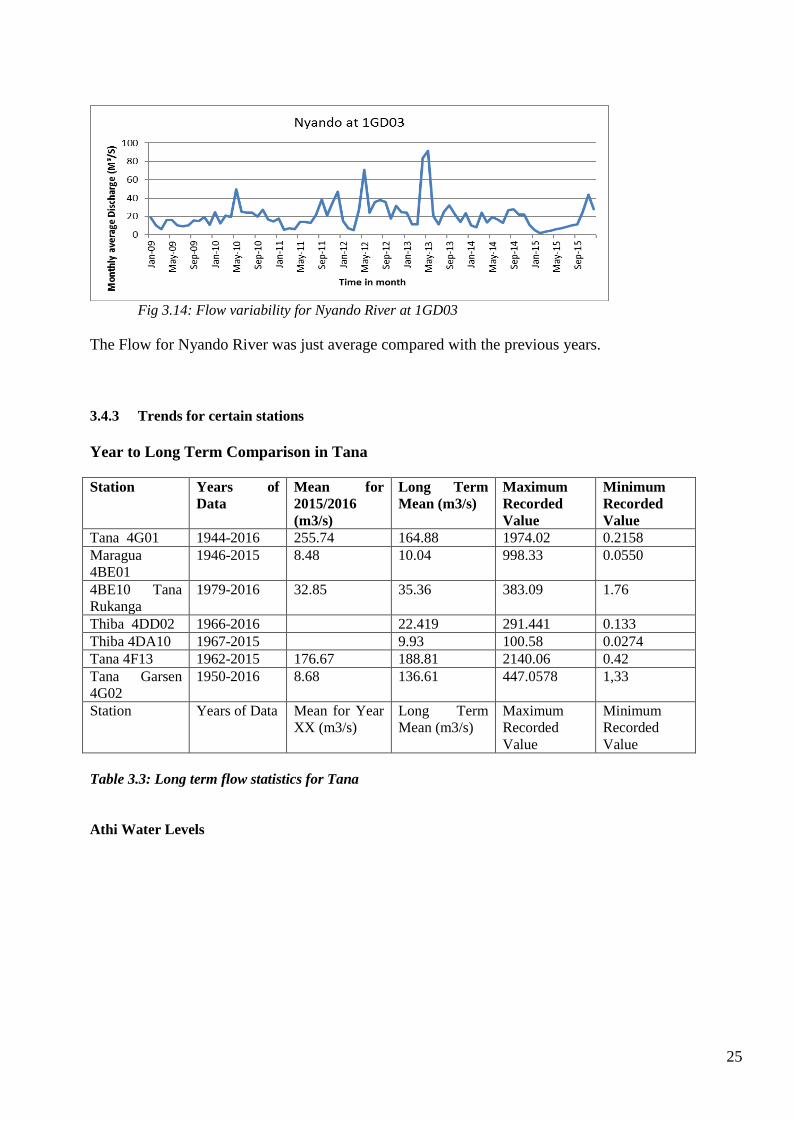
Fig 3.14: Flow variability for Nyando River at 1GD03
The Flow for Nyando River was just average compared with the previous years.
3.4.3 Trends for certain stations
Year to Long Term Comparison in Tana
Station Years of
Data
Mean for
2015/2016
(m3/s)
Long Term
Mean (m3/s)
Maximum
Recorded
Value
Minimum
Recorded
Value
Tana 4G01 1944-2016 255.74 164.88 1974.02 0.2158
Maragua
4BE01
1946-2015 8.48 10.04 998.33 0.0550
4BE10 Tana
Rukanga
1979-2016 32.85 35.36 383.09 1.76
Thiba 4DD02 1966-2016 22.419 291.441 0.133
Thiba 4DA10 1967-2015 9.93 100.58 0.0274
Tana 4F13 1962-2015 176.67 188.81 2140.06 0.42
Tana Garsen
4G02
1950-2016 8.68 136.61 447.0578 1,33
Station Years of Data Mean for Year
XX (m3/s)
Long Term
Mean (m3/s)
Maximum
Recorded
Value
Minimum
Recorded
Value
Table 3.3: Long term flow statistics for Tana
Athi Water Levels

26
Figure 3.15: Water levels for 5 rivers in Athi
The water levels were average during the year under review
4G01 TANA GARISSA- Discharge [m^3/s]
1930 - 39 1940 - 49 1950 - 59 1960 - 69 1970 - 79 1980 - 89 1990 - 99 2000 - 09 2010 - 19
500
1000
1500
Figure 3.16: Long term dicharges at RGS 4G01 – Tana at Garissa
Average dischages were recorded in Tana River at garissa during the year under review.
3.17: Long term discharges at RGS 3BC08- Ruiru at Thika Road Bridge

27
3.5 Comments on Special Events
3.5.1 Flooding
Lake Victoria North
Some flooding experienced in East Yimbo of Bondo Sub County and Sabwani in Trans Nzoia County (Yala
and Sabwani Rivers) due to heavy downpour on the upper catchments.
Assessment was done on 12th and 13th May 2016. The visited areas were Sikhendu, Kipkorion, Mitua,
Namanjalala, Ngazi and Taito (Mukuyu). The damages caused by flood in the areas are indicted in the table
below.
S/
No
Area date flood
Assessment
Damages
Remarks
1 Sikhendu 12/05/2016 -Approximately 80 acres of
maize destroyed
-Two temporal bridges
washed away
Flood depth
estimated at 1 metre
2 Kipkorion 12/05/2016 -Approximately 20 acres of
maize destroyed
-One temporal bridge
washed away
Flood depth
estimated at 0.5
metre
3 Mitua 12/05/2016 -Approximately 100 acres of
maize destroyed
Flood depth
estimated at 1 metre
4 Maliki 12/05/2016 -Approximately 150 acres of
maize destroyed
Flood depth
estimated at 1 metre
5 Ngazi 13/05/2016 -Approximately 30 acres of
maize destroyed
Flood depth
estimated at 1 metre
Taito(Muku
yu)
13/05/2016 -Approximately 150 acres of
maize destroyed
Flood depth
estimated at 1 metre
Table 3.4: Flood Assessment in LVNCA
Figure 3.18: Backwater flow from Yala River around Aduwa area in Bondo Sub County on 12/5/2016.

28
Figure 3:19: maize farm flooded at Maliki and maize farm flooded at Taito
Flooding in Tana region
Floods were reported in several areas during the April, May rains in Tana Catchment area. The
areas are tabulated in the Table below.
Sub-region County Areas Flooded Cause of floods
Lower Tana Garissa Balambala, Garissa Town, ,
Fafi, Masalani, Mansabubu,
Hara, Kotile, Korisa,
Flash floods due to heavy
rainfall on the upper areas of
Tana and spilling of
Kiambere Dam
Tana River Hola ,Wenje ,Garsen ,Tana
Delta
Bursting of Tana river banks
Lamu Areas around Lake Kenyatta,
Panda Nguo, Witu
Bursting of Tana River banks
Upper Tana Muranga Gakira area in Kigumo sub
county
Heavy rainfall experienced
causing landslides
Kathita-Mutonga Meru Maua Heavy rainfall causing floods
in areas which were wetlands
and has no outlet
Thiba Kirinyaga Kagio police station bridge,
Rwamuthambi bridge
Heavy rainfall causing floods
Table 3.5: Flooded areas in Tana Catchment
Flood area around Garissa Show Grounds on 3rd
May 2016
Residents of Widsor area salvaging their
properties from floods
29
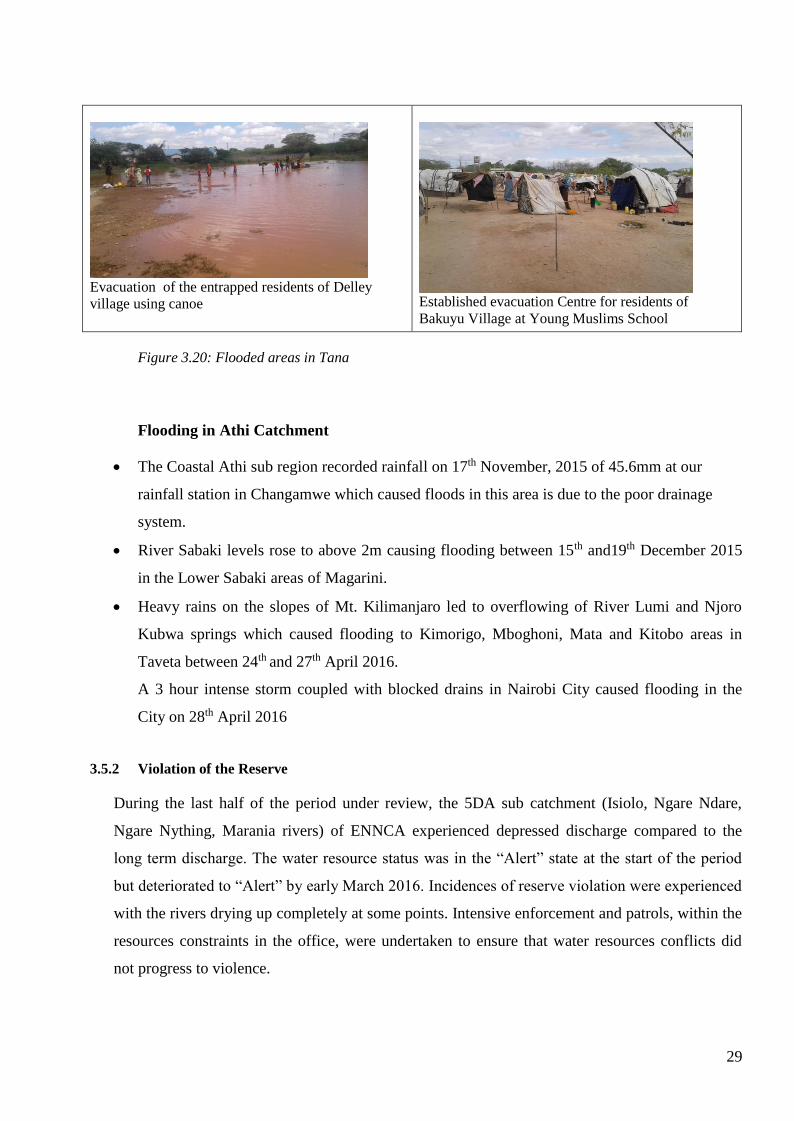
Evacuation of the entrapped residents of Delley
village using canoe
Established evacuation Centre for residents of
Bakuyu Village at Young Muslims School
Figure 3.20: Flooded areas in Tana
Flooding in Athi Catchment
The Coastal Athi sub region recorded rainfall on 17th November, 2015 of 45.6mm at our
rainfall station in Changamwe which caused floods in this area is due to the poor drainage
system.
River Sabaki levels rose to above 2m causing flooding between 15th and19th December 2015
in the Lower Sabaki areas of Magarini.
Heavy rains on the slopes of Mt. Kilimanjaro led to overflowing of River Lumi and Njoro
Kubwa springs which caused flooding to Kimorigo, Mboghoni, Mata and Kitobo areas in
Taveta between 24th and 27th April 2016.
A 3 hour intense storm coupled with blocked drains in Nairobi City caused flooding in the
City on 28th April 2016
3.5.2 Violation of the Reserve
During the last half of the period under review, the 5DA sub catchment (Isiolo, Ngare Ndare,
Ngare Nything, Marania rivers) of ENNCA experienced depressed discharge compared to the
long term discharge. The water resource status was in the “Alert” state at the start of the period
but deteriorated to “Alert” by early March 2016. Incidences of reserve violation were experienced
with the rivers drying up completely at some points. Intensive enforcement and patrols, within the
resources constraints in the office, were undertaken to ensure that water resources conflicts did
not progress to violence.
30
3.6 Special Studies
LVNCA
There was a special study carried out on the sediment load monitoring for Kuywa/Terem River
System under Western Kenya Community Driven Development and Flood Mitigation Project
(WKCDD/FM).
The objective of sediment loads monitoring is therefore to evaluate the effectiveness of investments
in sustainable land use practices on sediment loads in the catchment and percentage annual reduction
in the sediment load in the rivers within the targeted micro catchment.
WRMA has established 20 monitoring stations (mostly miscellaneous) for the programme with an
aim of monitoring the impacts of interventions on the reduction of sediment loads. The interventions
are undertaken at prioritized micro-catchments through adoption of appropriate soil and water
conservation practices in the Nzoia Basin. Most of the projects are implemented in Kuywa, Sosio and
Terem/Emia micro-catchments. The study has been going on since 2008 but with an interruption in
between when the project was temporarily stopped and finally ended by end of March, 2016. (See chapter 4.6)
Tana
Water Resources Assessment Programme (WRAP) for Garissa County was on going during the
report period. The consultant has submitted the final report which was yet to be disseminated to the
stakeholders. The programme involved assessment of Surface and ground water resources in Garissa
County in terms of quantity and quality, and also pollution survey. The data collection and
transmission was done through the open Data Kit (ODK) and hard copies of the data being retained.

31
4 SURFACE WATER QUALITY
Water quality is the chemical, physical, and biological characteristics of water. It is influenced by a
number of factors mainly natural and anthropogenic activities. Some of the factors affecting water
quality in the region include waste discharges from municipal and industrial sources, agrochemical
(fertilizer and pesticide) residues from farms, surface run off containing pollutants from urban areas
and market centers, and sediments mainly via erosion of roads, farms and degraded catchments.
Changes in land use patterns including urban development, informal settlements and atmospheric
fallout also affect water quality.
4.1 Description of Monitoring Network
Table 4.1 shows the number of surface water quality monitoring stations per region in the country.
The network consists of 252 stations, 79.67 % of which are currently operational. LVNCA has an
extra 22No miscellaneous stations whose purpose is to monitor sediment load for Kuywa River Sub-
catchment. Figure 1 shows spatial distribution of the Monitoring Network for surface water quality
nationally.
Table 1: Surface Water Monitoring Stations
Region National MU Intra-MU Special Total % Operational
ACA 3 5 20 3 31 79
LVN 5 10 19 2 36 100
LVS 5 14 26 2 47 85
ENNCA 1 5 30 4 40 90
TCA 1 39 9 7 56 67
RVCA 7 13 21 1 42 57
Total 252 79.67
32
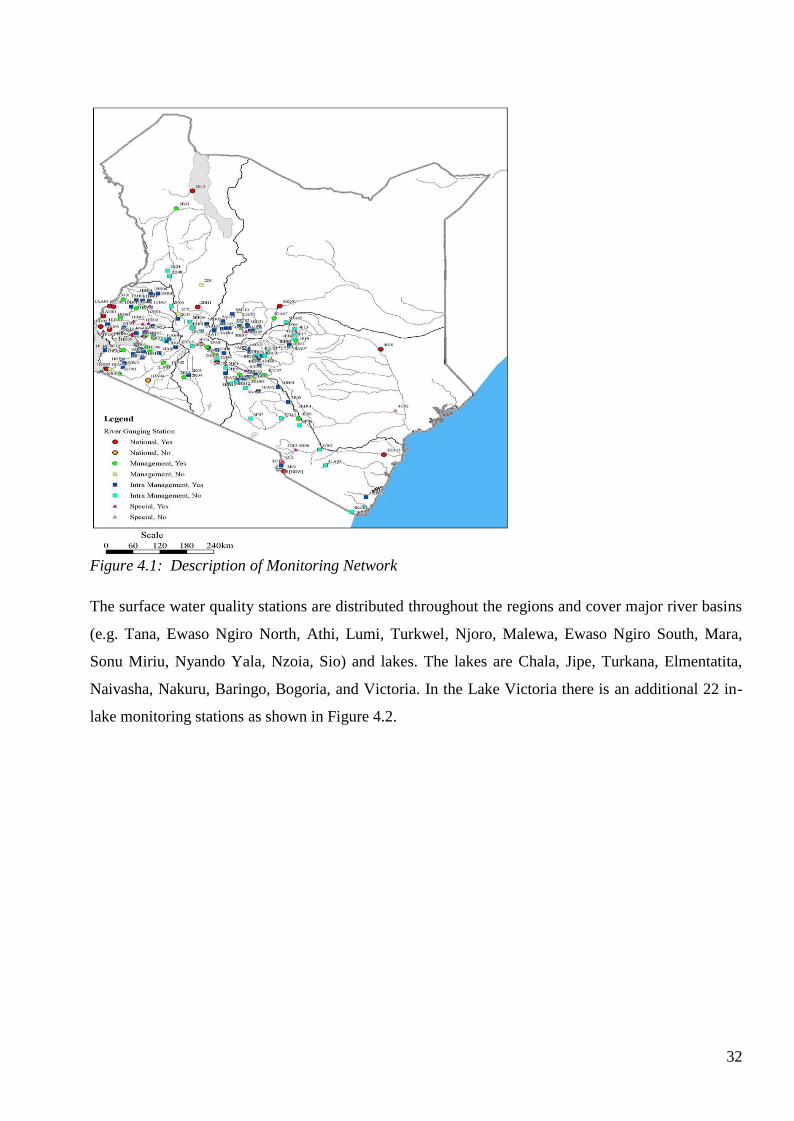
Figure 4.1: Description of Monitoring Network
The surface water quality stations are distributed throughout the regions and cover major river basins
(e.g. Tana, Ewaso Ngiro North, Athi, Lumi, Turkwel, Njoro, Malewa, Ewaso Ngiro South, Mara,
Sonu Miriu, Nyando Yala, Nzoia, Sio) and lakes. The lakes are Chala, Jipe, Turkana, Elmentatita,
Naivasha, Nakuru, Baringo, Bogoria, and Victoria. In the Lake Victoria there is an additional 22 in-
lake monitoring stations as shown in Figure 4.2.

33
Figure 4.2 In-lake Monitoring stations
Note: KL=Kenya Littoral (shallow water station) mainly in Winam Gulf
KP=Kenya Pelagic (deep water station) in the open lake.
Monitoring of the impacts of point source pollution is undertaken on the final treated effluent, and in
the receiving water 500m upstream and downstream of discharge points.
4.2 Improvements to Network Infrastructure
In LVSCA two stations were automated, 1LB02 at Nyangores and Amala at Longisa Water Supply
(Mara basin). The purpose was to monitor water Quality for real time data. In the same region
rehabilitation was done to monitoring stations 1IG04 at Talek, Sondu Miriu River and 1GD03,
Nyando River and 1KB05, Gucha-Migori River. In TCA, six new stations were established namely;
Rundu at Kagumo Bridge, Rwamuthambi at Kabonge Riakianja Bridge, Murubara at Ahiti Domba
Bridge, Thiba at Ndindiruku Bridge, Murubara at Gathigiriri Prison Bridge and Mururi stream at
Embu-Mwea Highway.
No improvements to the monitoring network infrastructures were done in ENNCA, RVCA, LVNCA
and ACA.
4.3 Improvement to data Quality
33 Water Quality & Pollution Control staff underwent two day training, in two groups, on the use of
water quality field equipment and sampling techniques held in Naivasha and Mombasa respectively.
The training was aimed at enhancing skills with the goal of improving data quality.

34
The Regional Laboratories participated in the QC/QA programme organized by the Central Water
testing Laboratory, Nairobi where referenced similar materials were sent to various WRMA
Laboratories for analysis and comparisons of the generated data.
Kakamega Laboratory, LVNCA underwent rehabilitation with the support of GIZ in which fume
extractors were installed in the the fume cupboard. This has enhanced the number of parameters
which can be analysed and has also created a good working environment in the Laboratory. LVNCA
also received sampling bottles, chemicals, reagents and protective materials to support abstraction
and pollution surveys for R. Kimondi and Siyonga sub catchments from the Kenya Water Security
and Climate Resilience Program. WRMA HQs procured assorted chemicals for the Regional Labs
during the year under review.
LVEMP new Laboratory situated at Lake Victoria South Water Services Board (LVSWSB) premises
was handed over to WRMA, Kisumu regional Office. This has greatly expanded analytical services
and increased the number of parameters to be analyzed.
4.4 Assessment of Surface Water Quality
Water Quality assessment was undertaken for Regular Gauging Stations (RGS) countrywide. This
involved sampling and in-situ measurements but on a limited scale due to logistical constraints. The
common water quality parameters measured were: Temperature, pH, Electrical conductivity,
turbidity, total suspended solids and Nitrates. LVSCA and LVNCA are able to analyze nutrient
parameters i.e. Total Nitrogen and Total Phosphorous (TN & TP). Figure 3 to Figure 11 below show
trends of some parameters at various monitoring stations. Long term data for National stations and
Management Units are shown in the Annexes. Lakes were not monitored although there are stations
established. Lake Victoria stations have not been monitored for 4 years.
4.4.1 Lake Victoria (South) Water Quality
LVSCA was not able to undertake in-lake water quality monitoring during the year under review due
to lack of funds. Monitoring of the Lake Victoria beaches was undertaken at five stations namely,
Usenge Beach, Wich Lum Beach, Misori Beach, Luanda Kotieno Beach and Asembo Bay Beach
(Table 2).

35
Physico-Chemical parameters at Lake Victoria Beaches
Name of Beach pH DO Turbidity Ec TP TSS Salinity
Usenge Beach 7.2 4.4 27.5 119 0.12 3 0.05
Wich Lum Beach 7.7 6.8 32.3 120 0.45 2 0.05
Misori Beach 7.0 5.2 30.7 130 0.11 3 0.06
Luanda Kotieno Beach 7.6 7.9 44.7 142 0.43 18 0.06
Asembo Bay Beach 8.5 8.2 107.0 163 0.59 40 0.07
Table 2: Physico-chemical Parameters at Lake Victoria Beaches
Figure 4.3: Water turbidity at beaches in Lake Victoria (quarterly data)
All the beaches showed higher turbidity in quarter 3 compared to quarters 1 and 2. No assessment
was done in quarter 4. The turbidity could be influenced by the dominant wind at the time of
determination. In the afternoon, there is a strong wind from the Lake onto land and this creates a high
turbulent at the beaches. The turbulences stir up both the settled and suspended sediments at the
beaches and also drift the algae blooms to the shore causing high turbidity at the beaches. There is
also the impact of rotten vegetation at the beaches. All this coupled together may cause a significant
impact on turbidity. The scenario may change in the evening or morning when it’s calm.
4.4.2 Tana River Water Quality

36
Water Quality Parameter Trends for 4G01
Figure 4.4: Conductivity, Turbidity and pH of River Tana at Garissa (RGS 4G01)
The higher Turbidity was noticeable in the wet months of April. May and November. This may be
due to erosion via runoff in the Upper Tana catchment attributed to degradation of the catchment. The
pH and conductivity remained unchanged indicating that there were no major high mineral inputs.
There is no data for lower Tana where the situation may be different.
4.4.3 Water Quality of Ewaso Nyiro North River
ENNCA did not assess water quality of Ewaso Ngiro River at Archer’s post (5ED01) which is the
national station and Isiolo River at 5DA07. The stations have not been monitored since June 2014 due
to challenges with facilitation.
Figure 5 shows the electrical conductivity of Ewaso Ng’iro River at 5BC04, Depatas (Laikipia). The
station monitors part of Abadare and part of Mt. Kenya areas. Irregular monitoring results in data
gaps that making it impossible to discern trends.

37
Figure 4.5: Ewaso Ng’iro River at 5BC04, Depatas in Laikipia - Conductitvity
Nanyuki River at 5BE20 monitors waters from Mt. Kenya area. Figure 6 shows conductivity trends in
the river. Seasonal variations with higher values in the wet season are expected due to runoof laded
with agrochemicals from farm lands.
Figure 4.6: Conductivity of Nanyuki River at 5BE20
4.4.4 Water quality of the Rift Valley water resources
The Perkerra and Kerio rivers were monitored for total suspended solids that were found to be
generally high. The catchment are in need of conservation both on farm and off-farm.

38
Figure 4.7: Total suspended solids in Kerio River (2FC7)
Other station data eg. Lakes Elementaita, and Baringo were not updated during the reporting year.
4.4.5 Water Quality of Lake Victoria North Rivers
During the year under review Electrical Conductivity ranged from 50 µS/cm to 270 µS/cm signifying
low mineralised river water in the region (Figure 8). For MU stations Electrical Conductivity ranged
from 62 µS/cm to 71 µS/cm at Kuywa at Matisi and R. Nzoia at Webuye respectively. The range is
however within the acceptable limits for all the water uses. For National stations, the highest value
was recorded at R. Malakisi at 148 µS while lowest was at R. Yala at Bondo bridge at 87 µS. There
were not significant differences.
Figure 4.8: Electrical Conductivity for some Management Unit stations, LVNCA.
Nitrates were monitored in some water bodies. Sources of Nitrates include mainly domestic sewage,
agricultural run-off and agro-industrial effluents. Excessive nitrates in surface waters usually
39
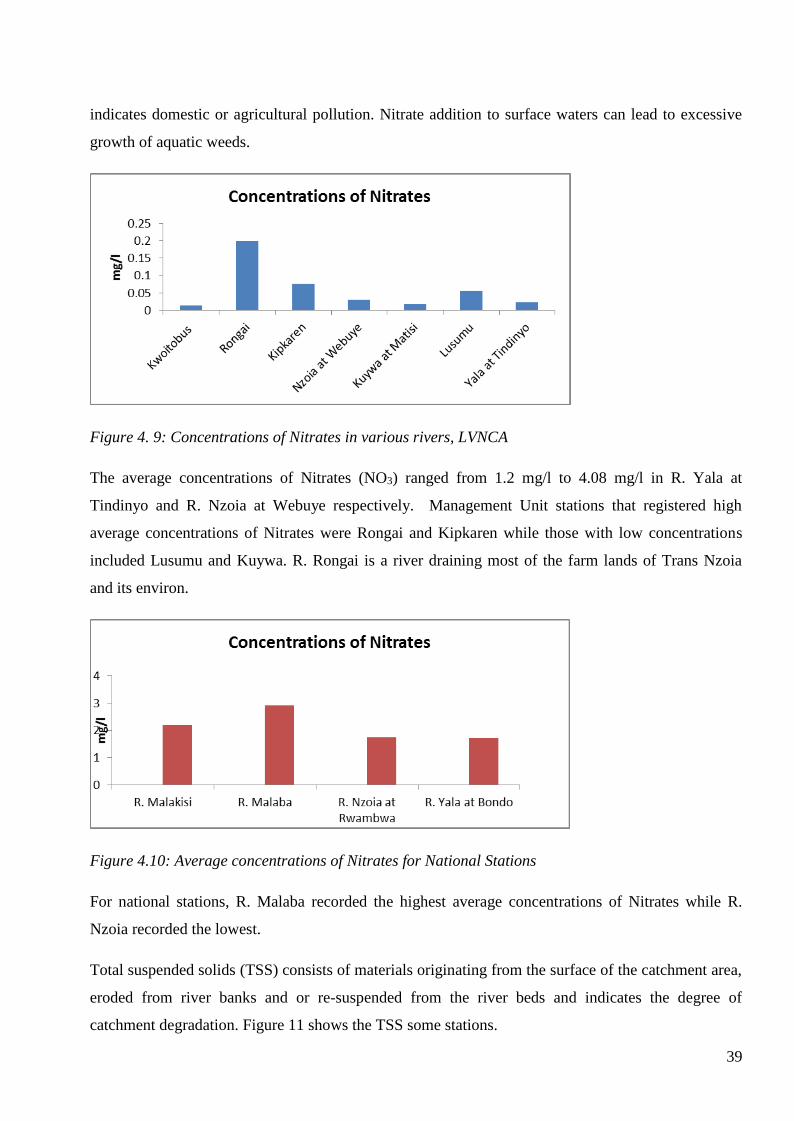
indicates domestic or agricultural pollution. Nitrate addition to surface waters can lead to excessive
growth of aquatic weeds.
Figure 4. 9: Concentrations of Nitrates in various rivers, LVNCA
The average concentrations of Nitrates (NO3) ranged from 1.2 mg/l to 4.08 mg/l in R. Yala at
Tindinyo and R. Nzoia at Webuye respectively. Management Unit stations that registered high
average concentrations of Nitrates were Rongai and Kipkaren while those with low concentrations
included Lusumu and Kuywa. R. Rongai is a river draining most of the farm lands of Trans Nzoia
and its environ.
Figure 4.10: Average concentrations of Nitrates for National Stations
For national stations, R. Malaba recorded the highest average concentrations of Nitrates while R.
Nzoia recorded the lowest.
Total suspended solids (TSS) consists of materials originating from the surface of the catchment area,
eroded from river banks and or re-suspended from the river beds and indicates the degree of
catchment degradation. Figure 11 shows the TSS some stations.

40
Figure 4.11: Average concentrations of TSS in some rivers in LVNCA
4.5 Comments on Special Events
High sediment loads and turbidity were reported in Tana River at Garissa bridge station. This could
be due to sediment from the catchment runoff, and the river re-suspension and bank erosion.
Western Kenya Community Driven Development and Flood Management Project
In the Kuywa sub-basin in LVNCA there are 22 special stations established for purposes of
monitoring interventions in catchment restoration. The region undertook two sediment loads
assessments in Kuywa Terem system in September 2015 and February 2016.
The stations exhibited seasonal variations in concentrations of suspended solids, turbidity and
nutrients (Figure 12). The concentrations followed the rainfall patterns but were significantly lower
than baseline data at the start of the monitoring in 2013. During the dry months of January to March,
the rivers had low turbidity hence the water was clear since runoff from the farms was low.

41
Figure 4.12: Comparative sediment Loads in the Kuywa Terem sub-catchmet
The highest sediment load was registered at Kuywa market. Other stations with high sediment loads
were Kibingei and Terem downstream the confluence with Emia at Kopsiro bridge at 7.4 tons/day
and 8.6 tons/day respectively. Comparing the two assessments, in February all the stations recorded
lower loads compared to September except for Kitabani, Kibingei, Kimobo and Chebiyet II. The
largest difference was observed in Kibingei at Daraja Mbili at 2.5 tons/day. The difference could be
as a result of cattle being driven to be watered directly in the river. This may cause the release of the
sediments from the stream banks and beds. No differences were observed at Sossio at source and
Kuywa at Kuywa market. Sossio at source is a reference station situated at the forest and there are
limited human activities despite encroachment into the forest.
Lake Naivasha basin
A PhD student from Twente University in Holland installed pesticide samplers in Lake Naivasha, and
in the middle and upper catchment of Malewa River. This is to investigate the possibility of pollution
by pesticides in water resources especially in the Lake and to identify the possible sources of the
pesticides.
A Master’s degree student from Kenya Marine & Fisheries Research Institute in conjunction with
WRMA, Naivasha Office carried out a research on the Phosphates & Nitrates concentrations in Lake
Naivasha.
42
5 GROUNDWATER RESOURCES
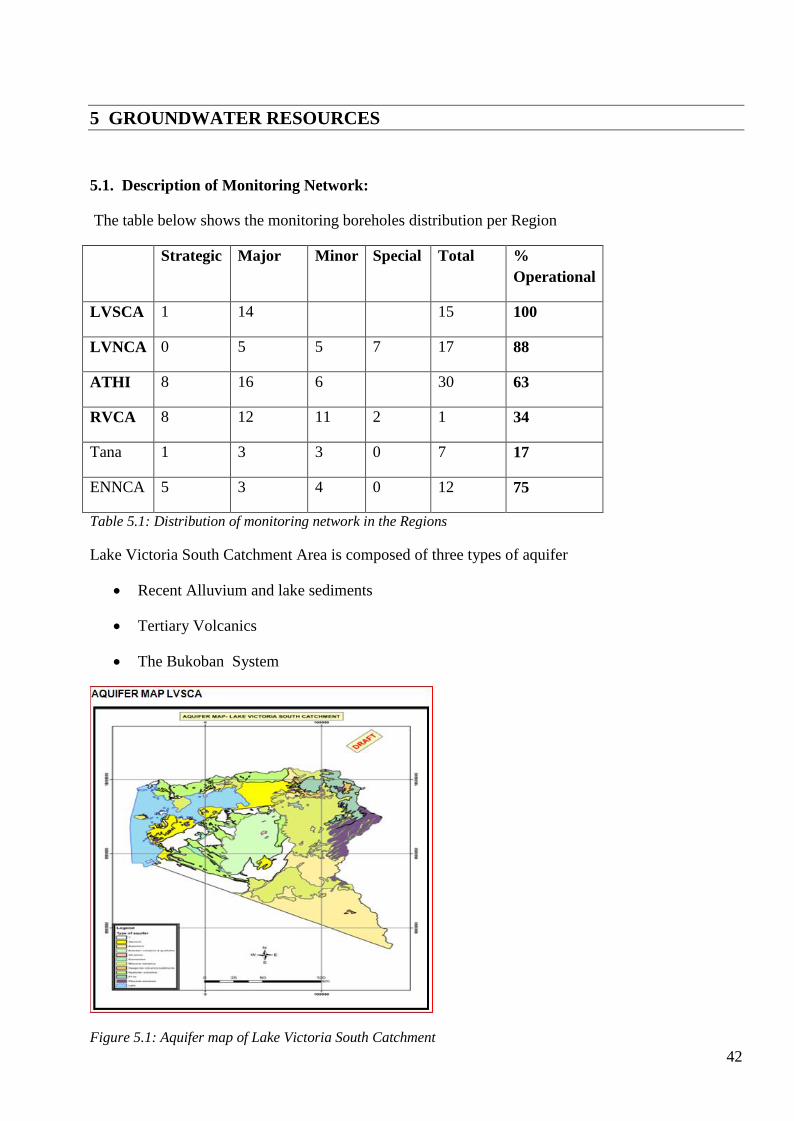
5.1. Description of Monitoring Network:
The table below shows the monitoring boreholes distribution per Region
Strategic Major Minor Special Total %
Operational
LVSCA 1 14 15 100
LVNCA 0 5 5 7 17 88
ATHI 8 16 6 30 63
RVCA 8 12 11 2 1 34
Tana 1 3 3 0 7 17
ENNCA 5 3 4 0 12 75
Table 5.1: Distribution of monitoring network in the Regions
Lake Victoria South Catchment Area is composed of three types of aquifer
Recent Alluvium and lake sediments
Tertiary Volcanics
The Bukoban System
Figure 5.1: Aquifer map of Lake Victoria South Catchment

43
Lake Victoria North Catchment Area is composed of Uasin Gishu Phonolites, Nyanzian Volcanics
and Kavilondian System
Figure 5.2: Aquifer map of Lake Victoria North Catchment
Athi Catchment Area has the Nairobi Suite aquifer system composed of Pleistocene to Miocene
volcanics, chyulu volcanics, Mt Kilimanjaro volcanics, coastal sediments and Precambrian basement
systems
44
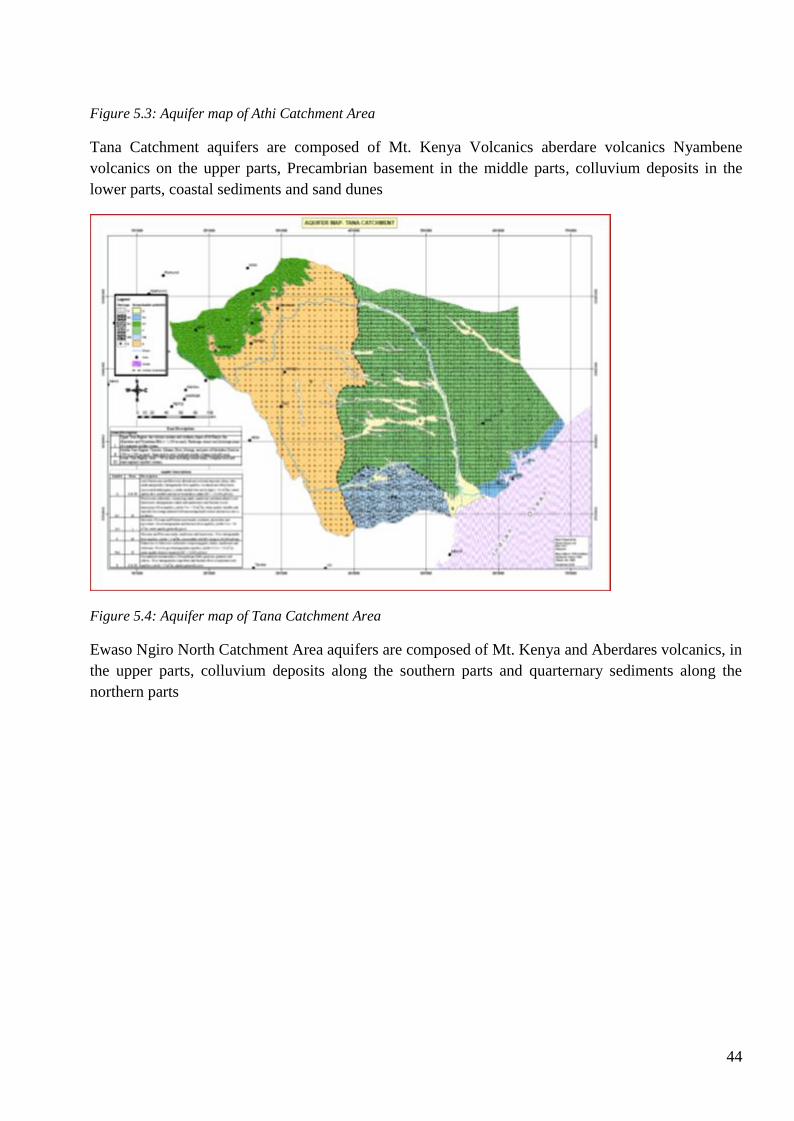
Figure 5.3: Aquifer map of Athi Catchment Area
Tana Catchment aquifers are composed of Mt. Kenya Volcanics aberdare volcanics Nyambene
volcanics on the upper parts, Precambrian basement in the middle parts, colluvium deposits in the
lower parts, coastal sediments and sand dunes
Figure 5.4: Aquifer map of Tana Catchment Area
Ewaso Ngiro North Catchment Area aquifers are composed of Mt. Kenya and Aberdares volcanics, in
the upper parts, colluvium deposits along the southern parts and quarternary sediments along the
northern parts
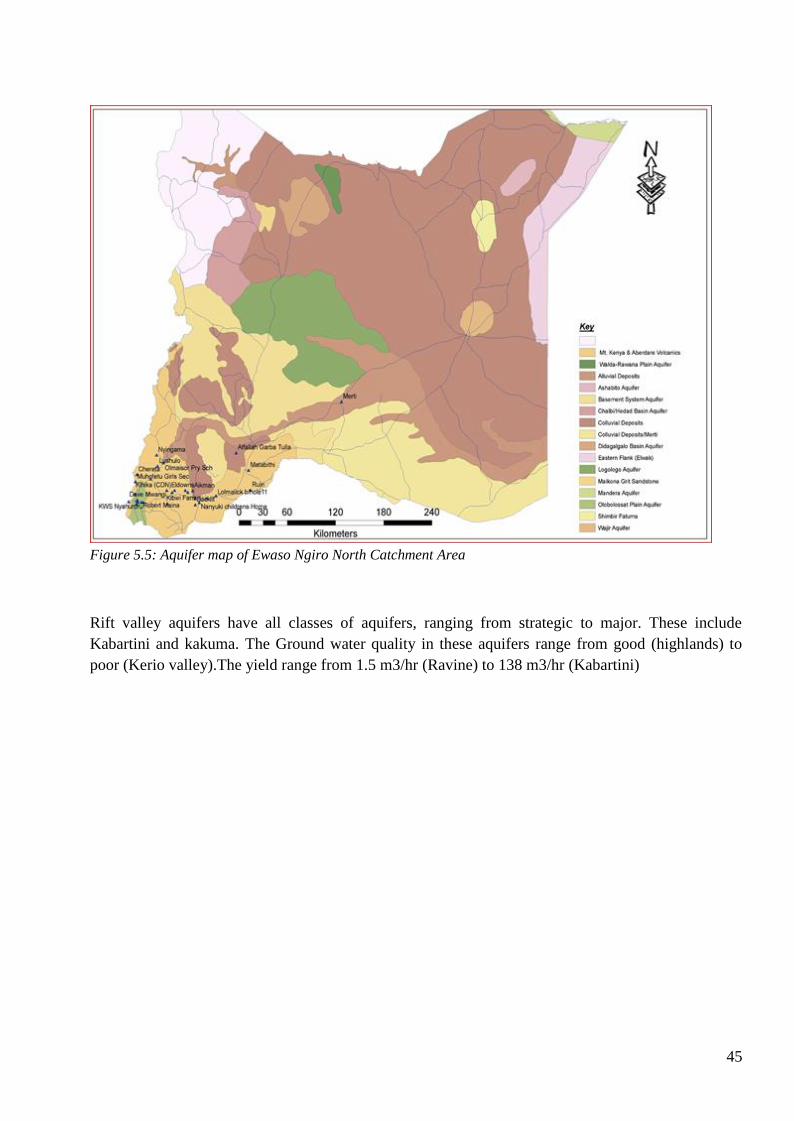
45
Figure 5.5: Aquifer map of Ewaso Ngiro North Catchment Area
Rift valley aquifers have all classes of aquifers, ranging from strategic to major. These include
Kabartini and kakuma. The Ground water quality in these aquifers range from good (highlands) to
poor (Kerio valley).The yield range from 1.5 m3/hr (Ravine) to 138 m3/hr (Kabartini)
46
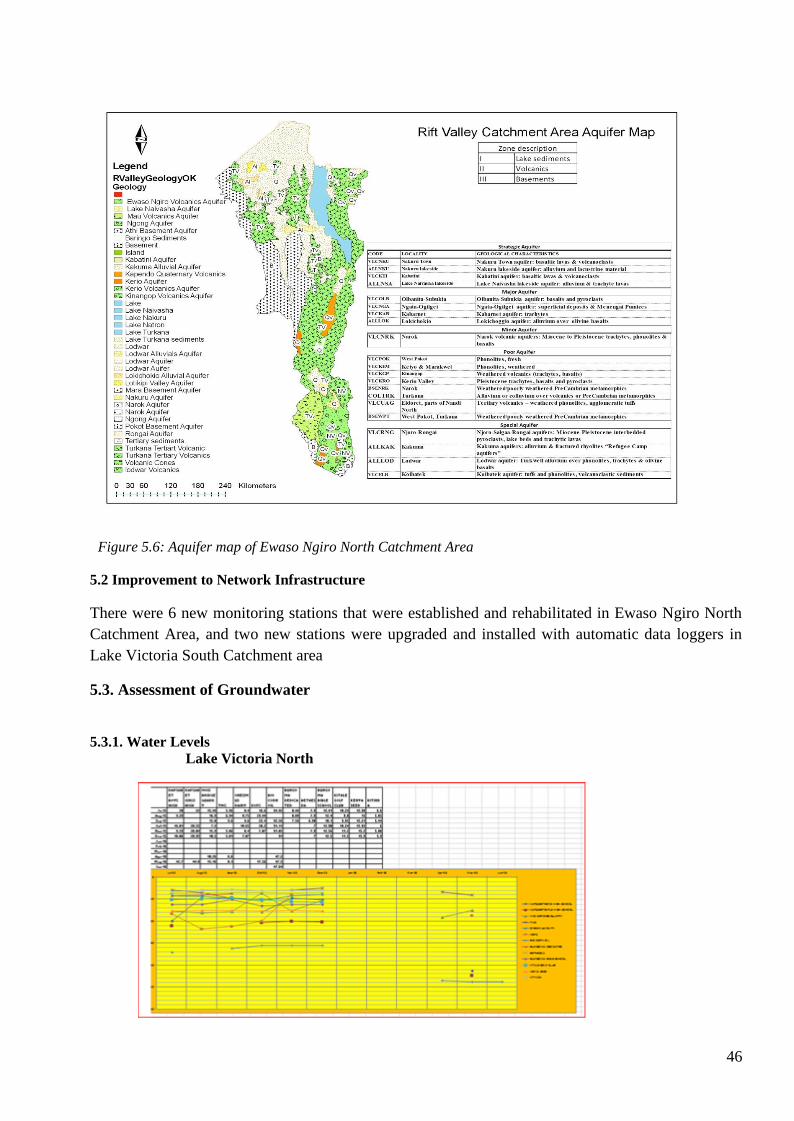
Figure 5.6: Aquifer map of Ewaso Ngiro North Catchment Area
5.2 Improvement to Network Infrastructure
There were 6 new monitoring stations that were established and rehabilitated in Ewaso Ngiro North
Catchment Area, and two new stations were upgraded and installed with automatic data loggers in
Lake Victoria South Catchment area
5.3. Assessment of Groundwater
5.3.1. Water Levels
Lake Victoria North

47
Figure 5.7: Water Levels in Lake Victoria North Catchment Area
Despite the data inconsistency brought about by time lapse after pumping stopped, the general trend
looks stable with no alarming deviations except for Bio Corn borehole whose level seems to be going
down for the last three months at very alarming rates that need to be investigated further.
Lake Victoria South
Groundwater hydrographs illustrate the historical record of aquifer water levels measured within a
well. However, a long term record is very important in the evaluation of water level trends and
estimation of recharge –discharge water balance. The data available is scanty and inconsistent and
may not have significant impact on the trends on aquifers.
In general terms there were no alarming reports of groundwater depletion and the situation can be
considered to be stable.
Rift Valley
Figure 5.8: Water levels in Rift Valley Catchment Area
The trend has been relatively constant in most of the stations that are being monitored. This is an
indication that the rate of abstraction and recharge are equal.
Three stations Rubiri Borehole (to represent behaviour of the Southlake area), Marula Borehole (to
represent behaviour of the Northlake area), and Kabatini Borehole (to represent behaviour of the
Kabatini Aquifer), were used.
Trends:
48
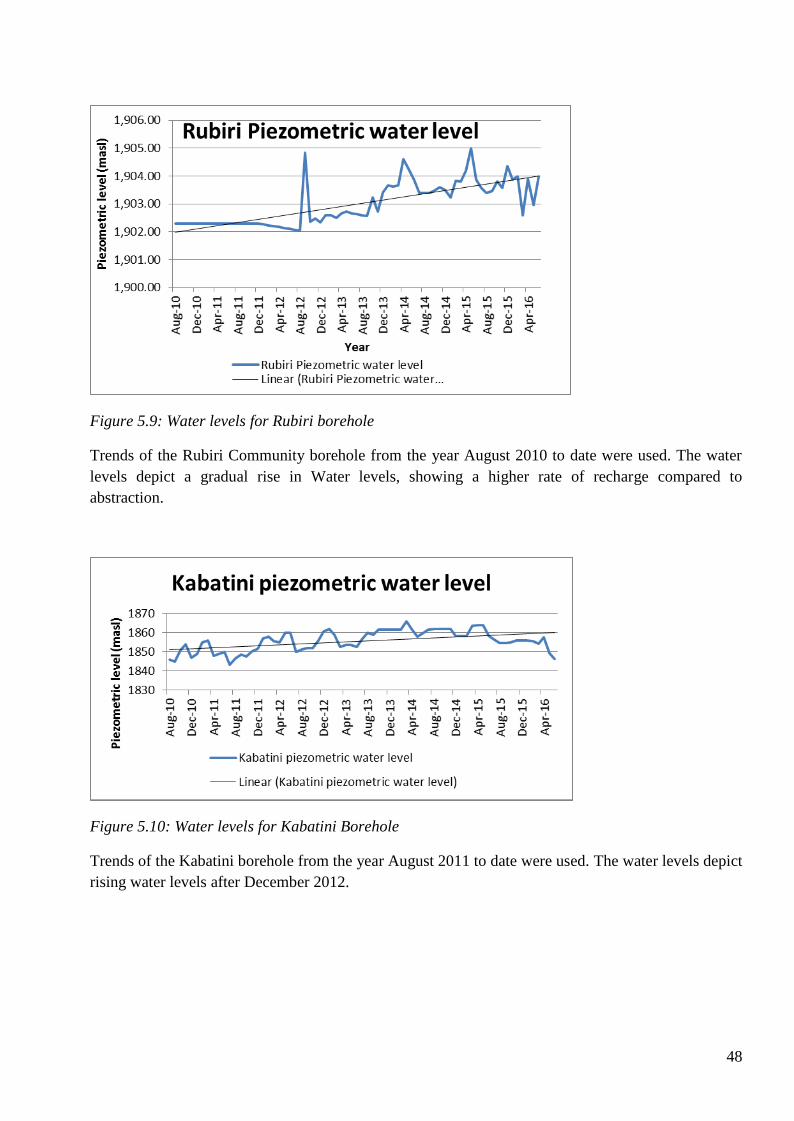
Figure 5.9: Water levels for Rubiri borehole
Trends of the Rubiri Community borehole from the year August 2010 to date were used. The water
levels depict a gradual rise in Water levels, showing a higher rate of recharge compared to
abstraction.
Figure 5.10: Water levels for Kabatini Borehole
Trends of the Kabatini borehole from the year August 2011 to date were used. The water levels depict
rising water levels after December 2012.

49
1876
1878
1880
1882
1884
1886
Au
g-1
0
De
c-10
Ap
r-1
1
Au
g-1
1
De
c-11
Ap
r-1
2
Au
g-1
2
De
c-12
Ap
r-1
3
Au
g-1
3
De
c-13
Ap
r-1
4
Au
g-1
4
De
c-14
Ap
r-1
5
pie
zom
etr
ic le
vel
(mas
l)
Year
Marula Tulaga
Marula Tulaga
Linear (Marula Tulaga)
Figure 5.11: Water levels in Rift Valley Catchment Area
Trends of the Marula borehole from the year July 2011 to date were used. The water levels depict
lower levels between July 2012 – March 2013, but lately, the trend line clearly depicts water levels
are not dropping, but rising
Subati Borehole 3 Water Level Trends
Figure 5.12:Comparison Of Water Rest Level For 2015 And 2016

50
Subati Borehole 5 Water Level Trends
Figure 5.13:Comparison Of Water Rest Level For 2015 And 2016
A comparison of water levels for the same period in 2015 and 2016 shows a rise of approximately 1.5
metres in Subati 3 borehole and a drop of the same margin in Subati 5 borehole. This could be
attributed to abstraction rates for the two boreholes or instrumentation error but further investigations
are necessary to establish the true cause for this kind of trend.
Athi Catchment Area
A few boreholes were selected to represent the ground water level trends in respective part of the
region. On the whole the general trends have been as follows
Upper Athi zone drainage areas 3BC to 3DA covering Ruiru, Juja and Donyo Sabuk areas
Nairobi Aquifer Suite: These are to be found within Nairobi area and Upper Athi sub-
Regions. The water level trends in boreholes within each aquifer zone are shown in the figures
below

51
Figure
5.14: Comparison Of Water Rest Level for Boreholes in upper Athi
Data available for the last three years indicate stable conditions within the Upper Athi sub-
basins of the Nairobi Suite Volcanic formations as depicted by Macmillan and Murera
boreholes above. However the basement aquifers within this sub-catchment depict dropping
levels of groundwater as depicted by the trend of Vinya Wa Kanyukuu borehole. This could
be attributed to increased water demand and hence more abstraction or anthropogenic
activities within the aquifer recharge areas reducing the recharge and causing a deficit in the
water balance budget. More investigations are needed to establish the cause and determine
the necessary remedial measures.
Nairobi area Sub-basin Drainage areas 3AA to 3BB covering the areas of Limuru, Kikuyu,
Nairobi City, Karen, Ruai, Athi River and Kitengela areas.
Six boreholes were selected to represent various parts of the Nairobi City. KICC represents
the trends within the City centre. Riverside shows the trends within Westlands and Chiromo
area while Unilever represents the trends at industrial area. Kabete water Supply borehole
represents the trends of lateral inflows from the Limuru Rironi area, Kabansora represents the
trends within Embakasi area while Jorgen represents the trends within Karen area. Eastleigh,
Parklands, Kitengela and athi River areas do not as yet have monitoring boreholes and there is
need to establish one for every one of these areas.
52
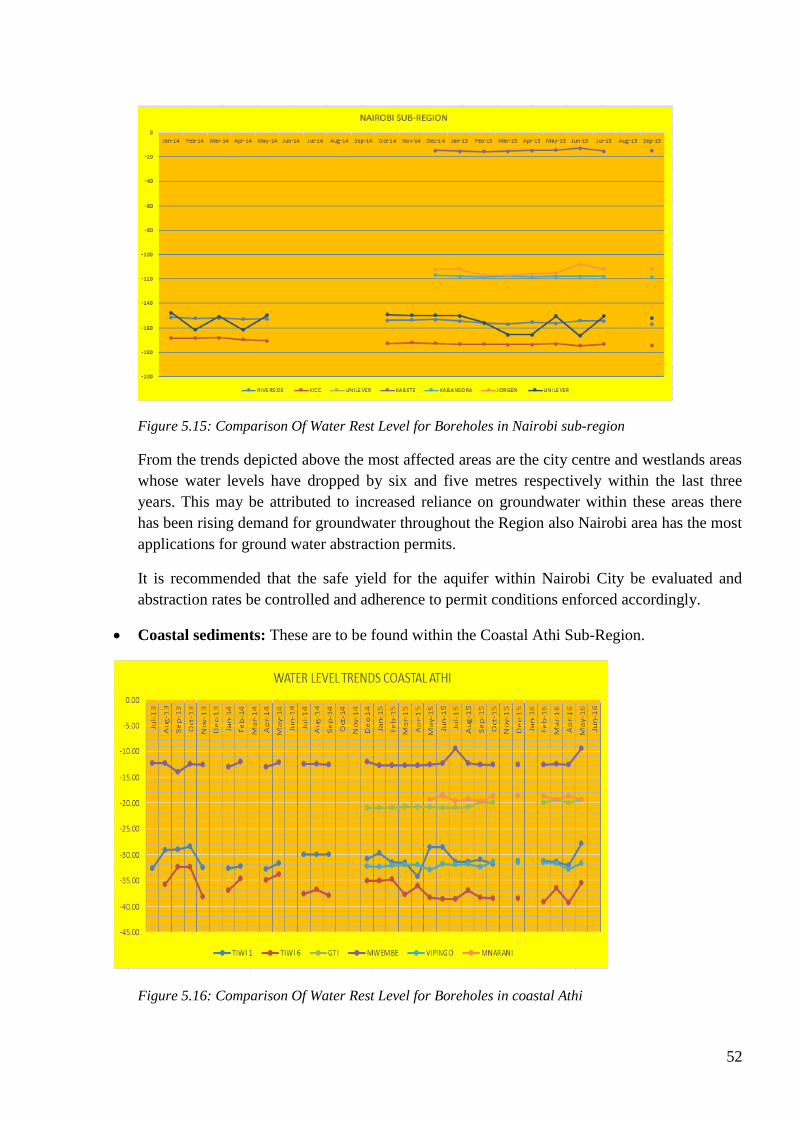
Figure 5.15: Comparison Of Water Rest Level for Boreholes in Nairobi sub-region
From the trends depicted above the most affected areas are the city centre and westlands areas
whose water levels have dropped by six and five metres respectively within the last three
years. This may be attributed to increased reliance on groundwater within these areas there
has been rising demand for groundwater throughout the Region also Nairobi area has the most
applications for ground water abstraction permits.
It is recommended that the safe yield for the aquifer within Nairobi City be evaluated and
abstraction rates be controlled and adherence to permit conditions enforced accordingly.
Coastal sediments: These are to be found within the Coastal Athi Sub-Region.
Figure 5.16: Comparison Of Water Rest Level for Boreholes in coastal Athi
53
Except for Tiwi 6 which has shown slight decline in water levels for the last three years the Long
term trends have generally been constant but with slight seasonal fluctuations in coastal Athi
boreholes.
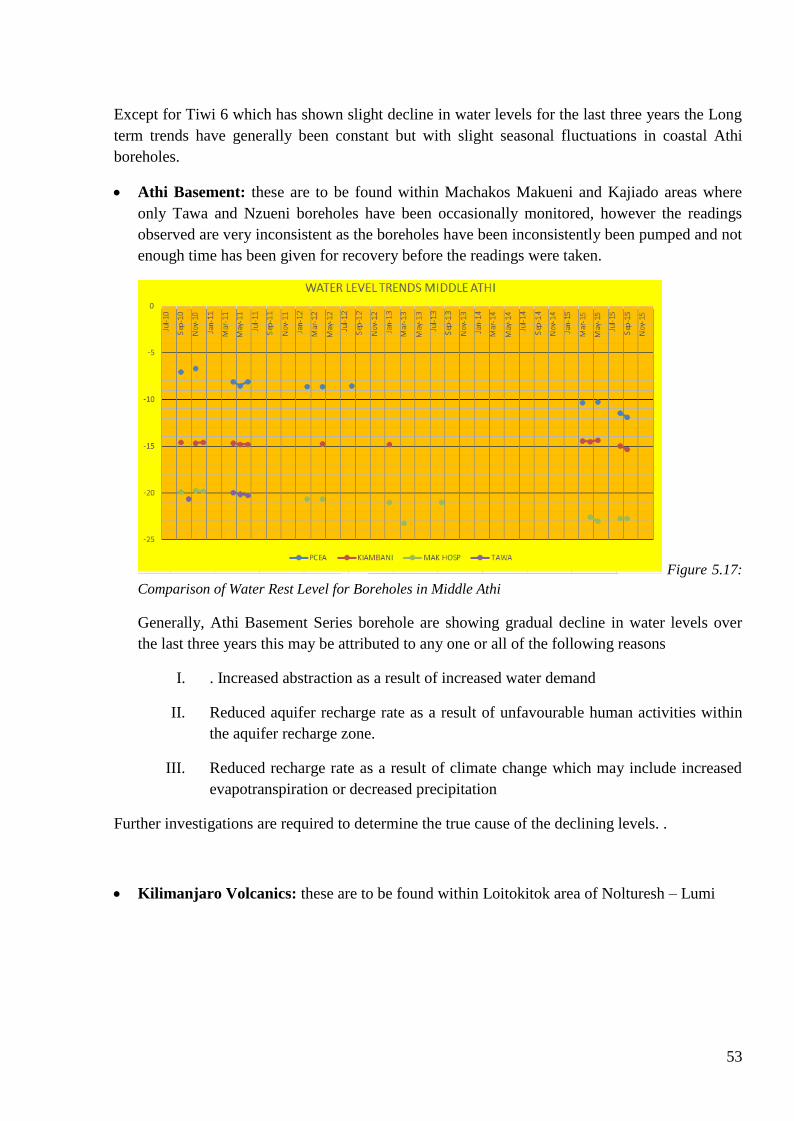
Athi Basement: these are to be found within Machakos Makueni and Kajiado areas where
only Tawa and Nzueni boreholes have been occasionally monitored, however the readings
observed are very inconsistent as the boreholes have been inconsistently been pumped and not
enough time has been given for recovery before the readings were taken.
Figure 5.17:
Comparison of Water Rest Level for Boreholes in Middle Athi
Generally, Athi Basement Series borehole are showing gradual decline in water levels over
the last three years this may be attributed to any one or all of the following reasons
I. . Increased abstraction as a result of increased water demand
II. Reduced aquifer recharge rate as a result of unfavourable human activities within
the aquifer recharge zone.
III. Reduced recharge rate as a result of climate change which may include increased
evapotranspiration or decreased precipitation
Further investigations are required to determine the true cause of the declining levels. .
Kilimanjaro Volcanics: these are to be found within Loitokitok area of Nolturesh – Lumi

54
Figure 5.18: Comparison of Water Rest Level for Boreholes in Nolturesh Lumi
The general trend shows a relatively stable conditions indicating a relative balance between
abstraction and recharge.
Chyulu Volcanics: these are to be found within Tsavo west National Park extending to Emali
Makindu and Kibwezi areas. There are no monitoring boreholes within this aquifer system
however discharge from Mzima springs indicate stable conditions. It has been noted that
springs around Makindu Town, Masimba Town and Mtito Andei areas are drying up. This
could be attributed to increased abstraction as a result of rapid development of boreholes
experienced in the recent past especially with the emergence of devolved governments.
Tana Catchment Area
Figure 5.19: Comparison for Water Rest Level for Boreholes in Tana

55
The water level trends show a relatively stable conditions for the year within the
Catchment.Boreholes within the basement poor aquifers show seasonal fluctuations which are
however not alarming
Ewaso Ngiro North Catchment Area
Water levels was the only parameter taken from the stations around the Upper Ewaso Ngiro Sub-
Catchment
Figure 5.20: Comparison of Water Rest Level for Boreholes in Ewaso Ng’iro
The trends in Upper Ewaso Ngiro North Sub-Catchment have been relatively stable during the
year depicting a balance between abstraction and recharge
56
5.3.2 Groundwater Quality
Under the MTAP II project a total of 43 production boreholes were assessed for quality in Garissa
County (Tana region) and in Wajir County. The water was found to have moderate to high salinity.
For Garissa County the borehole salinity increased with distance from the river Tana. Tests for
arsenic showed that the concentrations were all within the permissible level (i.e less than 10 µg/l).
Arsenic occurs naturally in some areas and may be toxic in high concentrations.
The routine groundwater monitoring was irregular in the reporting period. Less than 45% of the
stations were monitored. Among those monitored none was done monthly as required. The main
challenge was lack of funds to facilitate the data collection.
Groundwater generally exhibited high levels of fluoride in upper and middle Athi catchment, the Rift
Valley and around the shores of Lake Victoria. The lower Athi including coastal areas showed
moderate to high salinity.
Groundwater in the highlands in LVNCA and LVSCA generally showed low pH and salinity, and
high Iron and Manganese concentrations were found at the lower catchment to the Lake in LVNCA
and around the Winam Gulf. Iron and manganese are undesirable in water due to staining of laundry
and plumbing fixtures.
Ground-Water Monitoring Boreholes
Ground water stations were monitored by sampling and in-situ measurements. Table 5.2 shows
distribution of the boreholes monitored per region.
Name of Catchment
ACA LVN LVS ENNCA TCA RVCA Total
No of Stations
32 12 20 16 19 41 140
Table 5.2: Groundwater Monitoring Stations
Groundwater Assessment in ENNCA
Matabithi Borehole
This borehole is located in Isiolo County which is characterized by moderate salinity content.

57
Figure 5.21: Electrical Conductivity (µS/cm) in the Matabithi Borehole, Isiolo
Logologo Borehole
Logologo borehole in Marsabit County was not monitored in 2015/2016 FY However, the general
characteristic of groundwater in the area is moderate to high mineral content with conductivity as
high as 6000 μS/cm.
Ruiri Borehole
The borehole is in Meru County has fresh water with low conductivity. The conductivity has
remained relatively constant, except for the year 2012.
Ruiri Borehole Electrical Conductivity Trend
Figure 5.22 Electrical conductivity (µS/cm) - Ruiri Borehole, Meru
Groundwater Assessment - TCA
Baraza Borehole, Garissa Water & Sanitation Company (GAWASCO).
58
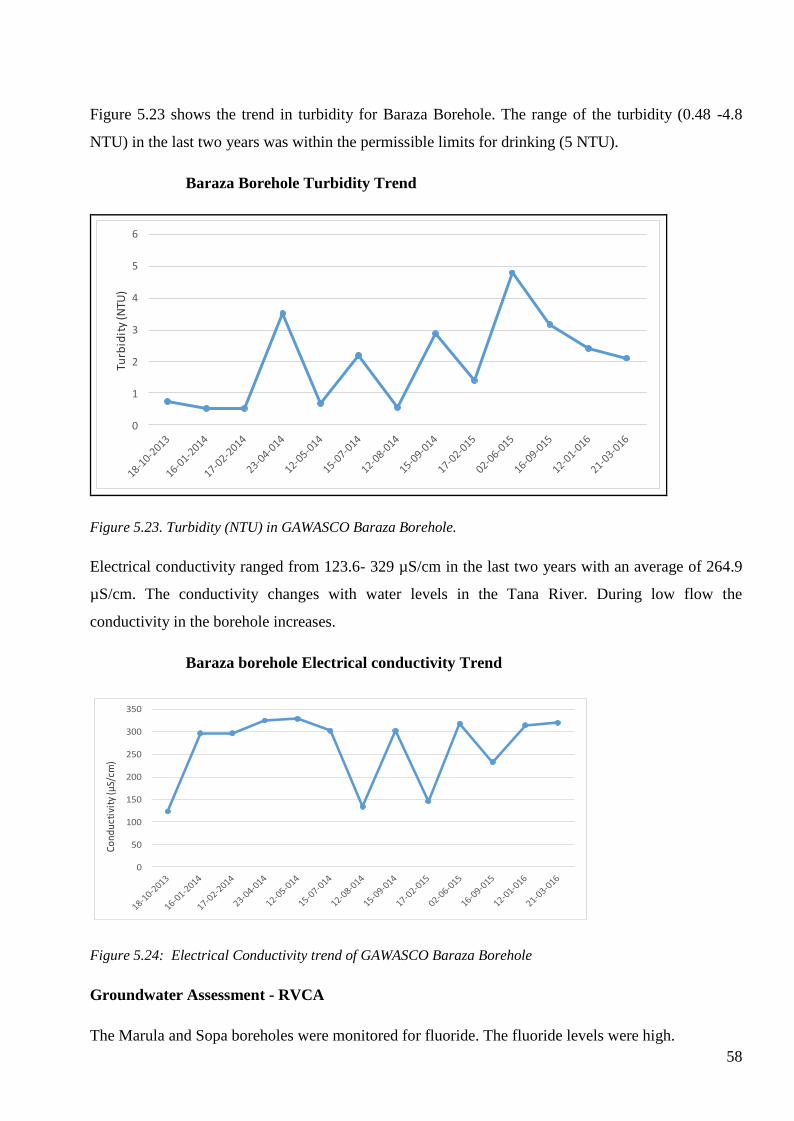
Figure 5.23 shows the trend in turbidity for Baraza Borehole. The range of the turbidity (0.48 -4.8
NTU) in the last two years was within the permissible limits for drinking (5 NTU).
Baraza Borehole Turbidity Trend
0
1
2
3
4
5
6
Turb
idit
y (N
TU)
Figure 5.23. Turbidity (NTU) in GAWASCO Baraza Borehole.
Electrical conductivity ranged from 123.6- 329 µS/cm in the last two years with an average of 264.9
µS/cm. The conductivity changes with water levels in the Tana River. During low flow the
conductivity in the borehole increases.
Baraza borehole Electrical conductivity Trend
0
50
100
150
200
250
300
350
Co
nd
uct
ivit
y (µ
S/cm
)
Figure 5.24: Electrical Conductivity trend of GAWASCO Baraza Borehole
Groundwater Assessment - RVCA
The Marula and Sopa boreholes were monitored for fluoride. The fluoride levels were high.

59
Groundwater Assessment in ACA
GTI Mombasa Borehole Electrical Conductivity
Figure 5.25 Electrical Conductivity (µS/cm) Trend - GTI Borehole, Mombasa
The conductivity has been increasing, indicating that the borehole is getting salinized probably due to
unsustainable abstraction.
5.4. Groundwater Recharge
Based on studies conducted in past years, stakeholders consultation have been going on during the
year in Tana and Athi Region in order to have the Lamu Sand Dunes and Nairobi Aquifer Suite
Recharge areas gazetted and declared groundwater Conservation areas. These exercises are still in
progress.
5.5. Special Events
No special events were recorded or reported during the year under review
5.6. Special Studies
Likoni Boreholes Resistivity Logging
The exercise was conducted on May 2016 in Mtongwe area.
The two boreholes logged were drilled by Mombasa Water Sewerage and Sanitation
Company as exploratory wells under the sponsorship of World Bank.
UpGro Project in Kwale County
The groundwater Risk Management for Growth and Development project is a DiFD supported
research study which aims to improve the understanding of groundwater risks and institutional
responses by studying the tradeoffs between groundwater utilization and socio-economic
60
development within the coastal aquifers of Kwale County where irrigated agriculture, mining and
tourism enterprises share resources with domestic water supplies.
The research aims to provide evidence of new approaches to promote water security, growth and
development.
Geophysics
The first phase of geophysics field data collection was undertaken in December 2015 and January
2016.
The field work was conducted by WRMA staff in collaboration with the University of Nairobi and
RFL geologists.
A second phase of the geophysical studies was done on May-June 2016 totaling to 20km on E-W
orientation to characterize the western boundary of the study area.
Hydrochemistry
The project team conducted a detailed hydrochemistry field survey in the study area. The first
groundwater sampling campaign for water quality was conducted during September-October 2015
where 81 sites were identified out of which 77 sites were sampled.
Regular monitoring of water quality is also being carried out at 36 sites within the study area on a
fortnight basis. Measured parameters include PH, Conductivity, Temperature, TDS and Turbidity.
These studies are still on going.

61
0
1
2
3
4
5
6
Turb
idit
y (N
TU)
Figure 5.3. Turbidity (NTU) in GAWASCO Baraza Borehole.
Electrical conductivity ranged from 123.6- 329 µS/cm in the last two years with an average of 264.9
µS/cm. The conductivity changes with wter levels in the Tana River. During low flow the
conductivity in the borehole increases.
0
50
100
150
200
250
300
350
Co
nd
uct
ivit
y (µ
S/cm
)
62
Figure 5.4: Electrical Conductivity trend of GAWASCO Baraza Borehole
5.3.3 Groundwater Assessment – RVCA
The Marula and Sopa boreholes were monitored for fluoride. The fluoride levels were high.
5.3.4 Groundwater Assessment in ACA
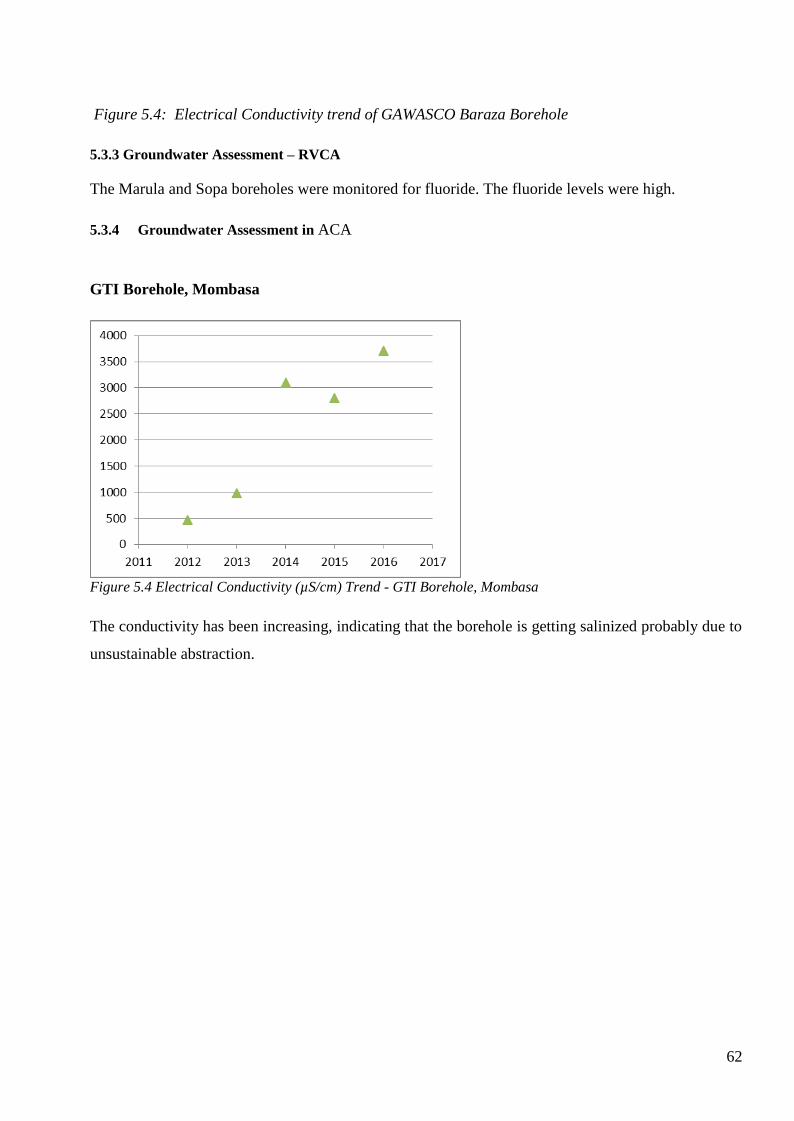
GTI Borehole, Mombasa
Figure 5.4 Electrical Conductivity (µS/cm) Trend - GTI Borehole, Mombasa
The conductivity has been increasing, indicating that the borehole is getting salinized probably due to
unsustainable abstraction.
63
6 WATER USE
6.1 Permits
6.1.1Number of Permits issued
790No. permits issued during the 2015/16 Financial Year. Out of the 790 permits, 629 were new
permits while the rest were renewals of old permits.
The total permits processed through Permit Database as at 30th June 2016 are 4,609.
6.1.2 Type of permits issued
The new permits issued in the financial year were as follows;
- Groundwater 424No.
- Surface Water 201No.
- Effluent Discharge 4No.
6.2 Water Use
6.2.1 PDB Reports
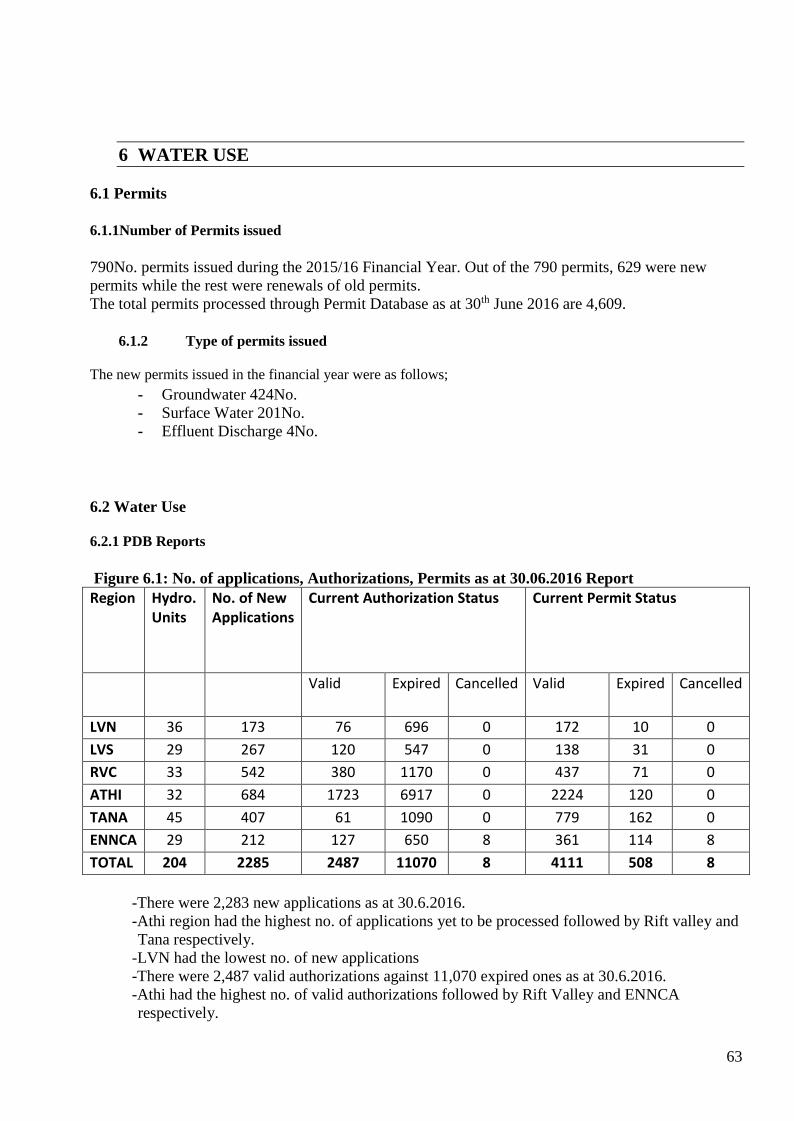
Figure 6.1: No. of applications, Authorizations, Permits as at 30.06.2016 Report
Region Hydro. Units
No. of New Applications
Current Authorization Status Current Permit Status
Valid Expired Cancelled Valid Expired Cancelled
LVN 36 173 76 696 0 172 10 0
LVS 29 267 120 547 0 138 31 0
RVC 33 542 380 1170 0 437 71 0
ATHI 32 684 1723 6917 0 2224 120 0
TANA 45 407 61 1090 0 779 162 0
ENNCA 29 212 127 650 8 361 114 8
TOTAL 204 2285 2487 11070 8 4111 508 8
-There were 2,283 new applications as at 30.6.2016.
-Athi region had the highest no. of applications yet to be processed followed by Rift valley and
Tana respectively.
-LVN had the lowest no. of new applications
-There were 2,487 valid authorizations against 11,070 expired ones as at 30.6.2016.
-Athi had the highest no. of valid authorizations followed by Rift Valley and ENNCA
respectively.

64
-The highest no. of expired Authorizations were also from Athi, followed by Rift and Tana
respectively.
-LVS had the least no. of expired authorizations followed by ENNCA and LVN
-Only ENNCA region had the cancelled authorizations
-There were 4,111 valid permits against 508 expired ones.
-Athi had the highest no. of valid permits, followed by Tana and Rift Valley.
-Tana had the highest no. of expired permits followed by Athi and ENNCA
-LVN had the lowest no. of expired permits followed by LVS and Rift Valley respectively.
Final Transactions Status by Month between July-2015 and June-2016 Report
Month/Year
App Rcvd
Auth. Issued
Auth. Ext.
Permits Transfer
Permits Variation
App. deferred
Applications rejected
Permits issued
Permits Renewal
Permits Cancellation
Total
July-2015
12 346 20 0 0 30 5 50 6 0 469
August-2015
24 315 18 0 1 16 10 26 11 0 421
September-2015
26 232 13 2 2 3 3 45 8 0 334
October-2015
27 176 19 0 1 6 2 77 7 0 315
November-2015
14 264 15 7 0 5 8 78 6 0 397
December-2015
9 163 19 4 0 14 3 43 16 0 271
January-2016
25 142 8 1 1 2 0 23 2 0 204
February-2016
43 222 12 0 3 2 5 58 19 0 364
March-2016
65 163 29 1 2 0 1 69 22 0 352
April-2016
131 222 32 0 0 4 2 22 11 0 424
May-2016
95 216 14 0 6 1 0 32 24 0 388
June-2016
42 156 8 0 1 7 1 104 31 0 350
TOTAL 513 2617 207 15 17 90 40 627 163 0 4289
Table 6.2 Final Transactions Status by Month between July-2015 and June-2016 Report

65
During the year under review, a total of 4,289 applications were handled at various offices in different
levels as follows;
-513 new applications received within the financial year, awaiting issuance
-2,617 authorizations were processed within the Financial Year
-207 authorizations extended
-new permits issued
-163 old permits renewed
-15 Permits transferred
-17 permits varied
-applications deferred
40 applications rejected
No permit was cancelled during the year under review.
LIST OF METERS AS AT 30.6.2016
REGION SRO SW GW TOTAL
LVNCA ELD 2 1 3
KTL 0 1 1
SYA 0 4 4
LVSCA KCO 4 3 7
KSI 0 0 0
KSM 7 4 11
RVCA KAB 0 17 17
KAP 0 1 1
LOD 0 3 3
NSA 20 107 127
NAR 0 0 0
ATHI KBU 9 49 58
KBZ 17 42 59
LTK 1 3 4
MSA 0 99 99
NRB 1 265 266
TANA GSA 0 0 0
KRG 9 7 16
KTI 2 9 11
MRG 2 13 15
MRU 2 0 2
ENNCA ISL 3 2 5
MAE 0 0 0
MIT 1 46 47
NUK 13 17 30
66
RUM 0 2 2
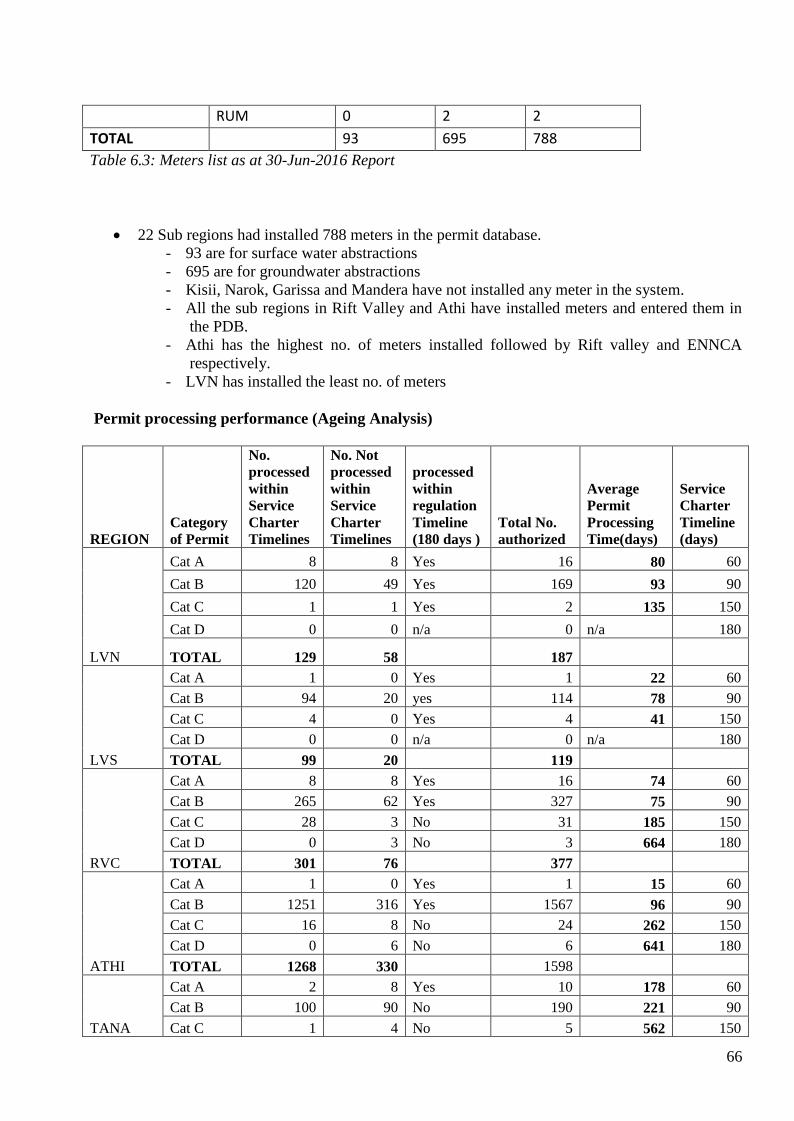
TOTAL 93 695 788
Table 6.3: Meters list as at 30-Jun-2016 Report
22 Sub regions had installed 788 meters in the permit database.
- 93 are for surface water abstractions
- 695 are for groundwater abstractions
- Kisii, Narok, Garissa and Mandera have not installed any meter in the system.
- All the sub regions in Rift Valley and Athi have installed meters and entered them in
the PDB.
- Athi has the highest no. of meters installed followed by Rift valley and ENNCA
respectively.
- LVN has installed the least no. of meters
Permit processing performance (Ageing Analysis)
REGION
Category
of Permit
No.
processed
within
Service
Charter
Timelines
No. Not
processed
within
Service
Charter
Timelines
processed
within
regulation
Timeline
(180 days )
Total No.
authorized
Average
Permit
Processing
Time(days)
Service
Charter
Timeline
(days)
LVN
Cat A 8 8 Yes 16 80 60
Cat B 120 49 Yes 169 93 90
Cat C 1 1 Yes 2 135 150
Cat D 0 0 n/a 0 n/a 180
TOTAL 129 58 187
LVS
Cat A 1 0 Yes 1 22 60
Cat B 94 20 yes 114 78 90
Cat C 4 0 Yes 4 41 150
Cat D 0 0 n/a 0 n/a 180
TOTAL 99 20 119
RVC
Cat A 8 8 Yes 16 74 60
Cat B 265 62 Yes 327 75 90
Cat C 28 3 No 31 185 150
Cat D 0 3 No 3 664 180
TOTAL 301 76 377
ATHI
Cat A 1 0 Yes 1 15 60
Cat B 1251 316 Yes 1567 96 90
Cat C 16 8 No 24 262 150
Cat D 0 6 No 6 641 180
TOTAL 1268 330 1598
TANA
Cat A 2 8 Yes 10 178 60
Cat B 100 90 No 190 221 90
Cat C 1 4 No 5 562 150

67
Cat D 0 3 No 3 663 180
TOTAL 103 105 208
ENNCA
Cat A 1 7 No 8 443 60
Cat B 63 45 Yes 108 106 90
Cat C 0 1 No 1 976 150
Cat D 0 1 No 1 744 180
TOTAL 64 54 118
Table 6.4: Permit processing performance (Ageing Analysis
Category A
- LVN processed 50% of the applications within the Service Charter (SC) times and all
within regulation (R)
- LVS had one application processed within SC and ( R) timelines
- RVC processed 50% of the applications within the Service Charter (SC) times and all
within regulation (R)
- Athi processed one application within SC and ( R) timelines
- Tana processed 20% of the applications within SC timelines and all within regulation
(R)
- ENNCA processed one applications within SC timelines but the average processing
time of the remaining 6 applications were processed after 180 days provided for in the
Water Act.
Category B
- All regions apart from Tana processed category D applications within regulation.
- Approximately 80% of the applications were processed within the SC timelines
Category C
- LVN and LVS processed their applications within SC and R timelines
- However, the remaining regions processed their applications after the expiry of the
180 days provided by regulation
- This was as a result of;
- CAACs which were not in place
- Submission of NEMA License
Category D
- The Lake regions did not process any application under this category
- However, the remaining regions all processed beyond the time allowed by regulation
- This was as a result of;
- CAACs which were not in place
- Submission of NEMA License
- Collection of assessment fees for Effluent Discharge assessment
6.2.2 Monthly water use
Monthly Water Abstracted Between July-2015 and June2016
Month SW GW Total
July-2015 0 0 0
August-2015 0 22983 22983
September-2015 0 0 0
68
October-2015 0 0 0
November-2015 0 0 0
December-2015 0 0 0
January-2016 0 0 0
February-2016 0 0 0
March-2016 0 0 0
April-2016 0 0 0
May-2016 0 0 0
June-2016 0 0 0
Average 0.00 1,915.25 1,915.25
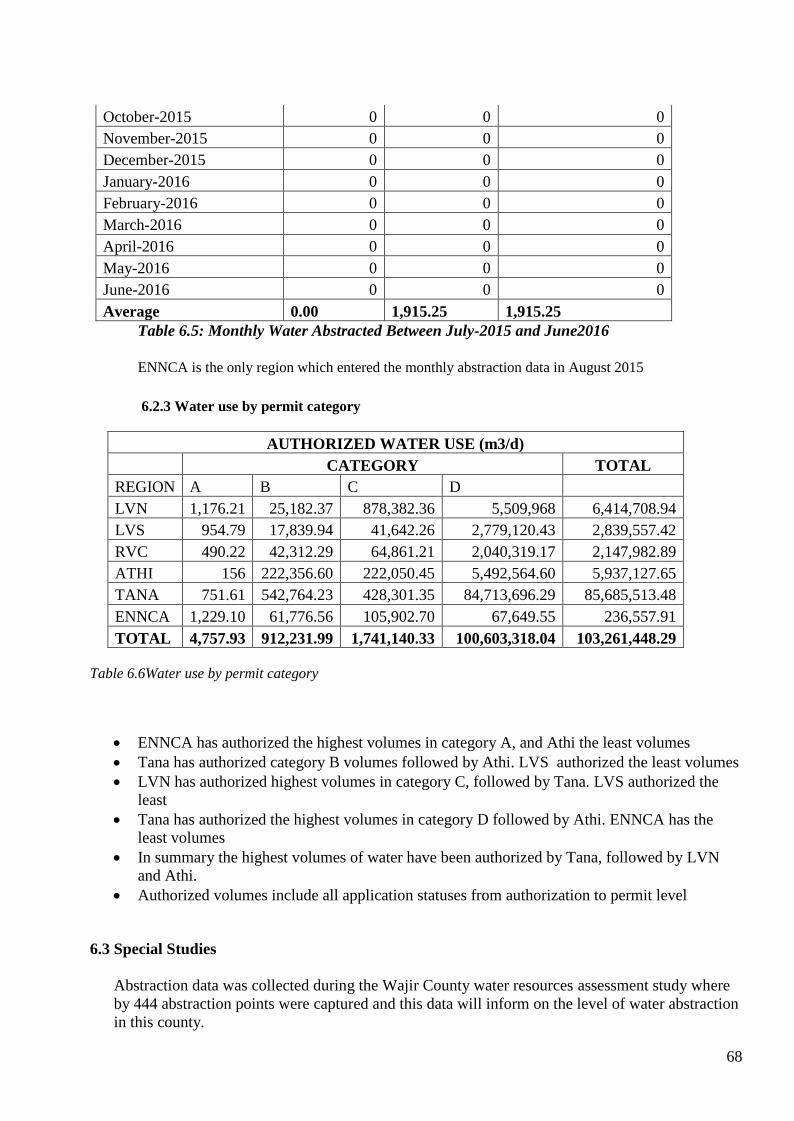
Table 6.5: Monthly Water Abstracted Between July-2015 and June2016
ENNCA is the only region which entered the monthly abstraction data in August 2015
6.2.3 Water use by permit category
AUTHORIZED WATER USE (m3/d)
CATEGORY TOTAL
REGION A B C D
LVN 1,176.21 25,182.37 878,382.36 5,509,968 6,414,708.94
LVS 954.79 17,839.94 41,642.26 2,779,120.43 2,839,557.42
RVC 490.22 42,312.29 64,861.21 2,040,319.17 2,147,982.89
ATHI 156 222,356.60 222,050.45 5,492,564.60 5,937,127.65
TANA 751.61 542,764.23 428,301.35 84,713,696.29 85,685,513.48
ENNCA 1,229.10 61,776.56 105,902.70 67,649.55 236,557.91
TOTAL 4,757.93 912,231.99 1,741,140.33 100,603,318.04 103,261,448.29
Table 6.6Water use by permit category
ENNCA has authorized the highest volumes in category A, and Athi the least volumes
Tana has authorized category B volumes followed by Athi. LVS authorized the least volumes
LVN has authorized highest volumes in category C, followed by Tana. LVS authorized the
least
Tana has authorized the highest volumes in category D followed by Athi. ENNCA has the
least volumes
In summary the highest volumes of water have been authorized by Tana, followed by LVN
and Athi.
Authorized volumes include all application statuses from authorization to permit level
6.3 Special Studies
Abstraction data was collected during the Wajir County water resources assessment study where
by 444 abstraction points were captured and this data will inform on the level of water abstraction
in this county.

69
7 EMERGING ISSUES
CHALLENGES
Lack of Equipment for surface Water highflow monitoring and adequate facilitation to officers to collect data
Late payment of gauge readers and slow input of data in the data base
Financial constraints. Inadequate and untimely funding has led to inconsistency in monitoring
of surface and groundwater resources and inadequate data for appraising water quality.
Important events like El Nino, low flows and high flows are not captured. The water quality
situation cannot be accurately established in the country.
Human resources. There is inadequate technical staff in some regions and sub-regions to
handle water quality activities. At the head office adequate and competent staff are needed for
effective coordination of activities.
Inadequate equipment and laboratory supplies.
Most of the monitoring boreholes are also water supply boreholes for individuals and
institutions this has presented the groundwater monitoring with a big challenge since for good
and reliable data water pumping from the monitoring borehole needs to be stopped for at least
24 hours before the water levels are taken. This has not been achieved, also the time laps
between the pumping stoppage and the level measurement is not consistent hence leading to
inconsistent and unreliable data for decision making.
There is lack of long term data for comparison purposes and therefore analysis may not be
very accurate.
Groundwater monitoring has faced logistical support and limited resources problems and has
not been consistent leaving a lot of gaps. Some sub-regions have virtually stopped monitoring
due to this reason.
The automated stations which would give real-time data have faced installation and
downloading related problems and are not functioning they need to be reinstalled but
resources availability has hindered the exercise.
I. OPPORTUNITIES
The African Wildlife Foundation has started a monitoring programme for Chyulu Hills
Watershed and WRMA will be partnering with the Organisation in monitoring data collection
and this will improve data availability.
Unlocking the Potential of Groundwater for the poor (Upgro) for Groundwater Risk
Management for Growth and Development (Gro for GooD ) Project in partnership with
Oxford University, University of Nairobi, WRMA, Kwale County Government, JKUAT,UPC
(Spain),Rural Focus Ltd, Base Titanium Ltd and KISCOL are supporting co-development
and future use of groundwater risk management tool by key stakeholders.

70
KEMRI Kisumu has installed data loggers in boreholes within Nyando Sub-Catchment and
has signed an MOU with WRMA to share the data so collected.
Engineers without Borders, an America Firm has donated five transducers (data loggers) to
Kisumu Sub-Regional Office and installation of the same in strategic wells is under way.
Some substantial data has been collected on groundwater during MTAP I and MTAPII
Projects the relevant sub-regions involved in these Projects should consolidate these data to be
in cooperated in their data bases and also the National Data Base to be created.
These opportunities we hope will widen the groundwater data collection base.
8 CONCLUSIONS
1. Water resources monitoring data is very important for planning and proper regulation of water
resources in the country. It provides a critical input into the water resources management
function, hence should be given adequate funds for the operations and maintenance of the
networks. Special attention needs to be given to the automation of the network for real time
data capture.
2. The challenge, under the WRM Rules 2007, is to have all water resources, both surface and
groundwater, in good quality status. This can be achieved successfully through concerted
efforts by all stakeholders and policy makers. WRMA has embraced IWRM principles and
concept in managing and regulating water use and protecting water catchment areas and is
implementing the new constitution with special effort being made in collaborating with
county governments.
3. Increased pollution occurring in the water resources, chiefly nutrient enrichment, siltation,
organic and chemical requires special effort through enhanced enforcement and compliance
with the effluent discharge permit conditions.
4. In addition awareness creation and sensitization of good practices in water pollution
management need to be continued with special emphasis to river clean-up campaign which
was launched during the year and will continue in coming years.

71
9 RECOMMENDATIONS
Water has now been elevated to a human rights issue. Article 43 (1) d; every person has a right
to clean water in adequate quantity. WRMA, as the manager of the resource must position itself
strategically to deliver this right to Kenyans. This will take finances which the government will
be required to provide for extensive water resource assessment and planning.
The definition of land now includes water resources. Article 62 (1) I, j, k, & l defines water
bodies as public land which is vested in and held by the National in trust for the people of
Kenya, and shall be administered by the National Land Commission.
A working relationship must be then worked out between the resources manager; WRMA and
the NLC.
Water allocation planning should be done for all sub-catchments involving stakeholder for
sustainable water regulation and management.
72
10 ANNEXES
Annex 1 Categories of Monitoring Stations under the Regional Catchment Management Strategies
i. Monitoring Stations of National Importance
These are monitoring stations established at the lower river reaches before a river discharges into a
transboundary lake/ocean, the river flows into a neighboring country, a station established on a shared
lake or stations on major lakes in Kenya. These stations are also important regionally as they are at
the downstream divide of management units; hence they monitor the outflows from the management
units. The only exception to this definition is Station 4G01 on Tana River at
Garissa. This station monitors the flow contributions from the Upper Tana Sub-catchment. From
Garissa, flow decreases towards the Indian Ocean.
ii. Monitoring Stations of Regional Importance (Management Unit (MU) Stations)
These are monitoring stations established at the outfall of a management unit to monitor the flows
from a specific management unit. Under the existing network of river gauging stations, there might be
need to utilize a gauging station in a downstream management unit (with appropriate adjustments) as
the control station for an upstream management unit.
iii. Stations of Sub-regional Importance (Stations within Management Units)
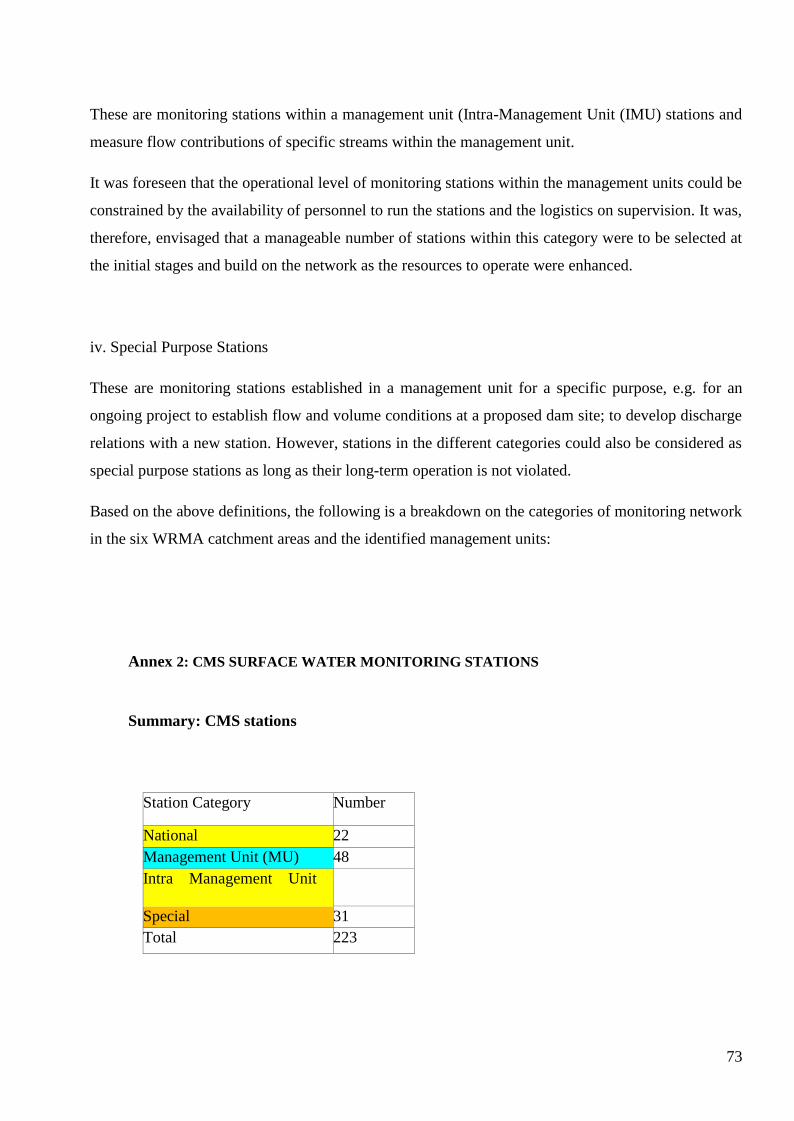
73
These are monitoring stations within a management unit (Intra-Management Unit (IMU) stations and
measure flow contributions of specific streams within the management unit.
It was foreseen that the operational level of monitoring stations within the management units could be
constrained by the availability of personnel to run the stations and the logistics on supervision. It was,
therefore, envisaged that a manageable number of stations within this category were to be selected at
the initial stages and build on the network as the resources to operate were enhanced.
iv. Special Purpose Stations
These are monitoring stations established in a management unit for a specific purpose, e.g. for an
ongoing project to establish flow and volume conditions at a proposed dam site; to develop discharge
relations with a new station. However, stations in the different categories could also be considered as
special purpose stations as long as their long-term operation is not violated.
Based on the above definitions, the following is a breakdown on the categories of monitoring network
in the six WRMA catchment areas and the identified management units:
Annex 2: CMS SURFACE WATER MONITORING STATIONS
Summary: CMS stations
Station Category Number
National 22
Management Unit (MU) 48
Intra Management Unit
(IMU)
123 Special 31
Total 223

74
CMS Station details
S/N Region Stn ID Name Long/Eastings Lat/Northings Station
Category 1 LVN 1AA01 Malaba 34.2708 0.6417 National
2 LVN 1AD02 Malakisi 34.3419 0.6250 National
3 LVN 1AH01 Sio 34.1417 0.3875 National
4 LVN 1EF01 Nzoia at
Ruambwa
34.0903 0.1236 National
5 LVN 1FG02 Yala 34.2653 0.0431 National
6 LVS 1GD03 Nyando 34.9597 -0.1250 National
7 LVS 1HB04 Lake Victoria 34.7403 -0.0875 National
8 LVS 1JG04 Sondu Miriu 34.8019 -0.3358 National
9 LVS 1KB05 Gucha Migori 34.2069 -0.9472 National
10 LVS 1LA04 Mara 35.0361 -1.2333 National
11 RVCA 2B13 Lake Turkana 35.9170 3.5520 National
12 RVCA 2EB10 Lake Bogoria 36.0610 0.2780 National
13 RVCA 2EH1 Lake Baringo 36.0270 0.6160 National
14 RVCA 2FA9 Lake
Elementaita
36.2400 -0.4080 National
15 RVCA 2FC4 Lake Nakuru 36.0920 -0.3210 National
16 RVCA 2GD6 Lake Naivasha 36.4170 -0.7690 National
17 RVCA 2K04 Ewaso Ng’iro
South
35.8450 -1.1010 National
18 ATHI 3HA13 Sabaki
(Baricho)
39.7670 -3.1170 National
19 ATHI 3J02 Lake Jipe 37.7580 -3.5420 National
20 ATHI 3J12 Lake Challa 37.7130 -3.3136 National
21 TANA 4G01 Tana at Garrisa 39.7000 -0.4500 National
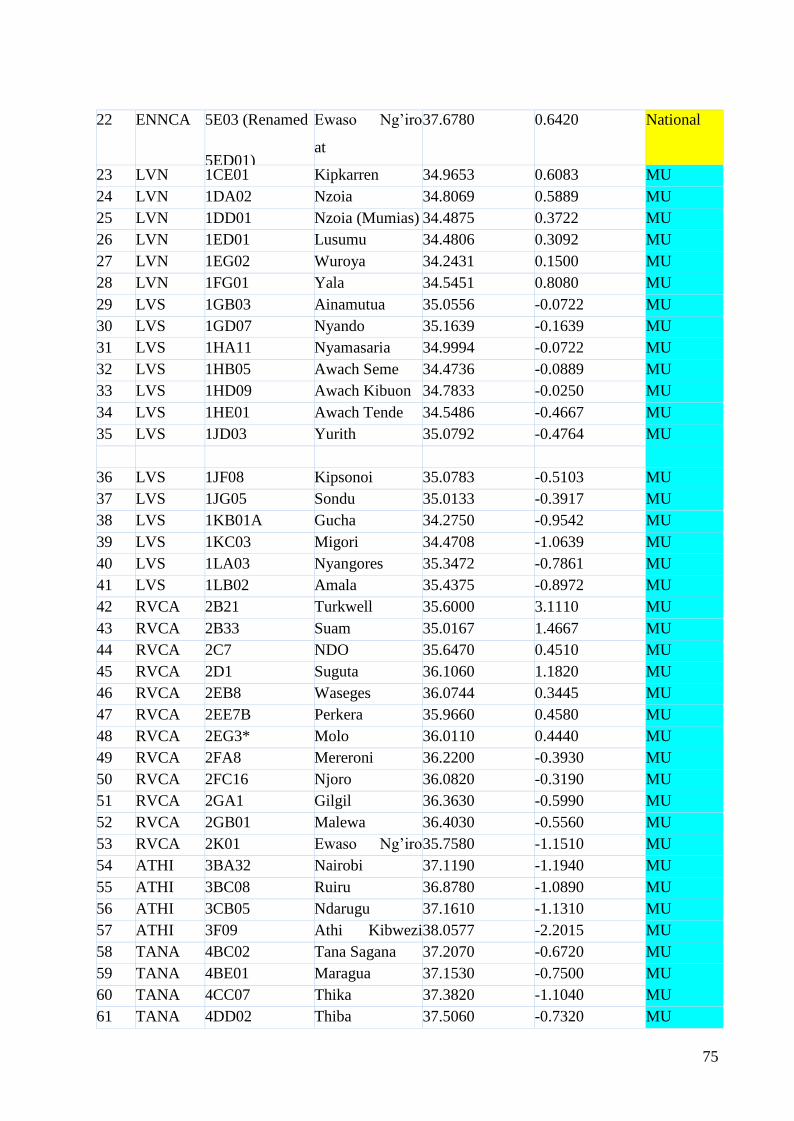
75
22 ENNCA 5E03 (Renamed
5ED01)
Ewaso Ng’iro
at
Archer’s Post
37.6780 0.6420 National
23 LVN 1CE01 Kipkarren 34.9653 0.6083 MU
24 LVN 1DA02 Nzoia 34.8069 0.5889 MU
25 LVN 1DD01 Nzoia (Mumias) 34.4875 0.3722 MU
26 LVN 1ED01 Lusumu 34.4806 0.3092 MU
27 LVN 1EG02 Wuroya 34.2431 0.1500 MU
28 LVN 1FG01 Yala 34.5451 0.8080 MU
29 LVS 1GB03 Ainamutua 35.0556 -0.0722 MU
30 LVS 1GD07 Nyando 35.1639 -0.1639 MU
31 LVS 1HA11 Nyamasaria 34.9994 -0.0722 MU
32 LVS 1HB05 Awach Seme 34.4736 -0.0889 MU
33 LVS 1HD09 Awach Kibuon 34.7833 -0.0250 MU
34 LVS 1HE01 Awach Tende 34.5486 -0.4667 MU
35 LVS 1JD03 Yurith 35.0792 -0.4764 MU
36 LVS 1JF08 Kipsonoi 35.0783 -0.5103 MU
37 LVS 1JG05 Sondu 35.0133 -0.3917 MU
38 LVS 1KB01A Gucha 34.2750 -0.9542 MU
39 LVS 1KC03 Migori 34.4708 -1.0639 MU
40 LVS 1LA03 Nyangores 35.3472 -0.7861 MU
41 LVS 1LB02 Amala 35.4375 -0.8972 MU
42 RVCA 2B21 Turkwell 35.6000 3.1110 MU
43 RVCA 2B33 Suam 35.0167 1.4667 MU
44 RVCA 2C7 NDO 35.6470 0.4510 MU
45 RVCA 2D1 Suguta 36.1060 1.1820 MU
46 RVCA 2EB8 Waseges 36.0744 0.3445 MU
47 RVCA 2EE7B Perkera 35.9660 0.4580 MU
48 RVCA 2EG3* Molo 36.0110 0.4440 MU
49 RVCA 2FA8 Mereroni 36.2200 -0.3930 MU
50 RVCA 2FC16 Njoro 36.0820 -0.3190 MU
51 RVCA 2GA1 Gilgil 36.3630 -0.5990 MU
52 RVCA 2GB01 Malewa 36.4030 -0.5560 MU
53 RVCA 2K01 Ewaso Ng’iro
South
35.7580 -1.1510 MU
54 ATHI 3BA32 Nairobi 37.1190 -1.1940 MU
55 ATHI 3BC08 Ruiru 36.8780 -1.0890 MU
56 ATHI 3CB05 Ndarugu 37.1610 -1.1310 MU
57 ATHI 3F09 Athi Kibwezi
Bridge
38.0577 -2.2015 MU
58 TANA 4BC02 Tana Sagana 37.2070 -0.6720 MU
59 TANA 4BE01 Maragua 37.1530 -0.7500 MU
60 TANA 4CC07 Thika 37.3820 -1.1040 MU
61 TANA 4DD02 Thiba 37.5060 -0.7320 MU
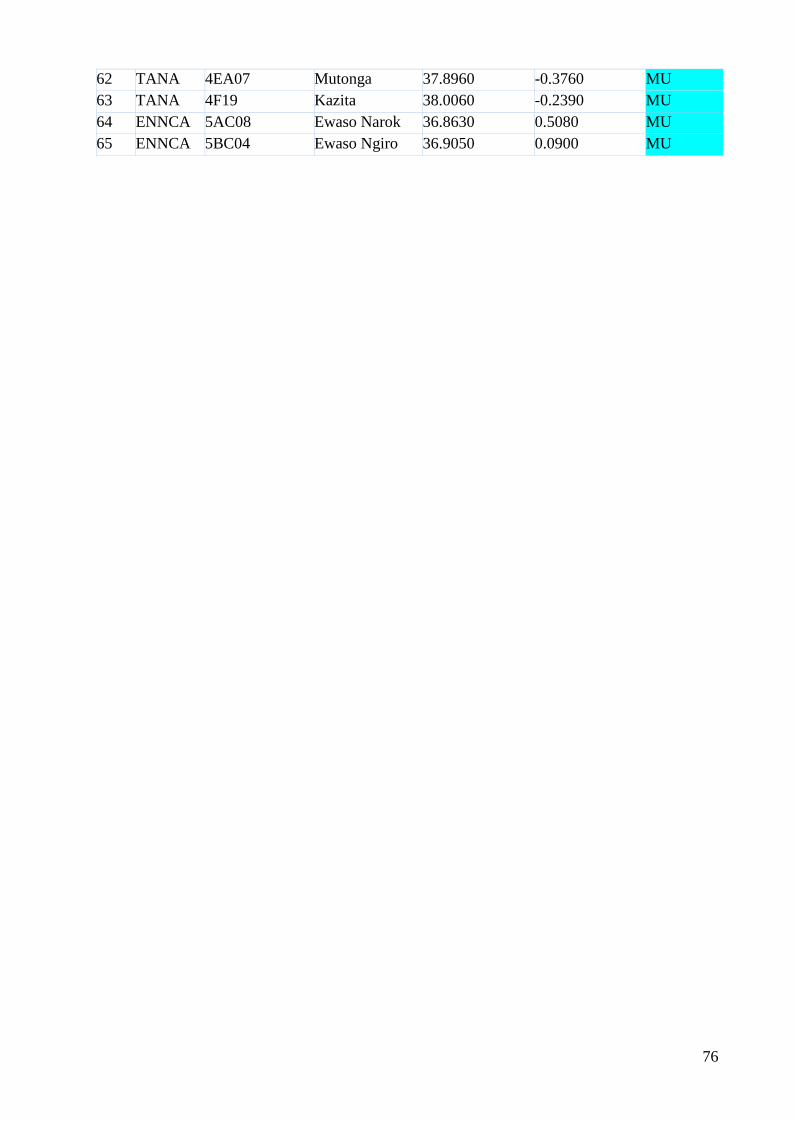
76
62 TANA 4EA07 Mutonga 37.8960 -0.3760 MU
63 TANA 4F19 Kazita 38.0060 -0.2390 MU
64 ENNCA 5AC08 Ewaso Narok 36.8630 0.5080 MU
65 ENNCA 5BC04 Ewaso Ngiro 36.9050 0.0900 MU

77
66 ENNCA 5BE20 Nanyuki 37.0300 0.1470 MU
67 ENNCA 5DC01 (former Ewaso Ngiro 36.8670 0.5290 MU
68 ENNCA 5DA07 (former Isiolo 37.5670 0.3330 MU
69 LVN 1BB01 Nzoia (Moi’s
bridge)
35.1333 0.9208 IMU
70 LVN 1BB02 Losura 35.2375 0.9542 IMU
71 LVN 1BD02 Large Nzoia 35.0611 0.7611 IMU
72 LVN 1BE06 Kwoitobus 35.0903 0.9653 IMU
73 LVN 1BH01 Kamukuywa 34.8028 0.7847 IMU
74 LVN 1DB01 Kuywa 34.7000 0.6236 IMU
75 LVN 1EE01 Nzoia 34.2250 0.1778 IMU
76 LVN 1FD02 Mokong 35.1244 0.1378 IMU
77 LVN 1FF03 Edzawa 34.5583 0.0944 IMU
78 LVN 1BG07 Rongai 34.9250 0.7740 IMU
79 LVS 1GB06A Mbogo 34.7078 -0.3820 IMU
80 LVS 1GC03 Kipchorian 35.4583 -0.2042 IMU
81 LVS 1GC04 Tugunon 35.4139 -0.2528 IMU
82 LVS 1GG01 Namuting 35.3472 -0.2028 IMU
83 LVS 1HA01 Great Oroba 35.0000 -0.0194 IMU
84 LVS 1HA02 Little Oroba 34.9708 -0.0278 IMU
85 LVS 1HA14 Awach Kajulu 34.8042 -0.0472 IMU
86 LVS 1HD03 Awach Kabondo 34.8833 -0.4486 IMU
87 LVS 1HD05 Awach Kasipul 34.8403 -0.5014 IMU
88 LVS 1HD06 Eaka Kioge 34.9500 -0.5083 IMU
89 LVS 1HE02 Mogusii 34.7631 -0.6192 IMU
90 LVS 1HE03 Isanda 34.7367 -0.5744 IMU
91 LVS 1JA02 Kiptiget 35.2569 -0.5514 IMU
92 LVS 1JC19 Kimugu 34.1754 -0.4767 IMU
93 LVS 1JD04 Ainapkoi 35.5847 -0.4042 IMU
94 LVS 1KA09 Riana 34.5167 -0.7139 IMU
95 LVS 1KB03 Gucha 34.5708 -0.8083 IMU
96 LVS 1KB11 Oyani 34.5333 -0.9033 IMU
97 LVS 1KB12 Kenyamware 34.9214 -0.6667 IMU
98 RVCA 2B08 Wei Wei 35.4650 1.3930 IMU
99 RVCA 2B24 Morun 35.4290 1.5310 IMU
100 RVCA 2C06 Kessup 35.4980 0.6280 IMU
101 RVCA 2C14 Kimwarer 35.6330 0.3170 IMU
102 RVCA 2EA01 Maji Matamu 36.1060 0.0000 IMU
103 RVCA 2EB03 Waseges 36.2110 0.1860 IMU
104 RVCA 2EC02 Rongai 35.9310 0.1060 IMU
105 RVCA 2EE09 Narosura 35.8740 0.2420 IMU
106 RVCA 2EG01 Molo 35.9130 0.0860 IMU
107 RVCA 2FC05 Njoro 35.9250 -0.3720 IMU
108 RVCA 2GA03 Gilgil 36.3440 -0.4920 IMU

78
109 RVCA 2GB05 Malewa 36.4010 -0.4930 IMU
110 RVCA 2GC04 Turasha 36.4170 -0.4790 IMU
111 RVCA 2GC05 Nandarasi 36.5590 -0.5510 IMU
112 RVCA 2GD02 Karati 36.4190 -0.6940 IMU

79
113 RVCA 2H01 Tongi Tongi 36.5930 -0.9200 IMU
114 RVCA 2H03 Little Kendong 36.5890 -1.0610 IMU
115 RVCA 2K03 Narok 35.8450 -1.1010 IMU
116 RVCA 2K10 Ewaso Ng’iro 36.0680 -1.4602 IMU
117 RVCA 2K16 Ewaso Ng’iro 36.1160 -2.0490 IMU
118 ATHI 3AA04 Mbagathi 36.6910 -1.3230 IMU
119 ATHI 3AA06 Mbagathi 36.9820 -1.4400 IMU
120 ATHI 3BA10 Ruiruaka 36.8230 -1.2270 IMU
121 ATHI 3BA29 Nairobi 36.8100 -1.2740 IMU
122 ATHI 3BB11 Kiu 36.9310 -1.1820 IMU
123 ATHI 3BB12 Kamiti 36.9710 -1.1970 IMU
124 ATHI 3BD05 Thiririka 37.0410 -1.1540 IMU
125 ATHI 3DB01 Athi
(Wamunyu)
37.6455 -1.4107 IMU
126 ATHI 3DA02 Athi at Munyu 37.1959 -1.0893 IMU
127 ATHI 3EA02 Maruba 37.2460 -1.5190 IMU
128 ATHI 3F02 Athi
[Mavindini].
37.8460 -1.7900 IMU
129 ATHI 3F06 Kibwezi Springs 38.0760 -2.3760 IMU
130 ATHI 3F07 Kiboko 37.0950 -2.2080 IMU
131 ATHI 3F11 Little Kiboko
Hunters
37.7080 -2.2080 IMU
132 ATHI 3G02 Tsavo 38.4740 -2.9960 IMU
133 ATHI 3J 16 Lumi Kivarua 37.6952 -3.4329 IMU
134 ATHI 3J15C Lumi 37.7030 -3.3920 IMU
135 ATHI 3KB01 Ramisi 39.3730 -4.4500 IMU
136 ATHI 3KG01 Umba 39.1110 -4.5690 IMU
137 ATHI 3LA05 Voi 38.5930 -3.3930 IMU
138 ATHI 3MH26 Marere 39.4080 -4.2000 IMU
139 TANA 4AC03 Sagana 37.0430 -0.4490 IMU
140 TANA 4AC04 Chania 36.9580 -0.4210 IMU
141 TANA 4AD01 Gura 37.0760 -0.5170 IMU
142 TANA 4BB01 Ragati 37.1930 -0.6370 IMU
143 TANA 4BC05 Rwamuthambi 37.2420 -0.5850 IMU
144 TANA 4BD01 Mathioya 37.1780 -0.7140 IMU
145 TANA 4BE10 Tana Rukanga 37.2580 -0.7250 IMU
146 TANA 4BF01 Saba Saba 37.2640 -0.8640 IMU
147 TANA 4CA02 Chania 37.0630 -1.0260 IMU
148 TANA 4CB04 Thika 37.0660 -1.0210 IMU
149 TANA 4DA10 Thiba 37.3170 -0.6210 IMU
150 TANA 4DB04 Nyamindi 37.3690 -0.6150 IMU
151 TANA 4DC03 Rupingazi 37.4380 -0.5330 IMU
152 TANA 4EA06 Mutonga 37.8560 -0.2790 IMU
153 TANA 4EB06 Ruguti 37.8580 -0.3510 IMU
154 TANA 4EB07 Thuchi 37.8710 -0.3620 IMU
155 TANA 4EB11 Mara 37.8710 -0.3420 IMU
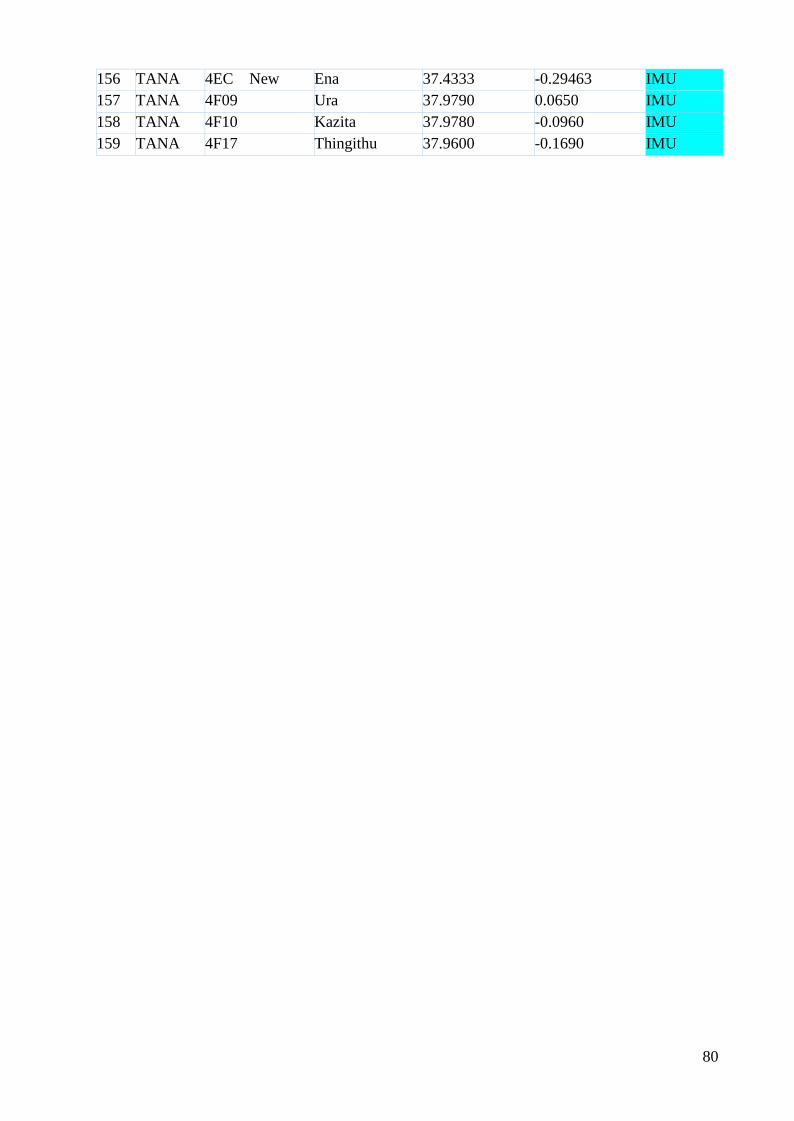
80
156 TANA 4EC New
(4EC04
Ena 37.4333 -0.29463 IMU
157 TANA 4F09 Ura 37.9790 0.0650 IMU
158 TANA 4F10 Kazita 37.9780 -0.0960 IMU
159 TANA 4F17 Thingithu 37.9600 -0.1690 IMU

81
160 TANA 4F20 Thanandu 38.0092 -0.09925 IMU
161
ENNCA
5AA01A
(5AA17)
Ewaso Narok
36.3690
0.0480
IMU
162 ENNCA 5AA05 Equator 36.3630 0.0200 IMU
163 ENNCA 5AA13 Lake Ol
Bolossat
36.4028 0.0111 IMU
164 ENNCA 5AB02 Pesi 36.5170 0.2000 IMU
165 ENNCA 5AB04 Pesi 36.5270 0.0630 IMU
166 ENNCA 5AC10 Ewaso Narok 36.7240 0.4380 IMU
167 ENNCA 5AC15 Ewaso Narok 36.5370 0.2570 IMU
168 ENNCA 5AD01 Mutara 36.5530 0.0670 IMU
169 ENNCA 5AD04 Mutara 36.6630 0.0800 IMU
170 ENNCA 5BA03 Moyok 36.8710 0.2630 IMU
171 ENNCA 5BB02 Ewaso Ng’iro 36.8670 0.1330 IMU
172 ENNCA 5BC02 Naro Moru 37.0250 0.1650 IMU
173 ENNCA 5BC05 Rongai 37.0670 0.0420 IMU
174 ENNCA 5BC06 Burguret 37.0380 0.1090 IMU
175 ENNCA 5BC08 Engare Ngobit 36.7830 0.0500 IMU
176 ENNCA 5BD02 Surugoi 36.6030 0.0760 IMU
177 ENNCA 5BE01 Nanyuki 37.0770 0.0210 IMU
178 ENNCA 5BE02 Ontulili 37.1390 0.0400 IMU
179 ENNCA 5BE05 Teleswani 37.2300 0.0830 IMU
180 ENNCA 5BE06 Timau 37.2420 0.0880 IMU
181 ENNCA 5BE07 Likii 37.0870 0.0210 IMU
182 ENNCA 5BE19 Ngusishi 37.2610 0.1000 IMU
183 ENNCA 5BE21 Nanyuki 37.0280 0.1320 IMU
184 ENNCA 5BE22 Sirimon 37.2000 0.0610 IMU
185 ENNCA 5D02 (5DA01) Ngare Nything 37.4228 0.1814 IMU
186 ENNCA 5D04 (5DA02) Ngare Ndare 37.3440 0.1860 IMU
187 ENNCA 5D10 (5DA03) Rugusu
(Western
Marania)
37.4744 0.1933 IMU
188 ENNCA 5D11 (5DA04) Kithima
(Marania
Ruguthu)
37.4908 0.2006 IMU
189 ENNCA 5D14 (5DA05) Likiundu 37.8040 0.2330 IMU
190 ENNCA 5D-NEW
(5DA06)
Ewaso Ngiro 37.5310 0.5666 IMU
191 LVN 1CA02 Sergoit 35.0667 0.6333 Special
192 LVN 1AD03 Malakisi 34.3389 0.6236 Special
193 LVN 1CB05 Sosiani 35.0903 0.6264 Special

82
194 LVN 1EB02 Isiukhu 34.7500 0.2542 Special
195 LVN 1FC01 Kimondi 35.0486 0.2000 Special
196 LVN 1FE02 Yala 34.9361 0.1833 Special
197 LVN 1FG03 Yala 34.1427 0.0060 Special

83
198 LVS 1GD02 Nyando 35.1569 -0.1694 Special
199 RVCA 2FC13B Sewage Effluent 36.1310 -0.3790 Special
200 ATHI 3ED01 Thwake 37.8280 -1.7850 Special
201 ATHI 3G03 Mzima springs 38.0280 -3.0140 Special
202 ATHI 3G06 Nor Turesh 37.5680 -2.9580 Special
203 TANA 4AA05 Sagana 37.0390 -0.4430 Special
204 TANA 4AB01 Muringato 36.9430 -0.4000 Special
205 TANA 4AB06 Amboni 36.9920 -0.4070 Special
206 TANA 4CC03 Yatta Furrow 37.3610 -1.0940 Special
207 TANA 4DA New
(4DA14
Thiba 37.46479 -0.7176 Special
208 TANA 4DC06 II Kapingazi 37.4500 -0.4830 Special
209 TANA 4EA03 Kithino 37.6810 -0.1020 Special
210 TANA 4EB09 Tungu 37.6600 -0.3040 Special
211 TANA 4F08 Thangatha 37.9740 0.0480 Special
212 TANA 4F13 Tana Grand
Falls
38.0180 -0.2850 Special
213 TANA 4F16 Tana 38.0092 -0.0766 Special
214 TANA 4F28 Rujirweru 38.0608 -0.2159 Special
215 TANA 4G02 Tana Garsen 40.1170 -2.2750 Special
216 ENNCA 5D-
OLDONYIRO
(5DC02)
Ewaso Ngiro 36.8707 0.5992 Special
217 ENNCA 5E06 (5EC01) Bakuli Springs 37.9900 2.3325 Special
218 ENNCA 5E-NEW
(5EC02)
Ngurunit
Springs
37.2757 1.7205 Special
219 ENNCA 5H01 (5HA01) Daua River 41.8756 3.9694 Special

Water Situation Report, 2015/16
ANNEX 3 Instrumentation of Monitoring Boreholes
Table 5.4: Borehole instrumentation
S/No. Borehole Name Remarks
1 Kakamega General Hospital C
7006
Airline
2 Tande Airline
3 Shamiloli Airline
4 Shillom Airline
5 Siaya DH Airline
6 Mwikalikha Airline
7 Kapsabet Girls Sec C11403 Airline
8 TMC Observation borehole
9 Kapsabet Boys Sec Sch. Airline
10 Bethesda C-7053 Airline
11 Kitinda Observation borehole
12 Bungoma Bible Children’s
home
Airline
13 Moi’s Bridge C-10604 Airline
14 Bungoma Ded Automated
15 Busia Prison C-9590 Observation borehole
16 Kitale Club Airline
17 Kitale Seed Observation borehole
18 Kabatini(DB) Automatic
19 Kabatini Airline
20 St. Mary’s Airline
21 Baharini Airline
22 Naivasha MW&I Airline
23 Panda Airline
24 Kinyanjui/Naivasha Airline
25 Mayflower/Naivasha Airline
26 Ayub suleiman Airline
27 M.O.W.D. Airline
28 Katakala Airline
29 carzam Airline
30 Marula Automatic
31 Subati Airline
32 Rongai (DB) Automatic
33 Kacheliba Hospital Airline
34 Cherombai Pri. sch Airline

Water Situation Report, 2015/16
35 St Cecilia Girls Airline
36 Kacheliba mixed Airline
37 Chepkobe comm bh Airline
38 Cheptianga comm bh Airline
39 BCFC Airline
40 Ngoswani comm.bh Airline
41 Rift Valley academy Airline
42 RVA Airline
43 TD Jakes Airline
44 EOR Ekule Airline
45 Nkairimiran Airline
46 Lodwar BH 1.C Automatic
47 Nariokotome BH Automatic
48 Narengewoi BH 2 Automatic
49 Lopwarin Automatic
50 Lemotit Airline
51 James Finlay Airline
52 Mercy Girls School Airline
53 Taita Towett Airline not in place
54 KPA Airline
55 KEMRI 1 Observation well, no airline
56 KEMRI 2 Airline
57 Trinity Maseno Airline
58 Ndori B/H Airline not in place
59 Kinyose spring Discharge measurements taken by
manual means 60 Ngandalel Dispensary borehole Airline
61 Withur Community Borehole Airline
62 Ainamoi Borehole Airline
63 Kiambu District Hospital Airline
64 Limuru DO’s Offic Airline
65 Gnt, Juja Airline
66 Eastern flour mills Airline
67 Machakos school for
Handicapped
Airline
68 Bishop Kioko Hosp. Airline
69 Kabete NCC Airline
70 Riverside Park Airline

Water Situation Report, 2015/16
71 St. Lawrence University Airline
72 Kenya High School Automated- equipped with data
logger 73 Jorgen Ladaforgd Airline
74 Hotel Boulevard Airline
75 Unilever Airline
76 Kenya Polytechnic Automated- equipped with data
logger 77 Karen Country Club Airline
78 Anthony Ngotho Airline
79 Hillcrest Karen Airline
80 Tiwi BH 1 Automated-Has a data logger
81 Tiwi BH C Airline
82 KICC Airline
83 Hindu Temple Airline
84 Trufoods Airline
85 Uchumi Supermarket (Ngong
Rd)
Airline
86 Kabansora millers Airline
87 GTI Mombasa Airline
88 Lake Kenyatta Well No.5 Airline
89 Witu Well Field Piezometer
well No.3
Airline
90 Hindi Well Field Monitoring
Well
Airline
91 Meru Show Ground Airline
92 Mbirikine Airline
93 Materini Community Borehole Airline
94 Ndoleli Methodist Church Airline
95 Ngondi Airline
96 Ciakariga Airline
97 St. Francis Assisi- Mitunguu Airline
98 Rubate Teachers College Airline
99 Karaba Mission Airline
100 Don Bosco Airline
101 Ruturi Monitoring Borehole Airline
102 Siakago Secondary School Airline
103 Kids Alive Airline
104 Kamuhuria Airline
105 Makuyu Police Station Airline
106 Ichaki Catholic Parish Airline
107 Maragua Muslim Mosque Airline

Water Situation Report, 2015/16
108 Muthithi Secondarys School Airline
109 Thika Muslim College Airline
110 DWO Muranga Airline
111 Mwangu Secondary School Airline
112 Kiganjo Community Borehole Airline
113 Catholic Mission Carmelite Airline
114 Nyeri Technical Institute Airline
115 Nyumbani Village Airline
116 Kanyongonyo Airline
117 Atongoi Primary School Airline
118 Itumba Airline
119 Kyatune Airline
120 Kaluva Secondary School Airline
121 Nzambini Secondary School Airline
122 Tyaa Kamuthale Airline
123 Aikman Airline
124 Backlit Airline
125 Nanyuki childrens Home Airline
126 Lolmalick b/h3 Airline
127 Kibwi Farm Airline
129 Primarosa 1 Airline
130 Tabor Hill 2 Airline
131 Kihingo Dispensary Airline
132 Chereta Airline
133 Familia Takatifu Airline
134 RUIRI Airline
135 MATABITHI Airline
136 KARGI Airline
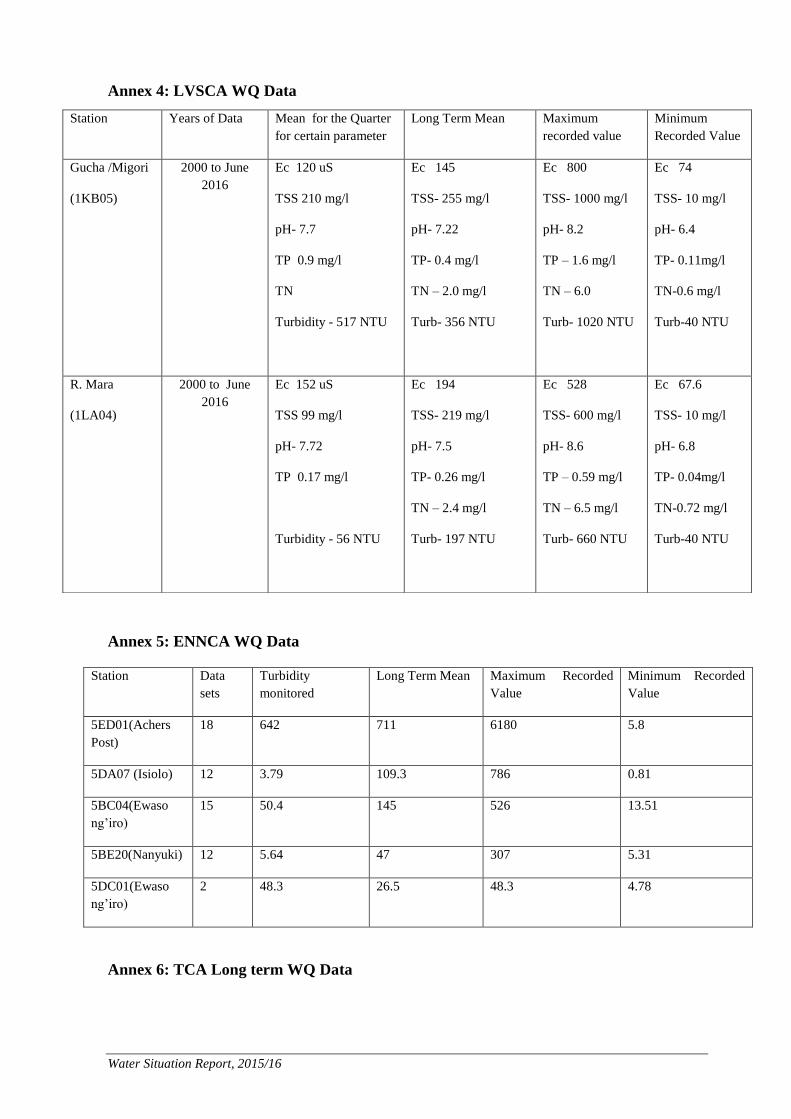
Water Situation Report, 2015/16
Annex 4: LVSCA WQ Data
Annex 5: ENNCA WQ Data
Station Data
sets
Turbidity
monitored
Long Term Mean Maximum Recorded
Value
Minimum Recorded
Value
5ED01(Achers
Post)
18 642 711 6180 5.8
5DA07 (Isiolo) 12 3.79 109.3 786 0.81
5BC04(Ewaso
ng’iro)
15 50.4 145 526 13.51
5BE20(Nanyuki) 12 5.64 47 307 5.31
5DC01(Ewaso
ng’iro)
2 48.3 26.5 48.3 4.78
Annex 6: TCA Long term WQ Data
Station Years of Data Mean for the Quarter
for certain parameter
Long Term Mean Maximum
recorded value
Minimum
Recorded Value
Gucha /Migori
(1KB05)
2000 to June
2016
Ec 120 uS
TSS 210 mg/l
pH- 7.7
TP 0.9 mg/l
TN
Turbidity - 517 NTU
Ec 145
TSS- 255 mg/l
pH- 7.22
TP- 0.4 mg/l
TN – 2.0 mg/l
Turb- 356 NTU
Ec 800
TSS- 1000 mg/l
pH- 8.2
TP – 1.6 mg/l
TN – 6.0
Turb- 1020 NTU
Ec 74
TSS- 10 mg/l
pH- 6.4
TP- 0.11mg/l
TN-0.6 mg/l
Turb-40 NTU
R. Mara
(1LA04)
2000 to June
2016
Ec 152 uS
TSS 99 mg/l
pH- 7.72
TP 0.17 mg/l
Turbidity - 56 NTU
Ec 194
TSS- 219 mg/l
pH- 7.5
TP- 0.26 mg/l
TN – 2.4 mg/l
Turb- 197 NTU
Ec 528
TSS- 600 mg/l
pH- 8.6
TP – 0.59 mg/l
TN – 6.5 mg/l
Turb- 660 NTU
Ec 67.6
TSS- 10 mg/l
pH- 6.8
TP- 0.04mg/l
TN-0.72 mg/l
Turb-40 NTU

Water Situation Report, 2015/16
Annex 7: Turbidity, RVCA
Station Years of Data
Mean for
TSS for
Year 2015
Long Term
Mean
Maximum
Recorded Value
Minimum
Recorded
Value
2EH1 L. Baringo 9 14 40.83 146 2
2EB10 L. Bogoria 8 208.5 88.13 394 17
2FA9 L. Elementaita 8 97 176.5 364 97
2GD6 L. Naivasha 10 40 22.5 67 7
Station Years of
Data
Mean for Year XX for
certain parameter
Long Term
Mean
Maximum
Recorded Value
Minimum
Recorded Value
River Tana-Garissa
(RGS 4G01)
December
2013 to
February
2015
pH pH=7.6 pH =7.8 pH=7.11
2013* -7.48
2014 -7.74 Turbidity
(NTU) =2031.4
Turbidity
(NTU) =9442.5
Turbidity
(NTU) =205
2015 -7.23
2016* -7.7
Turbidity (NTU) Electrical
conductivity
(µS/cm)= 162.3
Electrical
conductivity
(µS/cm)= 196.2
Electrical
conductivity
(µS/cm)=138
.2
2013* -875
2014 -4253.8
2015 -547.6
2016* -230.7
Electrical conductivity
2013*-145.9
2014 -177.4
2015 -158.2
2016* -138.7
Dissolved oxygen
2015*-1.79 mg/l

Water Situation Report, 2015/16
2FC4 L. Nakuru 8 46 164.28 377 45
2EE7 Perkerra R. 5 223 322.7 1800 5
2C7 Kerio 7 75.6 487.5 3200 7
Annex 8: WQ Data for Stations in ACA
Station Station ID
Altitude
GPS Date Temp. pH E.C TDS D.Oxygen Turbidity Salinity
Mbagathi River At Rongai Bridge
3AA04 X 0273911, Y 9840191
15/2/2016 22.5 7.05 548.1 350.8 4.75 37.1
Nairobi River At Museum Hill
3BA29 X 0256574, Y 9859024
15/2/2016 23.4 7.01 534.4 342.0 7.33 19.2
Ruirwaka River At Runda Bridge
3BA10 X 0256780, Y 9864780
15/2/2016 20.4 5.93 119.6 76.5 7.45 56.7
Mbagathi River At Rongai Bridge
3AA04 X 0273911, Y 9840191
15/3/2016
20.3 - 502 321.3 - >10 0.2
Nairobi River At Museum Hill
3BA29 X 0256574, Y 9859024
16/3/2016
20.6 - 666 426.2 - >10 0.3
Ruiruaka River At Runda Bridge
3BA10 X 0256780, Y 9864780
16/3/2016
19.4 - 168.6 107.9 - >10 0
Mbagathi River At Rongai
3AA04 X 0286822, Y 9858057
18/3/2016
27.6 - 537 343.7 - >10 0.2
Nairobi River At Museum Hill
3BA29 X 0273911, Y 9840191
15/3/2016
Ruirwaka River At Runda
3BA10 X 0256574, Y 9859024
16/3/2016
Athi River At Kamulu
3AB02 X 0256780, Y 9864780
16/3/2016
Mbagathi River At Rongai
3AA04 X 0286822, Y
18/3/2016

Water Situation Report, 2015/16
Bridge 9858057
Nairobi River At Museum Hill
3BA29 X 0273911, Y 9840191
15/3/2016
Ruiruaka River At Runda Bridge
3BA10 X 0256574, Y 9859024
16/3/2016
Ruiruaka River At Runda
X 0256780,
Y 9864780 4/26/2016 20 6.98
141.8 90.8 1.81 424
Nairobi River At Museum Hill
X 0256574,
Y 9859024 4/26/2016 25.1 6.8
463.1 296.4 2.76 224
Annex 9: Sediment Loads, LVNCA
1 Station Years of
data
2014/2016
Mean for the year
2015/2016 for
sediment tons/day
Long
term
mean
Maximu
m
recorded
values
Minimum
recorded
values
2 Malakisi (1AD02, N) 137 614 1.35
3 Malaba (1AA02, N) 228 3,688.2 1.09
4 Sio (1AH01, N) 245 608 20
5 Nzoia at Ruambwa
(1EF01,N)
3,363 3638.5 26.38
6 Yala at Bondo
(1FG02, N)
242 550 21
7 Koitobos ( 1BE02,
MU)
168 3110 3.2
8 Nzoia at Mumias
(1DD01, MU)
1,661 5,146 44
9 Isiukhu ( 1EB02, MU) 158 1,376 2.82
10 Nzoia at Brigadier
(1BD02, MU)
70 93 4.2
11 Lusumu ( 1ED01,
MU)
571 4,321 2.63
12 Wuroya (1EG02, MU) 74 210 0.7
13 Kipkaren (1CE01, 73 349 4

Water Situation Report, 2015/16
MU)
14 Nzoia at Webuye
(1DA02, MU)
860 3,894 34
15 Kuywa at Matisi
(1DB01, MU)
286 393 60
16 Malakisi (1AD02, N) 137 614 9
17 Malaba (1AA02, N) 228 3642.75 28.15
18 Sio (1AH01, N) 245 608 48
19 Nzoia at Ruambwa
(1EF01,N)
3,363 5,362.30 88.61
20 Yala at Bondo
(1FG02, N)
242 550 21