Embed Size (px)
Citation preview
This article was downloaded by: [Northeastern University]On: 07 October 2014, At: 07:59Publisher: RoutledgeInforma Ltd Registered in England and Wales Registered Number: 1072954Registered office: Mortimer House, 37-41 Mortimer Street, London W1T 3JH,UK
International Journal ofEnvironmental StudiesPublication details, including instructions forauthors and subscription information:http://www.tandfonline.com/loi/genv20
Water Management In TextileIndustry: Technical AndEconomic AspectsN. M. H. EL Defrawy aa Chemical Engineering and Pilot Plant Department ,National Research Centre , Tahrir Street, Dokki,Cairo, EgyptPublished online: 17 Sep 2010.
To cite this article: N. M. H. EL Defrawy (2002) Water Management In TextileIndustry: Technical And Economic Aspects, International Journal of EnvironmentalStudies, 59:5, 573-587, DOI: 10.1080/00207230212730
To link to this article: http://dx.doi.org/10.1080/00207230212730
PLEASE SCROLL DOWN FOR ARTICLE
Taylor & Francis makes every effort to ensure the accuracy of all theinformation (the “Content”) contained in the publications on our platform.However, Taylor & Francis, our agents, and our licensors make norepresentations or warranties whatsoever as to the accuracy, completeness,or suitability for any purpose of the Content. Any opinions and viewsexpressed in this publication are the opinions and views of the authors, andare not the views of or endorsed by Taylor & Francis. The accuracy of theContent should not be relied upon and should be independently verified withprimary sources of information. Taylor and Francis shall not be liable for anylosses, actions, claims, proceedings, demands, costs, expenses, damages,and other liabilities whatsoever or howsoever caused arising directly orindirectly in connection with, in relation to or arising out of the use of theContent.

This article may be used for research, teaching, and private study purposes.Any substantial or systematic reproduction, redistribution, reselling, loan,sub-licensing, systematic supply, or distribution in any form to anyone isexpressly forbidden. Terms & Conditions of access and use can be found athttp://www.tandfonline.com/page/terms-and-conditions
Dow
nloa
ded
by [
Nor
thea
ster
n U
nive
rsity
] at
07:
59 0
7 O
ctob
er 2
014
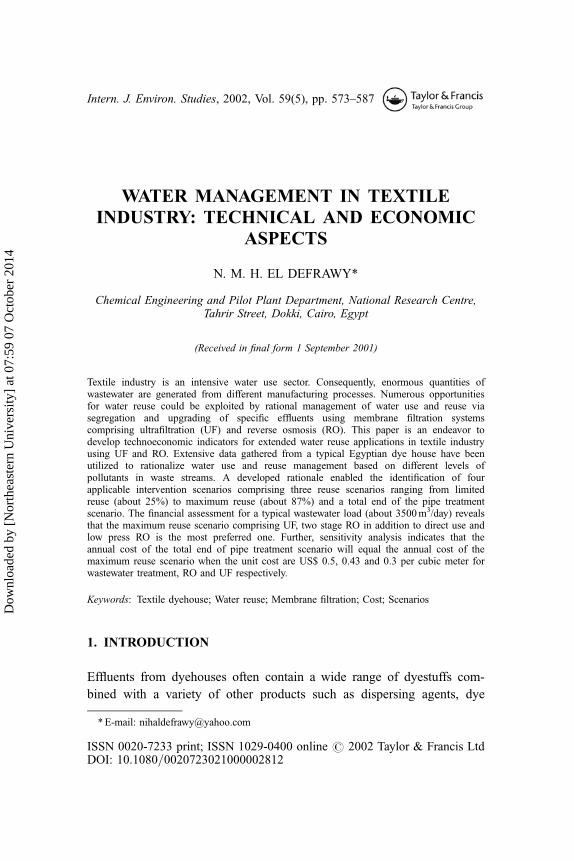
Intern. J. Environ. Studies, 2002, Vol. 59(5), pp. 573–587
WATER MANAGEMENT IN TEXTILEINDUSTRY: TECHNICAL AND ECONOMIC
ASPECTS
N. M. H. EL DEFRAWY*
Chemical Engineering and Pilot Plant Department, National Research Centre,Tahrir Street, Dokki, Cairo, Egypt
(Received in final form 1 September 2001)
Textile industry is an intensive water use sector. Consequently, enormous quantities ofwastewater are generated from different manufacturing processes. Numerous opportunitiesfor water reuse could be exploited by rational management of water use and reuse viasegregation and upgrading of specific effluents using membrane filtration systemscomprising ultrafiltration (UF) and reverse osmosis (RO). This paper is an endeavor todevelop technoeconomic indicators for extended water reuse applications in textile industryusing UF and RO. Extensive data gathered from a typical Egyptian dye house have beenutilized to rationalize water use and reuse management based on different levels ofpollutants in waste streams. A developed rationale enabled the identification of fourapplicable intervention scenarios comprising three reuse scenarios ranging from limitedreuse (about 25%) to maximum reuse (about 87%) and a total end of the pipe treatmentscenario. The financial assessment for a typical wastewater load (about 3500 m3/day) revealsthat the maximum reuse scenario comprising UF, two stage RO in addition to direct use andlow press RO is the most preferred one. Further, sensitivity analysis indicates that theannual cost of the total end of pipe treatment scenario will equal the annual cost of themaximum reuse scenario when the unit cost are US$ 0.5, 0.43 and 0.3 per cubic meter forwastewater treatment, RO and UF respectively.
Keywords: Textile dyehouse; Water reuse; Membrane filtration; Cost; Scenarios
1. INTRODUCTION
Effluents from dyehouses often contain a wide range of dyestuffs com-
bined with a variety of other products such as dispersing agents, dye
* E-mail: [email protected]
ISSN 0020-7233 print; ISSN 1029-0400 online # 2002 Taylor & Francis LtdDOI: 10.1080=0020723021000002812
Dow
nloa
ded
by [
Nor
thea
ster
n U
nive
rsity
] at
07:
59 0
7 O
ctob
er 2
014
bath carriers, salts, emulsifiers, leveling agents as well as hazardous sub-
stances such as solvents and heavy metals. The presence of these chemi-
cals in the wastewater often has a pronounced effect on water quality
parameters such as pH, BOD, COD, TOC, TDS and color. Although
most dyestuffs have a low BOD value, they add TOC and noticeable
color to the water. Commercial pollution control technologies for treat-
ment of such wastes are usually sophisticated and expensive. On the
other hand, volume reduction strategies can significantly reduce the
cost of setting and operating the required treatment or even eliminate
its need [1, 2].
Recent trends adopted as an alternative to the discharge of exhausted
batch processes include applying recycling methods to one or more of its
operation whether directly or after applying some sort of pre-treatment
before recycling. Typical examples include conventional filtration used
before the reuse of bleach rinse water [3], UF used for the recovery of poly-
vinyl alcohol (PVA) utilized for sizing [4], caustic soda used for merceriza-
tion [5] and indigo dye recovery [6–8], as well as RO systems used for the
recovery of both dyes and hot water in continuous dyeing [9]. Usually, the
key to optimize water and energy use, is to design the processes and recycle
systems in a fully automated fashion [1].
Numerous textile dyeing and finishing plants in Egypt have been sub-
jected to environmental management studies in the last decade through
different programs such as the Environmental Pollution Prevention Pro-
gram (EP3) funded by USAID, and Support for Environmental Assess-
ment and Management (SEAM) funded by Overseas Development
Agency. The major objectives were to identity affordable opportunities
for material re-use or recovery. Further, seeking efficient energy use
was also a core objective within the whole waste minimization and sus-
tainable resource use programs. In real practices, many of the recom-
mended opportunities have not been implemented due to numerous
limitations including lack of capital investments and difficulties developed
when attempting to change deeply routed inefficient practices. This paper
focuses on the first obvious aspect, which is water minimization and
reuse capitalizing on available resources and expertise. A rather practical
approach is developed to rationalize the use of materials and to rationally
arrange the train of theoretically feasible opportunities in such a way that
simple things come, first to enable phased implementation based on
results achieved and resources secured.
574 N. M. H. EL DEFRAWY
Dow
nloa
ded
by [
Nor
thea
ster
n U
nive
rsity
] at
07:
59 0
7 O
ctob
er 2
014
FIG
UR
E1
Blo
ckd
iag
ram
for
cott
on
pre
par
atio
nan
dd
yei
ng.
TEXTILE INDUSTRY 575
Dow
nloa
ded
by [
Nor
thea
ster
n U
nive
rsity
] at
07:
59 0
7 O
ctob
er 2
014
2. SITUATION ANALYSES
2.1. Wet Processes in Typical Textile Mills
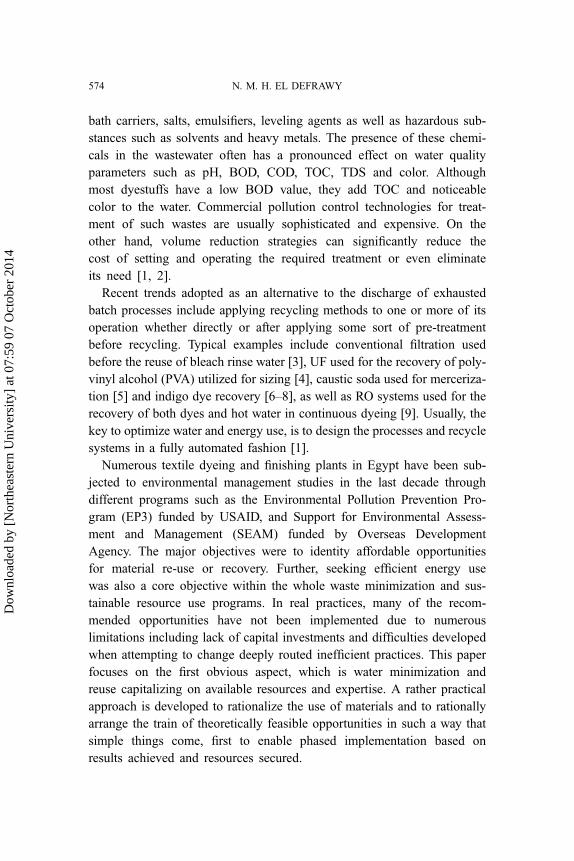
The major manufacturing operations characterized by medium to intensive
water use comprise firstly, preparation encompassing desizing, scouring,
mercerization and bleaching, secondly dyeing and/or printing and finally fin-
ishing including rinsing, neutralization and softening. Typical manufacturing
practices for cotton preparation, dyeing and finishing are shown in Figure 1.
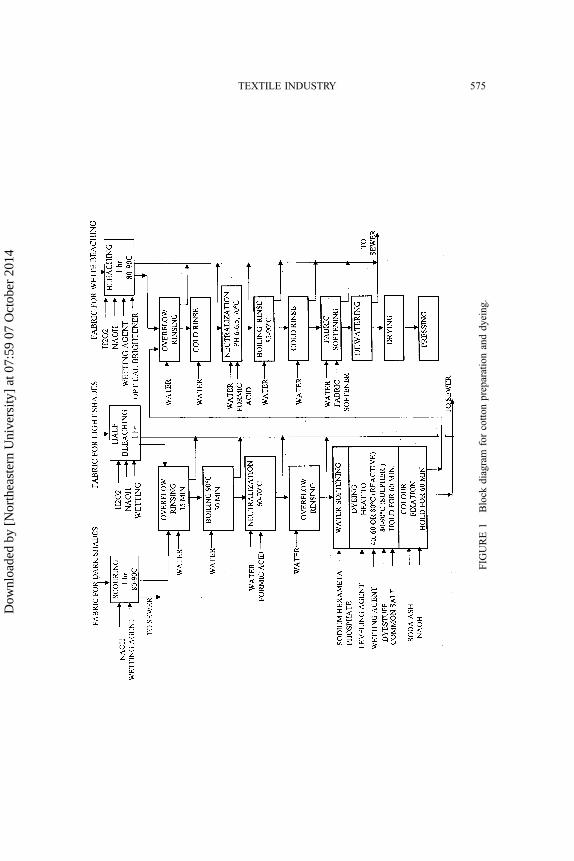
2.2. Typical Water Use and Wastewater Norms
Typical norms for water use and wastewater generation are illustrated in
Figures 2–4 based on current environmental management in Egyptian tex-
tile industry [10, 11]. It is obvious that marked variations exist due to
difference in practices, materials use and adopted technologies.
2.3. Wastewater Characteristics
Typical characteristics of effluents generated by different processes perti-
nent to water reuse in a dye house are shown in Table I [10]. It is observed
that mercerization and bleach rinses can be recycled with minimal pretreat-
ment (e.g. filtration). Further, streams such as neutralization and overflow
FIGURE 2 Water consumption rates for the various activities in knitted goods.
576 N. M. H. EL DEFRAWY
Dow
nloa
ded
by [
Nor
thea
ster
n U
nive
rsity
] at
07:
59 0
7 O
ctob
er 2
014
rinsing could be recycled after moderate appropriate intervention while the
remaining streams require end of pipe treatment or intensive processing be-
fore recycling. Typical characteristics of end of pipe stream are given in
Table II [11, 12].
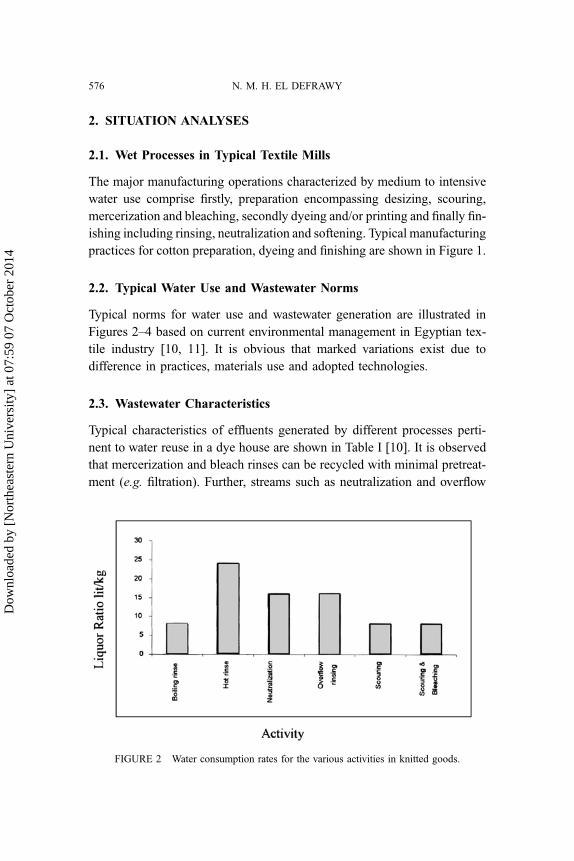
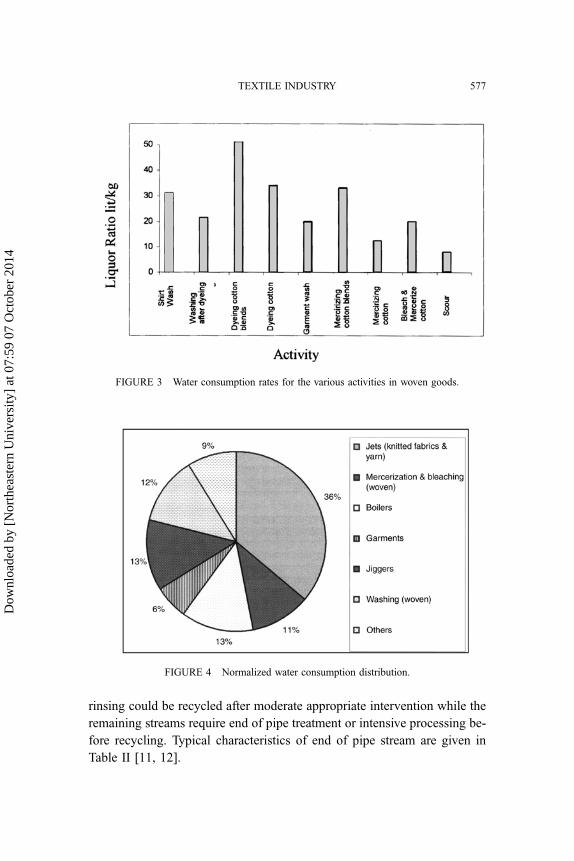
FIGURE 3 Water consumption rates for the various activities in woven goods.
FIGURE 4 Normalized water consumption distribution.
TEXTILE INDUSTRY 577
Dow
nloa
ded
by [
Nor
thea
ster
n U
nive
rsity
] at
07:
59 0
7 O
ctob
er 2
014
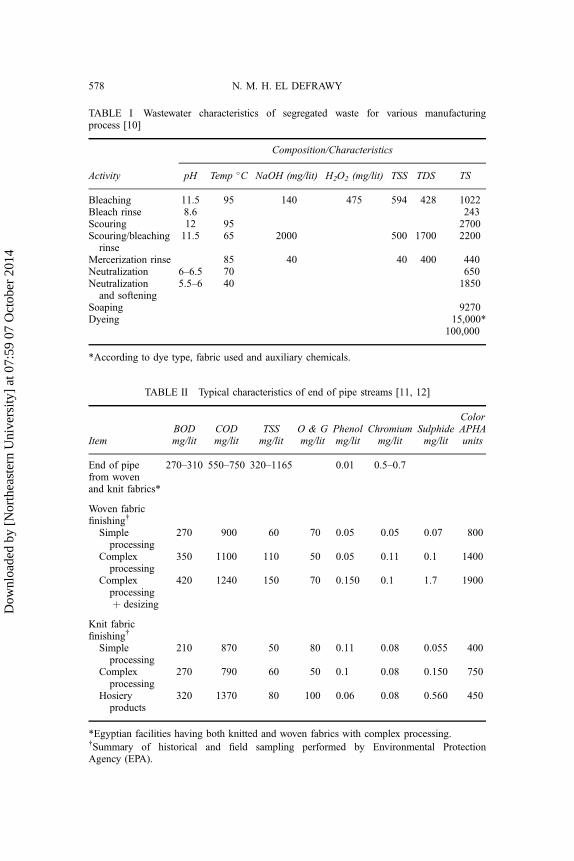
TABLE I Wastewater characteristics of segregated waste for various manufacturingprocess [10]
Composition/Characteristics
Activity pH Temp �C NaOH (mg/lit) H2O2 (mg/lit) TSS TDS TS
Bleaching 11.5 95 140 475 594 428 1022Bleach rinse 8.6 243Scouring 12 95 2700Scouring/bleaching
rinse11.5 65 2000 500 1700 2200
Mercerization rinse 85 40 40 400 440Neutralization 6–6.5 70 650Neutralization
and softening5.5–6 40 1850
Soaping 9270Dyeing 15,000*
100,000
*According to dye type, fabric used and auxiliary chemicals.
TABLE II Typical characteristics of end of pipe streams [11, 12]
ItemBODmg/lit
CODmg/lit
TSSmg/lit
O & Gmg/lit
Phenolmg/lit
Chromiummg/lit
Sulphidemg/lit
ColorAPHAunits
End of pipefrom woven
270–310 550–750 320–1165 0.01 0.5–0.7
and knit fabrics*
Woven fabricfinishing{
Simpleprocessing
270 900 60 70 0.05 0.05 0.07 800
Complexprocessing
350 1100 110 50 0.05 0.11 0.1 1400
Complexprocessing
420 1240 150 70 0.150 0.1 1.7 1900
þ desizing
Knit fabricfinishing{
Simpleprocessing
210 870 50 80 0.11 0.08 0.055 400
Complexprocessing
270 790 60 50 0.1 0.08 0.150 750
Hosieryproducts
320 1370 80 100 0.06 0.08 0.560 450
*Egyptian facilities having both knitted and woven fabrics with complex processing.{Summary of historical and field sampling performed by Environmental ProtectionAgency (EPA).
578 N. M. H. EL DEFRAWY
Dow
nloa
ded
by [
Nor
thea
ster
n U
nive
rsity
] at
07:
59 0
7 O
ctob
er 2
014
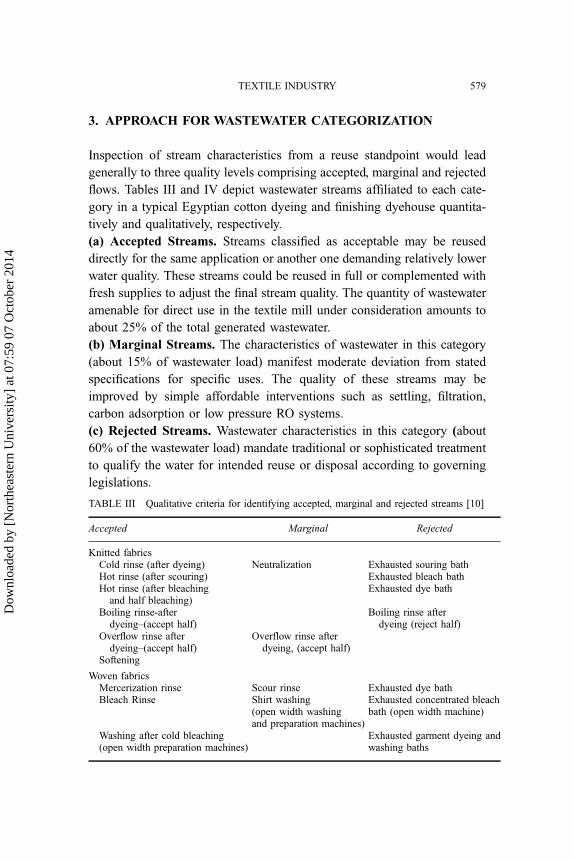
3. APPROACH FOR WASTEWATER CATEGORIZATION
Inspection of stream characteristics from a reuse standpoint would lead
generally to three quality levels comprising accepted, marginal and rejected
flows. Tables III and IV depict wastewater streams affiliated to each cate-
gory in a typical Egyptian cotton dyeing and finishing dyehouse quantita-
tively and qualitatively, respectively.
(a) Accepted Streams. Streams classified as acceptable may be reused
directly for the same application or another one demanding relatively lower
water quality. These streams could be reused in full or complemented with
fresh supplies to adjust the final stream quality. The quantity of wastewater
amenable for direct use in the textile mill under consideration amounts to
about 25% of the total generated wastewater.
(b) Marginal Streams. The characteristics of wastewater in this category
(about 15% of wastewater load) manifest moderate deviation from stated
specifications for specific uses. The quality of these streams may be
improved by simple affordable interventions such as settling, filtration,
carbon adsorption or low pressure RO systems.
(c) Rejected Streams. Wastewater characteristics in this category (about
60% of the wastewater load) mandate traditional or sophisticated treatment
to qualify the water for intended reuse or disposal according to governing
legislations.
TABLE III Qualitative criteria for identifying accepted, marginal and rejected streams [10]
Accepted Marginal Rejected
Knitted fabricsCold rinse (after dyeing) Neutralization Exhausted souring bathHot rinse (after scouring) Exhausted bleach bathHot rinse (after bleaching
and half bleaching)Exhausted dye bath
Boiling rinse-after Boiling rinse afterdyeing–(accept half) dyeing (reject half)
Overflow rinse afterdyeing–(accept half)
Overflow rinse afterdyeing, (accept half)
Softening
Woven fabricsMercerization rinse Scour rinse Exhausted dye bathBleach Rinse Shirt washing Exhausted concentrated bleach
(open width washingand preparation machines)
bath (open width machine)
Washing after cold bleaching(open width preparation machines)
Exhausted garment dyeing andwashing baths
TEXTILE INDUSTRY 579
Dow
nloa
ded
by [
Nor
thea
ster
n U
nive
rsity
] at
07:
59 0
7 O
ctob
er 2
014
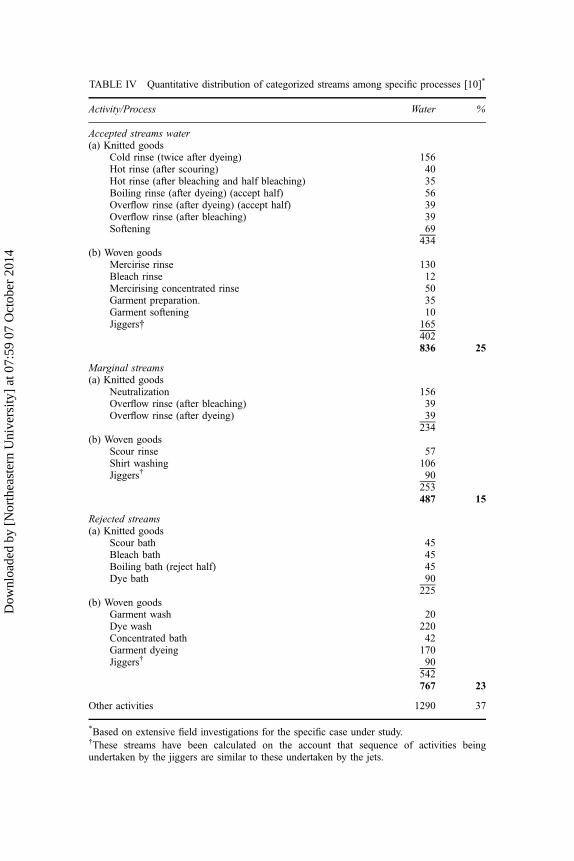
TABLE IV Quantitative distribution of categorized streams among specific processes [10]*
Activity/Process Water %
Accepted streams water(a) Knitted goods
Cold rinse (twice after dyeing) 156Hot rinse (after scouring) 40Hot rinse (after bleaching and half bleaching) 35Boiling rinse (after dyeing) (accept half) 56Overflow rinse (after dyeing) (accept half) 39Overflow rinse (after bleaching) 39Softening 69
434(b) Woven goods
Mercirise rinse 130Bleach rinse 12Mercirising concentrated rinse 50Garment preparation. 35Garment softening 10Jiggers{ 165
402836 25
Marginal streams(a) Knitted goods
Neutralization 156Overflow rinse (after bleaching) 39Overflow rinse (after dyeing) 39
234(b) Woven goods
Scour rinse 57Shirt washing 106Jiggers{ 90
253487 15
Rejected streams(a) Knitted goods
Scour bath 45Bleach bath 45Boiling bath (reject half) 45Dye bath 90
225(b) Woven goods
Garment wash 20Dye wash 220Concentrated bath 42Garment dyeing 170Jiggers{ 90
542767 23
Other activities 1290 37
*Based on extensive field investigations for the specific case under study.{These streams have been calculated on the account that sequence of activities beingundertaken by the jiggers are similar to these undertaken by the jets.
Dow
nloa
ded
by [
Nor
thea
ster
n U
nive
rsity
] at
07:
59 0
7 O
ctob
er 2
014
4. APPLICABLE INTERVENTION SCENARIOS
The analysis of the situation pertinent to the case under considerations
(which is similar to numerous Egyptian dyehouses) led to the development
of four scenarios involving the following basic processes:
� Direct use of selected streams containing specific chemicals, thus
achieving considerable benefits.
� Biological treatment of part or all generated effluents.
� Membrane filtration schemes comprising UF, RO or combinations of both
technologies are used to achieve the desired removal of suspended and
dissolved matter. UF will remove suspended matter, colloids and dissolved
organics in the (0.001–0.1) mm range, and also separates most of the dyes
and surfactants. Metal ions and residual soluble organics will be removed
with low pressure RO. To maximize water recovery and reduce RO brine
disposal requirements, a two-stage RO system has been also incorporated.
� Anaerobic treatment unit for the effluents resulting from UF retentate.
� Evaporation pond for the concentrate of the RO.
The developed scenarios, which comprise three, reuse scenarios and total
end of pipe treatment are depicted in Figure (5).
5. ASSESSMENT OF THE PROPOSED SCENARIOS
Assessment of the proposed scenarios is based on the following considera-
tions:
� Capital, operating and maintenance (O & M) costs required to implement
each scenario.
� Payback period (the time required to recover the capital cost). This is
valid only for the reuse scenarios.
� The net benefits achieved due to the application of a specific scenario.
� The anticipated environmental impacts.
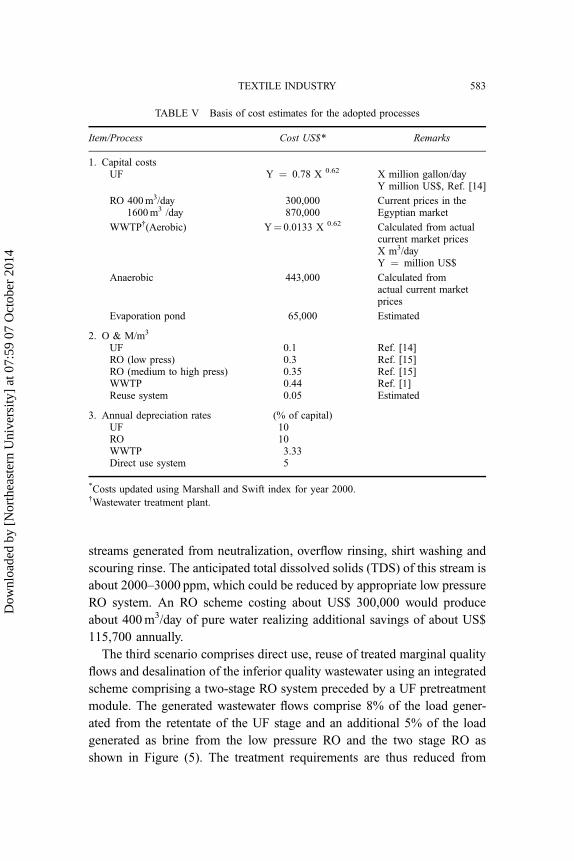
Tables V and VI compile basis of cost assumptions, estimated costs and
benefits for the specific processes for a textile complex of water consump-
tion of about 3200–3700 m3/day. Analysis of the proposed scenarios indi-
cates the following:
TEXTILE INDUSTRY 581
Dow
nloa
ded
by [
Nor
thea
ster
n U
nive
rsity
] at
07:
59 0
7 O
ctob
er 2
014
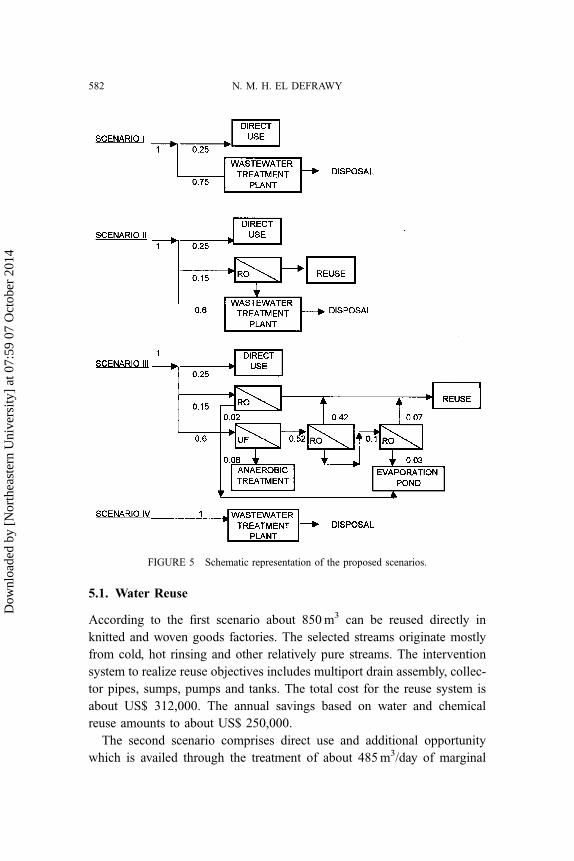
5.1. Water Reuse
According to the first scenario about 850 m3 can be reused directly in
knitted and woven goods factories. The selected streams originate mostly
from cold, hot rinsing and other relatively pure streams. The intervention
system to realize reuse objectives includes multiport drain assembly, collec-
tor pipes, sumps, pumps and tanks. The total cost for the reuse system is
about US$ 312,000. The annual savings based on water and chemical
reuse amounts to about US$ 250,000.
The second scenario comprises direct use and additional opportunity
which is availed through the treatment of about 485 m3/day of marginal
FIGURE 5 Schematic representation of the proposed scenarios.
582 N. M. H. EL DEFRAWY
Dow
nloa
ded
by [
Nor
thea
ster
n U
nive
rsity
] at
07:
59 0
7 O
ctob
er 2
014
streams generated from neutralization, overflow rinsing, shirt washing and
scouring rinse. The anticipated total dissolved solids (TDS) of this stream is
about 2000–3000 ppm, which could be reduced by appropriate low pressure
RO system. An RO scheme costing about US$ 300,000 would produce
about 400 m3/day of pure water realizing additional savings of about US$
115,700 annually.
The third scenario comprises direct use, reuse of treated marginal quality
flows and desalination of the inferior quality wastewater using an integrated
scheme comprising a two-stage RO system preceded by a UF pretreatment
module. The generated wastewater flows comprise 8% of the load gener-
ated from the retentate of the UF stage and an additional 5% of the load
generated as brine from the low pressure RO and the two stage RO as
shown in Figure (5). The treatment requirements are thus reduced from
TABLE V Basis of cost estimates for the adopted processes
Item/Process Cost US$* Remarks
1. Capital costsUF Y ¼ 0.78 X 0.62 X million gallon/day
Y million US$, Ref. [14]
RO 400 m3/day1600 m3 /day
300,000870,000
Current prices in theEgyptian market
WWTP{(Aerobic) Y¼ 0.0133 X 0.62 Calculated from actualcurrent market pricesX m3/dayY ¼ million US$
Anaerobic 443,000 Calculated fromactual current marketprices
Evaporation pond 65,000 Estimated
2. O & M/m3
UF 0.1 Ref. [14]RO (low press) 0.3 Ref. [15]RO (medium to high press) 0.35 Ref. [15]WWTP 0.44 Ref. [1]Reuse system 0.05 Estimated
3. Annual depreciation rates (% of capital)UF 10RO 10WWTP 3.33Direct use system 5
*Costs updated using Marshall and Swift index for year 2000.{Wastewater treatment plant.
TEXTILE INDUSTRY 583
Dow
nloa
ded
by [
Nor
thea
ster
n U
nive
rsity
] at
07:
59 0
7 O
ctob
er 2
014
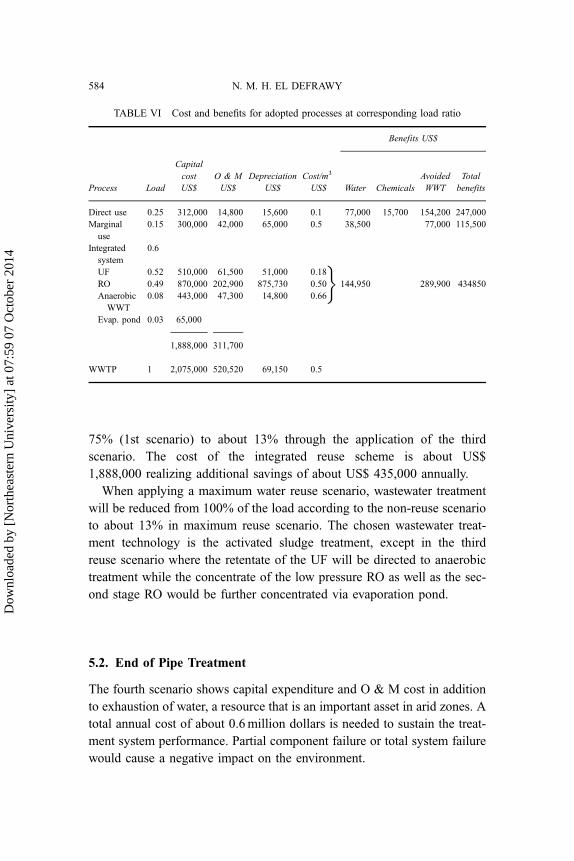
75% (1st scenario) to about 13% through the application of the third
scenario. The cost of the integrated reuse scheme is about US$
1,888,000 realizing additional savings of about US$ 435,000 annually.
When applying a maximum water reuse scenario, wastewater treatment
will be reduced from 100% of the load according to the non-reuse scenario
to about 13% in maximum reuse scenario. The chosen wastewater treat-
ment technology is the activated sludge treatment, except in the third
reuse scenario where the retentate of the UF will be directed to anaerobic
treatment while the concentrate of the low pressure RO as well as the sec-
ond stage RO would be further concentrated via evaporation pond.
5.2. End of Pipe Treatment
The fourth scenario shows capital expenditure and O & M cost in addition
to exhaustion of water, a resource that is an important asset in arid zones. A
total annual cost of about 0.6 million dollars is needed to sustain the treat-
ment system performance. Partial component failure or total system failure
would cause a negative impact on the environment.
TABLE VI Cost and benefits for adopted processes at corresponding load ratio
Benefits US$
Process Load
Capital
cost
US$
O & M
US$
Depreciation
US$
Cost/m3
US$ Water Chemicals
Avoided
WWT
Total
benefits
Direct use 0.25 312,000 14,800 15,600 0.1 77,000 15,700 154,200 247,000
Marginal
use
0.15 300,000 42,000 65,000 0.5 38,500 77,000 115,500
Integrated
system
0.6
UF 0.52 510,000 61,500 51,000 0.18
RO 0.49 870,000 202,900 875,730 0.50 144,950 289,900 434850
Anaerobic
WWT
0.08 443,000 47,300 14,800 0.66
Evap. pond 0.03 65,000
1,888,000 311,700
WWTP 1 2,075,000 520,520 69,150 0.5
�
584 N. M. H. EL DEFRAWY
Dow
nloa
ded
by [
Nor
thea
ster
n U
nive
rsity
] at
07:
59 0
7 O
ctob
er 2
014
5.3. Comparative Financial Analyses
The financial aspects of the non-reuse scenario versus the three reuse ones
are presented in Table VII. The comparison comprises capital outlay, O & M
costs [13–15], net financial benefits and pay back period. Obviously, the
non-reuse scenario shows a maximum annual expenditure, while the third
reuse scenario realizes a direct positive outcome. The pay back period of
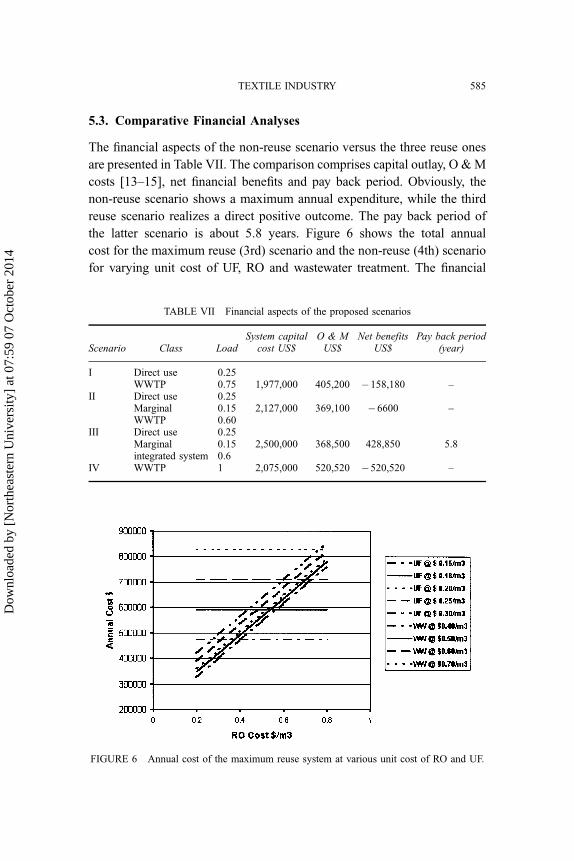
the latter scenario is about 5.8 years. Figure 6 shows the total annual
cost for the maximum reuse (3rd) scenario and the non-reuse (4th) scenario
for varying unit cost of UF, RO and wastewater treatment. The financial
TABLE VII Financial aspects of the proposed scenarios
Scenario Class LoadSystem capital
cost US$O & M
US$Net benefits
US$Pay back period
(year)
I Direct use 0.25WWTP 0.75 1,977,000 405,200 �158,180 –
II Direct use 0.25Marginal 0.15 2,127,000 369,100 �6600 –WWTP 0.60
III Direct use 0.25Marginal 0.15 2,500,000 368,500 428,850 5.8integrated system 0.6
IV WWTP 1 2,075,000 520,520 �520,520 –
FIGURE 6 Annual cost of the maximum reuse system at various unit cost of RO and UF.
TEXTILE INDUSTRY 585
Dow
nloa
ded
by [
Nor
thea
ster
n U
nive
rsity
] at
07:
59 0
7 O
ctob
er 2
014
analyses for the specific case under study have been concluded according to
the cost data identified by the solid lines in Figure 6. Reasonable variations
may be expected due to the detailed design features, component specifica-
tions, site development and market competition. Figure 6 enables a rather
generalized quantitative description to compare the total annual cost for
the maximum reuse with the non-reuse scenarios based on variations of
unit treatment costs. The adopted sensitivity analysis acknowledges the
prevailing cost ranges of the different intervention technologies based on
reported cost data. The recognized reliable ranges are from US$
0.15–0.3, 0.2–0.8 and 0.4–0.7 per cubic meter for UF, RO and wastewater
treatment respectively. For instance, the annual cost of the non-reuse
scenario will equal the annual cost of the maximum reuse scenario when
the unit costs are US$ 0.5, 0.43 and 0.3 per cubic meter for wastewater
treatment, RO and UF, respectively. However, the annual cost in the case
of recovery is associated with a direct benefit of about US$ 800,000 an-
nually due to the produced water, chemicals and avoided treatment cost.
6. CONCLUSIONS
The management of textile industrial effluents is a rather complicated task
taking into considerations the complexity of waste, the specificity of the
product mix, the manufacturing technology and the numerous established
options for treatment and reuse. A rather simplified approach is developed
based on experience gained through auditing Egyptian textile plants and the
established norms for commercial reuse technologies.
The procedure involves segregation of the effluents into three quality
level streams based on functional quality criteria dictated by the water
need of the different manufacturing processes within textile industry.
The streams identified as acceptable for direct reuse, marginal and re-
jected streams enable the development of 4 scenarios comprising three
reuse scenarios ranging from limited to maximum reuse and a total treat-
ment scenario. A comparison of the four scenarios for a given typical pollu-
tion load generated from a typical Egyptian dyeing and finishing plant
reveals the promising financial advantages of the reuse scenarios based
on commercial membrane separation schemes, as compared to the total
treatment scenario.
586 N. M. H. EL DEFRAWY
Dow
nloa
ded
by [
Nor
thea
ster
n U
nive
rsity
] at
07:
59 0
7 O
ctob
er 2
014
References
[1] A. Reife and H.S. Freeman, Environmental Chemistry of Dyes and Pigments (John Wiley& Sons, 1996).
[2] S. Fernand, Textile Chem. Color 30(4), 19–26 (l998).[3] J.J. Porter and T.N. Sargent, Textile Chem. Color 9(11), 269–273 (1977).[4] J.J. Porter, Textile Chem. Color 22, 21–25 (1990).[5] J.L. Gaddis, H.G. Spenser and D.A. Jernigan, ‘‘Caustic recovery and recycling at a textile
dyeing and finishing plant’’, Natl. Res. Counc. Can., Report NRCC 29895, Adv. ReverseOsmosis and Ultrafiltration (1989) pp. 347–355.
[6] A. Fuchs, B.R. Breslau and A.J. Toompas, Text. Ind. 147(12), 44–49 (1983).[7] F. Scuderi, AES. 4(6–7), 63–65 (1982).[8] W.N. Rozelle, Text. World 144(1), 67–68 (1994).[9] C.A. Brandon, ‘‘Closed cycle textile dyeing: Full-scale hyper filtration demonstration,
demonstration (design)’’, U.S. Environmental Protection Agency, EPA-600 2-80-005(March 1980).
[10] Environmental Quality International, ‘‘Environmental study’’, Hosny Dyers and FinishersUSAID-Manufacturing Technology Center, MTC (1999).
[11] N.M.H. El-Defrawy and S.A. Abdel Raouf, ‘‘Industrial audit-cairo dyeing & finishingco.’’, Egyptian Environmental Affair Agency, EEAA (Technical Cooperation Office for theEnvironment; Overseas Development Administration, ODA, Entec, 1997).
[12] J.G. Martin and W.W. Joby, ‘‘Identification and reduction of pollution sources in textile wetprocessing’’, Pollution Prevention Pays Program (North Carolina, 1986).
[13] K.D. Pickering and M.R. Wiesner, J. Environmental Engineering 119(5), 772–797 (1993).[14] S.S. Adham, J.G. Jacangelo and J.M. Laine, Journal AWWA 88(5), 22–31 (1996).[15] R.A. Bergman, Journal AWWA 88(5), 32–43 (1996).
TEXTILE INDUSTRY 587
Dow
nloa
ded
by [
Nor
thea
ster
n U
nive
rsity
] at
07:
59 0
7 O
ctob
er 2
014