Embed Size (px)
Citation preview

The 13th International Conference on Materials Science and its Applications in Oil and Gas Industries, Benghazi-Libya (Aug. 26-27. 2013), P. 172-192
271
WATER CHEMICAL ANALYSIS FOR DIFFERENT STAGES IN
TOBRUK DESALINATION PLANT
MABROUK M. SALAMA
1, SAAD K. EL EBAIDI
2 AND DAVID P.STICKLEY
3
1Department of chemistry, University of Benghazi, Benghazi –Libya
2Department of Earth Sciences, University of Benghazi, Benghazi, Libya
3Bawareg Industrial Company for Chemicals, Benghazi – Libya
Corresponding Email: [email protected]
ABSTRACT
There are different stages for water treatment in the Desalination Plant. The multi-effect desalination thermo
compressor (MED) type of desalination process, is the chosen type in Tobruk Plant. This plant includes sea-
water intake, chlorination system, evaporator units, boilers, chemical treatment units, and Drinking Water tanks.
In this paper, eleven (11) water samples were taken from the different stages, in the Desalination Plant. The
chemical analysis was carried out for pH value, electrical conductivity (E.C), total dissolved solids (T.D.S),
alkali and alkaline earth metals, heavy metals, halogens, nitrates, sulphates, and phosphates. The analytical
results for these stages were assessed according to the Libyan National and World Health Organisation (WHO)
Water Quality Standards. The samples all complied with both sets of Water Quality Standards, resulting in
overall compliance with the standards. These results are acceptable as Public Drinking Water Product water
stream.
INTRODUCTION
Libya is among the world's most water-scarce areas. Almost all available water resources
have been mobilized. Libya has responded to water scarcity through the development of
specialized water institutions, with extensive investments in water infrastructures including
ground water sources, the man-made river project, and desalination plants [1].
Municipal water supply has been among Libyans top development priorities. Improvements
including water quantity as water treatments plants and desalination plants were installed
with more stress on better service quality through improved operation and maintenance
practices.
The desalination industries are considered to have a major role in development of human life.
The Libyan coastline extends for (1950 km) along the southern coast of the Mediterranean
Sea, the desalination plant projects are considered as one of the important projects for water
resources in Libya, especially for the northern coastline which has the biggest population and
more water demand for drinking water and industrial purposes [2].
Mabrouk M. Salama, Saad K. El Ebaidi and David P.Stickley
271
WATER RESOURCES IN LIBYA
Municipal water demand in Libya has increased markedly in the last 4 decades in response to
high population growth rates and increased per capita requirements. Water use rates in Libya
vary from 150 to over 450 liters per day. The main water resources in Libya are ground
water aquifers, man-made river, or desalination water uses. Practically, all municipal water
has been supplied from local large basins in the south via MMRP. Desalination contributed
less than 15 % of the total municipal water used. Desalinated Water uses have been limited
to coastal areas, where ground water supplies or quality problems exist. Quantitatively; a
total volume of about 1.81 Mm3/day was supplied in 2009. Almost one Mm3/day were
supplied from the MMRP and 0.53 Mm3/day from local ground water aquifers with
desalination plants supplying the remaining 0.28 Mm3/day [1].
DESALINATION WATER QUALITY STANDARDS
The World Health Organization (WHO) states that a permissible salinity limit for potable
drinking water is in the range from 500 mg/l to 1,000 mg/l under limited concentration [3].
The US Environmental Protection Agency (USEPA) states that drinking water with T.D.S
greater than 500 mg/l can be distasteful.
Requirements and conditions involved in choosing desalination technologies and
techniques
The main important factors when choosing the suitable desalination technologies and
techniques are [2]:
1. Geographic study of the region.
2. Topography of the site.
3. Capacity requirements and plant size.
4. Type and cost of fossil fuel energy available.
5. Condition of local infrastructure, including ability to plug into electricity grid.
6. Quality control study of feeding water (T.D.S concentration).
7. The cost of product water.
Desalination technologies and techniques
A desalination process essentially separates salt water into two parts, one that has a low
concentration of salt (treated water or product water), and the other with a much higher
concentration than the original feed water, usually referred to as brine concentrate. The two
major types of technologies that are used around the word for desalination can be broadly
classified as thermal or membrane [4,5]. The major desalination techniques are identified in
Table (1).

Mabrouk M. Salama, Saad K. El Ebaidi and David P.Stickley
271
Table 1. Desalination technologies and processes.
Thermal technology Membrane
Multi-stage flash Distillation (MSF) Reverse Osmosis (R.O)
Multi-Effect Distillation (MED) Electrodialysis (E.D)
Vapor Compression Distillation (VCD) Electrodialysis reversal (E.D.R)
Within those two categories, there are sub-categories using different techniques as follows:
(i) Thermal Technologies
Thermal technologies, as the name implies involve the heating of sea water and collecting the
condensed vapour (distillate) to produce pure water. They have been used for sea water
desalination [6] and can be divided into three groups:
1. Multi - Stage Flash distillation (MSF)
This process involves the use of distillation through several (multi - stage) chambers. In the
MSF process each successive stage of the plant operates at progressively lower pressures.
The feed water is first heated under high pressure and is led into the first flash chamber,
where the pressure is released causing the water to boil rapidly resulting in sudden
evaporation or flashing. This flashing of a potion of the feed continues in each successive
stage, because the pressure at each stage is lower than in the previous stage. The vapour
generated by the flashing is converted into fresh water by being condensed on heat exchanger
tubing that run through each stage. The tubes are cooled by the incoming cooler feed water
[1].
- MSF is the most dominant in the thermal category.
- MSF is capable of very large yield.
- It operates using a series of 4 to 40 chambers or stages.
- MSF operates at top brine temperatures of 90 - 120 oC.
- Capital and energy costs are the highest of all desalination technology.
2. Multi Effect Distillation (MED)
Multi effect distillation occurs in a series of vessels (effects) and uses the principles of
evaporation and condensation at reduced ambient pressure. In multi - effect distillation, a
series of evaporator effects produce water at progressively lower pressures. Water boils at
low temperatures as pressure decreases, so the water vapour of the first vessel or the second
and so on. The more vessels or effects there are, the higher the performance ratio. Depending
upon the arrangement of the heat exchanger tubing, MED units could be classified as
horizontal tube, vertical tube or vertically stacked tube bundles.

Mabrouk M. Salama, Saad K. El Ebaidi and David P.Stickley
271
3. Vapor Compression Distillation
The vapour compression distillation (VCD) process is used either in combination with other
processes such as the M E D or by itself. The heat for evaporating the water comes from the
compression of vapour, rather than the direct exchange of heat from steam produced in a
boiler. The VC units are generally small in capacity, and are often used at hotels, resorts and
in industrial applications.
(ii) Membrane technologies
Membrane technology can be subdivided into three categories:
Reverse Osmosis (RO), electro-dialysis (ED), and electro-dialysis reversal (EDR).
1. Reverse Osmosis (R.O)
Reverse osmosis process uses pressure as the driving force to push saline water through semi-
permeable membrane into a Product water stream and a concentrated brine stream [7].
- R.O. is the most dominant membrane desalination
- R.O. has four subsystems
- Pre-treatment
- High pressure pump
- Membrane modules
- Post-treatment
- R.O. has low capital cost but significant maintenance.
2. Electro-dialysis (E.D), and (3) Electro-dialysis reversal (EDR)
- E.D is a low cost method for brackish water desalination
- E.D produces water around 20 ppm T.D.S
- EDR unit generally operates on the same principle as an ED unit.
OBJECTIVES OF THIS STUDY
The aim of this study is to measure the water chemical analysis of each stages of Tobruk
desalination plant with emphasis in drinking water produced with accordance to Libyan and
WHO standards, as well as to measure any pollutants such as heavy metals and their effects
on the desalination components and testing of the chemical additional efficiency to prevent
scale formation and corrosions.
STUDY AREA
Samples have been taken for 11 sampling points, each one represent different component of
the Tobruk MED desalination plant. This plant was established in 2003 by Sidem French
Company.
Mabrouk M. Salama, Saad K. El Ebaidi and David P.Stickley
271
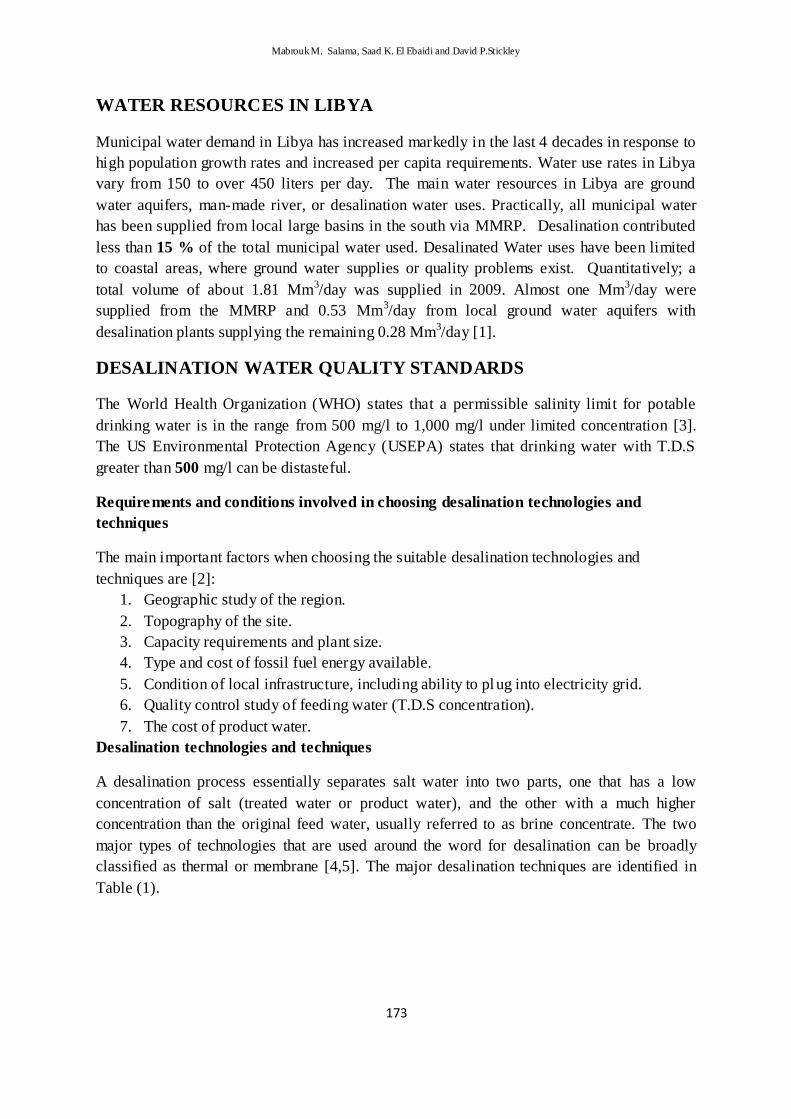
ANALYSIS AND EXPERIMENTAL WORK
Samples have been taken for 11 samples, each one represent different stage in the plant. The
collected samples were chemically analysed to find the concentration of alkali metals, heavy
metals, nitrates, sulphates, phosphates and chlorides in the Bawareg Industrial Company for
Chemicals, private laboratory.
Using flame photometer and Spectrophotometer, all the analyses were performed according
to standard methods.
Sample Data
1/Sea water Sample # T1
Result unit Tests Sample
81 °C Temperature Sea Water
0817 pH
58,200 S / cmµ E.C. Place of taking
sample
22,000 mg / 1 Cl In take
787 mg / 1 Free Cl
7880 mg / 1 Br Condition of
taking sample
7871 mg / 1 NH3 Without
treatment
2/ Chlorination Sample # T2
Result unit Tests Sample
81 °C Temperature Sea Water
08.7 pH Place of taking
sample
58,200 S / cmµ .E.C In take
787 mg / l Free Cl
078177 mg / l Cl Condition of
taking sample
7870 mg / l Br Shock injection

Mabrouk M. Salama, Saad K. El Ebaidi and David P.Stickley
277
3/ Chlorination Unit Sample # T3
Result Unit Tests Sample
19 °C Temperature Solution of
NaOCl
0810 pH
58,200 S / cmµ E.C. Place of taking
sample
08077 mg / 1 Cl Condition cell
881 mg / 1 Free Cl
78.0 mg / 1 Br Condition of
taking sample
During unit
running
4 /Water distillate Sample # T4
Result unit Tests Sample
01 °C Temperature Water of
Distillate
18.0 pH
11 S / cmµ . E.C Place of taking
sample
787. mg / 1 Br Condition cell
0080 mg / 1 T.D.S Condition of
taking sample
17 mg / 1 Cl During unit
runing

Mabrouk M. Salama, Saad K. El Ebaidi and David P.Stickley
271
5/ Water distillate after injection of CO2 Sample # T5
Result unit Tests Sample
26 °C Temperature Water distillate
after injection of
CO2
0801 pH
870 S / cmµ E.C. Place of taking
sample
After injection of
CO2
Condition of taking
sample
During unit running

Mabrouk M. Salama, Saad K. El Ebaidi and David P.Stickley
271
6/ Drinking water Sample # T6
Result unit Tests Sample
26 °C Temperature Drinking
Water
0807 pH
800 S / cmµ E.C. Place of taking
sampl
07 mg / 1 Total hardness After treatment
of Ca CO3
87180 mg / 1 T.D.S
07 mg / 1 Na
0 mg / 1 K Condition of
taking sample
0800 mg / 1 Mg During unit
runnin
80 mg / 1 Ca
78. mg / 1 -
F
0080 mg / 1 Cl-
7878 mg / 1 Br
7878 mg / 1 NH3
7878 mg / 1 NO3
8.81 mg / 1 SO4
88.00 mg / 1 PO4
787 mg / 1 Mn
787. mg / 1 Fe
887 mg / 1 Cu
787 mg / 1 Al
Mabrouk M. Salama, Saad K. El Ebaidi and David P.Stickley
211
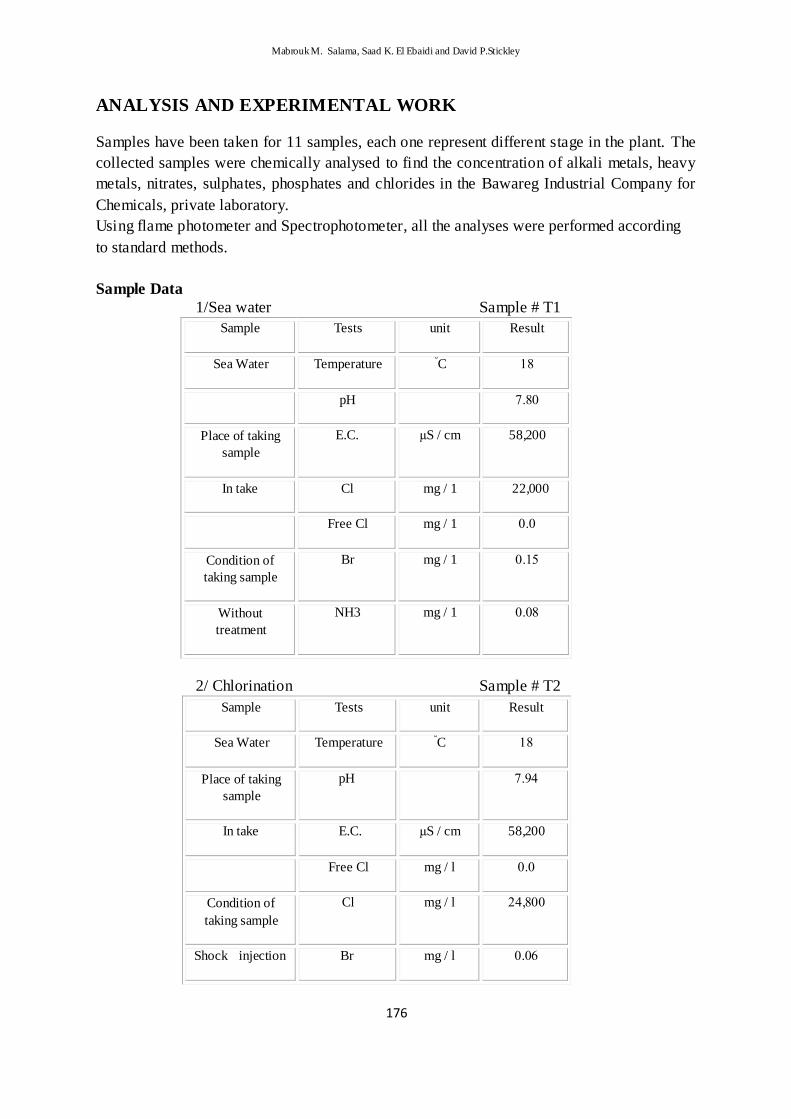
7/ Boiler water feed Sample # T 7
Result unit Tests Sample
33 °C Temperature Water feed
3.0 S / cmµ E.C
0.5 mg / 1 Total hardness Place of taking
sample
0810 pH Water feed
88.0 mg / 1 T.D.S
080 mg / 1 D.O Condition of
taking sample
1.0> mg / 1 Cl During working
unit
7878 mg / 1 Fe
787 mg / 1 Cu
.810 mg / 1 Si
7800 mg / 1 PO4

Mabrouk M. Salama, Saad K. El Ebaidi and David P.Stickley
212
1/ Boiler Water feed NO.81 S/by Sample no # T 1
Result Unit Tests Sample
00 °C Temperature Water Boiler
0810 pH
87 µS/cm Conductivity Place of taking
sample
0 mg / 1 T. hardness From Boiler
.88 mg / 1 T.D.S
01 mg / 1 CI Condition of
taking sample
78. mg / 1 PO4 During unit
running
780 mg / 1 Cu
.870 mg / 1 Si
7878 mg / 1 Fe
7180 mg / 1 SO4
88810 mg / 1 NO3
SO3
17 mg / 1 Methyl alkali.
.7 mg / 1 Ph ph alkali.
Mabrouk M. Salama, Saad K. El Ebaidi and David P.Stickley
211
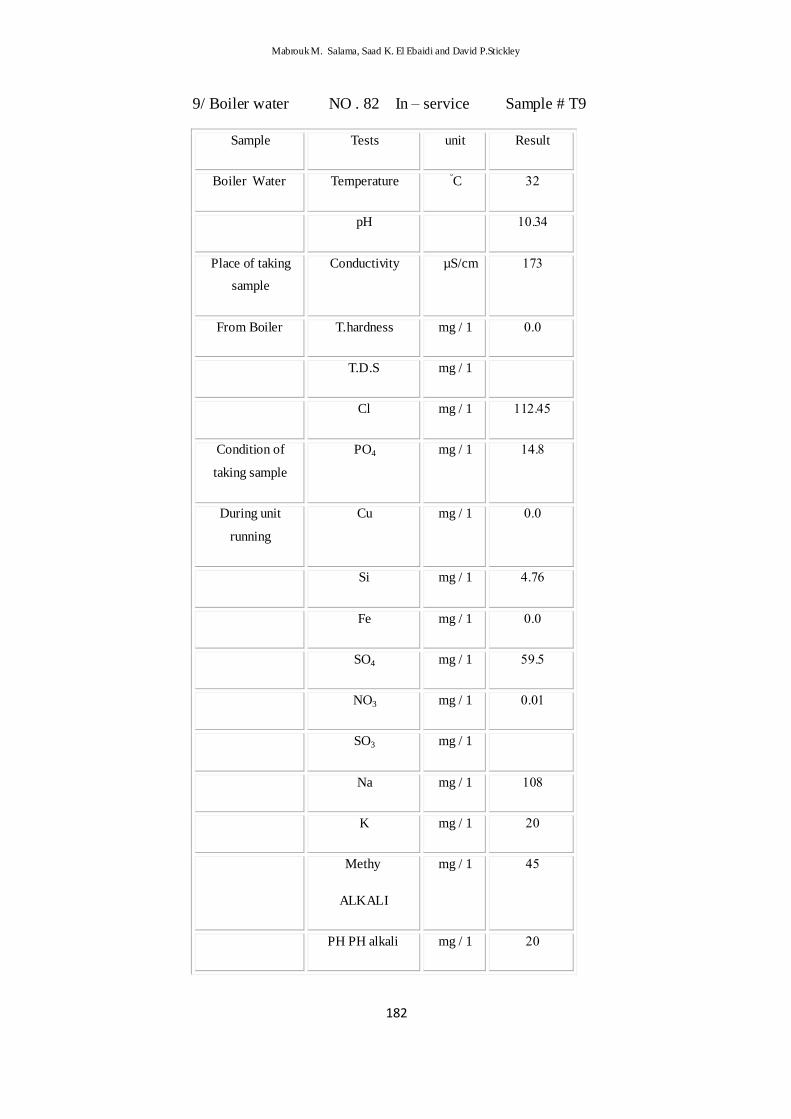
9/ Boiler water NO . 82 In – service Sample # T9
Result unit Tests Sample
.0 °C Temperature Water Boiler
878.7 pH
80. µS/cm Conductivity Place of taking
sample
787 mg / 1 T.hardness From Boiler
mg / 1 T.D.S
880870 mg / 1 Cl
8781 mg / 1 PO4 Condition of
taking sample
787 mg / 1 Cu During unit
running
7800 mg / 1 Si
787 mg / 1 Fe
0.80 mg / 1 SO4
7878 mg / 1 NO3
mg / 1 SO3
871 mg / 1 Na
07 mg / 1 K
70 mg / 1 Methy
ALKALI
07 mg / 1 PH PH alkali

Mabrouk M. Salama, Saad K. El Ebaidi and David P.Stickley
211
10/ Boiler water NO . 83 In – service Sample # T10
Result unit Tests Sample
.0 °C Temperature Water Boiler
87800 pH Place of taking
sample
80. S / cmµ Conductivity Boiler Water
787 T.hardness
078880 mg/l T.D.S
8880 mg / 1 Cl Condition of
taking sample
00871 mg / 1 PO4 During unit
running
7880 mg / 1 Cu
7870 mg / 1 Si
008. mg / 1 Fe
787 mg / 1 SO4
80. mg / 1 NO3
. mg / 1 Na
mg/l K
07 mg / 1 PH PH
877 mg / 1 M .Value

Mabrouk M. Salama, Saad K. El Ebaidi and David P.Stickley
211
11/ After addition of Na2 SO3: Sample # T11
Result unit Tests Sample
.0 °C Temperature Water Sea
0811 pH
0187 S / cmµ Conductivity Place of taking
sample
00177 mg / 1 CI After
Hypo chloride
treatment
107 mg / 1 SO4
7878 mg/l Br
mg / 1 D.O Condition of
taking sample
08118 mg / 1 NO3 During unit
running
mg/l SO3
Residual chlorin
DISCUSSIONS
As part of a routine sampling operation, water samples were taken from the available sample
points in Tobruk Desalination plant. Field Analysis was carried out a t all sample points and
recorded. The field analysis included pH value, temperature (in degree C), electrical
conductivity (E.C, in µS/cm), and free and total chlorine where appropriate. The remaining
analyses were performed on the sample bottles which were transported to the laboratory in
cool boxes. The analytical data has been assessed for the Libyan National and World Health
Organization (WHO) Water Quality Standards. All samples complied with these standards;
therefore these sample results are acceptable as Public Drinking Water.
Mabrouk M. Salama, Saad K. El Ebaidi and David P.Stickley
211
Sample Analyses Result
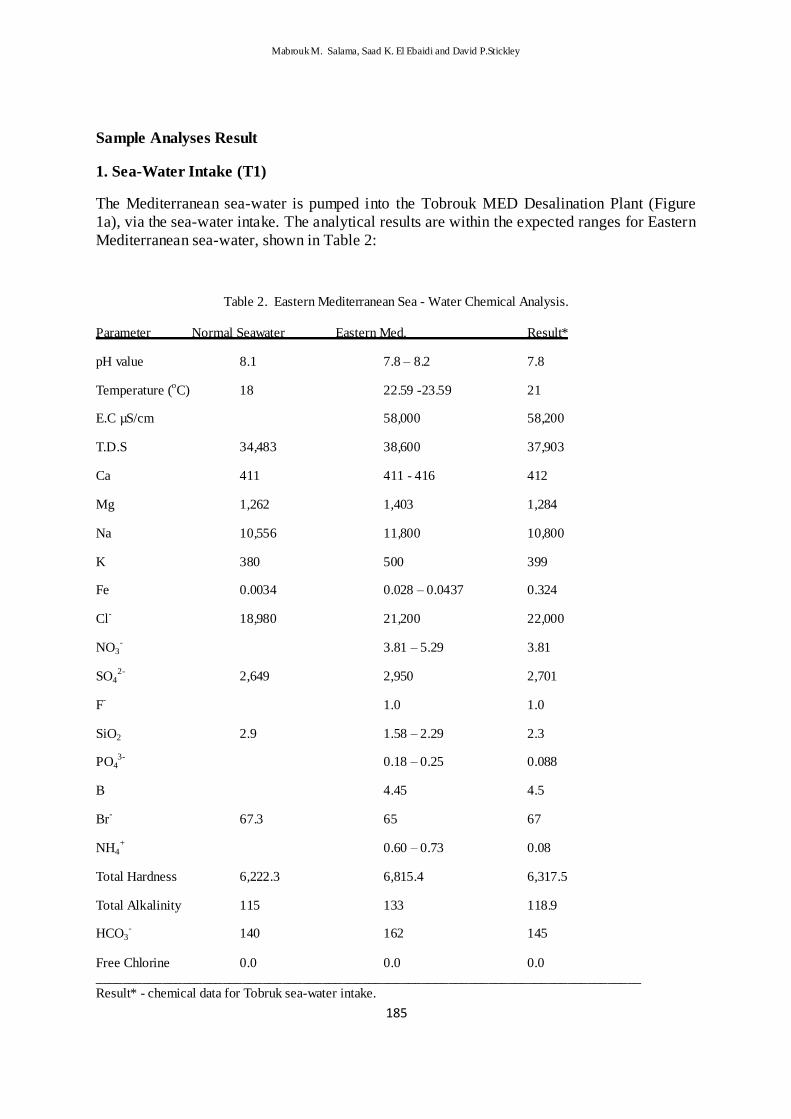
1. Sea-Water Intake (T1)
The Mediterranean sea-water is pumped into the Tobrouk MED Desalination Plant (Figure
1a), via the sea-water intake. The analytical results are within the expected ranges for Eastern
Mediterranean sea-water, shown in Table 2:
Table 2. Eastern Mediterranean Sea - Water Chemical Analysis.
Parameter Normal Seawater Eastern Med. Result*
pH value 8.1 7.8 – 8.2 7.8
Temperature (oC) 18 22.59 -23.59 21
E.C µS/cm 58,000 58,200
T.D.S 34,483 38,600 37,903
Ca 411 411 - 416 412
Mg 1,262 1,403 1,284
Na 10,556 11,800 10,800
K 380 500 399
Fe 0.0034 0.028 – 0.0437 0.324
Cl-
18,980 21,200 22,000
NO3-
3.81 – 5.29
3.81
SO42-
2,649 2,950 2,701
F- 1.0 1.0
SiO2 2.9 1.58 – 2.29 2.3
PO43-
0.18 – 0.25 0.088
B 4.45 4.5
Br- 67.3 65 67
NH4+ 0.60 – 0.73 0.08
Total Hardness 6,222.3 6,815.4 6,317.5
Total Alkalinity 115 133 118.9
HCO3- 140 162 145
Free Chlorine 0.0 0.0 0.0 __________________________________________________________________________________ Result* - chemical data for Tobruk sea-water intake.

Mabrouk M. Salama, Saad K. El Ebaidi and David P.Stickley
211
Excepting the first three parameters in Table 2, the remaining parameters are in
concentrations of mg/l.
The total hardness and total alkalinity results are in mg/l as CaCO3.
Since the Mediterranean Sea is generally enclosed from other oceans, the soluble salt
content is slightly greater than open sea water. For example, the sodium chloride content
for the Eastern Mediterranean is about 11.7 % greater than normal sea water.
The pH value of the sea water taken from the Eastern Mediterranean at the Tobrouk
Desalination Plant is 7.8, with temperature 18oC. The general mineral metals are at the
expected concentrations, with sodium highest at 10,784 mg/l as Na. The corresponding
chloride is 22,000 mg/l as Cl- , with sulphate at 2,701 mg/l as SO42- , bicarbonate at 145
mg/l, and bromide at 67 mg/l as Br-. These analyses are at the expected concentrations in
the Eastern Mediterranean. This water is primarily filtered to remove all gross suspended
matter.
1. Chlorination (T2 and T3)
The pumped sea water is initially chlorinated to remove all bacteria, algae, and all living
matter (Figure 1b). Chlorination is achieved using pumped sodium hypochlorite solution
(8% , bleach). The resulting free chlorine was 1.8 mg/l with a pH value of 7.85, and
temperature = 19 oC.
2. Water Distillate (T4)
The process of water distillation produces purified water that is largely free of dissolved
anions and cations that are removed from the sea water (Figure 1c). However, some
chloride ions are also allowed through this process possibly due to splashing. The pH
value of water distillate was 8.36 with a temperature of 28 oC, chloride of 80 mg/l, and
electrical conductivity of 88 µS/cm.
The water distillate was then injected with carbon dioxide, which alters the pH value to
5.28 (see T5). The reactions of CO2 with water are as follows:
i) CO2(g) === CO2 (l)
At room temperature and pressure, the solubility of CO2 is about 90 cm3 of CO2 per 100
ml of water (cl/cg = 0.8).
ii) CO2(l) + H2O === H2CO3 (l)
This is a slow reaction, only 0.2 – 1% of dissolved CO2 is converted to
H2CO3 . However, it is sufficient to change the pH value quite
Appreciably from 8.36 to 5.28. The water distillate is now able to react
with silica gravel (limestone; Figure 1d) in several tanks. The limestone is in the form of
small diameter nodules:
H2O + CO2 + CaCO3=== Ca(HCO3)2
Mabrouk M. Salama, Saad K. El Ebaidi and David P.Stickley
217
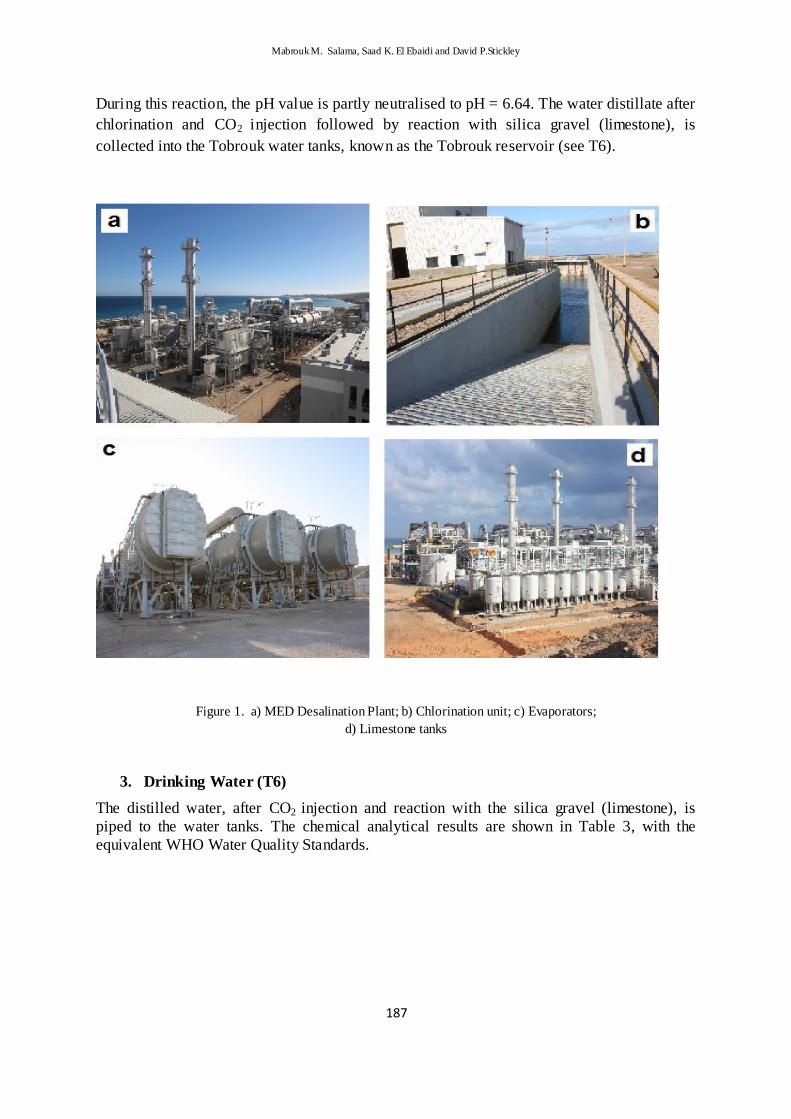
During this reaction, the pH value is partly neutralised to pH = 6.64. The water distillate after
chlorination and CO2 injection followed by reaction with silica gravel (limestone), is
collected into the Tobrouk water tanks, known as the Tobrouk reservoir (see T6).
Figure 1. a) MED Desalination Plant; b) Chlorination unit; c) Evaporators;
d) Limestone tanks
3. Drinking Water (T6)
The distilled water, after CO2 injection and reaction with the silica gravel (limestone), is
piped to the water tanks. The chemical analytical results are shown in Table 3, with the
equivalent WHO Water Quality Standards.

Mabrouk M. Salama, Saad K. El Ebaidi and David P.Stickley
211
Table 3. Drinking Water Analytical Results
Parameter Drinking Water, T6
analytical result
Drinking Water WHO
Standards
pH value 6.64 6.5 – 8.5
Temperature, oC 26 NGV
Electrical conductivity
µS/cm(EC)
165 1,500
Total dissolved solids,
TDS mg/l
146.1 1,200 mg/l
Total hardness 50.0 500 mg/l as CaCO3
Total alkalinity 45.6 -
Hydrogen sulphide 0.0 Not detectable
Calcium mg/l 16 -
Magnesium mg/l 6.76 -
Sodium mg/l 18.4 200 mg/l
Potassium mg/l 2.0 -
Ammonia/N mg/l 0.01 0.5 mg/l
Bicarbonate mg/l 55.6 -
Chloride mg/l 28.4 250 mg/l
Sulphate mg/l 13.8 500 mg/l
Nitrate mg/l 0.01 50 mg/l
Nitrite mg/l 0.0 0.2 mg/l
Phosphorus as PO43- mg/l 1.325 -
Fluoride mg/l 0.3 1.5 mg/l
Free Chlorine mg/l 0.2 5.0 mg/l
Iron mg/l 0.03 0.3 mg/l
Manganese mg/l 0.0 0.4 mg/l
Silicon as SiO2 3.4 NGV
Bromide mg/l 0.01 0.01 mg/l
Total Coliforms nil nil
E. Coli nil nil
NGV = no guide value.
All of the parameters that were analysed for the Tobrouk Desalination Plant Drinking Water
production complied with the WHO Standards. This is also true for the Libyan Water Quality
Standards (Tables 4 and 5). Therefore, the Production Drinking Water is considered to be
portable and of Water Quality Standard.
The analytical data has given an acceptable ionic balance between anions and cations.
Therefore, the analysis is also acceptable.
The microbiological data gave nil number for total Coliforms and E.Coli. The free chlorine
result was 0.2 mg/l which is acceptable for potable water.

Mabrouk M. Salama, Saad K. El Ebaidi and David P.Stickley
211
Table 4. Chemical Analyses for the Manufacturer (SIDEM Co.)
Portable
water
Distilled
water
Seawater Unit Parameter
081 080 08. mg / 1 pH
80. 00 41,299 mg / 1 T.D.S
.881 08.0 13,481 mg / 1 Na+
8881 8881 22,733 mg / 1 CI-
7800 7800 700 mg / 1 K+
7810 7810 80.. mg / 1 Mg++
.08. 7800 0.8 mg / 1 Ca+
88.0 88.0 .008 mg / 1 SO4-

Mabrouk M. Salama, Saad K. El Ebaidi and David P.Stickley
211
Table 5. Libyan standard drinking water, the chemical compounds standard for drinking water
1200 Ms/cm 750 Ms/cm E.C 1
5.8 5.8 pH 0
500 mg/l 200 mg/l Total hardness .
1000 mg/l 500 mg/l T. D. S 7
400 mg/l 200 mg/l Sulphates 0
250 mg/l 200 mg/l Chloride 0
200 mg/l 20 mg/l Sodium 0
1 mg/l 0.01 mg/l Copper 1
200 mg/l 75 mg/l Calcium .
150 mg/l 30 mg/l Magnesium 87
40 mg/l 10 mg/l Potassium 88
15 mg/l 5 mg/l Zinc 80
1.5 mg/l 1 mg/l Fluoride 8.
0.3 mg/l 0. 1 mg/l Iron 87
0.1 mg/l 0.05 mg/l Manganese 80
0.2 mg/l 0 Aluminum 80
4. Boiler Water Feed (T7)
The boiler feed water had temperature 33 oC, pH value = 7.86, TDS = 1.95 mg/l, and
electrical conductivity = 3.0 µS/cm. The boiler feed water also has phosphate added to
prevent precipitation in the boilers. Oxygen is removed by use of sodium sulphite addition.
Dissolved oxygen reacts with sodium sulphite as follows:

Mabrouk M. Salama, Saad K. El Ebaidi and David P.Stickley
212
2Na2SO3 + O2=== 2Na2SO4
Dissolved oxygen, when present, will cause severe corrosion in boilers, hence its removal.
5. Boiler Water No. 81 (T8) (In stand-by)
Since this boiler is on stand-by, the pH value is 6.82, phosphate is 0.3 mg/l, TDS = 9.1, EC =
14 µS/cm, and chloride = 6.8 mg/l.
6. Boiler Water No.82 (T9) (in service)
This boiler is in operation. The pH value has been increased substantially to 10.34, and is
quite alkaline. The phosphate is 26.85 mg/l following addition of sodium phosphate to
prevent corrosive action, TDS = 112.45 mg/l, chloride = 14.8 mg/l, and sulphate 59.5 mg/l,
Nitrate is very low in concentration. The alkalinity is 45 mg/l as CaCO3, and phenolphthalein
alkalinity is 20 mg/l as CaCO3. The chloride concentration is 14.8 mg/l.
7. Boiler Water No.83 (T10) (in service)
This boiler is also in operation. The pH value is also increased to 10.66, and is alkaline. The
phosphate concentration is 27.48 mg/l after addition of sodium phosphate for preventing
corrosion, the TDS = 241.15 mg/l which is quite high compared with boiler No. 82. And
nitrate is also very low.
The alkalinity is 100 mg/l as CaCO3, and phenolphthalein alkalinity is 70 mg/l as CaCO3.
The chloride concentration is 11.6 mg/l.
In both boilers, the iron concentration is very low, < 0.01 and 0.02 mg/l for boilers 82 and 83
respectively.
Both boilers have greater sulphate concentrations at 59.5 mg/l, and 65.9 mg/l respectively for
boilers 82 and 83 respectively. This is due to the addition of sodium sulphite to remove
dissolved oxygen and prevent serious corrosion problems (see sample T11). This addition is
added directly to the pumped sea-water intake.
CONCLUSION
The analytical data has also been assessed for several factors that will show whether the
drinking water is likely to have either corrosive or precipitating factors. These factors are
shown in Table 6.
Generally, these mathematical factors are an indication of the nature of the desalination
water. The CCPP is a negative factor, and indicates that the water is actually aggressive in
nature, and would be expected to dissolve 10.64 mg/l of calcium carbonate with which it is
in contact with.
The CCPP is a calculated figure that uses the following data to yield the expected result. The
data used includes: pH value, total alkalinity mg/l as CaCO3, calcium as calcium hardness
mg/l, temperature in oC, electrical conductivity as µS/cm, and total dissolved solids, TDS as
mg/l.

Mabrouk M. Salama, Saad K. El Ebaidi and David P.Stickley
211
Table 6. Mathematical Factors for Produced Drinking Water
Parameter Math. Result Description of water
CCPP mg/l as CaCO3 -10.64 Aggressive (dissolves) limestone
Langelier Index -1.79 Aggressive water
Ryznar Index 10.22 Corrosive water
DFI - driving force Index 0.02 Corrosive (aggressive to limestone, ie: will dissolve)
Calculated CO2 mg/l 20.3 High carbon dioxide content
Equilibrium Alkalinity 173.0 Expected total alkalinity
Ionic Strength 0.0030
Chloride corrosion Ind. 3.15 Uncertain
Alkali Hazard 0.36 Water suitable for irrigation
Aggressivity Index 9.9 Highly aggressive water
Magnesium Hazard 41.1 Acceptable Mg Hazard
Larson-Skold Index 1.19 Chloride and Sulphate may make it difficult to produce limestone coating in pipework
Equilibrium pHs 8.43 Drinking water pH value is too low at 6.64.
Note: CCPP = calcium carbonate precipitation potential (+/- mg/l as CaCO3).
REFERENCES
[1] A. Abufayed A. and A. ELkebir , 2010. status of water supply and sanitation in
Libya: situation analysis and UNDP interventions, 1, , (1 – 55) .
[2] M. Elabbar and F. Elmabrouk , Desalination, 2005, 185, (31 – 44).
[3] J. Frederick , MEM Master thesis, Desalination, 2010, (1 – 66 ).
[4] H. Krishna , Texas Water Development Board, 2003 (1 - 7).
[5] Using Desalination Technology for water treatment, OTA – B P- O 46,
(Washington, DC, US Government printing office, March 1988, ( 1 - 66).
[6] H. Ettouney and A. Cipollina, Sea Water Desalination, Green Energy and
Technology, DOI 10, 1007 / 978 – 3 – 642 – 01150 – 4 – 2, Springer verlag
Berlin Heidelberg, 2009 (17 – 40).
[7] W. Heinzl et al., Desalination and water treatment 2012, 42, (177- 180).