Embed Size (px)
Citation preview

1
Water and Sewer Rate Study

2
Rate Study Overview
Study Objectives
Primary objective of study is to analyze
different rate structures and charges,
with particular attention paid to:
* Financial stability
* Equity
* Water conservation
* Storm water management
* Other best management practices
Other important considerations include:
* Ratepayer sensitivity
* Economic competitiveness
* Ease of Implementation
* Future System needs
* Affordable housing stock
* Regulatory/water quality concerns
PHASE 1
Analyzed DEP‟s current rate structure and capital and
operating expenses
Surveyed water and wastewater utilities from around
the country to benchmark capital/operating budgets
and identify universe of alternative rate structures
Met with stakeholder groups to facilitate public input
and understand key concerns
PHASE 2
Study of potential impacts on revenue, ratepayers
under alternative rate structures
* Fixed rates
* Stormwater rates
* New development charges
* Water conservation rates
Key Phases

3
Information from the following utilities was collected
• Chicago Metropolitan Water Reclamation Department
• Cleveland Northeast Regional Sewer District
• Denver Wastewater Management Division
• Honolulu ENV (Department of Environmental Services)
• Las Vegas / Clark County Water Reclamation District
• Los Angeles Bureau of Sanitation
• Louisville / Jefferson County Metropolitan Sewer District
• Milwaukee Metropolitan Sewer District
• San Diego Metropolitan Wastewater Department
•
26 UTITLITIES SHOWN IN RED WERE SURVEYED AND
PROVIDED MODERATE TO SIGNIFICANT INFORMATION. For
other 29 utilities, available reports were reviewed.
Wastewater Utilities
• Atlanta Department of Watershed Management
• Baltimore Bureau of Water & Wastewater
• Boston Water & Sewer Commission
• Buffalo Water Authority
• Chicago Department of Water Management
• Columbus Public Utilities
• Dallas Water Utility
• DC Water and Sewer Authority
• Detroit Water and Sewerage Department (DWSD)
• Glendale Water and Wastewater Utilities
• Greensboro Water
• Houston Water/Wastewater Utility
• Irvine Ranch Water District
• Jacksonville (JEA Water and Wastewater Utility)
• Kansas City Water Services Department
• Miami-Dade County Water and Sewer Department
(WASD)
• New Orleans Sewerage & Water Board
• Newark Department of Water & Sewer Utilities
• Niagara Falls Water Board
• Oakland / East Bay Municipal Utility District
• Orlando Utilities Commission
• Philadelphia Water Department
• Phoenix Water Services Department
• Pittsburgh Water and Sewer Authority
• San Antonio Water System
• San Francisco Public Utilities Commission
• Seattle Public Utilities
• St. Louis Water and Wastewater Department
• Washington Sanitary Suburban Commission (WSSC)
• Cleveland Division of Water
• Denver Water
• Greater Cincinnati Water Works
• Honolulu Board of Water Supply
• Indianapolis Water
• Las Vegas Valley Water District
• Los Angeles Department of Water & Power
• Louisville Water Company
• Metropolitan Water District (MWD) of Southern California
• Milwaukee Water Works
• Portland Water Bureau
• San Diego County Water Authority
• San Diego Water Department
• San Jose Municipal Water System
• Southern Nevada Water Authority
• Suffolk County (NY) Water Authority
• Utica (Mohawk Valley Water Authority)
Water/Wastewater Utilities Water Utilities

4
Phase I: Financial Benchmarking
5
Overview NYCDEP Budget

6
$37,842,000
1.5%
$90,000,000
4%
$178,600,000
7%
$18,300,000
0.7%
$18,000,000
0.7%
$30,276,000
1.2%
$1,037,200,000
41%
1,082,311,629
43%
$21,446,371
0.9%
Total DEP Utility O&M
Debt Service
Rental Payment to the City
PAYGO
Direct City Expenses
Authority Expenses
Indirect Expenses
Board Expenses
Other
FY09 Budget ($2.51 B)
$18,300,000
0.5%$9,000,000
0.2%
1,299,279,448
36%
$1,790,800,000
50%
$36,753,000
1%$37,842,000
1%
$100,000,000
3%
$301,600,000
8%
$12,478,552 ,
0.3%
FY14 Budget ($3.61 B)
Note: Trust account withdrawal of $66M is not reflected
in the FY09 budget presented herein.
DEP FY „09 and FY „14 budget breakdowns reflect increasing costs of service

7
NYCDEP Operating Budget and Comparison to other Cities
8
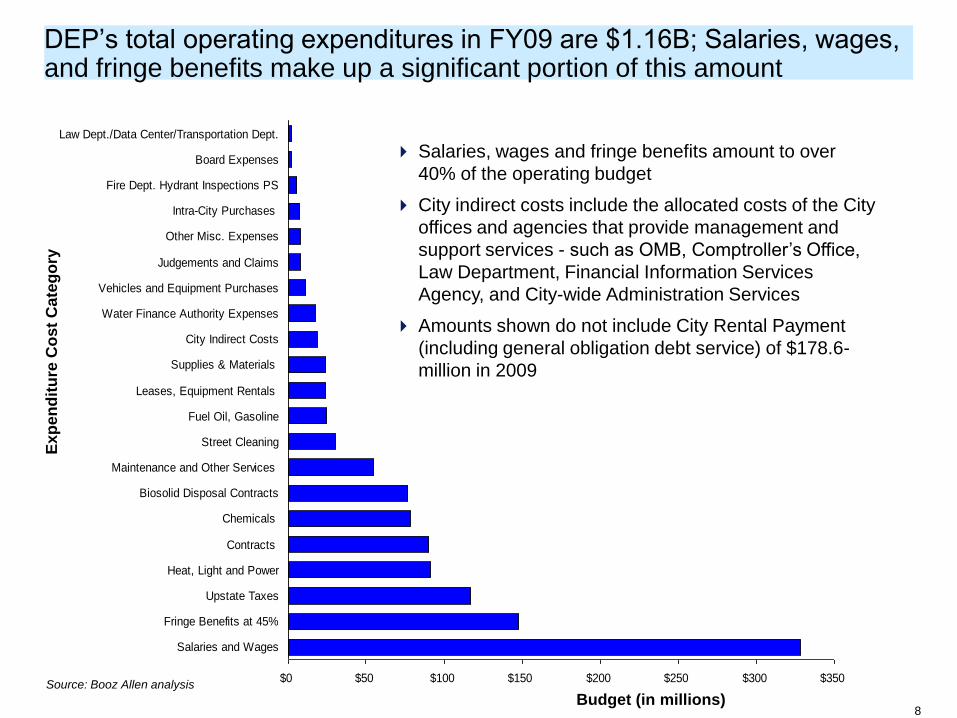
DEP‟s total operating expenditures in FY09 are $1.16B; Salaries, wages, and fringe benefits make up a significant portion of this amount
Source: Booz Allen analysis$0 $50 $100 $150 $200 $250 $300 $350
Law Dept./Data Center/Transportation Dept.
Board Expenses
Fire Dept. Hydrant Inspections PS
Intra-City Purchases
Other Misc. Expenses
Judgements and Claims
Vehicles and Equipment Purchases
Water Finance Authority Expenses
City Indirect Costs
Supplies & Materials
Leases, Equipment Rentals
Fuel Oil, Gasoline
Street Cleaning
Maintenance and Other Services
Biosolid Disposal Contracts
Chemicals
Contracts
Heat, Light and Power
Upstate Taxes
Fringe Benefits at 45%
Salaries and Wages
Ex
pen
dit
ure
Co
st
Cate
go
ry
Budget (in millions)
Salaries, wages and fringe benefits amount to over
40% of the operating budget
City indirect costs include the allocated costs of the City
offices and agencies that provide management and
support services - such as OMB, Comptroller‟s Office,
Law Department, Financial Information Services
Agency, and City-wide Administration Services
Amounts shown do not include City Rental Payment
(including general obligation debt service) of $178.6-
million in 2009

9
$340 $288 $159 $130 $124 $114 $66 $1,166 $284 $274 $265 $264 $261 $226 $210 $114 $374 $115 $50
0%
10%
20%
30%
40%
50%
60%
70%
80%
90%
100%
Philadelp
hia
(2007)
Dallas (
2009)
Phoenix
(2008)
SF
Com
bin
ed (
2007)
New
York
City (
2009)
Kansas (
2008)
Avera
ge C
om
bin
ed U
tility
Wash D
C (
2009)
San A
nto
nio
(2008)
Bosto
n (
2007)
Cin
cin
nati (
2006)
Cle
vela
nd (
2007)
So.
Nevada (
2007)
San F
rancis
co (
2007)
Port
land (
2009)
San D
iego (
2009)
Las V
egas (
2007)
Chic
ago (
2009)
San F
rancsic
o (
2007)
Municipality
Co
mm
itm
en
t P
erc
en
tag
e
Other
Utilities, Fuels, Chemical, Supplies and Materials
Personal Services
The share of DEP‟s budget allocated to personal services, supplies and materials is consistent with other large utilities
Source: Booz Allen analysis
Water/Wastewater Utilities Water UtilitiesWastewater
Utilities
DEP budget
shares are
within a 2 to
3% variation of
the average
combined
water/
wastewater
utilities.
Wastewater
personal
service costs
are, on
average, 8 to
10% higher
than water
personal
service costs.Notes:
1. Dollar amounts shown are in millions.
2. “Other” category includes property taxes, biosolids, contractor expenses,
contractual services, judgments & claims, rentals/leases, equipment,
reimbursements, PILOT, and other expenses.
3. A significant portion of Boston‟s costs for chemical, energy, fuels, etc. is
contained in the wholesale treatment costs of MWRA, which are included as
“Other”
Ave
rag
e C
om
bin
ed
Uti
lity
New
Yo
rk C
ity (
20
09
)

10
Notes:
1. Combination of Detroit Water and Detroit Wastewater.
2. San Diego has no separate treatment allocation for wastewater
3. Detroit‟s CSO control basins are included in wastewater collection. Chicago‟s flood and pollution
control is included in wastewater collection.
0%
10%
20%
30%
40%
50%
60%
70%
80%
90%
100%
New
York
City
(2009)
Detr
oit (
2006)
1
Mia
mi-D
ade
(2007)
Milw
aukee
(2006)
Detr
oit (
2006)
Denver
(2007)
Detr
oit (
2006)
Chic
ago (
2009)
San D
iego
(2009)
2
St. L
ouis
(2007)
Municipality
Co
mm
itm
en
t P
erc
en
tag
e
Other
Water Distribution
Water Treatment
Wastewater Collection
Wastewater Treatment
DEP expends approximately 80% of its annual operating budget on direct water, wastewater, and stormwater operations
Source: Booz Allen analysis
Water/Wastewater
UtilitiesWater Utilities Wastewater Utilities
Other category generally
includes customer service,
indirects and general
support, planning and
engineeringNew
Yo
rk C
ity
(20
09
)

11
Labor construction costs, one variable for evaluating future costs, are relatively high in New York City
La
bo
r In
de
x
0
50
100
150
200
250
1999 2000 2001 2002 2003 2004 2005 2006 2007
Source: RS Means, Booz Allen analyses
On average, since 1999 nationwide inflation (based on RS Means Historical Cost Index)
has been running at 4.7% per year.
Regionally, labor costs are 64.5% higher and material costs are 5.3% higher in NY
compared to the RS Means 30-city average.
New York City
San Francisco
Boston
Detroit
PhiladelphiaLouisville
Atlanta
Miami
ChicagoAverage

12
20
22
24
26
28
30
32
34
2005 2006 2007 2008
New York
San Francisco
BostonDetroit
Philadelphia
Louisville Atlanta
Miami
Chicago
Average
Labor costs for government workers are also higher in New York than in most other areas
Ho
url
y E
arn
ing
s (
$)
Source: U.S. Department of Labor, Booz Allen analyses

13
NYCDEP Capital Budget and Comparison to other Cities

14
$0
$1
$2
$3
M ANDATED DEPENDABILITY STATE OF GOOD REPAIR BWSO ALL OTHER
0%
25%
50%
75%
100%
Percent of CIP Mandated
DEP projects its capital budget requirements annually; budget decreases from $3.3B in 2009 to $1.2B by 2019; however, later years may increase due to yet undetermined mandates
CIP
Am
ou
nts
by T
yp
e
(in
bil
lio
ns)
$3.3B
$1.9B $1.9B
$1.3B
$1.6B$1.5B
$1.2B$1.3B
$1.5B
$1.0B$1.2B
Notes:
1. FY09-FY19 amounts and categories are from DEP Capital Improvement Plan as approved in November 2008.
2. Future Annual CIP revisions may cause changes to what is presented above.
% o
f C
IP M
an
da
ted

15
$0
$1
$2
$3
Water Supply & Transmission Water Distribut ion Wastewater Treatment
Sewers - Combined/Sanitary Customer Service Other
Analyzing annual capital budget by function may allow improved understanding of cost drivers
CIP
Am
ou
nts
by F
un
cti
on
(in
bil
lio
ns
)
$3.3B
Notes:
1. FY09-FY19 amounts are from DEP Capital Improvement Plan as approved in November 2008.
2. Future Annual CIP revisions may cause changes to what is presented above.
0%
25%
50%
75%
100%
Debt Service as Percentage of Annual Budget
$1.9B $1.9B
$1.3B
$1.6B $1.5B
$1.2B$1.3B
$1.5B
$1.0B$1.2B
De
bt
Se
rvic
e
16
0%
10%
20%
30%
40%
50%
60%
70%
80%
90%
100%
Dalla
s *
*
Seattle
Detr
oit *
*
New
York
City *
Phoenix
Pitts
burg
h
Cle
vela
nd *
*
San D
iego *
*
Los A
ngele
s
Louis
vill
e
Denver
Los A
ngele
s
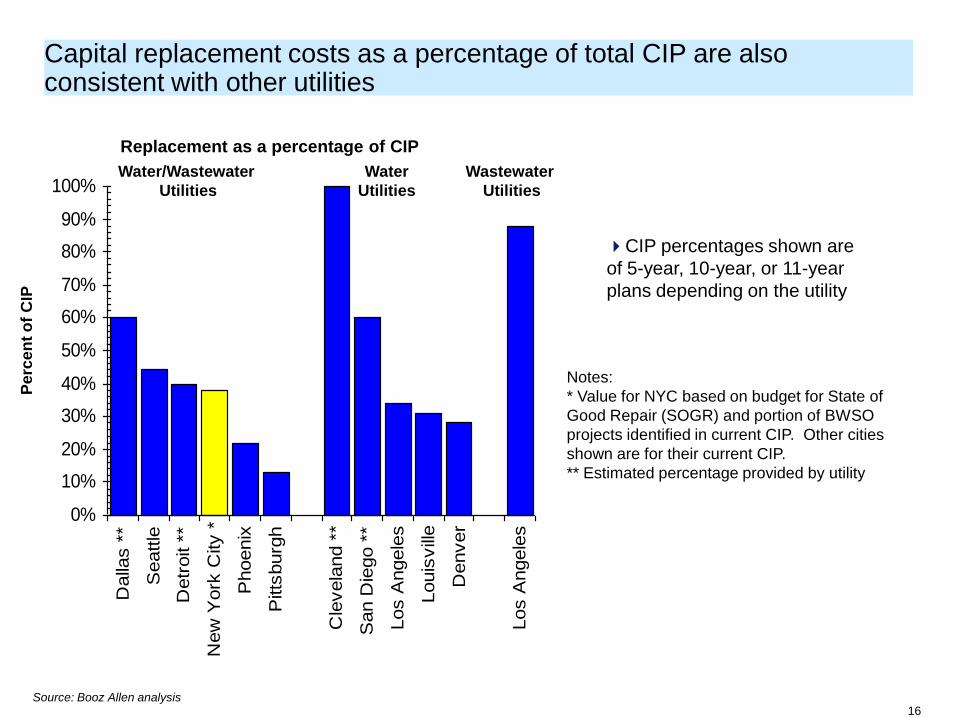
Capital replacement costs as a percentage of total CIP are also consistent with other utilities
Pe
rce
nt
of
CIP
Replacement as a percentage of CIP
Source: Booz Allen analysis
Notes:
* Value for NYC based on budget for State of
Good Repair (SOGR) and portion of BWSO
projects identified in current CIP. Other cities
shown are for their current CIP.
** Estimated percentage provided by utility
Water/Wastewater
Utilities
Water
Utilities
Wastewater
Utilities
CIP percentages shown are
of 5-year, 10-year, or 11-year
plans depending on the utility

17
0%
10%
20%
30%
40%
50%
60%
70%
80%
90%
100%
Pitt
sburg
h
New
York
City
*
Detr
oit
**
Seattle
Dalla
s *
*
Phoenix
San D
iego
Los A
ngele
s
Louis
vill
e
San D
iego
Los A
ngele
s
Capital commitments associated with mandates are somewhat high compared to other combined water/wastewater utilities, but close to average
Source: Booz Allen analysis
Notes:
* Value for NYC based on
budget for Mandated projects
identified in current CIP. Other
cities shown are for their current
CIP.
** Estimated percentage
provided by utility
Water/Wastewater
Utilities
Water
Utilities
Wastewater
Utilities
Pe
rce
nt
of
CIP
Consent decrees / regulatory
compliance as a percentage of CIPCIP percentages shown
are of 5-year, 10-year, or
11-year plans depending
on the utility
18
NYCDEP Rate Structure, Revenues, and Comparison to other Cities

19
New York City‟s Rate Structure
Rates are set to cover the system's expenses each year, which include cost of treatment,
transmission and distribution, and state of good repair.
– Debt Service on revenue bonds issued to finance City‟s water/wastewater capital program
– Operations & Maintenance expenses
– Rental payment to City pursuant to Lease
Most NYC properties are charged a uniform water rate of $2.61 per 100 cubic feet of consumption
($0.003 per gallon).
– Wastewater charges are levied at 159% of water charges ($4.14 per 100 cubic feet; $0.004 per gallon). This charge also accounts for stormwater services.
About 6% of all properties (mostly multi-family residential), which account for 30% of revenue, are
billed on the basis of a series of fixed “frontage” charges including: the width of the property‟s
street frontage; the number of families; building fixtures and other measures.
– In recognition of importance of affordable housing, DEP has extended frontage for ~ 40k since beginning of metering program in 1992, and is working with Water Board to extend again
– Some buildings are also part of Multifamily Conservation Program, and are billed at a flat rate if they comply with specific conservation measures
Per State Law, some non-profits are also granted partial exemption from water/sewer
charges, though they must still be metered

20
Res
iden
tial
Wat
er a
nd
Sew
er P
rici
ng
(An
nu
al E
stim
ate)
$0
$200
$400
$600
$800
$1,000
$1,200
$1,400
$1,600
1999 2000 2001 2002 2003 2004 2005 2006 2007 2008
New York City (+62%)
Atlanta (+163%)
Average (+70%)
Chicago (+49%)
Footnotes:
1) Percentages reflect overall change between 1999 and 2008.
2) Amounts are taken from annual survey performed on behalf of the NYC
Municipal Water Finance Authority
Though still below the national average, DEP‟s rates have increased steadily over the past decade

21
Residential water/wastewater charges in New York City are relatively low compared to other large U.S. cities surveyed
$0
$1,000
$2,000
Chic
ago
Milw
aukee
St.
Louis
San A
nto
nio
India
napolis
New
ark
San J
ose
Baltim
ore
Dallas
New
York
Housto
n
Detr
oit
Los A
ngele
s
Jacksonville
Washin
gto
n,
D.C
.
Colu
mbus
New
Orleans
Honolu
lu
Cle
vela
nd
San D
iego
Bosto
n
Philadelp
hia
San F
rancis
co
Atlanta
2008 Average Residential Rates
$1,477
New York City’s residential rates
are 14% below the average for
24 large U.S. cities surveyed
Surveyed Cities
Average Annual
Rate:$817
$282
$699
20
08
Res
ide
nti
al R
ate
s
(An
nu
al
Es
tim
ate
)
Notes:
1. Values above are based on an average annual
household consumption of 100,000 gallons per year and
a 5/8” or 3/4” meter. Effective rate for NYC is $5.23/CCF
2. Water rates reflect data received as of March 2008.
NYC Water Board increased rates by 14.5% effective
July 1, 2008.
Source: Amawalk, 2008Ne
w Y
ork
Cit
y

22
Commercial water/wastewater charges in New York City are about average compared to other large U.S. cities surveyed
$0
$5,000
$10,000
$15,000
$20,000
Chic
ago
St.
Louis
Dallas
India
napolis
Milw
aukee
San A
nto
nio
Baltim
ore
San J
ose
New
ark
Detr
oit
Jacksonville
New
York
Los A
ngele
s
Colu
mbus
New
Orleans
Housto
n
Washin
gto
n,
D.C
.
San D
iego
Philadelp
hia
Honolu
lu
Cle
vela
nd
San F
rancis
co
Bosto
n
Atlanta
2008 Average Commercial Rates
$16,204
New York City’s commercial rates
are 7% below the average for 24
large U.S. cities surveyed
Surveyed Cities
Average Annual Rate:$7,518
$3,717
$6,994
20
08
Co
mm
erc
ial R
ate
s
(An
nu
al
Es
tim
ate
)
Source: Amawalk, 2008Note: Water rates reflect data received as of March 2008.
NYC Water Board increased rates by 14.5% effective July
1, 2008. Values above are based on an average annual
commercial facility consumption of 1 million gallons per
year and the average of 1” and 2” meters.
Ne
w Y
ork
Cit
y

23
Industrial water/wastewater charges in New York City are relatively equal to the average of other large U.S. cities
$0
$1,000,000
$2,000,000
Chic
ago
St.
Louis
India
napolis
Dallas
Milw
aukee
San A
nto
nio
Philadelp
hia
Baltim
ore
Detr
oit
San J
ose
New
ark
Jacksonville
New
Orleans
Colu
mbus
New
York
Los A
ngele
s
Housto
n
San D
iego
Washin
gto
n,
D.C
.
Honolu
lu
Cle
vela
nd
San F
rancis
co
Bosto
n
Atlanta
2008 Average Industrial Rates
$1,636K
Surveyed Cities
Average Annual Rate:$696K
$371K
$699K
20
08
In
du
str
ial
Ra
tes
(An
nu
al
Es
tim
ate
)
New York City’s industrial rates are
less than 0.5-percent above the
average for 24 large U.S. cities
surveyed
Source: Amawalk, 2008
Note: Water rates reflect data received as of March 2008.
NYC Water Board increased rates by 14.5% effective July 1,
2008. Values above are based on an average annual
industrial facility consumption of 100 million gallons per year
and the average cost of a 6” and 8” meter.
New
Yo
rk C
ity

24
DEP has a lower revenue per capita compared to other combined water/wastewater utilities
Source: Booz Allen analysis
<1 million population
>1 million population
LEGEND
Notes:
1. NYC revenue is $2.54B with a total
population of 9.3M.
2. Values shown are from the most
recently closed FY for each utility
Only Dallas has a lower standard
residential water/wastewater charge,
1.1% lower, compared to NYC but still
has a higher revenue per capita rate.
A general correlation can be observed
between the size of the served population
and the revenue received per capita.
Larger utilities tend to reveal a lower
overall annual revenue per capita partially
due to economies of scale.
Annual Revenue Per Capita
213
288
273
371
421
462
470
527
568
604
663
0 100 200 300 400 500 600 700
Philadelphia
Phoenix
New York City
Dallas
Pittsburgh
Boston
Niagara Falls
San Francisco
Washington DC
Seattle
Detroit
25
0%
10%
20%
30%
40%
50%
60%
70%
80%
90%
100%
Det
roit
Pitt
sburg
hP
hila
delp
hia
Chi
cago *
Dal
las
Bost
on
New
York
City
San
Fra
nci
sco
Seat
tleN
iagara
Falls
Mia
mi
Wash
ingto
n D
CP
hoe
nix
Cle
vela
nd
Los
Angele
sS
an
Die
go
Cin
cinn
ati
Den
ver
Milw
auke
eLouis
ville
Utic
a
Los
Angele
sS
an
Die
go
Chi
cago
Water Charges Wastewater ChargesWater/Wastewater Charges Fire Protection FeesNew Development Charges Ad Valorem TaxesOther
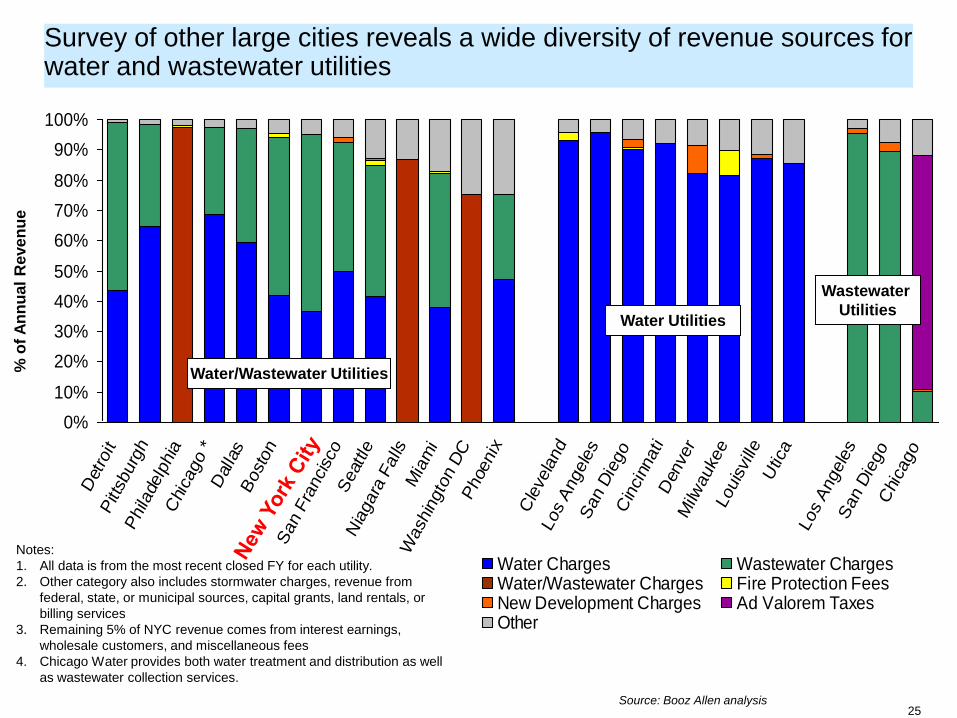
Survey of other large cities reveals a wide diversity of revenue sources for water and wastewater utilities
Source: Booz Allen analysis
Water/Wastewater Utilities
Water Utilities
Wastewater
Utilities
% o
f A
nn
ual
Reve
nu
e
Notes:
1. All data is from the most recent closed FY for each utility.
2. Other category also includes stormwater charges, revenue from
federal, state, or municipal sources, capital grants, land rentals, or
billing services
3. Remaining 5% of NYC revenue comes from interest earnings,
wholesale customers, and miscellaneous fees
4. Chicago Water provides both water treatment and distribution as well
as wastewater collection services.

26
DEP is highly reliant on revenues from user charges however water and wastewater charges
Most utilities recover greater than
85-percent of their revenues from
user charges
Other key revenue sources
outside of rates, by other utilities,
include sales to wholesale
customers, new development
charges, and fire protection fees
Low rate recovery for Chicago
MWRD is due to reliance on
revenues from the general fund
(taxes), nearly 78%
Source: Booz Allen analysis
Municipality
Revenue from W/WW/SW
Charges
Detroit (W/WW) 98.9%
Pittsburgh (W/WW) 98.6%
Philadelphia (W/WW) 97.5%
Chicago Water (W/WW) 97.4%
Dallas (W/WW) 96.9%
New York City (W/WW) 94.9%
Boston (W/WW) 94.1%
San Francisco (W/WW) 92.5%
Niagara Falls (W/WW) 86.6%
Seattle (W/WW) 84.9%
Miami (W/WW) 82.2%
Phoenix (W/WW) 75.1%
DCWASA (W/WW/SW) 75.1%
Los Angeles DWP (W) 95.7%
Cleveland (W) 93.0%
Cincinnati (W) 92.0%
San Diego (W) 90.3%
Louisville (W) 87.2%
Utica (W) 85.6%
Denver Water (W) 82.3%
Milwaukee Water Works (W) 81.4%
Los Angeles Water Works (WW) 95.6%
San Diego (WW) 89.5%
Las Vegas/ Clark County (WW) 66.3%
Chicago MWRD (WW/SW) 10.2%

27
Most major utilities, utilizing AMR, bill customers on a monthly or a more frequent basis
Nu
mb
er
of
Ac
co
un
ts
(in
th
ou
sa
nd
s)
Billing Frequency for Residential Accounts
Monthly Bi-Monthly Quarterly0
100
200
300
400
500
600
700
Washington, DC
Phoenix
Los Angeles
DWP
Denver
Milwaukee
Cleveland
Detroit
Kansas City
NYC DEP800
900
Using AMR
Just beginning to use AMR
Not Using AMR
Automatic meter reading
(AMR) allows more frequent
billing to be performed
DEP is currently initiating its
AMR program
AMR allows more flexibility
for rate structures (e.g.
drought pricing, etc.)
Source: Booz Allen analysis
Seattle
Louisville
San Diego
San Francisco

28
Affordable Housing programs correlate with utilities that have high revenues per capita (e.g. SF, DC, Seattle and Detroit)
CITY
Administration Type of Affordable Housing
Funds/
Discounts
Criteria/
Process ParticipantsUtility
Non-
Utility
Low
Income Elderly Other
Cleveland X X X 0.5% of utility funds 2,000
Dallas X (ST)
Detroit X X Annual income<150% of FPV
for family of 4
800 since
2003
Los Angeles X X 31% discount on first 9hcf of
sewage/month; funded
through low income surcharge
on other customers, approx.
$7.5M/yr
Annual income < $43.2k for
family of 4
50,000
Miami X X $500k for 2008/09 Annual income <$26.7k
Philadelphia X X X 25% discount; also applies to
charities, churches, non profit
hospitals, schools and
universities
San Francisco
(1)
X X
(SFH)
Annual income <175% of
FPV
6,643
San Francisco
(2)
X X
(NP/MFH)
Selected by Mayor‟s Office of
Housing
54
San Francisco
(3)
X X (BH) Voluntary 30
Seattle (1) X X X (D/B) 70% of state median income
Seattle (2) X Annual income <20% of FPV
Washington (1) X X Funded through contributions 200/yr
Washington (2) X X Discount of 400cf/month; max
of $84/yr; funded directly from
revenues, approx. $1M/yr
Max. 5,500/yr
Source: Booz Allen analysis
LEGEND
X – applies
BH – boarding houses
D/B – disabled/blind
FPV – Federal poverty level
NP/MFH – non-profit multi-family
housing
SFH – single family household
ST – short-term

29
Survey of affordability programs reveals some common practices used within the water industry
In recent years, the use of low income and other affordability programs by
water utilities have increased significantly. Programs may offer direct
discounts to customers or solicit voluntary contributions for assistance.
As evident from the Phase 1 survey, affordable housing programs are
typically not administered by the utility organization, rather through another
government or outside social services agency.
The NYC Water Board is prohibited from offering free service except for
limited categories of exemptions (e.g., non-profit charitable or religious
institutions).
The Board currently offers one assistance program referred to as the Multi-
family Conservation Program (MCP). Under MCP, owners of housing
consisting of six or more dwelling units are offered a fixed charge per dwelling
unit in lieu of metered billing. Owners are required to cooperate on
conservation efforts and invest in low-flow plumbing and fixtures.

30
NYCDEP Financing Mechanisms and Comparison to other Cities

31
0%
25%
50%
75%
100%
Chic
ago W
ate
r
New
York
City
, 2009
New
York
City
, 2010
Pitt
sburg
h
San F
rancis
co
Kansas C
ity
Detr
oit
Dalla
s
Seattle
Bosto
n
Mia
mi
Washin
gto
n D
C
Cle
vela
nd
Cin
cin
nati
San D
iego
Denver
Louis
vill
e
Chic
ago M
WR
D
San D
iego
Las V
egas
Los A
ngele
s
Other
Tax Revenue
Grants
New development charges
Cash (PAYGO)
Proceeds of debt based on
SRF (in Boston, M WRA loans)
Proceeds of debt based on
bond issuance
New York City relies heavily on proceeds of debt to finance capital improvements
% o
f C
IP b
y C
ate
gory
Notes:
1. Data for cities other than New York are based on average of approved CIPs.
2. Chicago Water (includes wastewater collection service) derives the majority of
its revenues from user charges; Chicago MWRD derives the majority of its
revenues from ad valorem taxes.
3. „Other‟ funding category includes municipal contributions that could be paid
from the proceeds of debt or cash (29% for Washington DC, 8% for Miami).
Water UtilitiesWater & Wastewater Utilities Wastewater
Utilities
New
Yo
rk C
ity,
FY
09 P
roje
cte
d
New
Yo
rk C
ity,
FY
10 B
ud
gete
d
New York City Sources of Financing
For FY10, New York City has
budgeted:
84% Proceeds of debt based
on bond issuance
12% Proceeds of debt based
on SRF loans
4% PAYGO
Although PAYGO was originally
budgeted for FY08 and FY09,
no deposits were made.

32
As a result, NYC‟s debt service as a percentage of revenue is also higher than average
53
4745
42
33
29
25 2422
33
22
19
12 11
38
33
0
10
20
30
40
50
60
San Francisco
Boston
New
York
Detroit
Dallas
Niagara Falls
Kansas City
Washington, D
C
Miam
i
Philadelphia
Utica
Denver
San Diego
Louisville
San Diego
Los Angeles
Deb
t S
erv
ice a
s
Perc
en
tag
e o
f A
nn
ual
Reven
ue
Source: Booz Allen analysis
Average Debt Service
As Percentage of Annual Revenue
Notes:
1. Values shown are based on current budgets
2. Value for NYC includes general obligation debt service
Water/Wastewater Utilities Water Utilities Wastewater Utilities
31%

33
List of alternative financing options include sources of revenue other than debt
Financing Techniques
Alternative Description Considerations
PAYGO Uses annual revenue or other available
cash to pay directly for capital
improvements
• Reduces the amount to be raised through debt, thus reducing debt
service in the future
• Enhances liquidity – amount can be reduced to provide cash for other
uses in the event of a shortfall
• If dollars are raised through customer payments, current customers
are paying for long-term assets
Proceeds of Bonds Bonds are sold with principal and
interest to be paid through revenues of
the system
• Authority‟s high credit ratings enable it to borrow funds at very
competitive rates
• Long-term repayment of the bonds enables both current and future
users of the system to pay their share
State Revolving Fund (SRF)
Debt
Bonds are sold with principal and
interest to be paid through revenues of
the system
• Subsidized interest rate on SRF debt results in lower interest costs
compared to Authority bonds
• NYC is already at the limit of what the SRF can offer
New Development Charges
or Impact Fees
Charges to property developers to cover
the cost of their impact on the system or
their cost of buying-in to the system
• Provides source of construction cash for PAYGO and/or debt service
• Typically adds a modest amount to development cost
• Current economic downturn
Tax Revenue Use of property tax, sales tax or other
tax revenue to subsidize water and
sewer rates
• Used by Atlanta (1 cent sales tax) and Chicago (property taxes) but it
is generally not used
• Raises equity questions – the dollars charged for taxes may have no
relationship to water/sewer use

34
DEP Intergovernmental Transfers (IGTs) and Comparison to other Cities
-30 -25 -20 -15 -10 -5 0 5
Milwaukee (W)
Los Angeles (WW)
Louisville (W)
Dallas (W/WW)
Utica (W)
New York City (W/WW)
Pittsburgh (W/WW)
Los Angeles (W)
Washington DC (W/WW)
Seattle (W/WW)
Cleveland (W)
Detroit (W/WW)
San Diego (W)
Boston (W/WW)
Philladelphia (W/WW)
San Francisco (W/WW)
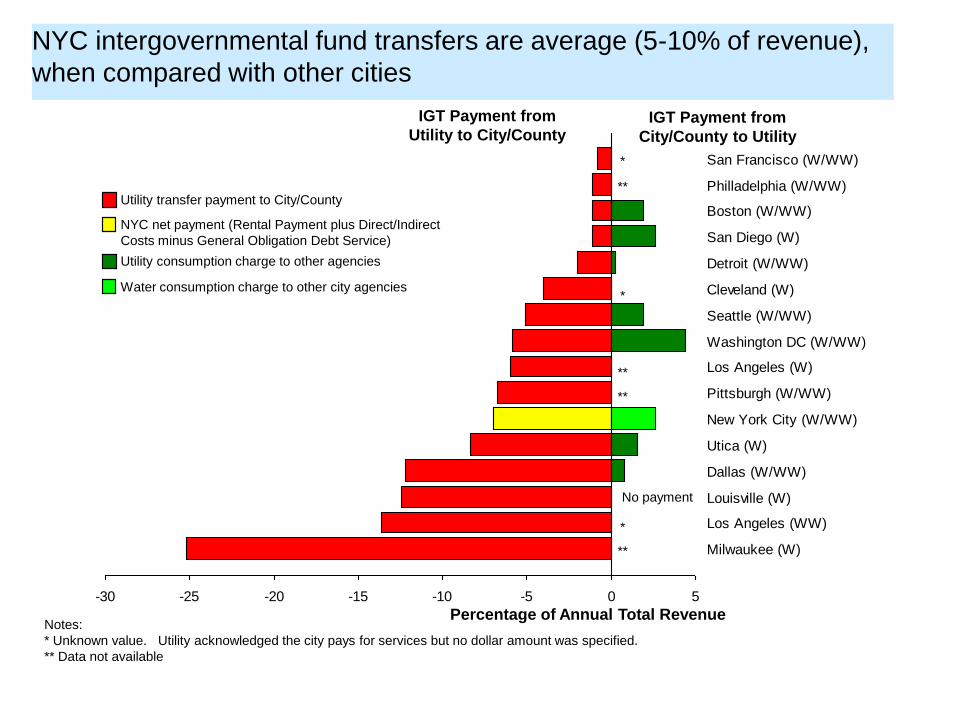
NYC intergovernmental fund transfers are average (5-10% of revenue),
when compared with other cities
IGT Payment from
Utility to City/County
Percentage of Annual Total Revenue
IGT Payment from
City/County to Utility
No payment
*
Notes:
* Unknown value. Utility acknowledged the city pays for services but no dollar amount was specified.
** Data not available
**
**
*
NYC net payment (Rental Payment plus Direct/Indirect
Costs minus General Obligation Debt Service)
Water consumption charge to other city agencies
Utility consumption charge to other agencies
Utility transfer payment to City/County
**
*
**

-30 -25 -20 -15 -10 -5 0
Milwaukee (W)
Los Angeles (WW)
Louisville (W)
Dallas (W/WW)
Pittsburgh (W/WW)
Utica (W)
Los Angeles (W)
New York City (W/WW)
Cleveland (W)
Seattle (W/WW)
Detroit (W/WW)
Washington DC (W/WW)
Philladelphia (W/WW)
San Francisco (W/WW)
San Diego (W)
Boston (W/WW)
When city services are deducted, DEP payments are even lower relative
to the average
Net IGT from Utility to City/County
Percentage of Annual Total RevenueFootnotes:
* Payments from Boston & San Diego to Utility exceed Utilities‟ payments to their respective cities.
** Value does not include deduction for utility‟s consumption charge to the City/County, as survey respondent did not
provide this information or value was unknown.
*** Louisville is not charged for water consumption by the Utility.
NYC net payment (Rental Payment plus
Direct/Indirect Costs minus General Obligation Debt
Service minus water charges from City)
Net transfer between Utility and City/County
***
**
**
**
**
*
*
**
**
**

37
In fact, DEP receives more services in return than most other utilities surveyed
Breakdown of New York City
transfer amounts:
• Rental Payment $178.6 M
• Direct/Indirect Costs
$56.2 M
• Less General Obligation
Debt Service $55.9 M
LEGEND
X = Service provided
• = Direct / indirect cost
RP = Rental Payment
Notes
1 New York City underwrites
the portion of tort claims
exceeding 5% of prior year
revenues. This helps the
Board avoid the need to
purchase catastrophic
insurance coverage, helping
to minimize costs and rates.
It also minimizes the risk of a
rate increase to cover
unexpected tort costs not
covered by insurance.
2 New York City also provides
liquidity for construction
payments – it first pays
contractors and vendors and
is then reimbursed from
capital funds.
DallasEnterprise funded by
City of Dallas x x x x x x x x x x x x x $57.000 12.2%
Pittsburgh Public authority x x x x x x $9.650 6.8%
New York City
System leased from
City; independent
Water Board &
Authority R P R P • • • • • •R P
(1)
R P
(2) • R P $178.900 7.0%
DCWASAIndependent Water
Authority x x x x x $19.300 5.9%
Seattle
Department of city's
public utilities group x x x x x x x $19.000 5.1%
Niagara Falls
System owned by
independent water
board; independent
authority x x x x x $0.700 2.8%
BostonIndependent
commission x x x x x $3.010 1.1%
San Francisco
Department of public
utilities commission x x $3.500 0.8%
MilwaukeeComponent of city
department x x x x x x x x x x x x x $17.500 25.2%
LouisvilleMunicipally-owned
corporation x x x $18.300 12.5%
Buffalo
System owned by
independent water
board; independent
authority x x x x x x x x x $4.700 11.5%
Utica
System owned by
independent water
board; independent
authority x x x $1.560 8.3%
Cleveland City agency x x x x x $10.500 4.0%
San DiegoDepartment of city's
public utilities group x x x x x x x $5.000 1.1%
Los Angeles City bureau x x x x x x x x $74.000 13.6%
Str
eet
Sw
eep
ing
Str
eet
Pavin
gs
Liq
uid
ity S
up
po
rt
Deli
nq
uen
t B
ill
Co
llecti
on
(in
rem
)
% o
f R
even
ues
Valu
e o
f P
aym
en
ts
(mil
lio
ns)
Oth
er
Sto
rmw
ate
r S
erv
ices
Facil
ity/S
treet
Ren
tals
Veh
icle
Rep
air
/Main
t.
Hu
man
Reso
urc
es
Pro
cu
rem
en
t
Tra
sh
Pic
ku
p
Facil
ity M
ain
ten
an
ce
City
Governance
Structure Leg
al
Ad
min
istr
ati
on
Po
lice a
nd
Fir
e D
ep
t
Serv
ices
Insu
ran
ce
Fin
an
ce
Bu
dg
eti
ng

38
Methodologies vary for computing transfer payments made by water utilities to cover the costs of municipal services
Alternative Description Considerations
City-Determined
PILOT (Payment
In Lieu of Taxes)
Specific payment determined by municipality in consideration
of tax waiver; may or may not be based on cost study (e.g.,
Washington D.C., Buffalo, Dallas)
Dallas - PILOT formula (assets in city times tax rate) and
Street Rental (4% of operational revenue); indirects are provided
based on cost studies performed every 1-2 years
May be set by the City without cost
basis (e.g., Washington D.C.)
May be based on a formula (e.g.,
Utica)
Non formula-based results may result
in increases that are less predictable
Percentage of
Utility Revenues
A percentage of operating revenue is paid to the City (e.g., Los
Angeles)
Easy to understand
Incremental revenue increases lead to
increased payments
Dividend to the
City
A percentage of net income is paid to the City (e.g., Louisville)
Could also be based on asset value
Louisville - Payment of dividend computed as 60% of net
income available for distribution. Net income available for
distribution is computed as net income less bond principal
payments made during the year.
Requires clear definition of method of
calculation
Dividend is not as commonly used as
other techniques
Reimbursement
of Municipal
Costs for
Services
Provided
Based on actual and/or estimated costs of providing services
(e.g., Boston)
Milwaukee - Milwaukee Water Works itemizes each of the
costs of city services. In 2007, this amounted to $17.5 million,
excluding the cost of administration and fringe benefits, which
are also paid by the City.
Methodology that most likely reflects
the actual direct costs of the city in
supporting the utility
Not necessarily as simple as other
methods - implies the need to keep
records to show cost of service
Provides no compensation for risks
undertaken by the city in supporting the
utility

39
Phase II: Evaluation of Alternative Rate Structures

40
Introduction

41
Alternative Rate Structures Evaluated
Fixed charges
Separate Stormwater Charges
New Development Charges
Water Conservation Charges
1
2
3
4
Based on survey responses, DEP identified four alternative rate structures, all of which meet
the following criteria:
Commonly and successfully employed by other municipalities
Potential for increased revenue generation or stability, customer equity, resource
conservation
The four alternative rate structures DEP identified are:

42
Rate Study Objectives
In light of rising capital costs, increasing rates and anticipated future needs, the primary objective
of DEP‟s study is to analyze different rate structures and charges, with particular attention paid to
their effect on:
− Financial stability
− Equity
− Water conservation
− Storm water management
− Other best management practices
Other important considerations include:
− Ratepayer sensitivity
− Economic competitiveness
− Ease of Implementation (Internally/Publicly)
− Future System needs
− Affordable housing stock
− Regulatory/water quality concerns

43
Ratepayer and Revenue Impacts Evaluated by 17 Customer Classes
Land use ClassificationNo. of BBLs
FY2009 Stormwater Rate Alternatives Analysis - Charges Per BBL
Current Water/Sewer Bill
($)
Reduction in Sewer Charges
($)
Alternative 1 Alternative 2 Alternative 3
Stormwater Amount ($)
New Water/Sewer Bill ($)
% Change vs. Current
Stormwater Amount ($)
New Water/Sewer Bill ($)
% Change vs.
CurrentStormwater Amount ($)
New Water/Sewer Bill ($)
% Change vs.
Current1. Tax Class 1 - One Family Dwellings
2. Tax Class 1 - Other (Two-Three Family some w/stores)
3. Multi-Family Buildings
4. Mixed Residential & Commercial Buildings
5. Residential Institutions
6. Hotels
7. Hospitals And Health
8. Public Facilities & Institutions
9. Educational Structures
10. Parking Facilities
11. Industrial & Manufacturing Buildings
12. Stores
13. Office Buildings
14. Open Space & Outdoor Recreation
15. Transportation & Utility
16. Vacant Land
17. Miscellaneous
44
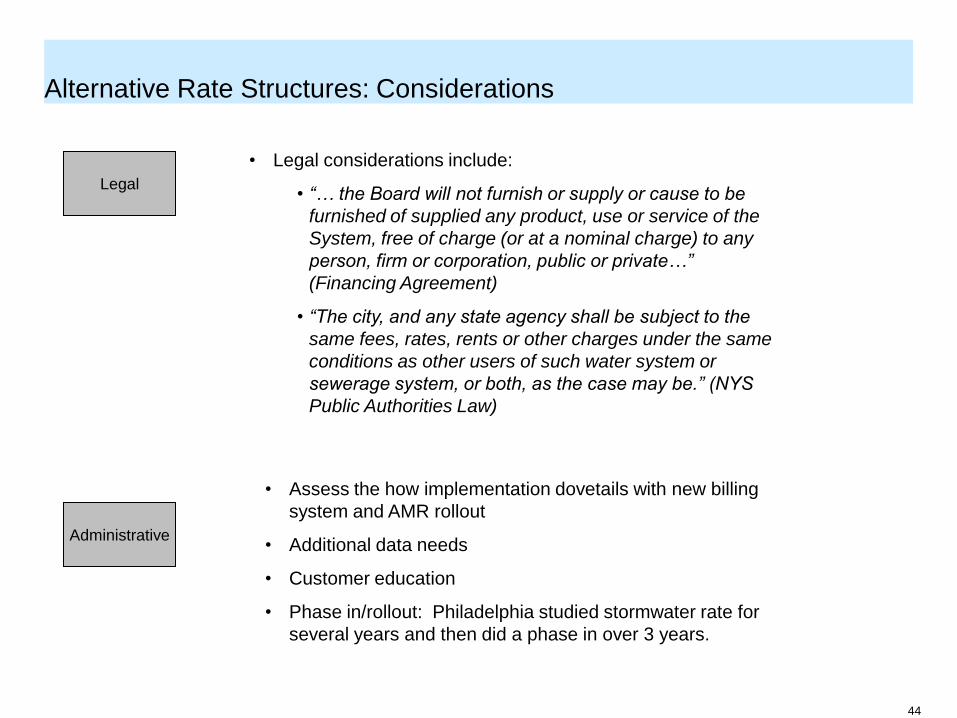
Alternative Rate Structures: Considerations
Administrative
Legal
• Legal considerations include:
• “… the Board will not furnish or supply or cause to be
furnished of supplied any product, use or service of the
System, free of charge (or at a nominal charge) to any
person, firm or corporation, public or private…”
(Financing Agreement)
• “The city, and any state agency shall be subject to the
same fees, rates, rents or other charges under the same
conditions as other users of such water system or
sewerage system, or both, as the case may be.” (NYS
Public Authorities Law)
• Assess the how implementation dovetails with new billing
system and AMR rollout
• Additional data needs
• Customer education
• Phase in/rollout: Philadelphia studied stormwater rate for
several years and then did a phase in over 3 years.
45
Fixed Charges

46
Fixed Charges: Commonly Used by Water and Electric Utilities NYC Customers Currently See Fixed Charges on Electric Bills
Sample bill for DC WASA
residential customer
Fixed charges make up 5%
of this bill.

47
Why Explore a Fixed Charge for NYC?
Most large water utilities surveyed utilized some form of fixed charge as part of their rate structure.
Provides a more predictable revenue streamthan consumption-based charge under decreased consumption
– fixed costs as a share of a customer‟s total bill increases.
Utility fixed costs, particularly capital costs, are rising independent of customer use
Banks and mortgage companies may be more able to escrow fixed payments.
Move to
decouple
rates (fixed
and variable)
Capital Costs
Rising
Fixed costs
increasing as
% of revenue
requirements
Projected Annual Replacement Need For T&D
0.00%
0.50%
1.00%
1.50%
2.00%
2.50%
2000 2005 2010 2015 2020 2025 2030 2035 2040 2045 2050
Year%
of
Re
pla
ce
me
nt
Ne
ed
(transmission and distribution)

48
1,000
1,100
1,200
1,300
1,400
1,500
1,600
1960 1965 1970 1975 1980 1985 1990 1995 2000 2005 2010
Wate
r D
em
an
d (
MG
D)
6.0
6.5
7.0
7.5
8.0
8.5
Po
pu
lati
on
(M
illio
ns)
Water Demand (MGD) Population
Average Daily
Consumption
(MGD)
2005: 1,108
2006: 1,069
2007: 1,114
2008: 1,083
FY09: 1,039
1966: 1,045 MGD
WHY CONSIDER A FIXED CHARGE? NYC simultaneously instituted consumption-based billing and major conservation programs, resulting in loss of revenues
Consumption-
based billing
implemented
simultaneously
with decline in
consumption

49
Other Utilities Recover 2 to 25% of Costs via Fixed Charges Most Often Reflecting Billing, Meter Reading or Capital Costs
0 5 10 15 20 25
Kansas City (W/WW)
San Diego (W)
Philadelphia (W)
Louisville (W)
San Diego (WW)
San Francisco (W/WW)
Dallas (W/WW)
Cleveland (W)
Denver (W)
DC WASA (W/WW)
A California study shows that as long as fixed charge is no greater than 30%,
conservation is still encouraged.

50
Component Percent Cumulative Percent
Customer Service-Meter reading,
billing and collections, meter maintenance
and repair
2.2% 2.2%
Upstate Taxes 4.3% 6.5%
Indirect Costs paid to the City 0.7% 7.2%
Debt Service 41% 48.2%
Fixed Cost Components of NYC Water and Wastewater Budget FY09
Many personnel related costs can also be considered fixed.

51
Assuming a 5% drop in consumption, a 25% fixed charge would help
improve long term revenue stability
-$126M
(3.5%)
-113M
(3.1%)
-$94M
(2.6%)
$-
$1
$2
$3
$4
No Drop-Current Drop-Current Drop Under 10%
Fixed
Drop Under 25%
Fixed
Scenario
Re
ve
nu
e (
$ B
illio
ns
)
Consumption-based Revenue from
Metered Customers
Fixed Revenue from Metered
Customers
City/HHC Revenues
Frontage Revenues
Based on FY14

52
Other Considerations
Few legal considerations: Common practice accepted in the industry.
Administrative Needs:
– Pursuing possibility under current billing system. May need to await new billing system. Also need to consider timing with respect to AMR rollout.
– Further develop formula for customer allocation based on housing units or meter size.
– May require downsizing meter sizes.

53
Stormwater Charges

54
Why Explore Stormwater Charges for NYC?
Used by over 500 utilities
– Philadelphia, Washington DC, San Diego, San Antonio, San Jose, Milwaukee, Detroit, St. Louis, Columbus, Seattle and Wilmington, DE
Stormwater management has evolved significantly in recent years. No longer just conveyance.
Stormwater expenditures are projected to continue increasing to meet more stringent regulatory standards.
The effects of more intense precipitation events and flooding and increased demand on the system.
Although critical to NYCDEP‟s mission, certain sewer work is deferred when necessary to meet the agency‟s numerous regulatory mandates. Development pressures from rezonings and population growth adds further strains.
Most NYC charges are based on the volume of potable water consumed. Little or no correlation exists between consumption and stormwater generated by a property. As stormwater costs rise, equity issues may become more significant.
Creates public awareness around stormwater issues and can encourage best management practices.

55
Allocating Expenditures to Stormwater: FY09 to FY19(9.5% budget scenario)
$ M
illio
ns
$0
$50
$100
$150
$200
$250
$300
$350
$400
$450
$500
2009 2010 2011 2012 2013 2014 2019
Rental Payment
Cash Financed Construction
Debt Service
Operating Expenditures
$258 $268$280
$291$307
$327
$440
Initially, two-thirds of stormwater revenue requirements are due to operating expenses
Between 2009 and 2019, stormwater-related debt service increases by 220% and stormwater share
of rental payment increases by 95%, while operating expenditures allocated to stormwater increase
by only 21% over the same time frame
Stormwater costs as % of overall budget do not increase. Remain in the 10% range because water
and wastewater (sanitary) costs are also rising.
Note: Amounts shown represent the portion of expenditures attributable to storm water
56
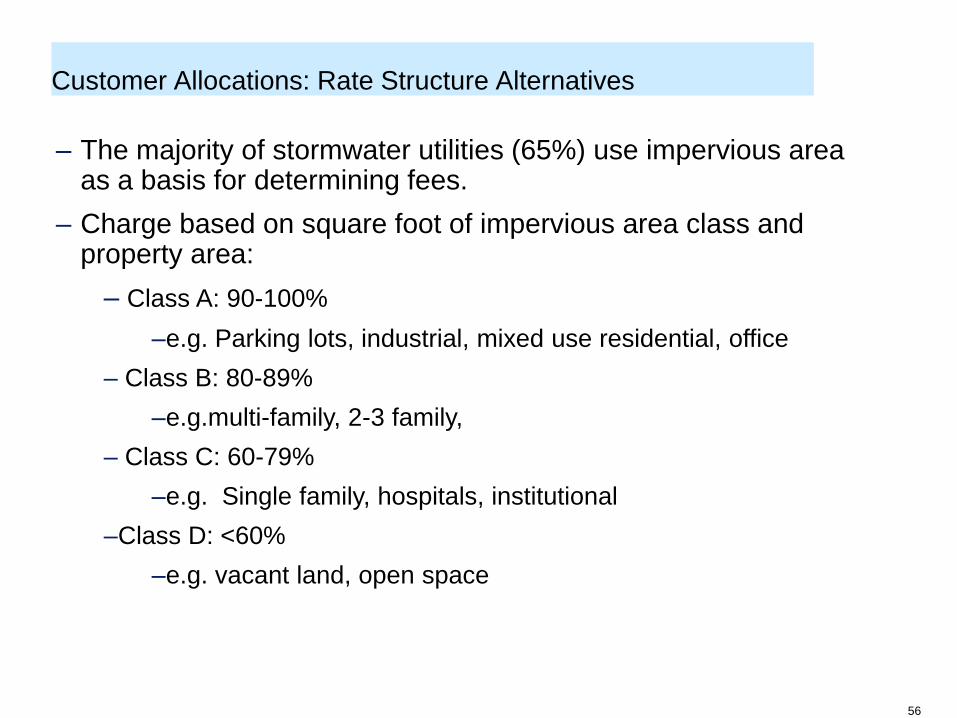
Customer Allocations: Rate Structure Alternatives
– The majority of stormwater utilities (65%) use impervious area as a basis for determining fees.
– Charge based on square foot of impervious area class and property area:
– Class A: 90-100%
–e.g. Parking lots, industrial, mixed use residential, office
– Class B: 80-89%
–e.g.multi-family, 2-3 family,
– Class C: 60-79%
–e.g. Single family, hospitals, institutional
–Class D: <60%
–e.g. vacant land, open space

57
Initial analysis of a stormwater rate in NYC suggests multi-family and commercial buildings may fare better than single family homes and industrial properties under certain stormwater scenarios
13%
3%
-6%
-7%
12%
-2%
-8%
1. Tax Class 1 - One Family Dw ellings at Average
Consumption Level
2. Tax Class 1 - Other (Tw o-Three Family some w /stores)
3. Multi-Family Buildings
4. Mixed Residential & Commercial Buildings
11. Industrial & Manufacturing Buildings
12. Stores
13. Office Buildings
FY09 9.5% budget allocation scenario
$ 738
$ 8,706
$ 1,156
$ 7,140
$ 5,117
$ 6,336
$ 18,770
An additional $27 million (FY09) in new revenue from currently unbilled lots (e.g. parking lots, vacant
land, and other).
58
26%
5%
-12%
-14%
23%
-4%
-16%
1. Tax Class 1 - One Family Dw ellings at Average Consumption
Level
2. Tax Class 1 - Other (Tw o-Three Family some w /stores)
3. Multi-Family Buildings
4. Mixed Residential & Commercial Buildings
11. Industrial & Manufacturing Buildings
12. Stores
13. Off ice Buildings
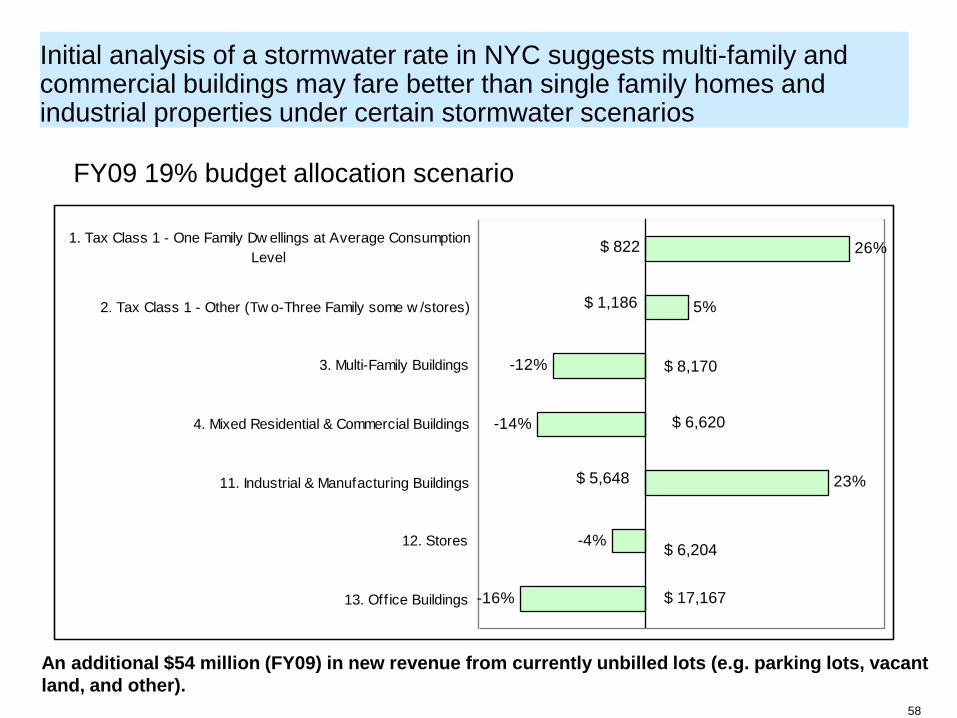
Initial analysis of a stormwater rate in NYC suggests multi-family and commercial buildings may fare better than single family homes and industrial properties under certain stormwater scenarios
FY09 19% budget allocation scenario
$ 822
$ 1,186
$ 8,170
$ 6,620
$ 5,648
$ 6,204
$ 17,167
An additional $54 million (FY09) in new revenue from currently unbilled lots (e.g. parking lots, vacant
land, and other).

59
Cities apply stormwater charges in different ways; over 60% of utilities exempt streets & highways from stormwater fees
Types of Properties Exempted
Source: Black and Veatch, 2007
0
10
20
30
40
50
60
70
PercentageStreets & Highways Undeveloped land Rail ROW
Public Parks Government Churches
School Districts Colleges and Universities Water front
Airports
Sts & Hwys
60
$66 $52 $52 $52 $52
$106
$205
$51
$191
$-
$50
$100
$150
$200
$250
$300
Current Property Size Property Size
with Streets
Impervious
Area
Impervious
Area with
Streets
$ M
illio
ns
Stormw ater Portion
Water/WW Portion
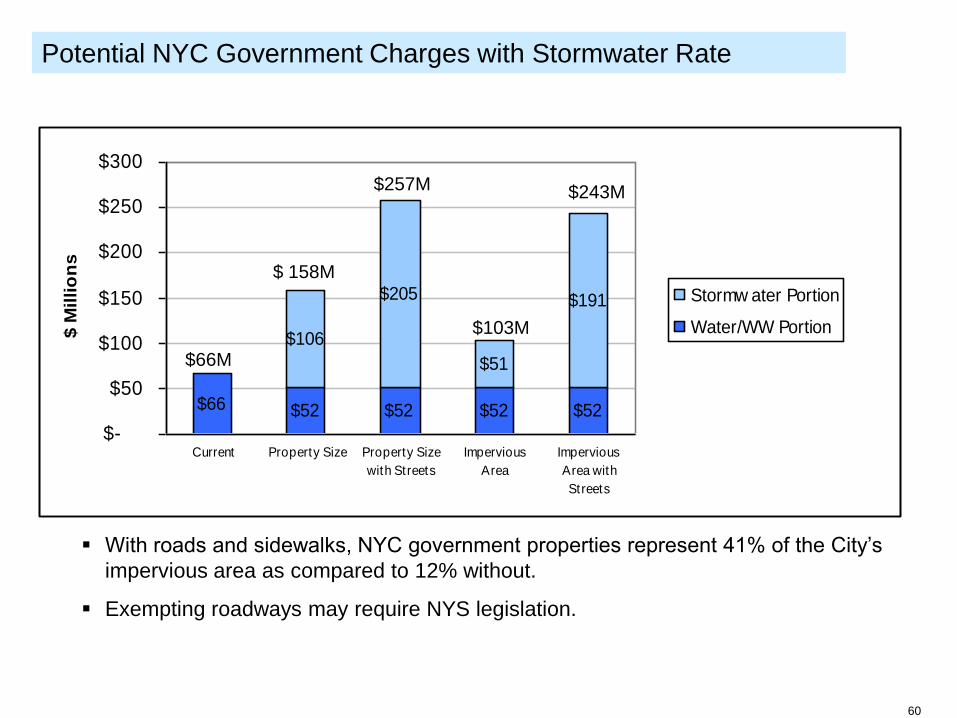
Potential NYC Government Charges with Stormwater Rate
$66M
$ 158M
$257M
$103M
$243M
With roads and sidewalks, NYC government properties represent 41% of the City‟s
impervious area as compared to 12% without.
Exempting roadways may require NYS legislation.
61
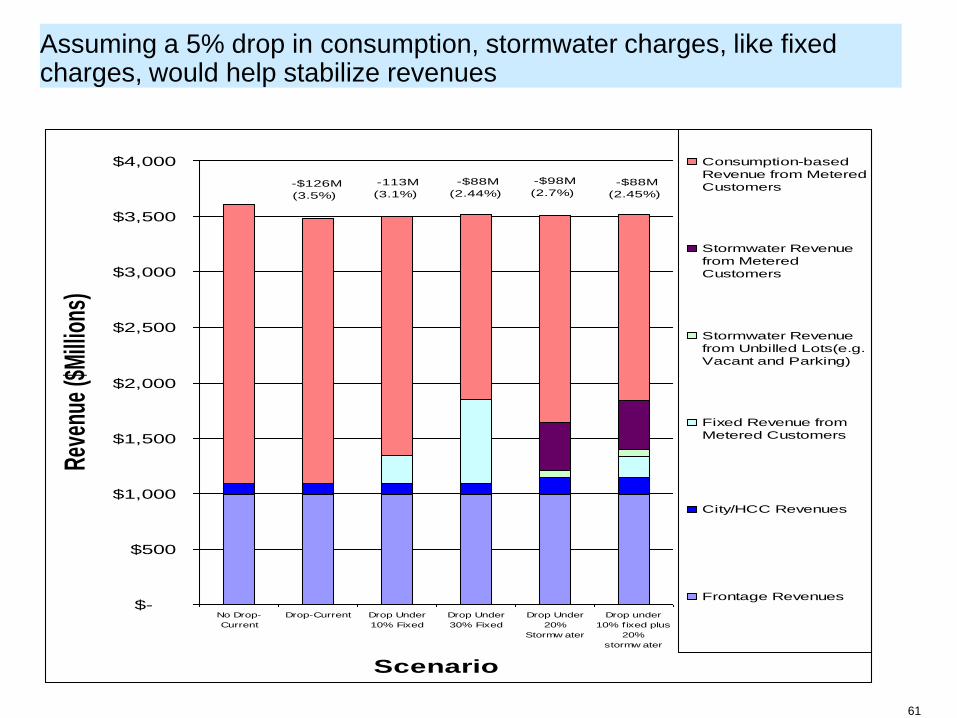
-$126M
(3.5%)
-113M
(3.1%)
-$88M
(2.44%)
-$98M
(2.7%) -$88M
(2.45%)
$-
$500
$1,000
$1,500
$2,000
$2,500
$3,000
$3,500
$4,000
No Drop-
Current
Drop-Current Drop Under
10% Fixed
Drop Under
30% Fixed
Drop Under
20%
Stormw ater
Drop under
10% fixed plus
20%
stormw ater
Scenario
Reve
nue
($M
illio
ns)
Consumption-based
Revenue from Metered
Customers
Stormwater Revenue
from Metered
Customers
Stormwater Revenue
from Unbilled Lots(e.g.
Vacant and Parking)
Fixed Revenue from
Metered Customers
City/HCC Revenues
Frontage Revenues
Assuming a 5% drop in consumption, stormwater charges, like fixed charges, would help stabilize revenues

62
There are revenue and equity benefits, but also administrative challenges
associated with stormwater rates
Revenue benefits:
– Unbilled lots such as parking lots, vacant land and other uses could generate up to $33-67million in new revenues (FY14 without roadways). Good reasons to pursue these as initial phase independently of other stormwater charges.
– Could provide a stable fixed charge.
Other good reasons to institute charge including equity, customer awareness, and encouraging BMPs.
– Would be winners and losers. Shifts in charges away from higher density uses (e.g. multi-family and office) to lower density uses (single family and industrial).
– A credit program would still be required to encourage BMPs because the charge would likely be based on average impervious area and would not send specific price signals to implement BMPs
Administrative Challenges:
– Requires re-allocation of capital/ operating costs/budgets to track stormwater-related expenditures
– To implement a stormwater charge, the new billing system must be in place
– State legislation may be needed to exempt roadways and sidewalks.

63
New Development Charges

64
Why Explore New Development Charges for NYC?
New development charges are used in the water utility industry to help
recover a portion of the amount of infrastructure investment made to
support growth. DEP does not currently apply such charges.
Many large U.S. cities surveyed assessed new development charges
(e.g. San Francisco, Hudson County). Most widely used in growth areas
such as Phoenix.
Could be a sizable revenue source for New York City (as much as $50M
per year, or 2% of revenues)
Equitable – new development buys into system; rezoning pays for system
upgrades.
However, revenue from new development charges would fluctuate with
trends in the housing market

65
0%
10%
20%
30%
40%
50%
60%
70%
80%
90%
100%
San
Fra
ncisco
Sea
ttle
San
Die
go
Den
ver
Louisv
ille
Los Ang
eles
San
Die
go
Chica
go M
WRD
Water Charges Wastewater Charges
Fire Protection Fees New Development Charges
Ad Valorem Taxes Other
New Development Charges in Surveyed Utilities%
of
An
nu
al
Reve
nu
e
0.6%-3.1% of annual revenues, except Denver where it represents 9.1%
Although percent is small, could represent substantial dollars
For the typical single family home, water charges ranged from less than $500 to over
$8,000, wastewater charges ranged from less than $1,000 to over $6,000.

66
Types of New Development Charges
System Buy-in
– New development pays for investments made by existing customers that allow for new development to occur. Applicable to urban environments with excess capacity.
– As per San Francisco PUC‟s website:
“The …charge ensures that users who create new or additional demand on the existing …system..pay a charge in an amount that fairly compensates existing customers for their investment in the current system.”
Next Increment of Investment
– New development pays for future investments needed to accommodate new development.
– Most applicable to suburban developments with additional capacity needs.
– Future CIP for NYC dedicated to meeting state and federal mandates and SOGR and replacements. Capacity driven expenditures relate to conveyance infrastructure rather than water supply or wastewater treatment infrastructure.
– Could be relevant for NYC rezoning initiatives that lack conveyance infrastructure.

67
System Buy In Analysis:
Calculating previous investments
Based on offsetting investments made by
existing customers in the current water and
wastewater system since 1987:
– DS (principal + interest) on Authority bonds
– GO Debt Service paid by Authority since 1987
– PAYGO used for capital
Historical Capital
Expenditure %
Historical DS+Paygo (billions$)
Cost/ gallon*
Water 16% $2.3 $1.78
Water Mains 23% $3.2 $2.49
Sewer 18% $2.6 $1.98Water
Pollution Control 43% $6.1 $4.70
Total $14.1 $10.94*Based on 1290 gpd system
How can NDCs be calculated?
Value of Existing Investment
from historical DS and
PAYGO
Citywide capacity

68
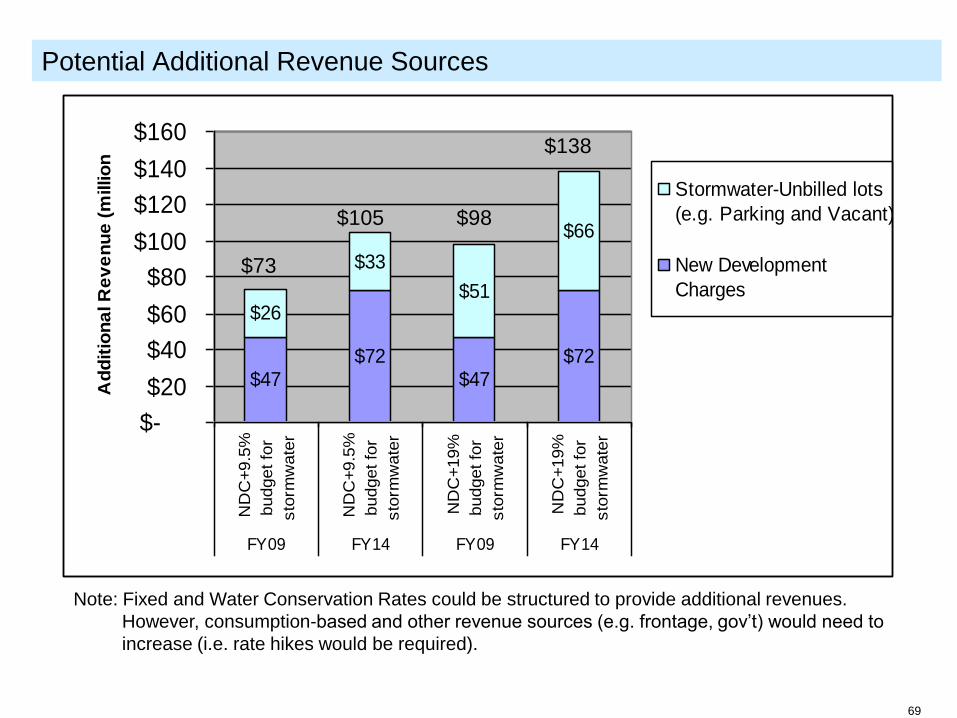
New development charges could represent a significant, though volatile,
source of revenue
Development Type Cost/galConsumption*
(gpd/HU)Cost/unit
Single Family $11 255 $2,800
2-3 Family $11 191 $2,100
Multi-Family $11 140 $1,540
* Based on consumption in post-1996 buildings
Proposed new development charge was based on calculating offsetting
investments made by existing customers in the current water and wastewater
system since 1987, including WFA debt service, general obligation debt service and
PAYGO capital
Represents a new revenue source of between $41M and $50M per year, or up to
2% of revenues based on PLANYC projections.
Potentially a volatile source of revenue, as it would be tied to fluctuations in the real
estate construction market
69
$47$72
$47$72
$26
$33
$51
$66
$-
$20
$40
$60
$80
$100
$120
$140
$160
ND
C+9.5
%
budget fo
r
sto
rmw
ate
r
ND
C+9.5
%
budget fo
r
sto
rmw
ate
r
ND
C+19%
budget fo
r
sto
rmw
ate
r
ND
C+19%
budget fo
r
sto
rmw
ate
r
FY09 FY14 FY09 FY14
Ad
dit
ion
al R
ev
en
ue
(m
illio
ns
)
Stormwater-Unbilled lots
(e.g. Parking and Vacant)
New Development
Charges
Potential Additional Revenue Sources
Note: Fixed and Water Conservation Rates could be structured to provide additional revenues.
However, consumption-based and other revenue sources (e.g. frontage, gov‟t) would need to
increase (i.e. rate hikes would be required).
$98
$73
$138
$105
70
Other Considerations
Established fee used in majority of states
Could represent a significant new revenue stream
Need to consider economic climate and potential for deterring investment.
Administrative issues
– Need to develop procedures with Buildings Department for assessing and processing payments
– No CIS issues anticipated
Legal precedence in other states and municipalities; more research is needed
– Exemptions may need to be considered for affordable housing, government, and non-profits

71
Water Conservation Charges

72
Why Explore Conservation Charges for NYC?
Over the last 10 years, increasing reliance on
inclining block rates, especially in the west and
southwest states facing water shortages.
Although, fortunately, NYC has a plentiful water
supply, these types of charges could be beneficial
for repair periods under the Dependability
Program and during drought conditions which
may become more frequent under future climate
change scenarios.
Water conservation charges send price signals to
customers that clean water is a limited and valuable
commodity that should be used wisely.
May be potential for highest tier rate or excess use
rate to be used for revenue enhancement.
Rates result in greater equity: customers who use
less water are rewarded with a lower cost per unit
consumption.
• Although water conservation rates are used in
many cities that do not have submetering for
multifamily apartments, lack of submetering can
reduce the effectiveness of price signals associated
with inclining block rate structures.
Water Rate Structure Changes '96-'06Percentage of water utilities surveyed employing uniform, declining
block, or inclining block rates
0
10
20
30
40
50
1996 1998 2000 2002 2004 2006
Year
%
Declining Block
Uniform
Inclining
Source: 2006 AWWA/RFC Survey (approximately 400 utilities participated in this
survey)
73
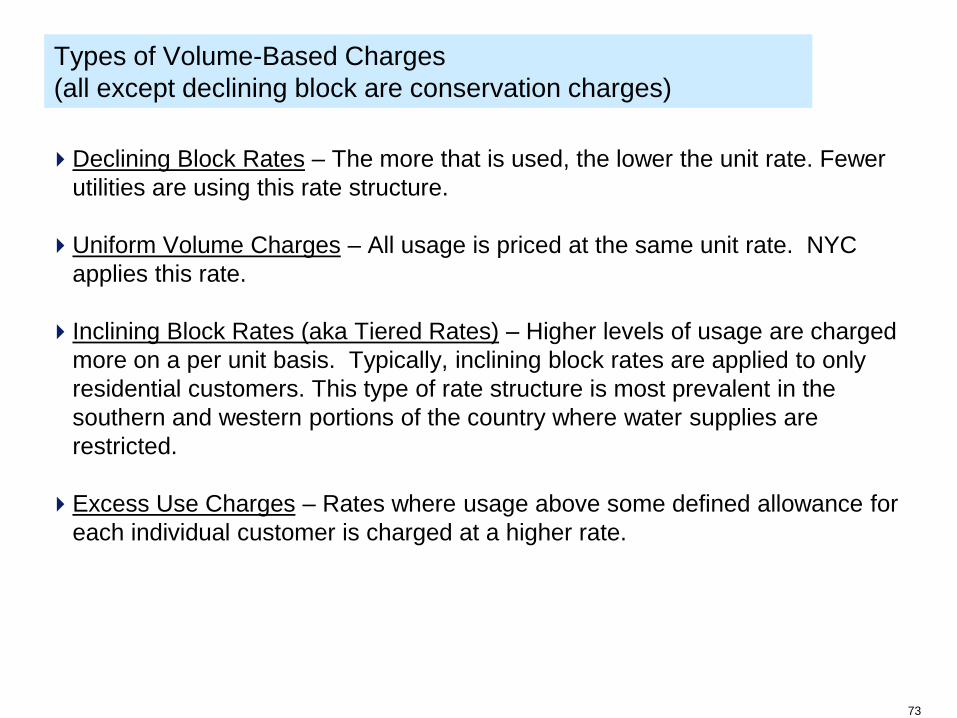
Types of Volume-Based Charges
(all except declining block are conservation charges)
Declining Block Rates – The more that is used, the lower the unit rate. Fewer
utilities are using this rate structure.
Uniform Volume Charges – All usage is priced at the same unit rate. NYC
applies this rate.
Inclining Block Rates (aka Tiered Rates) – Higher levels of usage are charged
more on a per unit basis. Typically, inclining block rates are applied to only
residential customers. This type of rate structure is most prevalent in the
southern and western portions of the country where water supplies are
restricted.
Excess Use Charges – Rates where usage above some defined allowance for
each individual customer is charged at a higher rate.
74
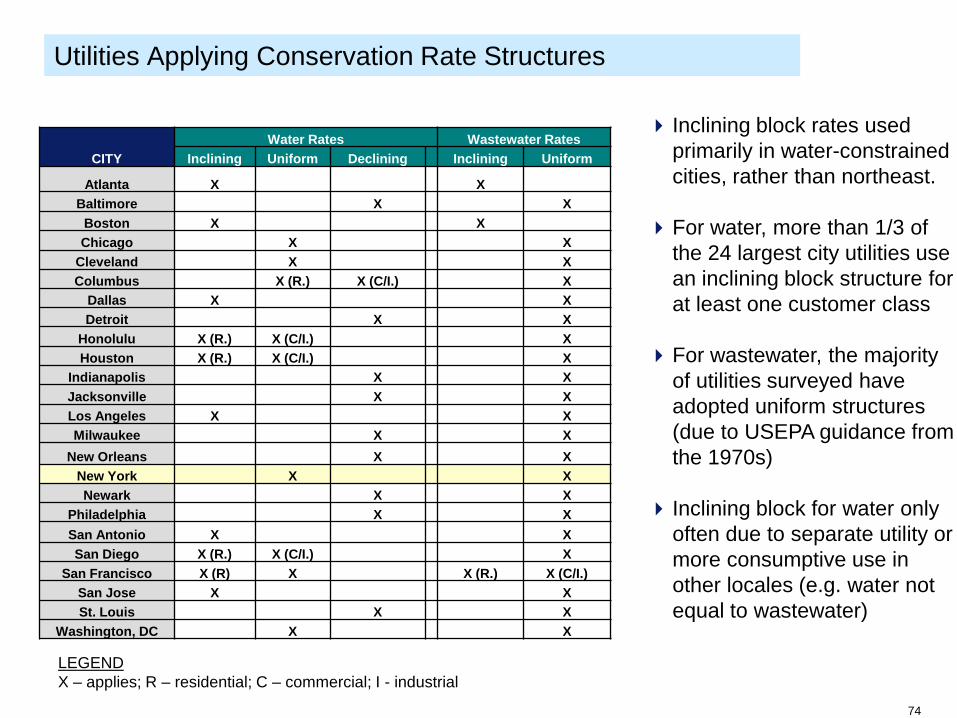
Utilities Applying Conservation Rate Structures
LEGEND
X – applies; R – residential; C – commercial; I - industrial
CITY
Water Rates Wastewater Rates
Inclining Uniform Declining Inclining Uniform
Atlanta X X
Baltimore X X
Boston X X
Chicago X X
Cleveland X X
Columbus X (R.) X (C/I.) X
Dallas X X
Detroit X X
Honolulu X (R.) X (C/I.) X
Houston X (R.) X (C/I.) X
Indianapolis X X
Jacksonville X X
Los Angeles X X
Milwaukee X X
New Orleans X X
New York X X
Newark X X
Philadelphia X X
San Antonio X X
San Diego X (R.) X (C/I.) X
San Francisco X (R) X X (R.) X (C/I.)
San Jose X X
St. Louis X X
Washington, DC X X
Inclining block rates used
primarily in water-constrained
cities, rather than northeast.
For water, more than 1/3 of
the 24 largest city utilities use
an inclining block structure for
at least one customer class
For wastewater, the majority
of utilities surveyed have
adopted uniform structures
(due to USEPA guidance from
the 1970s)
Inclining block for water only
often due to separate utility or
more consumptive use in
other locales (e.g. water not
equal to wastewater)

75
Water Conservation Rate Alternatives Evaluated
Option 1 Tiered Rate Residential Option 2 Tiered Rate Residential
Tier 2
Tier 3
Tier 1
Tier 2
Tier 1 Tier 1
Tier 2
Tier 3
Tier 1
Tier 2
Option 3 Excess Use Rate Non-Residential
Excess Use
(e.g. 25%)
Base Base
Excess use formulation can be based on:
Approach 1: prior use (can reward customers who do not conserve)
Approach 2: usage across similar customers
Approach 3: winter average, with additional summer usage billed as
excess.

76
Revenues from Tiered Rates for Residential Customers
RESIDENTIALWater Unit Rate
($/hcf)
Residential
Billed Metered
Customer Total
Revenue
% of
Revenue
Option B (Residential)
Tier 1 $2.14 $818,514,312 69%
Tier 2 $2.38 $184,139,682 16%
Tier 3 $3.38 $185,136,168 16%
Option C (Residential)
Tier 1 $2.14 $369,477,711 31%
Tier 2 $2.30 $660,108,928 56%
Tier 3 $2.90 $158,844,642 13%
Over time, top tier or excess use
may diminish significantly as
customers install conservation
measures. Volatility can be
mitigated by:
ensuring that top tier or excess
use charges represent a
relatively small percent of
revenue (in these examples,
13%-16%)
creating a water conservation
reserve fund from excess
revenue when top tier/excess
usage exceeds predictions and
drawn down when top tier usage
is less than predicted.
May want to set aside top tier or
excess use as revenue
enhancement
NON-
RESIDENTIALWater Unit
Rate ($/hcf)
Non-Residential
Billed Metered Customer
Total Revenue
% of
Revenue
Option D (Non-Residential)
Base Use $2.21 $450,246,788 84%
Excess Use $3.00 $87,361,317 16%
Subtotal $537,608,105 100%

77
$704
$624
$835
$828
$692
$606
$823
$828
$720
$638
$853
$879
$0 $500 $1,000 $1,500 $2,000 $2,500 $3,000
4. Mixed Resident ial &
Commercial Buildings
3. Mult i-Family Buildings
2. Tax Class 1 - Ot her (2-3 Family,
some w/ st ores)
1. Tax Class 1 One Family
Dwellings
Residential Customer Bill Impacts (FY14), 50th Percentile
Option A –Uniform (current)
Option B – Tiered Rate
Option C – Tiered Rate
Those who conserve are rewarded.

78
Residential Customer Bill Impacts (FY14), 90th Percentile
$2,896
$1,643
$2,883
$1,898
$3,030
$1,694
$3,010
$1,938
$2,523
$1,509
$2,542
$1,805
$0 $500 $1,000 $1,500 $2,000 $2,500 $3,000
4. Mixed Resident ial &
Commercial Buildings
3. Mult i-Family Buildings
2. Tax Class 1 - Ot her (2-3 Family,
some w/ st ores)
1. Tax Class 1 One Family
Dwellings
Option A – Uniform (current)
Option B – Tiered Rate
Option C – Tiered Rate
Those who do not conserve are penalized.

79
Option A – Uniform Rate Structure
(Current Structure)
Option D – Excess Use Structure,
Non-Residential
$2,485
$3,126
$1,280
$1,243
$49,746
$2,372
$2,984
$1,222
$1,186
$47,488
$13,519
$9,490
$4,368
$3,992
$114,970
$14,066
$9,876
$4,545
$4,154
$119,630
$70,647
$24,252
$14,084
$13,256
$239,544
$73,509
$25,234
$14,654
$13,792
$249,251
$0 $50,000 $100,000 $150,000 $200,000 $250,000 $300,000
13. Office Buildings
12. Stores
11b. Heavy Industrial & Manufacturing
Buildings
11a. Light Industrial & Manufacturing Buildings
6. Hotels
90th percentile, Option D
90th percentile current bill
75th percentile, Option D
75th percentile current bill
50th percentile, Option D
50th percentile current bill
Non-Residential Customer Bill Impacts (FY14), 50, 75th & 90th
Percentiles

80
Water conservation charges (tiered and excess use) present several
administrative challenges
Implement new AMR and billing system
Transition to monthly billing
Perform further analyses of tiers and excess use shift points to support policy
decisions
Establish mechanisms to avoid revenue instability. (eg. reserve fund)
Develop customer outreach program

81
Fire Charges

82
DEP does not currently separate its charges for providing public fire protection service
to its customers.
Cities that impose these charges generate modest amounts of annual revenue.
Widespread availability of fire hydrants yields lower insurance costs for property
owners.
Some cities impose separate fire protection fees; others recover the costs through
basic water rates. Example: Rate schedule for the Boston Water and Sewer
Commission for internal sprinklers and standpipes:
Fire protection charges are used by other cities to recover some of the costs associated with fire protection services
1c
0%
2%
4%
6%
8%
10%
Miami Milwaukee San Diego Boston Cleveland
Fir
e P
rote
cti
on
Ch
arg
es
As
Pe
rce
nta
ge o
f To
tal
Reve
nu
e
$4.7 M
$6.0 M
$2.0 M
$4.0 M
$4.4 M
(from services
outside the city limits)
Size of Connection Daily Charge
4" or Smaller $0.91
6" $2.07
8" or Larger $3.68

83
Considerations for application to NYC
DEP provides fire protection services to the general public through watersupply, transmission, storage & distribution facilities that are designed toquickly deliver a high volume of water through fire hydrants.
Similarly, DEP provides fire protection services directly to private customersthrough connections to: building standpipes, private water mains thatconnect to privately-owned hydrants and other facilities.
The widespread availability of fire hydrants and standpipe connectionsprovides the benefit of lower insurance costs for property owners.
DEP incurs costs in providing such services; e.g., sizing water mains largeenough to provide sufficient water to fight fires; pumping water in limitedparts of the City; installing, maintaining and replacing fire hydrants; andhydrant inspections/testing (with the assistance of the Fire Department).
Potential next steps in considering such charges:
Verify the inventory of private fire protection connections as well as thosefor public facilities.
Prepare a cost of service analysis to calculate the annual cost ofproviding fire protection service.
Assess the potential impacts on customers who would be billed for fireprotection service as well as the effects of the additional revenue thatwould be generated.

84
Next Steps – Short Term and Long Term
85
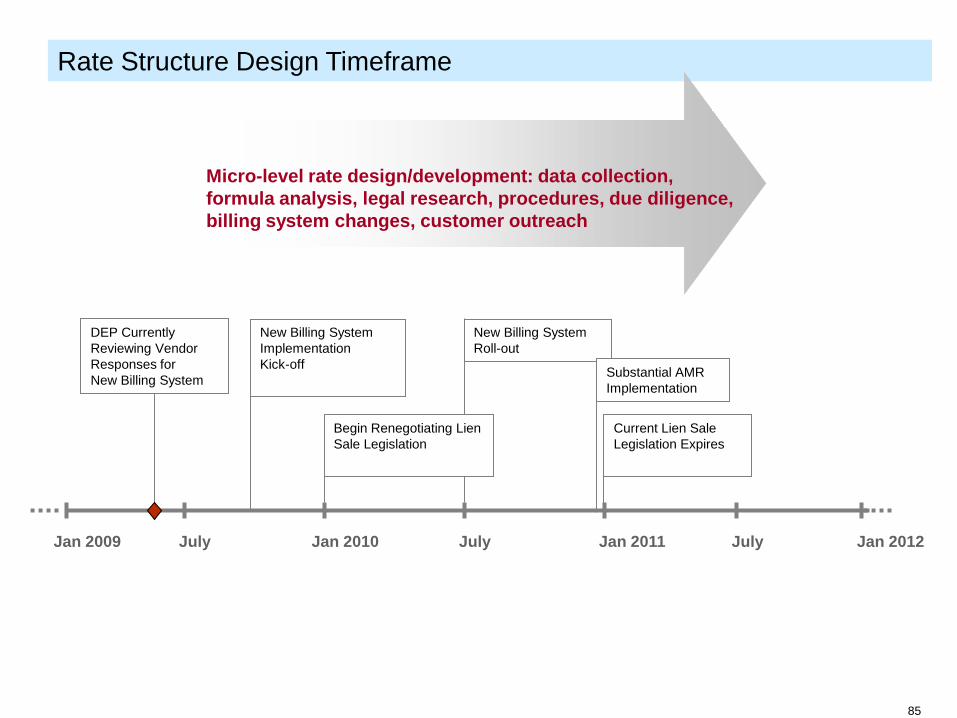
Rate Structure Design Timeframe
Micro-level rate design/development: data collection,
formula analysis, legal research, procedures, due diligence,
billing system changes, customer outreach
New Billing System
Implementation
Kick-off
DEP Currently
Reviewing Vendor
Responses for
New Billing System
New Billing System
Roll-out
Current Lien Sale
Legislation Expires
Substantial AMR
Implementation
Jan 2010Jan 2009 Jan 2012Jan 2011July JulyJuly
Begin Renegotiating Lien
Sale Legislation

86
Detailed Implementation Considerations Fixed Charges
Implementation Considerations
People Processes Technologies/
Infrastructure
Legal/Regulatory
Research and
Changes
Additional staff time
required for
implementation
(planning, customer
outreach, analyses,
audit and control,
policies/procedures,
billing system
conversion, reporting,
and legal/regulatory).
Further evaluate to determine formula with least
impact on customers, particularly lower-volume
customers.
For industrial/commercial customers, fixed charges
could be based on meter size, therefore DEP would
need reliable meter size data to use. 400k of 700k
meters are planned to be replaced in the next few
years. May need to downsize oversized meters.
For residential customers, fixed charges could be
based on the number of housing units on record for the
customer.
Determine charges for mixed use (residential/non-
residential) customers.
Evaluate potential escrow possibilities with banking
industry.
Develop customer outreach materials to explain bill
breakdown.
Rate adoption process including advertisement,
public hearings, and Board adoption proceedings.
Can potentially implement
with existing system, similar
to sprinkler charge or
minimum charge.
None identified

87
Detailed Implementation ConsiderationsStormwater Charges Unbilled Lots
Implementation Considerations
People Processes Technologies/
Infrastructure
Legal/Regulatory
Research and Changes
Additional staff required for
implementation (planning,
enforcement, appeals, credit
program, customer outreach,
analyses, audit and control,
policies/procedures, billing
conversion, reporting, and
legal/regulatory).
Pilot DCA licensed standalone parking facilities?
Determine basis for charge for both vacant land and
parking lot: property size? Imperviousness?
Evaluate vacant land to exclude wetland and
possibly other undevelopable parcels.
Further evaluate stormwater/wastewater budget
allocations, especially if want to go beyond 10%
stormwater budget based on LTCP (may not want to
pursue for unbilled lots).
Perform due diligence to determine correct
classification as parking lots or vacant land. Distribute
letters notifying affected customers of the pending
charges and their customer data on record.
Evaluate and develop stormwater credit program
(may not want to pursue for unbilled lots).
Develop administrative procedures for enforcement
and appeals.
Develop customer outreach program including credit
program guidance materials.
Evaluate potential escrow possibilities with banking
industry.
Rate adoption process including advertisement,
public hearings, and Board adoption proceedings.
A separate billing system
may be considered.
Aerial flyover to collect
new imperviousness data,
to be completed by end of
2009.
Limited site surveying to
determine land uses of
specific properties.
Identify properties with
private outfalls or other
direct discharge to
waterways.
Verify use of RPAD data
for property size.
Periodically update RPAD
property size data.
Determine the Board's options
for exempting streets and
sidewalks within the limits of
current legislation (may not want
to pursue for unbilled lots).
Determine whether other
amendments are needed for
exempt properties and properties
with private outfalls or other
direct discharge to waterways.
Determine legal options for
ensuring collections (e.g.,
shutoffs).

88
Detailed Implementation ConsiderationsStormwater Charges All Users
Implementation Considerations
People Processes Technologies/
Infrastructure
Legal/Regulatory
Research and Changes
Additional staff required for
implementation (planning,
enforcement, appeals, credit
program, customer outreach,
analyses, audit and control,
policies/procedures, billing
conversion, reporting, and
legal/regulatory).
Further evaluate stormwater/wastewater budget
allocations, especially if want to go beyond 10%
stormwater budget based on LTCP.
Develop ongoing budgeting procedures for allocating
stormwater versus wastewater costs.
Distribute letters notifying affected customers of the
pending rate structures and their customer data on
record.
Evaluate and develop stormwater credit program.
Develop administrative procedures for enforcement
and appeals
Develop customer outreach program including credit
program guidance materials.
Evaluate potential escrow possibilities with banking
industry.
Rate adoption process including advertisement, public
hearings, and Board adoption proceedings.
Current billing system is
not recommended for new
stormwater structure.
A separate billing system
may be considered, or the
planned new billing system
may be used.
Aerial flyover to collect
new imperviousness data, to
be completed by mid-2010.
Limited site surveying to
determine land uses of
specific properties.
Identify properties with
private outfalls or other
direct discharge to
waterways.
Verify use of RPAD data
for property size.
Periodically update RPAD
property size data.
Determine the Board's options for
exempting streets and sidewalks
within the limits of current
legislation.
Determine whether other
amendments are needed for exempt
properties and properties with
private outfalls or other direct
discharge to waterways.
Determine legal options for
ensuring collections (e.g.,
shutoffs).

89
Detailed Implementation Considerations Conservation Charges
Implementation Considerations
People Processes Technologies/
Infrastructure
Legal/Regulatory
Research and
Changes
Additional staff time
required for
implementation
(planning, customer
outreach, analyses, audit
and control,
policies/procedures,
billing conversion,
reporting, and
legal/regulatory)
Consider use of conservation rate to support Dependability
program, or drought operations. Also consider allocating
proceeds from top-tier/excess use charges as revenue
enhancement.
After AMR implemented, compile consumption data by
customer and perform detailed customer bill analysis. Also begin
to monitor trends over time at the customer level.
Based on these data, further evaluate tier and excess use
breakpoints with respect to policy decisions, administration,
customer equity, and financial stability.
Monthly billing will be required.
For residential customers, conservation rates could be based on
land use classification and number of housing units. If it is
determined to pursue conservation rates for these customers,
letters should be distributed notifying affected customers of the
pending rate structure and their customer data on record.
For commercial/industrial customers, conservation rates could be
based on customer-specific characteristics. After it is determined
to pursue conservation rates for commercial/industrial customers,
letters should be distributed notifying affected customers of the
pending rate structure and their customer data on record.
Establish mechanisms to avoid revenue instability (e.g., reserve
fund).
Develop customer outreach program.
May need to implement for several years to gain understanding
of price elasticity.
Rate adoption process including advertisement, public hearings,
and Board adoption proceedings.
Implementations of
planned AMR and new
billing system are required;
existing exemption
structure can potentially be
tweaked to accommodate
conservation rates, but this
is not recommended.
Account-level parameters
need to be added to
customer bills (e.g. # of
housing units, square feet).
Determine whether we
can charge people
differently for same
amount of water used (e.g.,
single family vs.
multifamily). This will
affect how tier points are
established.

90
Stakeholder Feedback

91
Alternative Rate Structures- Stakeholder Feedback
Environmental
Organizations
Affordable &
Market-rate
Housing
Predictability in the water rates is important. Rent stabilization calculations require
predictability. Predictability is also important for financial backers of housing
developments.
Conservation-oriented rates may only have a limited affect on customer behavior in multi-
family dwellings. For instance, tenants of multi-family housing typically do not receive a
water bill and are not sub-metered.
Study should research affordable housing programs of other utilities.
Expressed interest in incentives for conservation investments.
Rent stabilization calculations do not adequately reflect water bills
Concerned that going to meter rates from frontage would result in higher bills.
Study should take sufficient time to ensure proper implementation.
Generally interested in evaluation of a separate stormwater charge.
Concern was expressed that high fixed charges could dampen the effect on conservation.