Embed Size (px)
Citation preview

Annual Water and Sewer Retail Rate Survey
The Community Advisory Board to the
Massachusetts Water Resources Authority
2016

The MWRA Advisory Board... was established by the state Legislature to represent the 60 communities in the MWRA service area. Through annual comments and recommendations on the Authority’s proposed capital and current expense budgets and rates, the Advisory Board provides a ratepayer perspective on the MWRA’s plans and policies to improve the region’s water and sewer systems. For more information call: (617) 788-2050, fax (617) 788-2059, write: MWRA Advisory Board 100 First Avenue Building 39 | 4th Floor Boston, MA 02129 E-mail: [email protected] or visit the Advisory Board’s website at: http://www.mwraadvisoryboard.com follow us on Twitter: www.twitter.com/MWRAAdvisory

MWRA Advisory Board
2016
Annual Water and Sewer Retail Rate Survey
Joseph E. Favaloro Executive Director
Advisory Board Communities: Arlington Ashland Bedford Belmont Boston Braintree Brookline Burlington Cambridge Canton Chelsea Chicopee Clinton Dedham Everett Framingham Hingham Holbrook Leominster Lexington Lynn Lynnfield Malden Marblehead Marlborough Medford Melrose Milton Nahant Natick Needham Newton Northborough Norwood Peabody Quincy Randolph Reading Revere Saugus Somerville South Hadley Southborough Stoneham Stoughton Swampscott Wakefield Walpole Waltham Watertown Wellesley Weston Westwood Weymouth Wilbraham Wilmington Winchester Winthrop Woburn Worcester

TABLE OF CONTENTS
SECTION PAGE
Introduction ii
MWRA Community 2016 Water and Sewer Charges Section I
Select Non-MWRA Massachusetts Community 2016 Charges
Section II
Select U.S. Cities Residential 2016 Water and Sewer Charges Section III
2015 Water & Sewer Retail Rate Information Appendix A
Second Meter Information and Glossary Appendix B
2016 Residential Cost Based on Community Water Use Data Appendix C
Final MWRA Fiscal Year 2017 Billable Water and Sewer Charges
Appendix D
Additional 2016 Data for MWRA Communities Appendix E
MWRA Water System Demand 1980 – 2015
Appendix F
2016 Stormwater Fees Appendix G
SECTION PAGE
MWRA Advisory Board 2016 Water & Sewer Retail Rate Survey
Page i

Introduction This is the thirtieth “Annual Water and Sewer Retail Rate Survey” prepared by the Massachusetts Water Resources Authority (MWRA) Advisory Board, providing a comparative snapshot of water and sewer retail rates for each community in the MWRA service area. In addition, the survey also incorporates rate information from Massachusetts communities outside of the MWRA service area, as well as other cities nationwide. The survey was prepared by James Guiod, Lenna Ostrodka, and Matthew Romero of the Advisory Board staff. The Rate Survey is typically the Advisory Board’s most requested document. We hope that municipal officials, water and sewer industry professionals, and concerned citizens continue to find the information presented in the survey useful and informative. As always, we welcome any questions or suggestions regarding this survey, which will allow us to improve the document for future years. Please do not hesitate to call our office at (617) 788-2050, or email us at [email protected] with your feedback. Copies of this document are available at our website in PDF format at http://www.mwraadvisoryboard.com.
Average Water and Sewer Rates
Historically, the survey has focused upon the average annual household use based on the industry standard of 120 hundred cubic feet (HCF), or approximately 90,000 gallons (90 kgal) to track retail rate increases over time. For historical purposes this constant is maintained throughout the document; however, in recognition of the variability of actual household usage by community, the Advisory Board for several years has provided a comparative assessment of actual costs for water and sewer retail rate customers baes upon local, state, and federal data (LSF). The LSF usage number is calculated by MWRA staff and is based primarily on residential consumption reported by each community in their annual Public Water Supply Annual Statistic Report filed with the Massachusetts Department of Environmental Protection, and the total population and average household size for each community based on data from the U.S. Census bureau. The full calculation and source data can be found in Appendix C. Prior to 2009, this information had only been presented in Appendix C of the survey, but now is found on each community’s page.
In July 2008, the Advisory Board staff convened a “focus group,” including members of the Advisory Board, MWRA staff, and Advisory Board staff, to discuss the survey’s method of reporting retail rate increases. After eliciting responses from both the American Water Works Association (AWWA) and its members, the group agreed to maintain a constant standard (120 HCF) for historical comparisons while creating additional references to the information contained in Appendix C. Now, in an effort to provide a more complete depiction of the various means by which retail water and sewer rates can be calculated, the information previously contained in Appendix C has been placed in each MWRA community’s profile page.
The MWRA Advisory Board
The MWRA Advisory Board was created by the Massachusetts Legislature in 1984 to represent the interests of Massachusetts Water Resources Authority service area communities. The Advisory Board includes one representative from each of the 60 communities that receive water and/or sewer services from the MWRA and one from the Metropolitan Area Planning Council. In addition, six members are appointed by the Governor to include a person with skills and expertise in matters relating to environmental protection, one representative each from the Connecticut River Basin, the Quabbin/Ware Watershed areas and the Wachusett Watershed area, plus two persons qualified by membership or affiliation in organizations concerned with the recreational or commercial uses of the Boston Harbor. The Massachusetts Legislature has delegated specific responsibilities to the Advisory Board who, in turn, monitor the MWRA’s programs from a ratepayer perspective:
Serving as a watchdog over the MWRA to ensure proper management and budgetary control;
Making recommendations on annual expense budgets, capital improvement programs, business planning, and user charges;
Holding hearings on matters relating to the MWRA and making subsequent recommendations to the Governor and the Legislature; and,
Appointing three individuals to the eleven member MWRA Board of Directors.
MWRA Advisory Board 2016 Water & Sewer Retail Rate Survey
Page ii
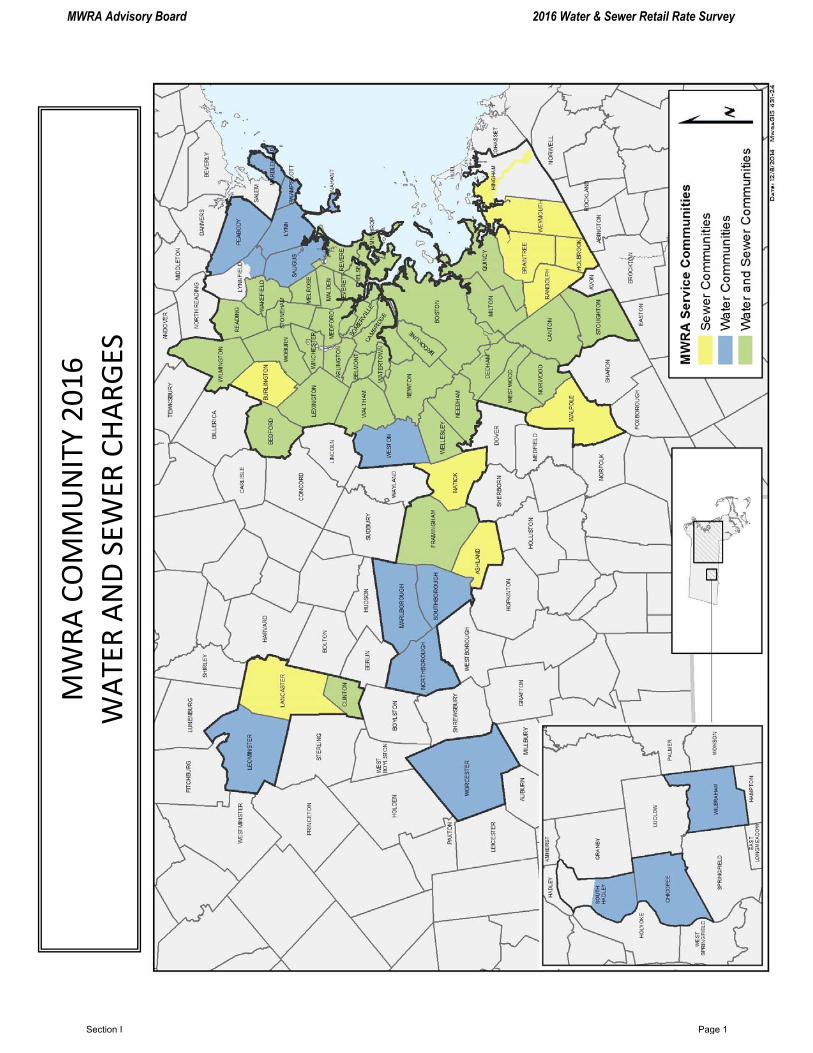
MWRA COMMUNITY 2016
WATER AND SEW
ER CHARGES
MWRA Advisory Board 2016 Water & Sewer Retail Rate Survey
Section I Page 1

Combined Annual Water & Sewer Charges in MWRA Communities
1996 – 2016 (Consumption at 120 HCF ≈ 90 kgal)
$626$648 $674
$699 $724$751
$794$842
$889
$946
$1,006
$1,073
$1,136
$1,203$1,254
$1,297 $1,347
$1,380 $1,427
$1,474 $1,525
$0
$200
$400
$600
$800
$1,000
$1,200
$1,400
$1,600
1996 1997 1998 1999 2000 2001 2002 2003 2004 2005 2006 2007 2008 2009 2010 2011 2012 2013 2014 2015 2016
MWRA Advisory Board 2016 Water & Sewer Retail Rate Survey
Section I Page 2
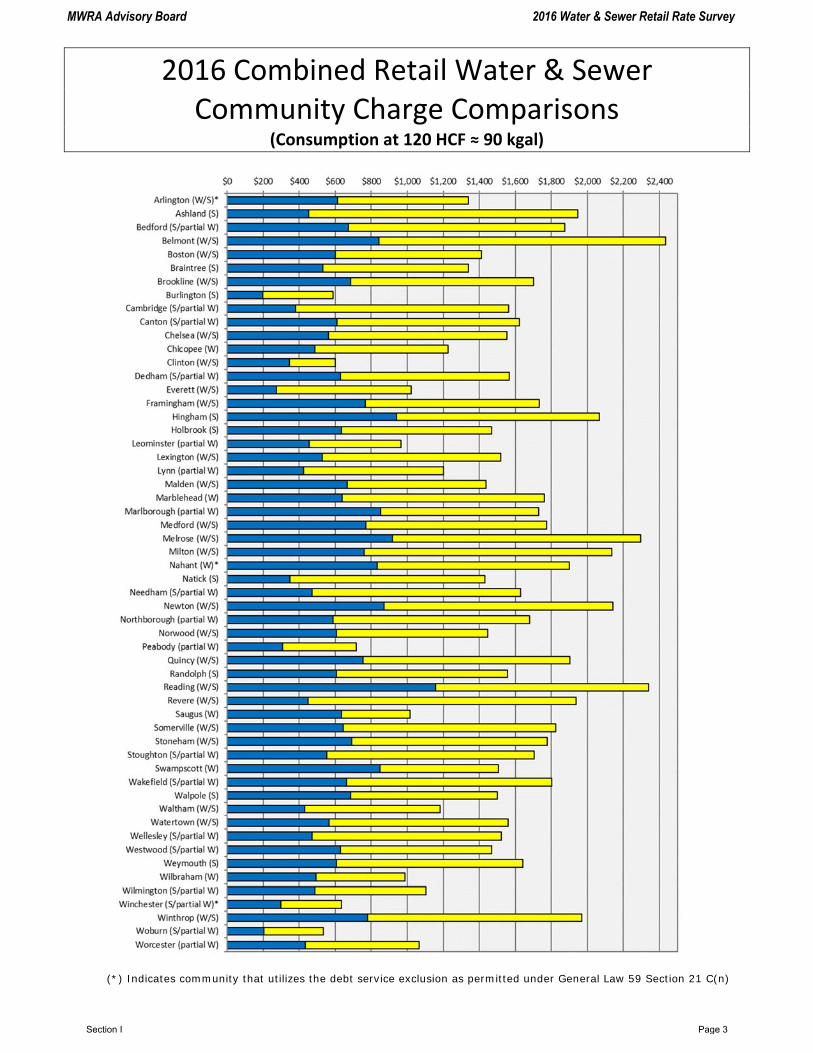
2016 Combined Retail Water & Sewer Community Charge Comparisons
(Consumption at 120 HCF ≈ 90 kgal)
(*) Indicates community that utilizes the debt service exclusion as permitted under General Law 59 Section 21 C(n)
MWRA Advisory Board 2016 Water & Sewer Retail Rate Survey
Section I Page 3

2015 2016
Avg. combined water and sewer cost $1,474.31 $1,524.84
Percent change from prior year 3.2% 3.4%
WATER BILLING FREQUENCY
Semi-Annual 8 8
Tri-Annual 2 2
Quarterly 42 42
Bi-Monthly 2 2
Monthly 6 6
WATER RATE STRUCTURE
Ascending Block with Base/Minimum Charge 34 34
Ascending Block only 12 12
Flat Rate with Base/Minimum Charge 7 7
Flat Rate only 6 6
Fixed Fee 1 1
SENIOR CITIZEN/LOW-INCOME DISCOUNTS
Senior Discount 16 17
Low-Income Discount 7 7
Both 8 7
Neither 29 29
DEBT SERVICE EXCLUSION 3 3
CHANGES IN COMBINED WATER AND SEWER CHARGES
Decrease 3 2
No change 17 17
0% to 10% increase 35 37
10% to 20% increase 4 4
20% to 30% increase 1 0
30% to 40% increase 0 0
40% to 50% increase 0 0
Greater than 50% increase 0 0
MWRA SYSTEMWIDE SUMMARY DATA2016
MWRA Advisory Board 2016 Water & Sewer Retail Rate Survey
Section I Page 4

Water Sewer
A rlingto n (W/ S)* $611.20 $730.04
A shland (S) - 1,495.60
B edfo rd (S/ part ia l W) 671.00 1,205.00
B elmo nt (W/ S) 843.48 1,593.28
B o sto n (W/ S) 599.59 814.18
B raintree (S) - 807.00
B ro o kline (W/ S) 683.80 1,019.60
B urlingto n (S) - 391.50
C ambridge (S/ part ia l W) 380.00 1,184.00
C anto n (S/ part ia l W) 610.00 1,013.60
C helsea (W/ S) 562.80 992.40
C hico pee (W) 488.00 -
C linto n (W/ S) 343.60 257.70
D edham (S/ part ia l W) 628.20 937.28
Everett (W/ S) 273.60 747.60
F ramingham (W/ S) 767.16 967.68
H ingham (S) - 1,128.00
H o lbro o k (S) - 834.00
Leo minster (part ia l W) 455.84 -
Lexingto n (W/ S) 526.40 994.00
Lynn (part ia l W) 423.72 -
Lynnfield (W) 360.80 -
M alden (W/ S) 664.92 771.24
M arblehead (W) 637.00 -
M arlbo ro ugh (part ia l W) 852.00 -
M edfo rd (W/ S) 768.72 1,004.40
M elro se (W/ S) 918.40 1,377.00
M ilto n (W/ S) 761.04 1,375.44
N ahant (W)* 834.00 -
N atick (S) - 1,084.00
N eedham (S/ part ia l W) 471.60 1,158.60
N ewto n (W/ S) 872.00 1,270.00
N o rthbo ro ugh (part ia l W) 587.08 -
N o rwo o d (W/ S) 607.68 838.80
P eabo dy (part ia l W) 306.00 -
Quincy (W/ S) 754.80 1,149.96
R ando lph (S) - 950.40
R eading (W/ S) 1,156.80 1,185.60
R evere (W/ S) 450.00 1,489.20
Saugus (W) 634.82 -
So merville (W/ S) 645.03 1,178.46
So uth H adley (W) 472.40 -
So uthbo ro ugh (W) 437.08 -
Sto neham (W/ S) 690.00 1,086.00
Sto ughto n (S/ part ia l W) 553.12 1,152.00
Swampsco tt (W) 848.00 -
Wakefield (S/ part ia l W) 664.20 1,139.40
Walpo le (S) - 816.58
Waltham (W/ S) 428.64 753.00
Waterto wn (W/ S) 565.08 993.60
Wellesley (S/ part ia l W) 471.96 1,051.20
Westo n (W) 267.20 -
Westwo o d (S/ part ia l W) 628.20 841.00
Weymo uth (S) - 1,035.72
Wilbraham (W) 494.40 -
Wilmingto n (S/ part ia l W) 485.60 616.80
Winchester (S/ part ia l W)* 296.60 338.40
Winthro p (W/ S) 780.00 1,188.00
Wo burn (S/ part ia l W) 205.00 328.00
Wo rcester (part ia l W) 432.00 -
A VER A GE $585.70 $983.76
P ercent change 3.0% 3.9%
ANNUAL WATER AND SEWER CHARGES IN
COMMUNITIES RECEIVING SERVICES FROM THE MWRA
2016
Water and Sewer Charges are based on an annual water consumption of 120 HCF ≈ 90 kgal.
(*) Indicates communit ies that ut ilize the debt service exclusion as permit ted under General Law 59 Sect ion 21C(n).
MWRA Advisory Board 2016 Water & Sewer Retail Rate Survey
Section I Page 5

Water Sewer Combined Change
Arlington (W/S)* $611.20 $730.04 $1,341.24 0.0%Ashland (S) $452.80 $1,495.60 $1,948.40 0.0%Bedford (S/partial W) $671.00 $1,205.00 $1,876.00 11.4%Belmont (W/S) $843.48 $1,593.28 $2,436.76 3.7%Boston (W/S) $599.59 $814.18 $1,413.76 3.1%Braintree (S) $532.40 $807.00 $1,339.40 4.8%Brookline (W/S) $683.80 $1,019.60 $1,703.40 4.0%Burlington (S) $196.50 $391.50 $588.00 0.0%Cambridge (S/partial W) $380.00 $1,184.00 $1,564.00 2.4%Canton (S/partial W) $610.00 $1,013.60 $1,623.60 0.0%Chelsea (W/S) $562.80 $992.40 $1,555.20 4.8%Chicopee (W) $488.00 $739.45 $1,227.45 7.7%Clinton (W/S) $343.60 $257.70 $601.30 0.0%Dedham (S/partial W) $628.20 $937.28 $1,565.48 0.7%Everett (W/S) $273.60 $747.60 $1,021.20 1.9%Framingham (W/S) $767.16 $967.68 $1,734.84 6.1%Hingham (S) $939.68 $1,128.00 $2,067.68 0.9%Holbrook (S) $636.00 $834.00 $1,470.00 0.0%Leominster (partial W) $455.84 $508.76 $964.60 0.0%Lexington (W/S) $526.40 $994.00 $1,520.40 2.8%Lynn (partial W) $423.72 $777.84 $1,201.56 0.0%Malden (W/S) $664.92 $771.24 $1,436.16 0.0%Marblehead (W) $637.00 $1,124.00 $1,761.00 4.0%Marlborough (partial W) $852.00 $878.40 $1,730.40 3.0%Medford (W/S) $768.72 $1,004.40 $1,773.12 8.4%Melrose (W/S) $918.40 $1,377.00 $2,295.40 11.7%Milton (W/S) $761.04 $1,375.44 $2,136.48 4.8%Nahant (W)* $834.00 $1,066.80 $1,900.80 0.0%Natick (S) $348.40 $1,084.00 $1,432.40 3.8%Needham (S/partial W) $471.60 $1,158.60 $1,630.20 2.8%Newton (W/S) $872.00 $1,270.00 $2,142.00 6.6%Northborough (partial W) $587.08 $1,093.84 $1,680.92 12.2%Norwood (W/S) $607.68 $838.80 $1,446.48 1.2%Peabody (partial W) $306.00 $409.80 $715.80 0.0%Quincy (W/S) $754.80 $1,149.96 $1,904.76 5.8%Randolph (S) $607.80 $950.40 $1,558.20 2.8%Reading (W/S) $1,156.80 $1,185.60 $2,342.40 5.0%Revere (W/S) $450.00 $1,489.20 $1,939.20 1.5%Saugus (W) $634.82 $380.88 $1,015.70 8.7%Somerville (W/S) $645.03 $1,178.46 $1,823.49 10.3%Stoneham (W/S) $690.00 $1,086.00 $1,776.00 -1.7%Stoughton (S/partial W) $553.12 $1,152.00 $1,705.12 0.7%Swampscott (W) $848.00 $659.00 $1,507.00 2.0%Wakefield (S/partial W) $664.20 $1,139.40 $1,803.60 3.7%Walpole (S) $685.20 $816.58 $1,501.78 3.5%Waltham (W/S) $428.64 $753.00 $1,181.64 0.0%Watertown (W/S) $565.08 $993.60 $1,558.68 1.7%Wellesley (S/partial W) $471.96 $1,051.20 $1,523.16 4.5%Westwood (S/partial W) $628.20 $841.00 $1,469.20 1.7%Weymouth (S) $607.80 $1,035.72 $1,643.52 2.2%Wilbraham (W) $494.40 $492.00 $986.40 0.0%Wilmington (S/partial W) $485.60 $616.80 $1,102.40 5.2%Winchester (S/partial W)* $296.60 $338.40 $635.00 7.8%Winthrop (W/S) $780.00 $1,188.00 $1,968.00 2.8%Woburn (S/partial W) $205.00 $328.00 $533.00 0.0%Worcester (partial W) $432.00 $635.52 $1,067.52 0.0%
AVERAGE $595.35 $929.49 $1,524.84 3.4%
Combined Annual Water and Sewer Charges for
Communities Receiving Services from the MWRA
2016Charges include MWRA, community, and alternatively supplied services.
Rates based on average annual household use of 120 hundred cubic feet (HCF), or approximately 90,000 gallons.
The following communities do not provide municipal sewer services and, therefore, are not listed: Lynnfield Water District, South Hadley Fire District #1, Southborough and Weston. (*) Indicates communities that utilize the debt service exclusion as permitted under General Law 59 Section 21C(n).
MWRA Advisory Board 2016 Water & Sewer Retail Rate Survey
Section I Page 6

Arlington (W/S)
Residential Water Rates:
Residential Sewer Rates: Last adjusted:
January 2014
Last adjusted:
January 2014
Next adjustment scheduled: July 2017 Next adjustment scheduled: July 2017 Fund: Enterprise Fund: Enterprise
Base charge per bill $ 5.35 Base charge per bill $ 5.36 First 15 HCF/bill $ 4.75/HCF First 15 HCF/bill $ 5.71/HCF 16 – 30 HCF
>30 HCF
$ 5.08 "
$ 6.16 "
16 – 30 HCF $ 6.10 "
>30 HCF $ 7.40 " Based on 100% of water usage.
Billing Frequency: Quarterly
Annual Cost
AWWA Standard for Historical Comparison (120 HCF ≈ 90,000 gals.)
Annual Cost
Based on Local, State & Federal Data (60.4 HCF – See Appendix C for Data & Calc.)
Water $611.20 Water $308.43 Sewer $730.04 Sewer $366.48 Combined $1,341.24 Combined $674.91 % change from 2015 0.0%
Commercial Water Rates: Commercial Sewer Rates:
Same as residential Same as residential
Additional 2016 Data by Community
Does this Community Use Second Meters?
Does this Community Offer Senior and/or Low Income Discounts?
No No
Water System Sewer System
MWRA Charges as % of Total Community Water Expenses
50-75% MWRA Charges as % of Total Community Sewer Expenses
50-75%
Miles of water pipeline replaced/rehabilitated in FY16
Less than 1 Miles of sewer pipeline replaced/rehabilitated in FY16
Less than 1
Water Capital Needs over Next Five Years
$0-10 million Sewer Capital Needs over Next Five Years
$0-10 million
Anticipated Water Capital Spending over Next Five Years
$5-10 million Anticipated Sewer Capital Spending over Next Five Years
$5-10 million
Stormwater
Current Funding Source of Stormwater-Related Costs:
Water/Sewer Rates
Arlington utilizes the debt service exclusion as permitted under General Law 59 Section 21C(n)
MWRA Advisory Board 2016 Water & Sewer Retail Rate Survey
Section I Page 7

Residential Water Rates:
Residential Sewer Rates: Last adjusted:
February 2015
Last adjusted:
February 2015
Next adjustment scheduled: Unknown Next adjustment scheduled: Unknown Fund: Enterprise Fund: Enterprise
Base charge per bill $16.00 Base charge per bill $16.00 0 – 10 HCF $ 2.96/HCF 0 – 10 HCF $11.29/HCF >10 - 40 HCF $ 3.38 " >10 - 40 HCF $12.25 "
>40 - 90 HCF $ 5.01 " >40 - 90 HCF $13.63 " >90 HCF $ 6.21 " >90 HCF $16.93 " Based on 100% of water usage.
Billing Frequency: Quarterly
Annual Cost AWWA Standard for Historical Comparison
(120 HCF ≈ 90,000 gals.)
Annual Cost Based on Local, State & Federal Data
(69.2 HCF – See Appendix C for Data & Calc.)
Water $452.80 Water $281.10 Sewer $1,495.60 Sewer $873.30 Combined $1,948.40 Combined $1,154.40
% change from 2015 0.0%
Commercial Water Rates:
Commercial Sewer Rates:
Same as residential Same as residential
Additional 2016 Data by Community
Does this Community Use Second Meters?
Does this Community Offer Senior and/or Low Income Discounts?
Yes, Both Yes
Water System Sewer System
MWRA Charges as % of Total Community Water Expenses
0-25% MWRA Charges as % of Total
Community Sewer Expenses 0-25%
Miles of water pipeline replaced/rehabilitated in FY16
Less than 1 Miles of sewer pipeline
replaced/rehabilitated in FY16 Less than 1
Water Capital Needs over Next Five Years
$0-10 million Sewer Capital Needs over Next
Five Years $0-10 million
Anticipated Water Capital Spending over Next Five Years
$5-10 million Anticipated Sewer Capital
Spending over Next Five Years $5-10 million
Stormwater
Current Funding Source of Stormwater-Related Costs:
Water/Sewer Rates
MWRA Advisory Board 2016 Water & Sewer Retail Rate Survey
Section I Page 8

Bedford (S/partial W) Residential Water Rates: Residential Sewer Rates:
Last adjusted: July 2016 Last adjusted: July 2016 Next adjustment scheduled: Uknownn Next adjustment scheduled: Unknown Fund: General Fund: General
Base charge per bill $17.50 Base charge per bill $22.50 0 – 20 HCF $ 1.50/HCF 0 – 20 HCF $ 3.60/HCF
> 20 HCF $ 7.20 " > 20 HCF $12.70 "
Based on 100% of water usage.
Billing Frequency: Residential: Semi-Annually Commercial: Monthly
Annual Cost AWWA Standard for Historical Comparison
(120 HCF ≈ 90,000 gals.)
Annual Cost Based on Local, State & Federal Data
(73.8 HCF – See Appendix C for Data & Calc.)
Water $671.00 Water $338.36 Sewer $1,205.00 Sewer $618.26 Combined $1,876.00 Combined $956.62
% change from 2015 11.4%
Commercial Water Rates:
Commercial Sewer Rates:
Base/admin fee: $17.50 Base/admin fee: $22.50 All HCF $7.20 All HCF $12.70
Additional 2016 Data by Community
Does this Community Use Second Meters?
Does this Community Offer Senior and/or Low Income Discounts?
No Yes
Water System Sewer System
MWRA Charges as % of Total Community Water Expenses
50-75% MWRA Charges as % of Total
Community Sewer Expenses 50-75%
Miles of water pipeline replaced/rehabilitated in FY16
1-3 Miles of sewer pipeline
replaced/rehabilitated in FY16 1-3
Water Capital Needs over Next
Five Years $0-10 million
Sewer Capital Needs over Next
Five Years $0-10 million
Anticipated Water Capital Spending over Next Five Years
$1-5 million Anticipated Sewer Capital
Spending over Next Five Years $1-5 million
Stormwater
Current Funding Source of Stormwater-Related Costs:
Tax Levy (DPW Budget)
MWRA Advisory Board 2016 Water & Sewer Retail Rate Survey
Section I Page 9
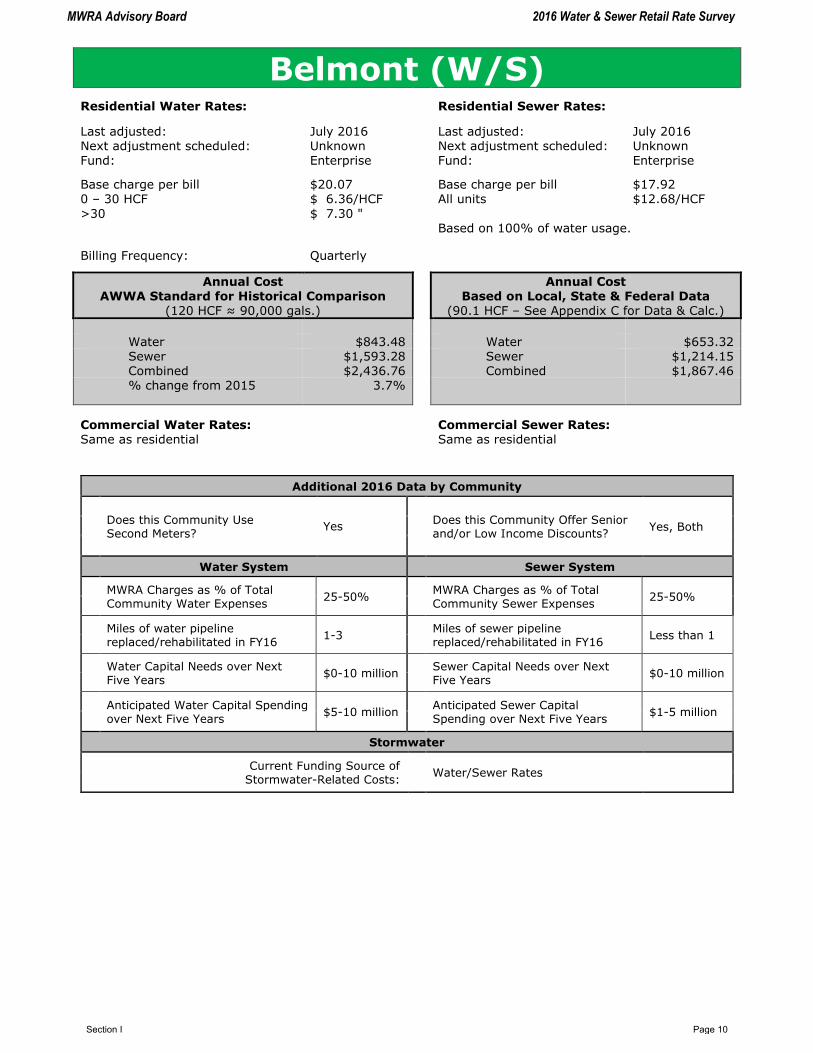
Belmont (W/S) Residential Water Rates: Residential Sewer Rates:
Last adjusted: July 2016 Last adjusted: July 2016 Next adjustment scheduled: Unknown Next adjustment scheduled: Unknown Fund: Enterprise Fund: Enterprise
Base charge per bill $20.07 Base charge per bill $17.92 0 – 30 HCF $ 6.36/HCF All units $12.68/HCF
>30 $ 7.30 " Based on 100% of water usage.
Billing Frequency: Quarterly
Annual Cost AWWA Standard for Historical Comparison
(120 HCF ≈ 90,000 gals.)
Annual Cost Based on Local, State & Federal Data
(90.1 HCF – See Appendix C for Data & Calc.)
Water $843.48 Water $653.32 Sewer $1,593.28 Sewer $1,214.15 Combined $2,436.76 Combined $1,867.46 % change from 2015 3.7%
Commercial Water Rates:
Commercial Sewer Rates:
Same as residential Same as residential
Additional 2016 Data by Community
Does this Community Use Second Meters?
Does this Community Offer Senior and/or Low Income Discounts?
Yes, Both Yes
Water System Sewer System
MWRA Charges as % of Total Community Water Expenses
25-50% MWRA Charges as % of Total
Community Sewer Expenses 25-50%
Miles of water pipeline replaced/rehabilitated in FY16
1-3 Miles of sewer pipeline
replaced/rehabilitated in FY16 Less than 1
Water Capital Needs over Next Five Years
$0-10 million Sewer Capital Needs over Next
Five Years $0-10 million
Anticipated Water Capital Spending over Next Five Years
$5-10 million Anticipated Sewer Capital
Spending over Next Five Years $1-5 million
Stormwater
Current Funding Source of Stormwater-Related Costs:
Water/Sewer Rates
MWRA Advisory Board 2016 Water & Sewer Retail Rate Survey
Section I Page 10

Boston – Boston Water and Sewer Commission (W/S)
Residential Water Rates:
Residential Sewer Rates:
Last adjusted:
January 2016
Last adjusted:
January 2016
Next adjustment scheduled: January 2017 Next adjustment scheduled: January 2017
Fund: Enterprise Fund: Enterprise
First 19 CF/Day $4.900/HCF First 19 CF/Day $6.698/HCF
Next 20 CF $5.129 " Next 20 CF $6.904 "
Next 50 CF $5.341 " Next 50 CF $7.044 "
Next 260 CF $5.679 " Next 260 CF $7.431 "
Next 950 CF $5.925 " Next 950 CF $7.842 "
Over 1,299 CF $6.133 " Over 1,299 CF $8.112 "
Based on 100% of water usage.
Billing Frequency: Monthly
Annual Cost
AWWA Standard for Historical Comparison (120 HCF ≈ 90,000 gals.)
Annual Cost
Based on Local, State & Federal Data (45.9 HCF – See Appendix C for Data & Calc.)
Water $599.59 Water $224.91
Sewer $814.18 Sewer $316.89
Combined $1,413.76 Combined $541.80
% change from 2015 3.1%
Commercial Water Rates:
Commercial Sewer Rates:
Same as residential Same as residential
Additional 2016 Data by Community
Does this Community Use Second Meters?
Does this Community Offer Senior and/or Low Income Discounts?
Yes, Senior No
Water System Sewer System
MWRA Charges as % of Total Community Water Expenses
50-75% MWRA Charges as % of Total
Community Sewer Expenses No Response
Miles of water pipeline replaced/rehabilitated in FY16
Over 6 miles Miles of sewer pipeline
replaced/rehabilitated in FY16 3-6 miles
Water Capital Needs over Next
Five Years
Over $50
million
Sewer Capital Needs over Next
Five Years
Over $50
million
Anticipated Water Capital Spending over Next Five Years
Over $10 million
Anticipated Sewer Capital Spending over Next Five Years
Over $10 million
Stormwater
Current Funding Source of Stormwater-Related Costs:
Water/Sewer Rates
MWRA Advisory Board 2016 Water & Sewer Retail Rate Survey
Section I Page 11

Residential Water Rates:
Residential Sewer Rates: Last adjusted:
June 2016
Last adjusted:
June 2016
Next adjustment scheduled: No response Next adjustment scheduled: No response Fund: Enterprise Fund: Enterprise
Base charge per bill: $17.00 Base charge per bill: $17.00 0 – 5 HCF $ 2.72/HCF 0 – 5 HCF $ 5.05/HCF >5 – 35 HCF $ 4.10 " >5 – 35 HCF $ 6.38 " >35 – 200 HCF $ 7.42 " >35 – 200 HCF $ 9.99 " >200 HCF $10.57 " >200 HCF $10.97 "
Based on 100% of water usage.
Billing Frequency: Quarterly
Annual Cost
AWWA Standard for Historical Comparison
(120 HCF ≈ 90,000 gals.)
Annual Cost
Based on Local, State & Federal Data
(54.8 HCF – See Appendix C for Data & Calc.)
Water $532.40 Water $242.12 Sewer $807.00 Sewer $355.30 Combined $1,339.40 Combined $597.42 % change from 2015 4.8%
Commercial Water Rates:
Commercial Sewer Rates:
Same as residential Same as residential
Additional 2016 Data by Community
Does this Community Use Second Meters?
Does this Community Offer Senior and/or Low Income Discounts?
No No
Water System Sewer System
MWRA Charges as % of Total Community Water Expenses
N/A MWRA Charges as % of Total
Community Sewer Expenses No Response
Miles of water pipeline
replaced/rehabilitated in FY16 1-3
Miles of sewer pipeline
replaced/rehabilitated in FY16 Less than 1
Water Capital Needs over Next Five Years
$10-20 million
Sewer Capital Needs over Next Five Years
$0-10 million
Anticipated Water Capital Spending over Next Five Years
Over $10 million
Anticipated Sewer Capital Spending over Next Five Years
$1-5 million
Stormwater
Current Funding Source of Stormwater-Related Costs:
Tax Levy
Braintree has a $5.00 discount for all customers, residential and commercial, if bill is paid within 30 days.
MWRA Advisory Board 2016 Water & Sewer Retail Rate Survey
Section I Page 12

Brookline (W/S)
Residential Water Rates:
Residential Sewer Rates: Last adjusted:
July 2016
Last adjusted:
July 2016
Next adjustment scheduled: July 2017 Next adjustment scheduled: July 2017 Fund: Enterprise Fund: Enterprise
Base charge $30.00 Base charge $30.00 0 – 7 HCF $ 1.90/HCF 0 – 7 HCF $ 4.20/HCF >7 $ 5.55 " >7 $ 8.50 "
Based on 100% of water usage. Billing Frequency: Quarterly
Annual Cost AWWA Standard for Historical Comparison
(120 HCF ≈ 90,000 gals.)
Annual Cost Based on Local, State & Federal Data
(74.3 HCF – See Appendix C for Data & Calc.)
Water $683.80 Water $430.17 Sewer $1,019.60 Sewer $631.15 Combined $1,703.40 Combined $1,061.32 % change from 2015 4.0%
Commercial Water Rates:
Commercial Sewer Rates:
Same as residential Same as residential
Additional 2016 Data by Community
Does this Community Use Second Meters?
Does this Community Offer Senior and/or Low Income Discounts?
Yes, Both Yes
Water System Sewer System
MWRA Charges as % of Total Community Water Expenses
50-75% MWRA Charges as % of Total
Community Sewer Expenses Over 75%
Miles of water pipeline replaced/rehabilitated in FY16
Less than 1 Miles of sewer pipeline
replaced/rehabilitated in FY16 3-6 miles
Water Capital Needs over Next Five Years
$0-10 million Sewer Capital Needs over Next
Five Years $10-20 million
Anticipated Water Capital Spending over Next Five Years
$100 thousand-1 million
Anticipated Sewer Capital Spending over Next Five Years
$Over 10 million
Stormwater
Current Funding Source of Stormwater-Related Costs:
Water/Sewer Rates
MWRA Advisory Board 2016 Water & Sewer Retail Rate Survey
Section I Page 13

Residential Water Rates:
Residential Sewer Rates: Last adjusted:
Dec. 2012
Last adjusted:
Dec. 2012
Next adjustment scheduled: Unknown Next adjustment scheduled: Unknown Fund: General Fund: Enterprise
First 20 kgal $37.00 First 20 kgal $42.00 >20 – 30 kgal $ 2.00/kgal >20 – 30 kgal $ 6.00/kgal >30 – 50 kgal $ 2.75 " >30 – 50 kgal $ 6.25 "
>50 – 70 kgal $ 3.50 " >50 – 70 kgal $ 7.00 " >70 – 90 kgal $ 4.50 " >70 – 90 kgal $ 8.00 " >90 kgal $ 4.75 " >90 kgal $ 9.50 "
Based on 100% of water usage.
Billing Frequency: Residential: Semi-annually Commercial: Quarterly
Annual Cost AWWA Standard for Historical Comparison
(120 HCF ≈ 90,000 gals.)
Annual Cost Based on Local, State & Federal Data
(47.0 kgal – See Appendix C for Data & Calc.)
Water $196.50 Water $84.88
Sewer $391.50 Sewer $116.64 Combined $588.00 Combined $201.52 % change from 2015 0.0%
Commercial Water Rates:
Commercial Sewer Rates:
First 10 kgal $18.50 First 10 kgal $34.00 >10 – 15 kgal $ 3.00/kgal >10 – 15 kgal $ 7.00/kgal >15 – 35 kgal $ 4.00 " >15 – 35 kgal $ 8.00 " >35 kgal $ 4.75 " >35 kgal $ 9.50 "
Additional 2016 Data by Community
Does this Community Use Second Meters?
Does this Community Offer Senior and/or Low Income Discounts?
No Yes
Water System Sewer System
MWRA Charges as % of Total Community Water Expenses
N/A MWRA Charges as % of Total
Community Sewer Expenses N?A
Miles of water pipeline replaced/rehabilitated in FY16
Less than 1 Miles of sewer pipeline
replaced/rehabilitated in FY16 Less than 1
Water Capital Needs over Next Five Years
$0-10 million Sewer Capital Needs over Next
Five Years $0-10 million
Anticipated Water Capital Spending over Next Five Years
$100 thousand to $1 million
Anticipated Sewer Capital Spending over Next Five Years
$100 thousand to $1 million
Stormwater
Current Funding Source of Stormwater-Related Costs:
Tax Levy
MWRA Advisory Board 2016 Water & Sewer Retail Rate Survey
Section I Page 14

Cambridge (S/partial W)
Residential Water Rates:
Residential Sewer Rates: Last adjusted:
April 2011
Last adjusted:
April 2016
Next adjustment scheduled: April 2017 Next adjustment scheduled: April 2017 Fund: Enterprise Fund: General
0 – 40 HCF/year $3.02/HCF 0 – 40 HCF/year $ 9.50/HCF >40 – 400 HCF/year $3.24 " >40 – 400 HCF/year $10.05 " >400 – 2,000 HCF/year $3.44 " >400 – 2,000 HCF/year $10.79 "
>2,000 – 10,000 HCF/year $3.65 " >2,000 – 10,000 HCF/year $11.62 " >10,000 HCF/year $3.96 " >10,000 HCF/year $12.35 "
Based on 100% of water usage.
Billing Frequency: Quarterly
Annual Cost
AWWA Standard for Historical Comparison (120 HCF ≈ 90,000 gals.)
Annual Cost
Based on Local, State & Federal Data (47.6 HCF – See Appendix C for Data & Calc.)
Water $380.00 Water $145.42 Sewer $1,184.00 Sewer $456.38 Combined $1,564.00 Combined $601.80 % change from 2015 2.4%
Commercial Water Rates:
Commercial Sewer Rates:
Same as residential Same as residential
Additional 2016 Data by Community
Does this Community Use Second Meters?
Does this Community Offer Senior and/or Low Income Discounts?
Yes, Both Yes
Water System Sewer System
MWRA Charges as % of Total Community Water Expenses
No Response MWRA Charges as % of Total
Community Sewer Expenses No Response
Miles of water pipeline replaced/rehabilitated in FY16
No Response Miles of sewer pipeline
replaced/rehabilitated in FY16 No Response
Water Capital Needs over Next
Five Years No Response
Sewer Capital Needs over Next
Five Years No Response
Anticipated Water Capital Spending over Next Five Years
No Response Anticipated Sewer Capital
Spending over Next Five Years No Response
Stormwater
Current Funding Source of Stormwater-Related Costs:
Water/Sewer Rates
MWRA Advisory Board 2016 Water & Sewer Retail Rate Survey
Section I Page 15

Canton (S/partial W)
Residential Water Rates:
Residential Sewer Rates: Last adjusted:
July 2014
Last adjusted:
July 2014
Next adjustment scheduled: Unknown Next adjustment scheduled:
Unknown
Fund: Enterprise Fund: Enterprise
Base Charge $10.00 Base Charge $ 5.00 1 – 15 HCF $ 3.40/HCF 1 – 15 HCF $ 7.77/HCF
>15 – 40 HCF $ 6.10 " >15 – 40 HCF $ 8.79 " >40 – 100 HCF $10.07 " >40 – 100 HCF $11.61 " >100 HCF $12.79 " >100 HCF $14.88 "
Based on 100% of water usage.
Billing Frequency: Quarterly
Annual Cost
AWWA Standard for Historical Comparison (120 HCF ≈ 90,000 gals.)
Annual Cost
Based on Local, State & Federal Data (80.4 HCF – See Appendix C for Data & Calc.)
Water $610.00 Water $368.44 Sewer $1,013.60 Sewer $665.52 Combined $1,623.60 Combined $1,033.96 % change from 2015 0.0%
Commercial Water Rates:
Commercial Sewer
Rates:
Same as residential Same as residential
Additional 2016 Data by Community
Does this Community Use Second Meters?
Does this Community Offer Senior and/or Low Income Discounts?
No Yes
Water System Sewer System
MWRA Charges as % of Total Community Water Expenses
25-50% MWRA Charges as % of Total
Community Sewer Expenses Over 75%
Miles of water pipeline replaced/rehabilitated in FY16
Less than 1 Miles of sewer pipeline
replaced/rehabilitated in FY16 Less than 1
Water Capital Needs over Next Five Years
$0-10 million Sewer Capital Needs over Next
Five Years $0-10 million
Anticipated Water Capital Spending over Next Five Years
$1-5 million Anticipated Sewer Capital
Spending over Next Five Years $1-5 million
Stormwater
Current Funding Source of Stormwater-Related Costs:
Tax Levy (DPW Budget)
MWRA Advisory Board 2016 Water & Sewer Retail Rate Survey
Section I Page 16

Chelsea (W/S)
Residential Water Rates:
Residential Sewer Rates: Last adjusted:
July 2016
Last adjusted:
July 2016
Next adjustment scheduled: July 2017 Next adjustment scheduled: July 2017 Fund: Enterprise Fund: Enterprise
0 – 10 HCF $4.69/HCF 0 – 10 HCF $ 8.27/HCF >10 – 25 HCF $5.71 " >10 – 50 HCF $ 9.02 " >50 HCF $6.83 " >50 HCF $10.36 "
Based on 100% of water usage.
Billing Frequency: Monthly
Annual Cost AWWA Standard for Historical Comparison
(120 HCF ≈ 90,000 gals.)
Annual Cost Based on Local, State & Federal Data
(68.4 HCF – See Appendix C for Data & Calc.)
Water $562.80 Water $320.80 Sewer $992.40 Sewer $565.67 Combined $1,555.20 Combined $886.46 % change from 2015 4.8%
Commercial Water Rates:
Commercial Sewer Rates:
Same as residential Same as residential
Additional 2016 Data by Community
Does this Community Use Second Meters?
Does this Community Offer Senior and/or Low Income Discounts?
No Yes
Water System Sewer System
MWRA Charges as % of Total Community Water Expenses
50-75% MWRA Charges as % of Total
Community Sewer Expenses 25-50%
Miles of water pipeline replaced/rehabilitated in FY16
Less than 1 Miles of sewer pipeline
replaced/rehabilitated in FY16 Less than 1
Water Capital Needs over Next Five Years
Over $50 million
Sewer Capital Needs over Next Five Years
Over $50 Million
Anticipated Water Capital Spending
over Next Five Years $5-10 million
Anticipated Sewer Capital
Spending over Next Five Years $5-10 million
Stormwater
Current Funding Source of
Stormwater-Related Costs:
Water/Sewer Rates
MWRA Advisory Board 2016 Water & Sewer Retail Rate Survey
Section I Page 17

Chicopee (W)
Residential Water Rates:
Residential Sewer Rates: Last adjusted:
July 2016
Last adjusted:
July 2016
Next adjustment scheduled: July 2016 Next adjustment scheduled: July 2016 Fund: Enterprise Fund: Enterprise
Minimum Charge per bill Minimum charge $10.00 (<334CF) $10.00/quarter 0 – 10 HCF $ 3.80/HCF 0 – 10 HCF $ 6.15/HCF >10 HCF $ 4.20 " >10 HCF $ 6.95 " Based on 100% of water usage, with a summer
discount of 30% during the months of June, July,
and August. Billing Frequency: Quarterly
Annual Cost
AWWA Standard for Historical Comparison (120 HCF ≈ 90,000 gals.)
Annual Cost
Based on Local, State & Federal Data (64.0 HCF – See Appendix C for Data & Calc.)
Water $488.00 Water $252.80 Sewer $739.45 Sewer $379.44
Combined $1,227.45 Combined $632.24 % change from 2015 7.7%
Commercial Water Rates:
Commercial Sewer Rates:
Same as residential with $2.00 water meter rental charge (5/8" meter)
Same as residential
Additional 2016 Data by Community
Does this Community Use Second Meters?
Does this Community Offer Senior and/or Low Income Discounts?
No Yes
Water System Sewer System
MWRA Charges as % of Total Community Water Expenses
25-50% MWRA Charges as % of Total
Community Sewer Expenses 0-25%
Miles of water pipeline replaced/rehabilitated in FY16
1-3 miles Miles of sewer pipeline
replaced/rehabilitated in FY16 3-6 miles
Water Capital Needs over Next Five Years
$20 – 50 million
Sewer Capital Needs over Next Five Years
$20 – 50 million
Anticipated Water Capital Spending over Next Five Years
Over $10 million
Anticipated Sewer Capital Spending over Next Five Years
Over $10 million
Stormwater
Current Funding Source of Stormwater-Related Costs:
Special Assessment/ Fee
Chicopee is 1 of 3 MWRA communities that has established a special assessment to fund stormwater-related costs. The residential stormwater fee is $25 per quarter; $100 per year. For more information, see Appendix G.
MWRA Advisory Board 2016 Water & Sewer Retail Rate Survey
Section I Page 18

Clinton (W/S)
Residential Water Rates:
Residential Sewer Rates: Last adjusted:
April 2006
Last adjusted:
April 2006
Next adjustment scheduled: No response Next adjustment scheduled: No response Fund: Enterprise Fund: Enterprise
Minimum Bill: $56.60 Minimum Bill: $42.40 0 – 10 HCF $ 5.66/HCF Sewer bill is calculated as 75% of water bill. >10 – 30 HCF $ 1.30 "
>30 – 50 HCF $ 2.90 " >50 – 200 HCF $ 3.12 " >200 HCF $ 3.35 " Billing Frequency: Quarterly
Annual Cost AWWA Standard for Historical Comparison
(120 HCF ≈ 90,000 gals.)
Annual Cost Based on Local, State & Federal Data
(82.5 HCF – See Appendix C for Data & Calc.)
Water $343.60 Water $289.00 Sewer $257.70 Sewer $216.75 Combined $601.30 Combined $505.75 % change from 2015 0.0%
Commercial Water Rates:
Commercial Sewer Rates:
Same as residential Same as residential
Additional 2016 Data by Community
Does this Community Use Second Meters?
Does this Community Offer Senior and/or Low Income Discounts?
No response Yes,
grandfathered accounts
Water System Sewer System
MWRA Charges as % of Total Community Water Expenses
0-25% MWRA Charges as % of Total
Community Sewer Expenses 0-25%
Miles of water pipeline
replaced/rehabilitated in FY16 Less than 1
Miles of sewer pipeline
replaced/rehabilitated in FY16 Less than 1
Water Capital Needs over Next Five Years
$10 – 20 million
Sewer Capital Needs over Next Five Years
$10 – 20 million
Anticipated Water Capital Spending over Next Five Years
$1 – 5 million Anticipated Sewer Capital
Spending over Next Five Years $1 – 5 million
Stormwater
Current Funding Source of Stormwater-Related Costs:
Tax Levy (DPW Budget)
Clinton bills according to actual usage bi-annually, and uses the minimum bill listed for the interim bills. Chapter 307 of the Acts of 1987 § 8 limits Clinton’s MWRA assessment to $500,000 per year.
MWRA Advisory Board 2016 Water & Sewer Retail Rate Survey
Section I Page 19

Residential Water Rates:
Residential Sewer Rates: Last adjusted:
January 2015
Last adjusted:
June 2008
Next adjustment scheduled: January 2016 Next adjustment scheduled: Unknown Fund: Enterprise Fund: Enterprise
Minimum charge per bill includes first 3 HCF (⅝" meter) $37.71
Minimum charge (under 5 HCF) $32.32
> 5 HCF $ 8.08/HCF
>3 – 42 HCF $ 4.43/HCF Based on 100% of water usage. >42 – 75 HCF $ 7.19 " >75 HCF $ 9.31 "
Billing Frequency: Quarterly, some commercial monthly
Annual Cost
AWWA Standard for Historical Comparison (120 HCF ≈ 90,000 gals.)
Annual Cost
Based on Local, State & Federal Data (80.3 HCF – See Appendix C for Data & Calc.)
Water $628.20 Water $452.08 Sewer $937.28 Sewer $678.72
Combined $1,565.48 Combined $1,130.80 % change from 2015 0.7%
Commercial Water Rates:
Commercial Sewer Rates:
Minimum charge 5/8" with 9 HCF
allowance: $55.95 Minimum Charge: (under 5
HCF)
$45.20
All units in excess of allowance $ 4.43/HCF All units $11.30/HCF
Additional 2016 Data by Community
Does this Community Use Second Meters?
Does this Community Offer Senior and/or Low Income Discounts?
Yes, Low Income Yes
Water System Sewer System
MWRA Charges as % of Total Community Water Expenses
0-25% MWRA Charges as % of Total
Community Sewer Expenses 0-25%
Miles of water pipeline replaced/rehabilitated in FY16
1-3 miles Miles of sewer pipeline
replaced/rehabilitated in FY16 3-6
Water Capital Needs over Next Five Years
$20-50 million
Sewer Capital Needs over Next Five Years
$0-10 million
Anticipated Water Capital Spending over Next Five Years
Over $10 million
Anticipated Sewer Capital Spending over Next Five Years
$1-5 million
Stormwater
Current Funding Source of Stormwater-Related Costs:
Tax Levy (DPW Budget)
MWRA Advisory Board 2016 Water & Sewer Retail Rate Survey
Section I Page 20

Everett (W/S)
Residential Water Rates:
Residential Sewer Rates: Last adjusted:
July 2016
Last adjusted:
July 2016
Next adjustment scheduled: No response Next adjustment scheduled: No response Fund: Enterprise Fund: Enterprise
0 – 30 HCF $2.24/HCF 0 – 30 HCF $ 6.23/HCF >30 – 60 HCF $2.90 " >30 – 60 HCF $ 8.16 " >60 – 90 HCF $3.49 " >60 – 90 HCF $ 9.37 "
>90 – 240 HCF $3.98 " >90 – 240 HCF $10.51 " >240 HCF $4.78 " >240 HCF $11.70 " Based on 100% of water usage.
Billing Frequency: Quarterly
Annual Cost AWWA Standard for Historical Comparison
(120 HCF ≈ 90,000 gals.)
Annual Cost Based on Local, State & Federal Data
(63.7 HCF – See Appendix C for Data & Calc.)
Water $273.60 Water $145.24 Sewer $747.60 Sewer $396.85 Combined $1,021.20 Combined $542.09 % change from 2015 1.9%
Commercial Water Rates:
Commercial Sewer Rates:
Same as residential Same as residential
Additional 2016 Data by Community
Does this Community Use Second Meters?
Does this Community Offer Senior and/or Low Income Discounts?
No No
Water System Sewer System
MWRA Charges as % of Total Community Water Expenses
Over 75% MWRA Charges as % of Total
Community Sewer Expenses Over 75%
Miles of water pipeline replaced/rehabilitated in FY16
No response Miles of sewer pipeline
replaced/rehabilitated in FY16 No response
Water Capital Needs over Next Five Years
$10-20 million
Sewer Capital Needs over Next Five Years
$10-20 million
Anticipated Water Capital Spending over Next Five Years
$1-5 million Anticipated Sewer Capital
Spending over Next Five Years $1-5 million
Stormwater
Current Funding Source of Stormwater-Related Costs:
Operating Budget / Tax Levy
MWRA Advisory Board 2016 Water & Sewer Retail Rate Survey
Section I Page 21

Framingham (W/S)
Residential Water Rates:
Residential Sewer Rates: Last adjusted:
July 2016
Last adjusted:
July 2016
Next adjustment scheduled: July 2017 Next adjustment scheduled: July 2017 Fund: Enterprise Fund: Enterprise
0 – 12 HCF $ 5.89/HCF 0 – 12 HCF $ 7.65 /HCF >12 – 27 HCF $ 6.55 " >12 – 27 HCF $ 7.89 " >27 – 51 HCF $ 7.62 " >27 – 51 HCF $10.59 "
>51 – 750 HCF $ 8.98 " >51 – 750 HCF $15.14 " >750 HCF $10.88 " >750 HCF $21.99 " Based on 100% of water usage.
Billing Frequency: Quarterly, some commercial monthly
Annual Cost
AWWA Standard for Historical Comparison (120 HCF ≈ 90,000 gals.)
Annual Cost
Based on Local, State & Federal Data (63.9 HCF – See Appendix C for Data & Calc.)
Water $767.16 Water $386.87 Sewer $967.68 Sewer $492.65 Combined $1,734.84 Combined $879.52 % change from 2015 6.1%
Commercial Water Rates:
Commercial Sewer Rates:
Same as residential Same as residential
Additional 2016 Data by Community
Does this Community Use Second Meters?
Does this Community Offer Senior and/or Low Income Discounts?
Yes, Senior Yes
Water System Sewer System
MWRA Charges as % of Total
Community Water Expenses 25-50%
MWRA Charges as % of Total
Community Sewer Expenses 25-50%
Miles of water pipeline replaced/rehabilitated in FY16
3-6 miles Miles of sewer pipeline
replaced/rehabilitated in FY16 3-6 miles
Water Capital Needs over Next Five Years
Over $50 million
Sewer Capital Needs over Next Five Years
$20-50 million
Anticipated Water Capital Spending over Next Five Years
Over $10 million
Anticipated Sewer Capital Spending over Next Five Years
Over $10 million
Stormwater
Current Funding Source of Stormwater-Related Costs:
Tax Levy (DPW Budget)
MWRA Advisory Board 2016 Water & Sewer Retail Rate Survey
Section I Page 22
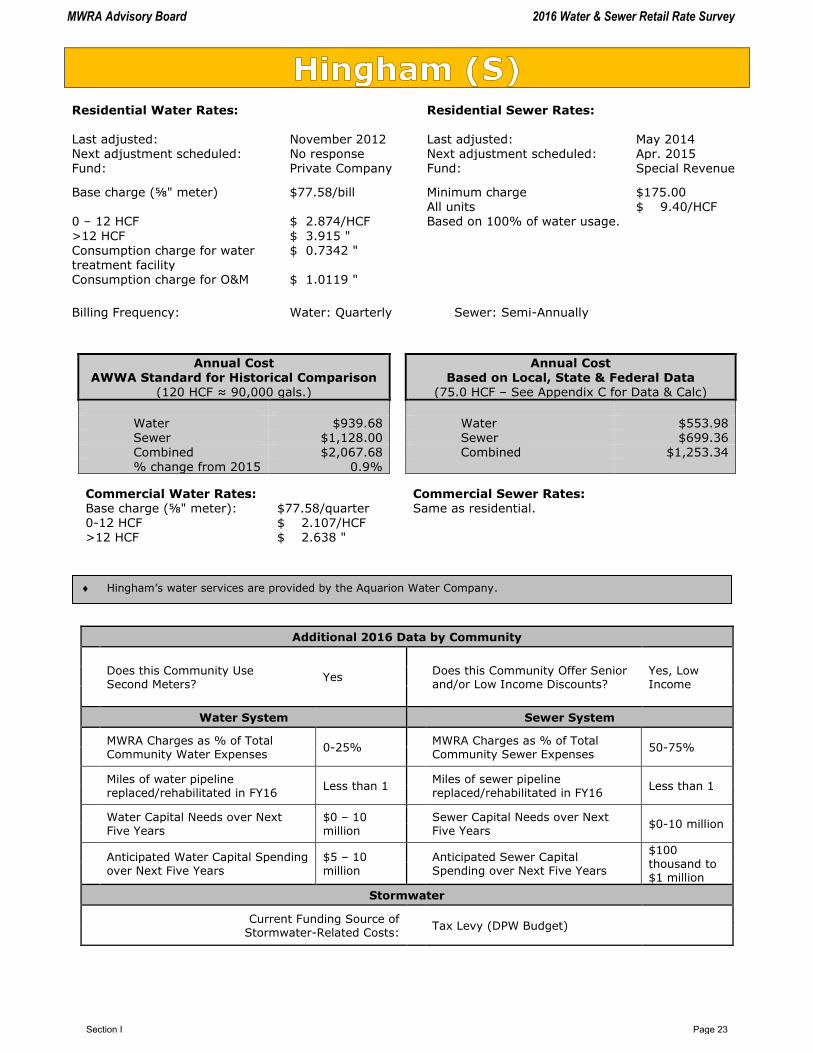
Residential Water Rates:
Residential Sewer Rates: Last adjusted:
November 2012
Last adjusted:
May 2014
Next adjustment scheduled: No response Next adjustment scheduled: Apr. 2015 Fund: Private Company Fund: Special Revenue
Base charge (⅝" meter) $77.58/bill Minimum charge $175.00 All units $ 9.40/HCF
0 – 12 HCF $ 2.874/HCF Based on 100% of water usage.
>12 HCF $ 3.915 " Consumption charge for water treatment facility
$ 0.7342 "
Consumption charge for O&M $ 1.0119 "
Billing Frequency: Water: Quarterly Sewer: Semi-Annually
Annual Cost AWWA Standard for Historical Comparison
(120 HCF ≈ 90,000 gals.)
Annual Cost Based on Local, State & Federal Data
(75.0 HCF – See Appendix C for Data & Calc)
Water $939.68 Water $553.98 Sewer $1,128.00 Sewer $699.36 Combined $2,067.68 Combined $1,253.34 % change from 2015 0.9%
Commercial Water Rates:
Commercial Sewer Rates:
Base charge (⅝" meter): $77.58/quarter 0-12 HCF $ 2.107/HCF >12 HCF $ 2.638 "
Same as residential.
Additional 2016 Data by Community
Does this Community Use Second Meters?
Does this Community Offer Senior and/or Low Income Discounts?
Yes, Low Income Yes
Water System Sewer System
MWRA Charges as % of Total Community Water Expenses
0-25% MWRA Charges as % of Total
Community Sewer Expenses 50-75%
Miles of water pipeline replaced/rehabilitated in FY16
Less than 1 Miles of sewer pipeline
replaced/rehabilitated in FY16 Less than 1
Water Capital Needs over Next Five Years
$0 – 10 million
Sewer Capital Needs over Next Five Years
$0-10 million
Anticipated Water Capital Spending over Next Five Years
$5 – 10 million
Anticipated Sewer Capital Spending over Next Five Years
$100 thousand to $1 million
Stormwater
Current Funding Source of Stormwater-Related Costs:
Tax Levy (DPW Budget)
Hingham’s water services are provided by the Aquarion Water Company.
MWRA Advisory Board 2016 Water & Sewer Retail Rate Survey
Section I Page 23

Residential Water Rates:
Residential Sewer Rates: Last adjusted:
December 2014
Last adjusted:
December 2014
Next adjustment scheduled: Unknown Next adjustment scheduled: Unknown Fund: Enterprise Fund: Enterprise
Minimum charge $67.80/bill Minimum charge $131.88/bill All units $ 5.30/HCF All units $ 6.95/HCF Based on 100% of water usage.
Billing Frequency:
Quarterly (2 estimated bills)
Annual Cost AWWA Standard for Historical Comparison
(120 HCF ≈ 90,000 gals.)
Annual Cost Based on Local, State & Federal Data
(54.6 HCF – See Appendix C for Data & Calc.)
Water $636.00 Water $352.98 Sewer $834.00 Sewer $379.47 Combined $1,470.00 Combined $732.45 % change from 2015 0.0%
Commercial Water Rates:
Commercial Sewer Rates:
All units $5.53/HCF All units $6.12/HCF
Additional 2016 Data by Community
Does this Community Use Second Meters?
Does this Community Offer Senior and/or Low Income Discounts?
No No
Water System Sewer System
MWRA Charges as % of Total
Community Water Expenses N/A
MWRA Charges as % of Total
Community Sewer Expenses Over 75%
Miles of water pipeline replaced/rehabilitated in FY16
1-3 Miles of sewer pipeline
replaced/rehabilitated in FY16 1-3
Water Capital Needs over Next Five Years
$0 – 10 million
Sewer Capital Needs over Next Five Years
$0 – 10 million
Anticipated Water Capital Spending over Next Five Years
$1 – 5 million
Anticipated Sewer Capital Spending over Next Five Years
$1 – 5 million
Stormwater
Current Funding Source of Stormwater-Related Costs:
Special Assessment/Fee
MWRA Advisory Board 2016 Water & Sewer Retail Rate Survey
Section I Page 24

Leominster (partial W)
Residential Water Rates:
Residential Sewer Rates: Last adjusted:
April 2012
Last adjusted:
April 2013
Next adjustment scheduled: Unknown Next adjustment scheduled: Unknown Fund: Special Revenue Fund: Special Revenue
First 3 HCF $20.00 First 3 HCF $20.00 >3 HCF $ 3.48/HCF >3 HCF $ 3.97/HCF Based on 100% of water usage.
Billing Frequency: Quarterly
Annual Cost AWWA Standard for Historical Comparison
(120 HCF ≈ 90,000 gals.)
Annual Cost Based on Local, State & Federal Data
(62.8 HCF – See Appendix C for Data & Calc.)
Water $455.84 Water $298.54 Sewer $508.76 Sewer $329.32 Combined $964.60 Combined $627.86 % change from 2015 0.0%
Commercial Water Rates:
Commercial Sewer Rates:
Same as residential Same as residential
Additional 2016 Data by Community
Does this Community Use
Second Meters?
Does this Community Offer Senior
and/or Low Income Discounts? No Yes
Water System Sewer System
MWRA Charges as % of Total Community Water Expenses
0-25% MWRA Charges as % of Total
Community Sewer Expenses N/A
Miles of water pipeline replaced/rehabilitated in FY16
1-3 Miles of sewer pipeline
replaced/rehabilitated in FY16 1-3
Water Capital Needs over Next Five Years
$0 – 10 million
Sewer Capital Needs over Next Five Years
$0 – 10 million
Anticipated Water Capital Spending over Next Five Years
$1 – 5 million
Anticipated Sewer Capital Spending over Next Five Years
$5 – 10 million
Stormwater
Current Funding Source of Stormwater-Related Costs:
Tax Levy
MWRA Advisory Board 2016 Water & Sewer Retail Rate Survey
Section I Page 25

Lexington (W/S)
Residential Water Rates:
Residential Sewer Rates: Last adjusted:
October 2016
Last adjusted:
October 2016
Next adjustment scheduled: October 2017 Next adjustment scheduled: October 2017 Fund: Enterprise Fund: Enterprise
0 – 40 HCF $3.76/HCF 0 – 40 HCF $ 6.84/HCF >40 – 80 HCF $5.64 " >40 – 80 HCF $11.17 " >80 HCF $7.44 " >80 HCF $17.76 "
Based on 100% of water usage. Billing Frequency: Semi-Annually
Annual Cost AWWA Standard for Historical Comparison
(120 HCF ≈ 90,000 gals.)
Annual Cost Based on Local, State & Federal Data
(121.7 HCF – See Appendix C for Data & Calc.)
Water $526.40 Water $535.99 Sewer $994.00 Sewer $1,012.99 Combined $1,520.40 Combined $1,548.98 % change from 2015 2.8%
Commercial Water Rates:
Commercial Sewer Rates:
Same as residential Same as residential
Additional 2016 Data by Community
Does this Community Use Second Meters?
Does this Community Offer Senior and/or Low Income Discounts?
Yes, Low Income Yes
Water System Sewer System
MWRA Charges as % of Total Community Water Expenses
Over 75% MWRA Charges as % of Total
Community Sewer Expenses Over 75%
Miles of water pipeline replaced/rehabilitated in FY16
Less than 1 Miles of sewer pipeline
replaced/rehabilitated in FY16 Less than 1
Water Capital Needs over Next
Five Years
$0 – 10
million
Sewer Capital Needs over Next
Five Years
$0 – 10
million
Anticipated Water Capital Spending over Next Five Years
$5 – 10 million
Anticipated Sewer Capital Spending over Next Five Years
$5 – 10 million
Stormwater
Current Funding Source of Stormwater-Related Costs:
Operating Budget/tax levy
MWRA Advisory Board 2016 Water & Sewer Retail Rate Survey
Section I Page 26
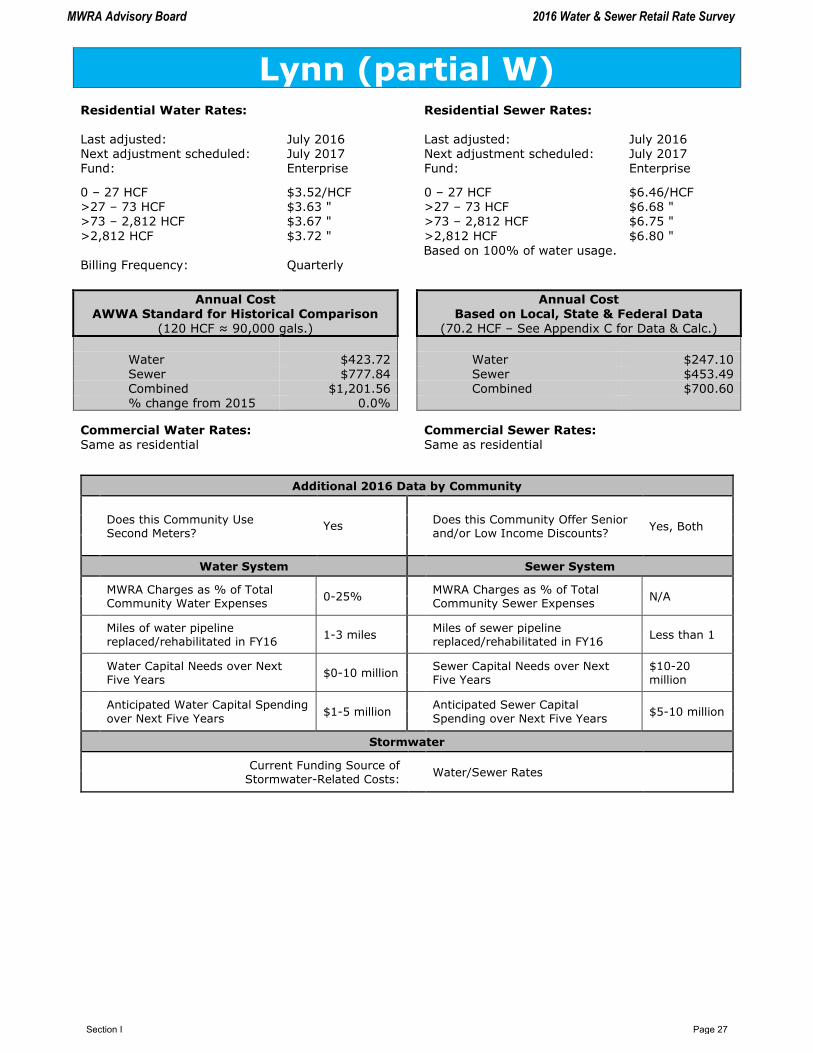
Lynn (partial W)
Residential Water Rates:
Residential Sewer Rates: Last adjusted:
July 2016
Last adjusted:
July 2016
Next adjustment scheduled: July 2017 Next adjustment scheduled: July 2017 Fund: Enterprise Fund: Enterprise
0 – 27 HCF $3.52/HCF 0 – 27 HCF $6.46/HCF >27 – 73 HCF $3.63 " >27 – 73 HCF $6.68 " >73 – 2,812 HCF $3.67 " >73 – 2,812 HCF $6.75 "
>2,812 HCF $3.72 " >2,812 HCF $6.80 " Based on 100% of water usage. Billing Frequency: Quarterly
Annual Cost AWWA Standard for Historical Comparison
(120 HCF ≈ 90,000 gals.)
Annual Cost Based on Local, State & Federal Data
(70.2 HCF – See Appendix C for Data & Calc.)
Water $423.72 Water $247.10 Sewer $777.84 Sewer $453.49 Combined $1,201.56 Combined $700.60 % change from 2015 0.0%
Commercial Water Rates:
Commercial Sewer Rates:
Same as residential Same as residential
Additional 2016 Data by Community
Does this Community Use Second Meters?
Does this Community Offer Senior and/or Low Income Discounts?
Yes, Both Yes
Water System Sewer System
MWRA Charges as % of Total Community Water Expenses
0-25% MWRA Charges as % of Total
Community Sewer Expenses N/A
Miles of water pipeline replaced/rehabilitated in FY16
1-3 miles Miles of sewer pipeline
replaced/rehabilitated in FY16 Less than 1
Water Capital Needs over Next Five Years
$0-10 million Sewer Capital Needs over Next
Five Years $10-20 million
Anticipated Water Capital Spending
over Next Five Years $1-5 million
Anticipated Sewer Capital
Spending over Next Five Years $5-10 million
Stormwater
Current Funding Source of
Stormwater-Related Costs:
Water/Sewer Rates
MWRA Advisory Board 2016 Water & Sewer Retail Rate Survey
Section I Page 27

Lynnfield – Lynnfield Water District (W)
Residential Water Rates:
Residential Sewer Rates:
Last adjusted:
Apr. 2014
Last adjusted:
Not applicable
Next adjustment scheduled: No response Next adjustment scheduled: Not applicable Fund: General Fund: Not applicable
Base charge includes 0 – 20 HCF $66.00/bill
Community not sewered.
>20 – 100 HCF $ 2.86/HCF >100 HCF $ 3.10 " Billing Frequency: Residential: Semi-annually Commercial: Quarterly
Annual Cost AWWA Standard for Historical Comparison
(120 HCF ≈ 90,000 gals.)
Annual Cost Based on Local, State & Federal Data
(96.2 HCF – See Appendix C for Data & Calc.)
Water $360.80 Water $407.13
Sewer Not sewered Sewer Not sewered Combined $360.80 Combined $407.13 % change from 2015 0.0%
Commercial Water Rates:
Commercial Sewer Rates:
Base charge per quarterly bill includes 0 – 10 HCF $33.00 >10 – 50 HCF $ 2.86/HCF >50 HCF $ 3.10 "
n/a
Additional 2016 Data by Community
Does this Community Use Second Meters?
Does this Community Offer Senior and/or Low Income Discounts?
No No
Water System Sewer System
MWRA Charges as % of Total Community Water Expenses
No response MWRA Charges as % of Total
Community Sewer Expenses N/A
Miles of water pipeline replaced/rehabilitated in FY16
No response Miles of sewer pipeline
replaced/rehabilitated in FY16 N/A
Water Capital Needs over Next Five Years
No response Sewer Capital Needs over Next
Five Years N/A
Anticipated Water Capital Spending over Next Five Years
No response Anticipated Sewer Capital
Spending over Next Five Years N/A
Stormwater
Current Funding Source of Stormwater-Related Costs:
N/A
Lynnfield has a 10% discount for water service for all customers if bill is paid within 20 days. A portion of the water district’s budget is raised via the property tax.
MWRA Advisory Board 2016 Water & Sewer Retail Rate Survey
Section I Page 28

Malden (W/S)
Residential Water Rates:
Residential Sewer Rates: Last adjusted:
July 2015
Last adjusted:
July 2015
Next adjustment scheduled: No response Next adjustment scheduled: No response Fund: Enterprise Fund: Enterprise
Minimum charge (⅝" meter) includes 0 – 0.5 HCF: $ 3.00/month
Minimum charge (⅝" meter) includes 0 – 0.5 HCF: $ 3.00/month
>0.5 – 8 HCF: $ 4.38/HCF >0.5 – 8 HCF: $ 5.38/HCF
>8 – 120 HCF $ 9.78 " >8 – 120 HCF $10.46 " >120 HCF $13.23 " >120 HCF $12.02 " Based on 100% of water usage. Billing Frequency: Monthly
Annual Cost AWWA Standard for Historical Comparison
(120 HCF ≈ 90,000 gals.)
Annual Cost Based on Local, State & Federal Data
(64.5 HCF – See Appendix C for Data & Calc.)
Water $664.92 Water $318.51 Sewer $771.24 Sewer $383.01 Combined $1,436.16 Combined $701.52
% change from 2015 0.0%
Commercial Water Rates:
Commercial Sewer Rates:
Same as residential Same as residential
Additional 2016 Data by Community
Does this Community Use Second Meters?
Does this Community Offer Senior and/or Low Income Discounts?
No No
Water System Sewer System
MWRA Charges as % of Total Community Water Expenses
No Response MWRA Charges as % of Total
Community Sewer Expenses No Response
Miles of water pipeline replaced/rehabilitated in FY16
Less than 1 Miles of sewer pipeline
replaced/rehabilitated in FY16 3-6
Water Capital Needs over Next Five Years
No Response Sewer Capital Needs over Next
Five Years No Response
Anticipated Water Capital Spending over Next Five Years
No Response Anticipated Sewer Capital
Spending over Next Five Years No Response
Stormwater
Current Funding Source of Stormwater-Related Costs:
Tax Levy (DPW Budget)
MWRA Advisory Board 2016 Water & Sewer Retail Rate Survey
Section I Page 29

Marblehead (W)
Residential Water Rates:
Residential Sewer Rates: Last adjusted:
July 2016
Last adjusted:
July 2016
Next adjustment scheduled: July 2017 Next adjustment scheduled: July 2017 Fund: Enterprise Fund: Enterprise
Administrative Charge $15.25/bill Administrative Charge $12.50/bill 0 – 30 HCF $ 4.80/HCF 0 – 30 HCF $ 8.95/HCF >30 HCF $ 6.10 " >30 HCF $ 9.30 "
Based on 100% of water usage. Billing Frequency: Quarterly
Annual Cost AWWA Standard for Historical Comparison
(120 HCF ≈ 90,000 gals.)
Annual Cost Based on Local, State & Federal Data
(88.7 HCF – See Appendix C for Data & Calc.)
Water $637.00 Water $486.76 Sewer $1,124.00 Sewer $843.87 Combined $1,761.00 Combined $1,330.63 % change from 2015 4.0%
Commercial Water Rates:
Commercial Sewer Rates:
Same as residential Same as residential
Additional 2016 Data by Community
Does this Community Use Second Meters?
Does this Community Offer Senior and/or Low Income Discounts?
No Yes
Water System Sewer System
MWRA Charges as % of Total Community Water Expenses
50-75% MWRA Charges as % of Total
Community Sewer Expenses 50-75%
Miles of water pipeline replaced/rehabilitated in FY16
Less than 1 Miles of sewer pipeline
replaced/rehabilitated in FY16 1 – 3
Water Capital Needs over Next Five Years
$0 – 10 million
Sewer Capital Needs over Next Five Years
$0 – 10 million
Anticipated Water Capital Spending over Next Five Years
$1 – 5 million
Anticipated Sewer Capital Spending over Next Five Years
$1 – 5 million
Stormwater
Current Funding Source of Stormwater-Related Costs:
Tax Levy (Drain Dept. Budget)
Marblehead is a member of the South Essex Sewerage District. Sewer deduct meters are utilized in Marblehead, reducing total sewerage bills on average by 20%.
MWRA Advisory Board 2016 Water & Sewer Retail Rate Survey
Section I Page 30

Marlborough (partial W)
Residential Water Rates:
Residential Sewer Rates: Last adjusted:
July 2016
Last adjusted:
July 2016
Next adjustment scheduled: July 2017 Next adjustment scheduled: July 2017 Fund: General Fund: General
In-City (All Units) $7.10/HCF In-City (All Units) $7.32/HCF
Out-of-City (All Units) $7.45 Out-of-City (All Units) $7.68
Based on 100% of water consumption
Billing Frequency: Residential: Quarterly | Commercial: Bi-Monthly
Annual Cost (In-City) AWWA Standard for Historical Comparison
(120 HCF ≈ 90,000 gals.)
Annual Cost (In-City) Based on Local, State & Federal Data
(53.5 HCF – See Appendix C for Data & Calc.)
Water $852.00 Water $379.85 Sewer $878.40 Sewer $391.62 Combined $1,730.40 Combined $771.47 % change from 2015 3.0%
Commercial Water Rates:
Commercial Sewer Rates:
Same as residential Same as residential
Additional 2016 Data by Community
Does this Community Use Second Meters?
Does this Community Offer Senior and/or Low Income Discounts?
No Yes
Water System Sewer System
MWRA Charges as % of Total Community Water Expenses
No Response MWRA Charges as % of Total
Community Sewer Expenses No Response
Miles of water pipeline replaced/rehabilitated in FY16
No Response Miles of sewer pipeline
replaced/rehabilitated in FY16 No Response
Water Capital Needs over Next Five Years
No Response Sewer Capital Needs over Next
Five Years No Response
Anticipated Water Capital Spending over Next Five Years
No Response Anticipated Sewer Capital
Spending over Next Five Years No Response
Stormwater
Current Funding Source of Stormwater-Related Costs:
Tax Levy (DPW Budget)
MWRA Advisory Board 2016 Water & Sewer Retail Rate Survey
Section I Page 31

Medford (W/S)
Residential Water Rates:
Residential Sewer Rates: Last adjusted:
December 2015
Last adjusted:
December 2015
Next adjustment scheduled: July 2017 Next adjustment scheduled: July 2017 Fund: Enterprise Fund: Enterprise
0 – 8 HCF 8 – 16 HCF >16 HCF
$6.07/HCF $6.49/ " $6.91/ "
0 – 8 HCF 8 – 16 HCF >16 HCF
$7.93/HCF $8.48/ " $9.03/ "
Based on 100% of water usage. Billing Frequency: Bi-monthly
Annual Cost AWWA Standard for Historical Comparison
(120 HCF ≈ 90,000 gals.)
Annual Cost Based on Local, State & Federal Data
(56.9 HCF – See Appendix C for Data & Calc.)
Water $768.72 Water $349.11 Sewer $1,004.40 Sewer $456.10 Combined $1,773.12 Combined $805.20 % change from 2015 8.4%
Commercial Water Rates:
Commercial Sewer Rates:
All Units: $6.49/HCF All Units: $8.48/HCF
Additional 2016 Data by Community
Does this Community Use Second Meters?
Does this Community Offer Senior and/or Low Income Discounts?
Yes, Senior Yes
Water System Sewer System
MWRA Charges as % of Total Community Water Expenses
50-75% MWRA Charges as % of Total
Community Sewer Expenses Over 75%
Miles of water pipeline replaced/rehabilitated in FY16
Less than 1 Miles of sewer pipeline
replaced/rehabilitated in FY16 Less than 1
Water Capital Needs over Next Five Years
$0 – 10 million
Sewer Capital Needs over Next Five Years
$0 – 10 million
Anticipated Water Capital Spending over Next Five Years
$1 – 5 million
Anticipated Sewer Capital Spending over Next Five Years
$1 – 5 million
Stormwater
Current Funding Source of Stormwater-Related Costs:
Tax Levy (Operating Budget)
Stormwater is funded through Medford’s annual operating budget and, less frequently, via special assessment. The operating budget is typically the largest source of funding.
Tax exempt properties and residential units with 5 units or more are billed at the commercial and industrial flat rate of $6.49/HCF for water and $8.48/HCF for sewer.
2nd meter (irrigation) rate is $6.31/HCF for all residential units with city irrigation meter.
MWRA Advisory Board 2016 Water & Sewer Retail Rate Survey
Section I Page 32

Melrose (W/S)
Residential Water Rates:
Residential Sewer Rates: Last adjusted:
June 2016
Last adjusted:
June 2016
Next adjustment scheduled: June 2017 Next adjustment scheduled: June 2017 Fund: Enterprise Fund: Enterprise
Base Fee (up to 1" meter) $16.60/quarter Base Fee (up to 1" meter) $ 9.37/quarter 0 – 20 HCF $ 6.34/HCF 0 – 20 HCF $11.62/HCF >20 HCF $ 8.62/ " >20 HCF $14.64/ "
Based on 100% water usage. Billing Frequency: Quarterly
Annual Cost AWWA Standard for Historical Comparison
(120 HCF ≈ 90,000 gals.)
Annual Cost Based on Local, State & Federal Data
(52.5 HCF – See Appendix C for Data & Calc.)
Water $918.40 Water $402.42 Sewer $1,377.00 Sewer $653.34 Combined $2,295.40 Combined $1,055.76 % change from 2015 11.7%
Commercial Water Rates:
Commercial Sewer Rates:
Same as residential Same as residential
Additional 2016 Data by Community
Does this Community Use Second Meters?
Does this Community Offer Senior and/or Low Income Discounts?
Yes, Senior Yes
Water System Sewer System
MWRA Charges as % of Total Community Water Expenses
25-50% MWRA Charges as % of Total
Community Sewer Expenses 50-75%
Miles of water pipeline replaced/rehabilitated in FY16
1-3 miles Miles of sewer pipeline
replaced/rehabilitated in FY16 Less than 1
Water Capital Needs over Next Five Years
$0 – 10 million
Sewer Capital Needs over Next Five Years
$0 – 10 million
Anticipated Water Capital Spending over Next Five Years
$1 – 5 million
Anticipated Sewer Capital Spending over Next Five Years
$1 – 5 million
Stormwater
Current Funding Source of Stormwater-Related Costs:
Tax Rate
MWRA Advisory Board 2016 Water & Sewer Retail Rate Survey
Section I Page 33
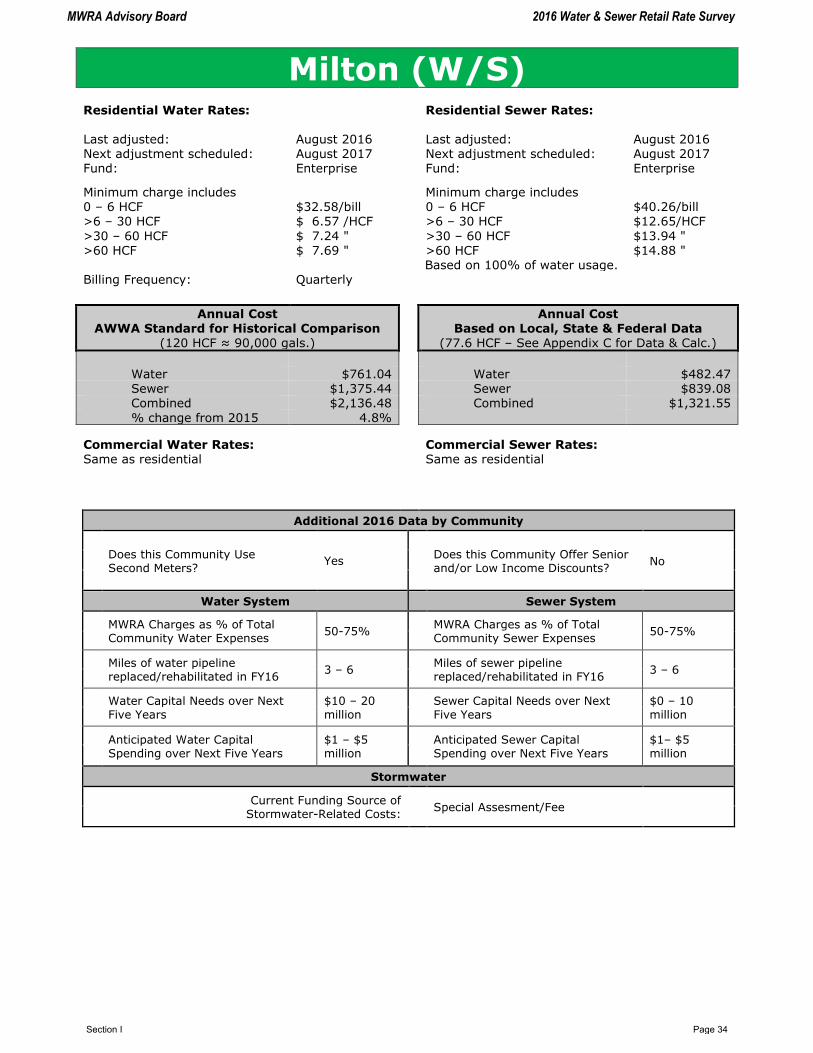
Milton (W/S)
Residential Water Rates:
Residential Sewer Rates: Last adjusted:
August 2016
Last adjusted:
August 2016
Next adjustment scheduled: August 2017 Next adjustment scheduled: August 2017 Fund: Enterprise Fund: Enterprise
Minimum charge includes 0 – 6 HCF $32.58/bill
Minimum charge includes 0 – 6 HCF $40.26/bill
>6 – 30 HCF $ 6.57 /HCF >6 – 30 HCF $12.65/HCF
>30 – 60 HCF $ 7.24 " >30 – 60 HCF $13.94 " >60 HCF $ 7.69 " >60 HCF $14.88 " Based on 100% of water usage. Billing Frequency: Quarterly
Annual Cost AWWA Standard for Historical Comparison
(120 HCF ≈ 90,000 gals.)
Annual Cost Based on Local, State & Federal Data
(77.6 HCF – See Appendix C for Data & Calc.)
Water $761.04 Water $482.47 Sewer $1,375.44 Sewer $839.08 Combined $2,136.48 Combined $1,321.55
% change from 2015 4.8%
Commercial Water Rates:
Commercial Sewer Rates:
Same as residential Same as residential
Additional 2016 Data by Community
Does this Community Use Second Meters?
Does this Community Offer Senior and/or Low Income Discounts?
No Yes
Water System Sewer System
MWRA Charges as % of Total Community Water Expenses
50-75% MWRA Charges as % of Total
Community Sewer Expenses 50-75%
Miles of water pipeline replaced/rehabilitated in FY16
3 – 6 Miles of sewer pipeline
replaced/rehabilitated in FY16 3 – 6
Water Capital Needs over Next Five Years
$10 – 20 million
Sewer Capital Needs over Next Five Years
$0 – 10 million
Anticipated Water Capital Spending over Next Five Years
$1 – $5 million
Anticipated Sewer Capital Spending over Next Five Years
$1– $5 million
Stormwater
Current Funding Source of Stormwater-Related Costs:
Special Assesment/Fee
MWRA Advisory Board 2016 Water & Sewer Retail Rate Survey
Section I Page 34

Nahant (W)
Residential Water Rates:
Residential Sewer Rates: Last adjusted:
July 2015
Last adjusted:
July 2015
Next adjustment scheduled: July 2016 Next adjustment scheduled: July 2016 Fund: Enterprise Fund: Enterprise
All units $6.95/HCF All units $8.89/HCF Based on 100% of water usage. Billing Frequency: Tri-Annually
Annual Cost
AWWA Standard for Historical Comparison (120 HCF ≈ 90,000 gals.)
Annual Cost
Based on Local, State & Federal Data (97.5 HCF – See Appendix C for Data & Calc.)
Water $834.00 Water $677.63
Sewer $1,066.80 Sewer $866.78 Combined $1,900.80 Combined $1,544.40 % change from 2015 0.0%
Commercial Water Rates:
Commercial Sewer Rates:
Same as residential Same as residential
Additional 2016 Data by Community
Does this Community Use Second Meters?
Does this Community Offer Senior and/or Low Income Discounts?
Yes, both Yes
Water System Sewer System
MWRA Charges as % of Total Community Water Expenses
25-50% MWRA Charges as % of Total
Community Sewer Expenses N/A
Miles of water pipeline replaced/rehabilitated in FY16
1 – 3 Miles of sewer pipeline
replaced/rehabilitated in FY16 1 – 3
Water Capital Needs over Next Five Years
$0 – 10 million
Sewer Capital Needs over Next Five Years
$0 – 10 million
Anticipated Water Capital Spending over Next Five Years
$100 thousand – $1 million
Anticipated Sewer Capital Spending over Next Five Years
$100 thousand – $1 million
Stormwater
Current Funding Source of Stormwater-Related Costs:
Tax Levy (DPW Budget)
Nahant receives wholesale wastewater services from the Lynn Water and Sewer Commission. Nahant utilizes the debt service exclusion as permitted under General Law 59 Section 21C(n)
MWRA Advisory Board 2016 Water & Sewer Retail Rate Survey
Section I Page 35

Residential Water Rates:
Residential Sewer Rates: Last adjusted:
July 2016
Last adjusted:
July 2016
Next adjustment scheduled: July 2017 Next adjustment scheduled: July 2017 Fund: Enterprise Fund: Enterprise
Administrative Fee $5.00/bill 0 – 10 HCF $1.71/HCF 0 – 10 HCF $ 4.73/HCF >10 – 20 HCF $2.62 " >10 – 20 HCF $ 8.43 "
>20 – 40 HCF $3.88 " >20 HCF $13.94 " >40 HCF $9.76 " Based on 100% of water usage. Billing Frequency: Quarterly
Annual Cost AWWA Standard for Historical Comparison
(120 HCF ≈ 90,000 gals.)
Annual Cost Based on Local, State & Federal Data
(76.3 HCF – See Appendix C for Data & Calc.)
Water $348.40 Water $183.51 Sewer $1,084.00 Sewer $495.21 Combined $1,432.40 Combined $678.72
% change from 2015 3.8%
Commercial Water Rates:
Commercial Sewer Rates:
Same as residential Same as residential
Additional 2016 Data by Community
Does this Community Use Second Meters?
Does this Community Offer Senior and/or Low Income Discounts?
Yes, Senior Yes
Water System Sewer System
MWRA Charges as % of Total Community Water Expenses
No Response MWRA Charges as % of Total
Community Sewer Expenses No Response
Miles of water pipeline replaced/rehabilitated in FY16
No Response Miles of sewer pipeline
replaced/rehabilitated in FY16 No Response
Water Capital Needs over Next Five Years
No Response Sewer Capital Needs over Next
Five Years No Response
Anticipated Water Capital Spending over Next Five Years
No Response Anticipated Sewer Capital
Spending over Next Five Years No Response
Stormwater
Current Funding Source of Stormwater-Related Costs:
Tax Levy (DPW Budget)
MWRA Advisory Board 2016 Water & Sewer Retail Rate Survey
Section I Page 36

Needham (S/partial W)
Residential Water Rates:
Residential Sewer Rates: Last adjusted:
July 2016
Last adjusted:
July 2016
Next adjustment scheduled: No response Next adjustment scheduled: No response Fund: Enterprise Fund: Enterprise
Basic Service Fee: $15.00 Basic Service Fee: $ 9.00 0 – 6 HCF $ 3.10/HCF 0 – 6 HCF $ 8.60/HCF >6 – 27 HCF $ 3.40 " >6 – 27 HCF $ 8.99 "
>27 – 42 HCF $ 4.30 " >27 – 42 HCF $ 9.99 " >42 HCF $ 5.10 " >42 HCF $10.99 " Based on 100% of water usage.
Billing Frequency: Residential – Quarterly, Commercial - Monthly
Annual Cost
AWWA Standard for Historical Comparison (120 HCF ≈ 90,000 gals.)
Annual Cost
Based on Local, State & Federal Data (91.9 HCF – See Appendix C for Data & Calc.)
Water $471.60 Water $365.26 Sewer $1,158.60 Sewer $884.06
Combined $1,630.20 Combined $1,249.32 % change from 2015 2.8%
Commercial Water Rates:
Commercial Sewer Rates:
Same as residential Same as residential
Additional 2016 Data by Community
Does this Community Use Second Meters?
Does this Community Offer Senior and/or Low Income Discounts?
Yes, Senior Yes
Water System Sewer System
MWRA Charges as % of Total Community Water Expenses
25-50% MWRA Charges as % of Total
Community Sewer Expenses 25-50%
Miles of water pipeline replaced/rehabilitated in FY16
1 – 3 Miles of sewer pipeline
replaced/rehabilitated in FY16 1 – 3
Water Capital Needs over Next Five Years
$10 – 20 million
Sewer Capital Needs over Next Five Years
$10 – 20 million
Anticipated Water Capital Spending over Next Five Years
Over $10 million
Anticipated Sewer Capital Spending over Next Five Years
$5 - $10 million
Stormwater
Current Funding Source of Stormwater-Related Costs:
Tax Levy (DPW Budget)
MWRA Advisory Board 2016 Water & Sewer Retail Rate Survey
Section I Page 37

Newton (W/S)
Residential Water Rates:
Residential Sewer Rates: Last adjusted:
July 2016
Last adjusted:
July 2016
Next adjustment scheduled: July 2017 Next adjustment scheduled: July 2017 Fund: Enterprise Fund: Enterprise
0 – 10 HCF $ 6.45/HCF 0 – 10 HCF $ 9.25/HCF >10 – 25 HCF $ 7.40 " >10 – 25 HCF $10.95 " >25 – 60 HCF $ 8.50 " >25 – 60 HCF $11.75 "
>60 HCF $10.60 " >60 HCF $13.50 " Based on 100% of water usage. Billing Frequency: Quarterly
Annual Cost AWWA Standard for Historical Comparison
(120 HCF ≈ 90,000 gals.)
Annual Cost Based on Local, State & Federal Data
(64.0 HCF – See Appendix C for Data & Calc.)
Water $872.00 Water $435.60 Sewer $1,270.00 Sewer $640.80 Combined $2,142.00 Combined $1,076.40 % change from 2015 6.6%
Commercial Water Rates:
Commercial Sewer Rates:
Same as residential Same as residential
Additional 2016 Data by Community
Does this Community Use Second Meters?
Does this Community Offer Senior and/or Low Income Discounts?
Yes, Senior Yes
Water System Sewer System
MWRA Charges as % of Total Community Water Expenses
50-75% MWRA Charges as % of Total
Community Sewer Expenses 50-75%
Miles of water pipeline replaced/rehabilitated in FY16
3 – 6 Miles of sewer pipeline
replaced/rehabilitated in FY16 Over 6
Water Capital Needs over Next Five Years
$10 – 20 million
Sewer Capital Needs over Next Five Years
$10 – 20 million
Anticipated Water Capital Spending over Next Five Years
Over $10 million
Anticipated Sewer Capital Spending over Next Five Years
Over $10 million
Stormwater
Current Funding Source of Stormwater-Related Costs:
Special Assessment/Fee
Newton is 1 of 3 MWRA communities that has established a special assessment to fund stormwater-related costs. The stormwater fee is $18.75 per quarter; $75 per year. For more information, see Appendix G.
MWRA Advisory Board 2016 Water & Sewer Retail Rate Survey
Section I Page 38
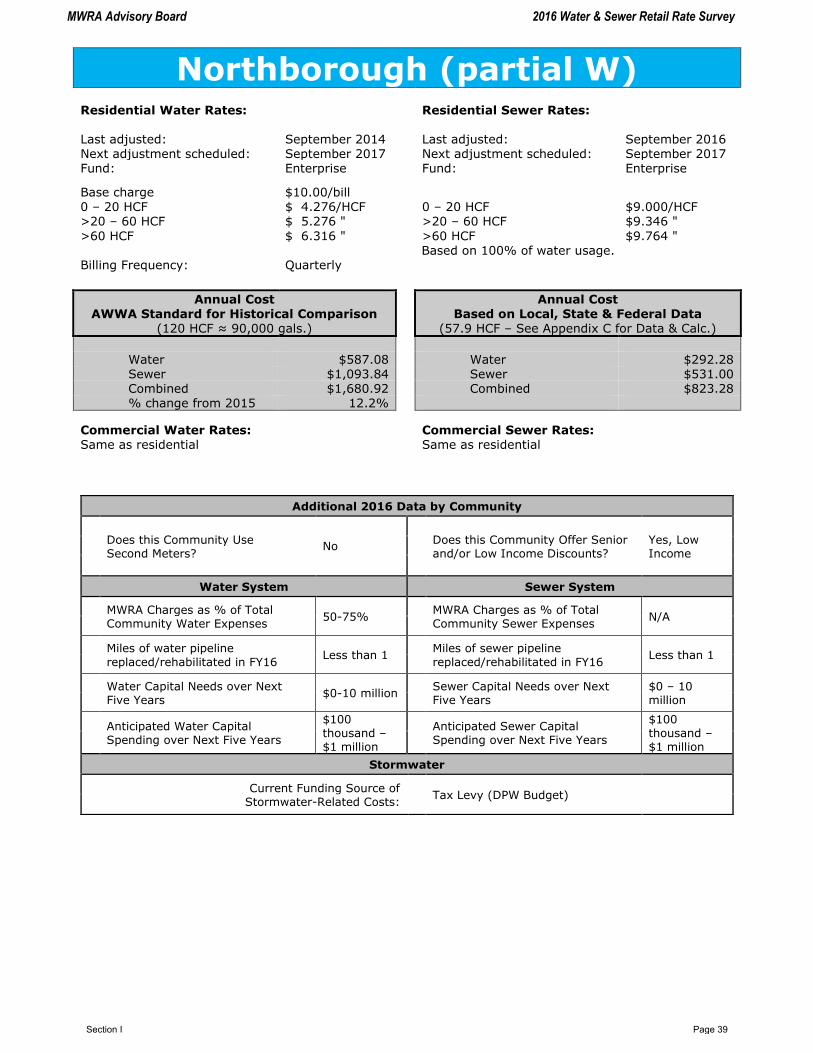
Northborough (partial W)
Residential Water Rates:
Residential Sewer Rates: Last adjusted:
September 2014
Last adjusted:
September 2016
Next adjustment scheduled: September 2017 Next adjustment scheduled: September 2017 Fund: Enterprise Fund: Enterprise
Base charge $10.00/bill 0 – 20 HCF $ 4.276/HCF 0 – 20 HCF $9.000/HCF >20 – 60 HCF $ 5.276 " >20 – 60 HCF $9.346 "
>60 HCF $ 6.316 " >60 HCF $9.764 " Based on 100% of water usage. Billing Frequency: Quarterly
Annual Cost AWWA Standard for Historical Comparison
(120 HCF ≈ 90,000 gals.)
Annual Cost Based on Local, State & Federal Data
(57.9 HCF – See Appendix C for Data & Calc.)
Water $587.08 Water $292.28 Sewer $1,093.84 Sewer $531.00 Combined $1,680.92 Combined $823.28 % change from 2015 12.2%
Commercial Water Rates:
Commercial Sewer Rates:
Same as residential Same as residential
Additional 2016 Data by Community
Does this Community Use Second Meters?
Does this Community Offer Senior and/or Low Income Discounts?
Yes, Low Income No
Water System Sewer System
MWRA Charges as % of Total Community Water Expenses
50-75% MWRA Charges as % of Total
Community Sewer Expenses N/A
Miles of water pipeline
replaced/rehabilitated in FY16 Less than 1
Miles of sewer pipeline
replaced/rehabilitated in FY16 Less than 1
Water Capital Needs over Next Five Years
$0-10 million Sewer Capital Needs over Next
Five Years $0 – 10 million
Anticipated Water Capital Spending over Next Five Years
$100 thousand – $1 million
Anticipated Sewer Capital Spending over Next Five Years
$100 thousand – $1 million
Stormwater
Current Funding Source of Stormwater-Related Costs:
Tax Levy (DPW Budget)
MWRA Advisory Board 2016 Water & Sewer Retail Rate Survey
Section I Page 39

Norwood (W/S)
Residential Water Rates:
Residential Sewer Rates: Last adjusted:
June 2016
Last adjusted:
June 2016
Next adjustment scheduled: June 2017 Next adjustment scheduled: June 2017 Fund: General Fund: General
Meter charge (5/8") $2.69/month 0 – 5 HCF $3.87/HCF 0 – 3 HCF $ 7.95/HCF >5 HCF $5.72 " >3 HCF $15.35 "
Based on 60% of water usage.
Billing Frequency: Monthly
Annual Cost AWWA Standard for Historical Comparison
(120 HCF ≈ 90,000 gals.)
Annual Cost Based on Local, State & Federal Data
(63.8 HCF – See Appendix C for Data & Calc.)
Water $607.68 Water $286.17 Sewer $838.80 Sewer $344.41 Combined $1,446.48 Combined $630.58
% change from 2015 1.2%
Commercial Water Rates:
Commercial Sewer Rates:
Same as residential Same as residential
Additional 2016 Data by Community
Does this Community Use Second Meters?
Does this Community Offer Senior and/or Low Income Discounts?
No Yes
Water System Sewer System
MWRA Charges as % of Total Community Water Expenses
Over 75% MWRA Charges as % of Total
Community Sewer Expenses Over 75%
Miles of water pipeline replaced/rehabilitated in FY16
No Response Miles of sewer pipeline
replaced/rehabilitated in FY16 No Response
Water Capital Needs over Next Five Years
$0 - 10 million
Sewer Capital Needs over Next Five Years
$0 – 10 million
Anticipated Water Capital
Spending over Next Five Years
$100 thousand –
$1 million
Anticipated Sewer Capital
Spending over Next Five Years
$1 – 5
million
Stormwater
Current Funding Source of Stormwater-Related Costs:
Tax Levy (DPW Budget)
MWRA Advisory Board 2016 Water & Sewer Retail Rate Survey
Section I Page 40

Peabody (partial W)
Residential Water Rates:
Residential Sewer Rates: Last adjusted:
March 2003
Last adjusted:
March 2003
Next adjustment scheduled: No response Next adjustment scheduled: No response Fund: General Fund: General
Minimum Charge: $5.00/Quarter 0 – 15 HCF $2.44/HCF 0 – 15 HCF $3.25/HCF >15 – 30 HCF $2.66 " >15 HCF $3.58 "
>30 HCF $2.90 " Based on 100% of water usage. Billing Frequency: Quarterly
Annual Cost AWWA Standard for Historical Comparison
(120 HCF ≈ 90,000 gals.)
Annual Cost Based on Local, State & Federal Data
(67.1 HCF – See Appendix C for Data & Calc.)
Water $306.00 Water $165.29 Sewer $409.80 Sewer $220.42 Combined $715.80 Combined $385.70 % change from 2015 0.0%
Commercial Water Rates:
Commercial Sewer Rates:
0 – 15 HCF $2.90/HCF >15 – 150 HCF $3.16 "
>150 HCF $3.44 "
0 – 15 HCF $3.75/HCF >15 HCF $4.13 "
Additional 2016 Data by Community
Does this Community Use Second Meters?
Does this Community Offer Senior and/or Low Income Discounts?
No Yes
Water System Sewer System
MWRA Charges as % of Total Community Water Expenses
No Response MWRA Charges as % of Total
Community Sewer Expenses N/A
Miles of water pipeline
replaced/rehabilitated in FY16 No Response
Miles of sewer pipeline
replaced/rehabilitated in FY16 1 – 3
Water Capital Needs over Next Five Years
$0 – 10 million
Sewer Capital Needs over Next Five Years
$0 – 10 million
Anticipated Water Capital Spending over Next Five Years
$5 - 10 million
Anticipated Sewer Capital Spending over Next Five Years
$5 – 10 million
Stormwater
Current Funding Source of Stormwater-Related Costs:
Water/Sewer Rates
Peabody receives wholesale wastewater service from the South Essex Sewerage District.
MWRA Advisory Board 2016 Water & Sewer Retail Rate Survey
Section I Page 41

Quincy (W/S)
Residential Water Rates:
Residential Sewer Rates: Last adjusted:
July 2016
Last adjusted:
July 2016
Next adjustment scheduled: July 2017 Next adjustment scheduled: July 2017 Fund: Enterprise Fund: Enterprise
All units $6.29/HCF All units $13.69/HCF Based on 70% of water usage. Billing Frequency: Monthly
Annual Cost
AWWA Standard for Historical Comparison (120 HCF ≈ 90,000 gals.)
Annual Cost
Based on Local, State & Federal Data (49.0 HCF – See Appendix C for Data & Calc.)
Water $754.80 Water $307.96
Sewer $1,149.96 Sewer $469.53 Combined $1,904.76 Combined $777.49 % change from 2015 5.8%
Commercial Water Rates:
Commercial Sewer Rates:
Same as residential Same as residential
Additional 2016 Data by Community
Does this Community Use Second Meters?
Does this Community Offer Senior and/or Low Income Discounts?
Yes, Low Income Yes
Water System Sewer System
MWRA Charges as % of Total Community Water Expenses
50-75% MWRA Charges as % of Total
Community Sewer Expenses Over 75%
Miles of water pipeline replaced/rehabilitated in FY16
3 – 6 Miles of sewer pipeline
replaced/rehabilitated in FY16 3 – 6
Water Capital Needs over Next Five Years
$10 – 20 million
Sewer Capital Needs over Next Five Years
$10 – 20 million
Anticipated Water Capital Spending over Next Five Years
$5 – 10 million
Anticipated Sewer Capital Spending over Next Five Years
$5 – 10 million
Stormwater
Current Funding Source of Stormwater-Related Costs:
Tax Levy (DPW Budget)
MWRA Advisory Board 2016 Water & Sewer Retail Rate Survey
Section I Page 42

Residential Water Rates:
Residential Sewer Rates: Last adjusted:
July 2016
Last adjusted:
July 2016
Next adjustment scheduled: July 2017 Next adjustment scheduled: July 2017 Fund: Enterprise Fund: Enterprise
Base charge: $25.00/bill Base charge: $12.50/bill 0 – 25 HCF $ 4.05/HCF 0 – 25 HCF $ 6.70/HCF >25 HCF $ 5.14/HCF >25 HCF $11.52 "
Based on 100% of water usage. Billing Frequency: Quarterly
Annual Cost AWWA Standard for Historical Comparison
(120 HCF ≈ 90,000 gals.)
Annual Cost Based on Local, State & Federal Data
(69.3 HCF – See Appendix C for Data & Calc.)
Water $607.80 Water $389.58 Sewer $950.40 Sewer $529.05 Combined $1,558.20 Combined $918.63 % change from 2015 2.8%
Commercial Water Rates: Commercial Sewer
Rates:
Same as residential Same as residential
Additional 2016 Data by Community
Does this Community Use
Second Meters?
Does this Community Offer Senior
and/or Low Income Discounts? Yes, Senior No
Water System Sewer System
MWRA Charges as % of Total Community Water Expenses
0-25% MWRA Charges as % of Total
Community Sewer Expenses Over 75%
Miles of water pipeline replaced/rehabilitated in FY16
1 – 3 Miles of sewer pipeline
replaced/rehabilitated in FY16 Less than 1
Water Capital Needs over Next Five Years
$20 – 50 million
Sewer Capital Needs over Next Five Years
$0 – 10 million
Anticipated Water Capital Spending over Next Five Years
Over $10 million
Anticipated Sewer Capital Spending over Next Five Years
$1 – 5 million
Stormwater
Current Funding Source of Stormwater-Related Costs:
Tax Levy (DPW Budget)
MWRA Advisory Board 2016 Water & Sewer Retail Rate Survey
Section I Page 43

Reading (W/S)
Residential Water Rates:
Residential Sewer Rates: Last adjusted:
August 2016
Last adjusted:
August 2016
Next adjustment scheduled: No response Next adjustment scheduled: No response Fund: Enterprise Fund: Enterprise
Minimum bill: $17.66 Minimum bill: $19.52 All units $ 9.64/HCF All units $ 9.88/HCF Based on 100% of water usage.
Billing Frequency: Quarterly
Annual Cost AWWA Standard for Historical Comparison
(120 HCF ≈ 90,000 gals.)
Annual Cost Based on Local, State & Federal Data
(61.1 HCF – See Appendix C for Data & Calc.)
Water $1,156.80 Water $589.00 Sewer $1,185.60 Sewer $603.67 Combined $2,342.40 Combined $1,192.67 % change from 2015 5.0%
Commercial Water Rates:
Commercial Sewer Rates:
Same as residential Same as residential
Senior and/or Low Income Discounts: None
Additional 2016 Data by Community
Does this Community Use Second Meters?
Does this Community Offer Senior and/or Low Income Discounts?
No No
Water System Sewer System
MWRA Charges as % of Total Community Water Expenses
25-50% MWRA Charges as % of Total
Community Sewer Expenses Over 75%
Miles of water pipeline replaced/rehabilitated in FY16
1 – 3 Miles of sewer pipeline
replaced/rehabilitated in FY16 Less than 1
Water Capital Needs over Next Five Years
$10 – 20 million
Sewer Capital Needs over Next Five Years
$0 – 10 million
Anticipated Water Capital Spending over Next Five Years
$5 – 10 million
Anticipated Sewer Capital Spending over Next Five Years
$100 thousand – $5 million
Stormwater
Current Funding Source of
Stormwater-Related Costs:
Special Assessment
Reading’s rates appear to decrease due to the removal of the prompt payment discount, which has now been built into the rates.
Reading is 1 of 3 MWRA communities that has established a special assessment to fund stormwater-related costs. The stormwater fee is $10 per quarter; $40 per year. For more information, see Appendix G.
MWRA Advisory Board 2016 Water & Sewer Retail Rate Survey
Section I Page 44

Revere (W/S)
Residential Water Rates:
Residential Sewer Rates: Last adjusted:
July 2016
Last adjusted:
July 2016
Next adjustment scheduled: July 2017 Next adjustment scheduled: July 2017 Fund: Enterprise Fund: Enterprise
All units $3.75/HCF All units $12.40/HCF Based on 100% of water usage.
Billing Frequency: Residential: Quarterly Commercial: Monthly
Annual Cost AWWA Standard for Historical Comparison
(120 HCF ≈ 90,000 gals.)
Annual Cost Based on Local, State & Federal Data
(51.7 HCF – See Appendix C for Data & Calc.)
Water $450.00 Water $193.88 Sewer $1,489.20 Sewer $641.60 Combined $1,939.20 Combined $835.47 % change from 2015 1.5%
Commercial Water Rates:
Commercial Sewer Rates:
All units:
$5.93/HCF
All units: $18.55/HCF
Additional 2016 Data by Community
Does this Community Use Second Meters?
Does this Community Offer Senior and/or Low Income Discounts?
Yes, Senior Yes
Water System Sewer System
MWRA Charges as % of Total Community Water Expenses
0-25% MWRA Charges as % of Total
Community Sewer Expenses 25-50%
Miles of water pipeline replaced/rehabilitated in FY16
3 – 6 Miles of sewer pipeline
replaced/rehabilitated in FY16 Over 6
Water Capital Needs over Next
Five Years
$10 – 20
million
Sewer Capital Needs over Next
Five Years
$20 – 50
million
Anticipated Water Capital Spending over Next Five Years
$5 – 10 million
Anticipated Sewer Capital Spending over Next Five Years
Over $10 million
Stormwater
Current Funding Source of Stormwater-Related Costs:
Tax Levy (DPW Budget)
MWRA Advisory Board 2016 Water & Sewer Retail Rate Survey
Section I Page 45

Saugus (W)
Residential Water Rates:
Residential Sewer Rates: Last adjusted:
July 2016
Last adjusted:
July 2016
Next adjustment scheduled: Unknown Next adjustment scheduled: Unknown Fund: Enterprise Fund: Enterprise
Minimum Charge (20 HCF) $86.51 Minimum Charge (20 HCF) $66.44 >20 – 30 HCF $ 4.61/HCF >20 – 30 HCF $ 2.44/HCF >30 – 60 HCF $ 6.16 " >30 – 60 HCF $ 3.32 "
>60 – 100 HCF $ 7.71 " >60 – 100 HCF $ 4.65 " >100 – 200 HCF $ 8.60 " >100 – 200 HCF $ 5.76 " >200 – 500 HCF $ 9.64 " >200 – 500 HCF $ 6.87 " >500 – 1,000 HCF $10.38 " >500 – 1,000 HCF $ 7.64 " >1,000 HCF $10.68 " >1,000 HCF $ 7.98 " Based on 100% of water usage. Billing Frequency: Semi-Annually
Annual Cost
AWWA Standard for Historical Comparison (120 HCF ≈ 90,000 gals.)
Annual Cost
Based on Local, State & Federal Data (84.1 HCF – See Appendix C for Data & Calc.)
Water $634.82 Water $413.68 Sewer $380.88 Sewer $261.69 Combined $1,015.70 Combined $675.37 % change from 2015 8.7%
Commercial Water Rates:
Commercial Sewer Rates:
Same as residential Same as residential
Additional 2016 Data by Community
Does this Community Use Second Meters?
Does this Community Offer Senior and/or Low Income Discounts?
No Yes
Water System Sewer System
MWRA Charges as % of Total
Community Water Expenses No Response
MWRA Charges as % of Total
Community Sewer Expenses N/A
Miles of water pipeline replaced/rehabilitated in FY16
No Response Miles of sewer pipeline
replaced/rehabilitated in FY16 No Response
Water Capital Needs over Next Five Years
No Response Sewer Capital Needs over Next
Five Years No Response
Anticipated Water Capital Spending over Next Five Years
No Response Anticipated Sewer Capital
Spending over Next Five Years No Response
Stormwater
Current Funding Source of Stormwater-Related Costs:
Tax Levy (DPW Budget)
MWRA Advisory Board 2016 Water & Sewer Retail Rate Survey
Section I Page 46

Somerville (W/S)
Residential Water Rates:
Residential Sewer Rates: Last adjusted:
July 2016
Last adjusted:
July 2016
Next adjustment scheduled: July 2017 Next adjustment scheduled: July 2017 Fund: Enterprise Fund: Enterprise
Base charge:
$40.00/bill
0 – 13 HCF $4.14/HCF 0 – 13 HCF $ 7.43/HCF
>13 – 67 HCF $5.97 " >13 – 67 HCF $ 9.49 " >67 – 133 HCF $6.26 " >67 – 133 HCF $ 9.95 " >133 HCF $6.50 " >133 HCF $10.30 " Based on 100% of water usage.
Billing Frequency: Residential: Tri-Annually Commercial: Bi-Monthly
Annual Cost AWWA Standard for Historical Comparison
(120 HCF ≈ 90,000 gals.)
Annual Cost Based Local, State & Federal Data
(50.0 HCF – See Appendix C for Data & Calc.)
Water $645.03 Water $225.94
Sewer $1,178.46 Sewer $512.26 Combined $1,823.49 Combined $738.20 % change from 2015 10.3%
Commercial Water Rates:
Commercial Sewer Rates:
Same as residential Same as residential
Additional 2016 Data by Community
Does this Community Use Second Meters?
Does this Community Offer Senior and/or Low Income Discounts?
No No
Water System Sewer System
MWRA Charges as % of Total Community Water Expenses
50-75% MWRA Charges as % of Total
Community Sewer Expenses Over 75%
Miles of water pipeline replaced/rehabilitated in FY16
1 – 3 Miles of sewer pipeline
replaced/rehabilitated in FY16 Less than 1
Water Capital Needs over Next Five Years
$10 – 20 million
Sewer Capital Needs over Next Five Years
$10 – 20 million
Anticipated Water Capital Spending over Next Five Years
Over $10 million
Anticipated Sewer Capital Spending over Next Five Years
Over $10 million
Stormwater
Current Funding Source of Stormwater-Related Costs:
Water/Sewer Rates
MWRA Advisory Board 2016 Water & Sewer Retail Rate Survey
Section I Page 47

South Hadley (partial W)
Residential Water Rates:
Residential Sewer Rates: Last adjusted:
June 2015
Last adjusted:
Not applicable
Next adjustment scheduled: Unknown Next adjustment scheduled: Not applicable Fund: Enterprise Fund: Not applicable
Base charge $5.00/family unit Community not sewered. All units $3.77/HCF
Billing Frequency: Quarterly
Annual Cost AWWA Standard for Historical Comparison
(120 HCF ≈ 90,000 gals.)
Annual Cost Based on Local, State & Federal Data
(64.2 HCF – See Appendix C for Data & Calc.)
Water $472.40 Water $262.03 Sewer Not Sewered Sewer Not Sewered Combined $472.40 Combined $262.03 % change from 2015 0.0%
Commercial Water Rates:
Commercial Sewer Rates:
Same as residential Same as residential
Additional 2016 Data by Community
Does this Community Use Second Meters?
Does this Community Offer Senior and/or Low Income Discounts?
No No
Water System Sewer System
MWRA Charges as % of Total Community Water Expenses
25-50% MWRA Charges as % of Total
Community Sewer Expenses N/A
Miles of water pipeline replaced/rehabilitated in FY16
Less than 1 Miles of sewer pipeline
replaced/rehabilitated in FY16 N/A
Water Capital Needs over Next Five Years
$0 – 10 million
Sewer Capital Needs over Next Five Years
N/A
Anticipated Water Capital Spending over Next Five Years
$100 thousand – $1 million
Anticipated Sewer Capital Spending over Next Five Years
N/A
Stormwater
Current Funding Source of Stormwater-Related Costs:
N/A
MWRA Advisory Board 2016 Water & Sewer Retail Rate Survey
Section I Page 48

Southborough (W)
Residential Water Rates:
Residential Sewer Rates: Last adjusted:
September 2016
Last adjusted:
n/a
Next adjustment scheduled: Unknown Next adjustment scheduled: n/a Fund: Special Revenue Fund: n/a
Minimum charge (⅝" meter) includes first 10 HCF
$29.37 Community not sewered.
>10 – 20 HCF $ 3.73/HCF
>20 – 35 HCF $ 4.26 " >35 – 80 HCF $ 5.33 " >80 HCF $ 6.40 " Billing Frequency: Quarterly
Annual Cost AWWA Standard for Historical Comparison
(120 HCF ≈ 90,000 gals.)
Annual Cost Based on Local, State & Federal Data
(107.3 HCF – See Appendix C for Data & Calc.)
Water $437.08 Water $382.98 Sewer Not Sewered Sewer Not Sewered Combined $437.08 Combined $382.98
% change from 2015 2.3%
Commercial Water Rates:
Commercial Sewer Rates:
Same as residential Not sewered
Additional 2016 Data by Community
Does this Community Use Second Meters?
Does this Community Offer Senior and/or Low Income Discounts?
Yes, Senior No
Water System Sewer System
MWRA Charges as % of Total Community Water Expenses
50 – 70% MWRA Charges as % of Total
Community Sewer Expenses N/A
Miles of water pipeline replaced/rehabilitated in FY16
1 - 3 Miles of sewer pipeline
replaced/rehabilitated in FY16 N/A
Water Capital Needs over Next Five Years
$0 – 10 million
Sewer Capital Needs over Next Five Years
N/A
Anticipated Water Capital Spending over Next Five Years
$1 million - $5 million
Anticipated Sewer Capital Spending over Next Five Years
N/A
Stormwater
Current Funding Source of Stormwater-Related Costs:
Tax Levy (DPW Budget)
MWRA Advisory Board 2016 Water & Sewer Retail Rate Survey
Section I Page 49

Stoneham (W/S)
Residential Water Rates:
Residential Sewer Rates: Last adjusted:
July 2016
Last adjusted:
July 2016
Next adjustment scheduled: July 2017 Next adjustment scheduled: July 2017 Fund: Enterprise Fund: Enterprise
All units $5.75/HCF All units $9.05/HCF Based on 100% of water usage. Billing Frequency: Quarterly
Annual Cost
AWWA Standard for Historical Comparison (120 HCF ≈ 90,000 gals.)
Annual Cost
Based on Local, State & Federal Data (72.7 HCF – See Appendix C for Data & Calc.)
Water $690.00 Water $418.03
Sewer $1,086.00 Sewer $657.94 Combined $1,776.00 Combined $1,075.96 % change from 2015 -1.7%
Commercial Water Rates:
Commercial Sewer Rates:
Same as residential Same as residential
Additional 2016 Data by Community
Does this Community Use Second Meters?
Does this Community Offer Senior and/or Low Income Discounts?
Yes, Senior Yes
Water System Sewer System
MWRA Charges as % of Total Community Water Expenses
50-75% MWRA Charges as % of Total
Community Sewer Expenses 50-75%
Miles of water pipeline replaced/rehabilitated in FY16
Less than 1 Miles of sewer pipeline
replaced/rehabilitated in FY16 3 – 6
Water Capital Needs over Next Five Years
$0 – 10 million
Sewer Capital Needs over Next Five Years
$0 – 10 million
Anticipated Water Capital Spending over Next Five Years
$1 – 5 million
Anticipated Sewer Capital Spending over Next Five Years
$1 – 5 million
Stormwater
Current Funding Source of Stormwater-Related Costs:
Tax Levy (DPW Budget)
MWRA Advisory Board 2016 Water & Sewer Retail Rate Survey
Section I Page 50
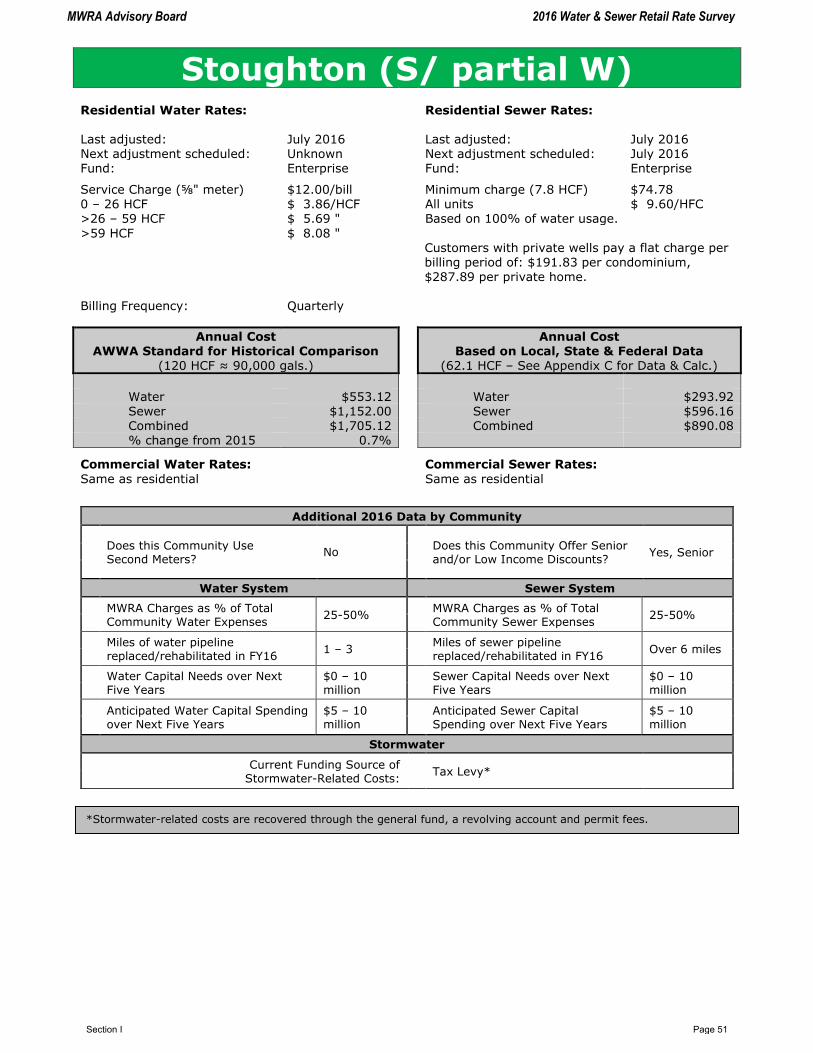
Stoughton (S/ partial W)
Residential Water Rates:
Residential Sewer Rates: Last adjusted:
July 2016
Last adjusted:
July 2016
Next adjustment scheduled: Unknown Next adjustment scheduled: July 2016 Fund: Enterprise Fund: Enterprise
Service Charge (⅝" meter) $12.00/bill Minimum charge (7.8 HCF) $74.78 0 – 26 HCF $ 3.86/HCF All units $ 9.60/HFC >26 – 59 HCF $ 5.69 " Based on 100% of water usage.
>59 HCF $ 8.08 " Customers with private wells pay a flat charge per
billing period of: $191.83 per condominium, $287.89 per private home.
Billing Frequency: Quarterly
Annual Cost AWWA Standard for Historical Comparison
(120 HCF ≈ 90,000 gals.)
Annual Cost Based on Local, State & Federal Data
(62.1 HCF – See Appendix C for Data & Calc.)
Water $553.12 Water $293.92 Sewer $1,152.00 Sewer $596.16 Combined $1,705.12 Combined $890.08 % change from 2015 0.7%
Commercial Water Rates:
Commercial Sewer Rates:
Same as residential Same as residential
Additional 2016 Data by Community
Does this Community Use Second Meters?
Does this Community Offer Senior and/or Low Income Discounts?
Yes, Senior No
Water System Sewer System
MWRA Charges as % of Total Community Water Expenses
25-50% MWRA Charges as % of Total
Community Sewer Expenses 25-50%
Miles of water pipeline replaced/rehabilitated in FY16
1 – 3 Miles of sewer pipeline
replaced/rehabilitated in FY16 Over 6 miles
Water Capital Needs over Next Five Years
$0 – 10 million
Sewer Capital Needs over Next Five Years
$0 – 10 million
Anticipated Water Capital Spending over Next Five Years
$5 – 10 million
Anticipated Sewer Capital Spending over Next Five Years
$5 – 10 million
Stormwater
Current Funding Source of Stormwater-Related Costs:
Tax Levy*
*Stormwater-related costs are recovered through the general fund, a revolving account and permit fees.
MWRA Advisory Board 2016 Water & Sewer Retail Rate Survey
Section I Page 51

Swampscott (W)
Residential Water Rates:
Residential Sewer Rates: Last adjusted:
July 2016
Last adjusted:
July 2016
Next adjustment scheduled: Unknown Next adjustment scheduled: Unknown Fund: Enterprise Fund: Enterprise
Base Charge $11.00/bill Base Charge $8.75/bill All units $ 6.70/HFC All units $5.20/HFC Based on 100% of water usage.
Billing Frequency: Quarterly
Annual Cost AWWA Standard for Historical Comparison
(120 HCF ≈ 90,000 gals.)
Annual Cost Based on Local, State & Federal Data
(89.4 HCF – See Appendix C for Data & Calc.)
Water $848.00 Water $642.98 Sewer $659.00 Sewer $499.88 Combined $1,507.00 Combined $1,142.86 % change from 2015 2.0%
Commercial Water Rates:
Commercial Sewer Rates:
Same as residential Same as residential
Additional 2016 Data by Community
Does this Community Use Second Meters?
Does this Community Offer Senior and/or Low Income Discounts?
No Yes
Water System Sewer System
MWRA Charges as % of Total Community Water Expenses
50-75% MWRA Charges as % of Total
Community Sewer Expenses N/A
Miles of water pipeline replaced/rehabilitated in FY16
1 – 3 Miles of sewer pipeline
replaced/rehabilitated in FY16 Less than 1
Water Capital Needs over Next
Five Years
$0 – 10
million
Sewer Capital Needs over Next
Five Years
$10 – 20
million
Anticipated Water Capital Spending over Next Five Years
$1 – 5 million
Anticipated Sewer Capital Spending over Next Five Years
$5 – 10 million
Stormwater
Current Funding Source of Stormwater-Related Costs:
Tax Levy (DPW Budget)
MWRA Advisory Board 2016 Water & Sewer Retail Rate Survey
Section I Page 52

Wakefield (S/ partial W)
Residential Water Rates:
Residential Sewer Rates: Last adjusted:
June 2016
Last adjusted:
June 2016
Next adjustment scheduled: June 2017 Next adjustment scheduled: June 2017 Fund: Enterprise Fund: Enterprise
All units $6.15/HCF All units $10.55/HCF Based on 100% of water usage.
Billing Frequency: Quarterly
Annual Cost AWWA Standard for Historical Comparison
(120 HCF ≈ 90,000 gals.)
Annual Cost Based on Local, State & Federal Data
(79.5 HCF – See Appendix C for Data & Calc.)
Water $664.20 Water $440.03
Sewer $1,139.40 Sewer $754.85 Combined $1,803.60 Combined $1,194.89
% change from 2015 3.7%
Commercial Water Rates:
Commercial Sewer Rates:
Same as residential Same as residential
Additional 2016 Data by Community
Does this Community Use Second Meters?
Does this Community Offer Senior and/or Low Income Discounts?
No
Yes, grandfathered
only
Water System Sewer System
MWRA Charges as % of Total Community Water Expenses
25-50% MWRA Charges as % of Total
Community Sewer Expenses Over 75%
Miles of water pipeline replaced/rehabilitated in FY16
Less than 1 Miles of sewer pipeline
replaced/rehabilitated in FY16 Less than 1
Water Capital Needs over Next
Five Years
$10 – 20
million
Sewer Capital Needs over Next
Five Years
$10 – 20
million
Anticipated Water Capital Spending over Next Five Years
$100 thousand – $1 million
Anticipated Sewer Capital Spending over Next Five Years
$1 – 5 million
Stormwater
Current Funding Source of Stormwater-Related Costs:
Tax Levy (DPW Budget)
The rates calculated above include a 10% discount for all bills paid within 30 days of the bill date. The Town of Wakefield estimates that 95% of the customer base takes advantage of the discount. Without this discount, the annual cost for 120 HCF would be $678.00 for water and $1,254.00 for sewer.
Wakefield has a moratorium on second meters; units in place before the moratorium are allowed second meters.
MWRA Advisory Board 2016 Water & Sewer Retail Rate Survey
Section I Page 53

Residential Water Rates:
Residential Sewer Rates: Last adjusted:
July 2016
Last adjusted:
July 2016
Next adjustment scheduled: July 2017 Next adjustment scheduled: July 2017 Fund: Enterprise Fund: Enterprise
All units $5.710/HCF All units $8.506/HCF
Based on 80% of water usage.
Billing Frequency: Residential: Bi-Monthly Commercial: Monthly
Annual Cost
AWWA Standard for Historical Comparison (120 HCF ≈ 90,000 gals.)
Annual Cost
Based on Local, State & Federal Data (88.8 HCF – See Appendix C for Data & Calc.)
Water $685.20 Water $507.05 Sewer $816.58 Sewer $604.27 Combined $1,501.78 Combined $1,111.31 % change from 2015 3.5%
Commercial Water Rates:
Commercial Sewer Rates:
Same as residential Same as residential
Additional 2016 Data by Community
Does this Community Use
Second Meters?
Does this Community Offer Senior
and/or Low Income Discounts? No Yes
Water System Sewer System
MWRA Charges as % of Total Community Water Expenses
0-25% MWRA Charges as % of Total
Community Sewer Expenses Over 75%
Miles of water pipeline replaced/rehabilitated in FY16
Less than 1 Miles of sewer pipeline
replaced/rehabilitated in FY16 1 - 3
Water Capital Needs over Next Five Years
$10 – 20 million
Sewer Capital Needs over Next Five Years
$0 – 10 million
Anticipated Water Capital Spending over Next Five Years
$5 – 10 million
Anticipated Sewer Capital Spending over Next Five Years
$1 – 5 million
Stormwater
Current Funding Source of Stormwater-Related Costs:
Tax Levy (DPW Budget)
MWRA Advisory Board 2016 Water & Sewer Retail Rate Survey
Section I Page 54

Waltham (W/S)
Residential Water Rates:
Residential Sewer Rates: Last adjusted:
January 2012
Last adjusted:
January 2012
Next adjustment scheduled: January 2017 Next adjustment scheduled: January 2017 Fund: Enterprise Fund: Enterprise
Minimum Charge: $9.00 Minimum Charge: $ 5.75 0 – 21 HCF $3.23/HCF 0 – 21 HCF $ 5.75/HCF >21 – 45 HCF $4.37 " >21 – 45 HCF $ 7.50 "
>45 – 120 HCF $7.00 " >45 – 120 HCF $11.33 " >120 HCF $9.36 " >120 HCF $13.69 " Based on 100% of water usage.
Billing Frequency: Residential: Quarterly, Commercial: Monthly
Annual Cost AWWA Standard for Historical Comparison
(120 HCF ≈ 90,000 gals.)
Annual Cost Based on Local, State & Federal Data
(59.4 HCF – See Appendix C for Data & Calc.)
Water $428.64 Water $191.86
Sewer $753.00 Sewer $341.55 Combined $1,181.64 Combined $533.41 % change from 2015 0.0%
Commercial Water Rates:
Commercial Sewer Rates:
Same as residential Same as residential
Additional 2016 Data by Community
Does this Community Use Second Meters?
Does this Community Offer Senior and/or Low Income Discounts?
No Yes
Water System Sewer System
MWRA Charges as % of Total
Community Water Expenses 50-75%
MWRA Charges as % of Total
Community Sewer Expenses 50-75%
Miles of water pipeline replaced/rehabilitated in FY16
1 – 3 Miles of sewer pipeline
replaced/rehabilitated in FY16 1 – 3
Water Capital Needs over Next Five Years
$10 – 20 million
Sewer Capital Needs over Next Five Years
$10 – 20 million
Anticipated Water Capital Spending over Next Five Years
$5 – 10 million
Anticipated Sewer Capital Spending over Next Five Years
$5 – 10 million
Stormwater
Current Funding Source of Stormwater-Related Costs:
General Obligation Bonds
MWRA Advisory Board 2016 Water & Sewer Retail Rate Survey
Section I Page 55

Watertown (W/S)
Residential Water Rates:
Residential Sewer Rates: Last adjusted:
July 2015
Last adjusted:
July 2016
Next adjustment scheduled: July 2017 Next adjustment scheduled: July 2017 Fund: Enterprise Fund: Enterprise
Base charge (⅝") $ 6.87/bill 0 – 30 HCF $ 4.48/HCF 0 – 30 HCF $ 8.28/HCF >30 – 300 HCF $ 6.96 " >30 – 300 HCF $10.70 "
>300 HCF $10.99 " >300 HCF $14.33 " Based on 100% of water usage. Billing Frequency: Quarterly
Annual Cost AWWA Standard for Historical Comparison
(120 HCF ≈ 90,000 gals.)
Annual Cost Based on Local, State & Federal Data
(63.0 HCF – See Appendix C for Data & Calc.)
Water $565.08 Water $309.72 Sewer $993.60 Sewer $521.64 Combined $1,558.68 Combined $831.36 % change from 2015 1.7%
Additional 2016 Data by Community
Does this Community Use Second Meters?
Does this Community Offer Senior and/or Low Income Discounts?
Yes, Low Income Yes
Water System Sewer System
MWRA Charges as % of Total Community Water Expenses
No Response MWRA Charges as % of Total
Community Sewer Expenses No Response
Miles of water pipeline replaced/rehabilitated in FY16
No Response Miles of sewer pipeline
replaced/rehabilitated in FY16 No Response
Water Capital Needs over Next Five Years
No Response Sewer Capital Needs over Next
Five Years No Response
Anticipated Water Capital Spending over Next Five Years
No Response Anticipated Sewer Capital
Spending over Next Five Years No Response
Stormwater
Current Funding Source of Stormwater-Related Costs:
Water/Sewer Rates
MWRA Advisory Board 2016 Water & Sewer Retail Rate Survey
Section I Page 56

Wellesley (S/partial W)
Residential Water Rates:
Residential Sewer Rates: Last adjusted:
July 2016
Last adjusted:
July 2016
Next adjustment scheduled: Unknown Next adjustment scheduled: Unknown Fund: Enterprise Fund: Enterprise
Base charge $6.83/bill Base charge $1.50/bill 0 – 5 HCF $2.99/HCF All units $8.61/HCF 5 – 12 HCF (except for peak use) $3.51 " Based on 100% of water usage.
Peak Use Charges (May – October):
>12 – 24 HCF $5.57 " >24 – 36 HCF $7.21 " >36 HCF $9.18 " Billing Frequency: Monthly
Annual Cost
AWWA Standard for Historical Comparison (120 HCF ≈ 90,000 gals.)
Annual Cost
Based on Local, State & Federal Data (97.3 HCF – See Appendix C for Data & Calc.)
Water $471.96 Water $392.06 Sewer $1,051.20 Sewer $855.20 Combined $1,523.16 Combined $1,247.26 % change from 2015 4.5%
Commercial Water Rates:
Commercial Sewer Rates:
1 – 5 HCF $2.99 5 – 12 HCF $3.51 Peak Use Charges (May – October) > 12 HCF $5.57
Same as residential
Additional 2016 Data by Community
Does this Community Use Second Meters?
Does this Community Offer Senior and/or Low Income Discounts?
No Yes
Water System Sewer System
MWRA Charges as % of Total Community Water Expenses
0-25% MWRA Charges as % of Total
Community Sewer Expenses 50-75%
Miles of water pipeline replaced/rehabilitated in FY16
Less than 1 Miles of sewer pipeline
replaced/rehabilitated in FY16 Less than 1
Water Capital Needs over Next Five Years
$0 – 10 million
Sewer Capital Needs over Next Five Years
$0 – 10 million
Anticipated Water Capital Spending over Next Five Years
Over $10 million
Anticipated Sewer Capital Spending over Next Five Years
$1 – 5 million
Stormwater
Current Funding Source of Stormwater-Related Costs:
Tax Levy (DPW Budget)
MWRA Advisory Board 2016 Water & Sewer Retail Rate Survey
Section I Page 57

Weston (W)
Residential Water Rates:
Residential Sewer Rates: Last adjusted:
January 2016
Last adjusted:
Not applicable
Next adjustment scheduled: January 2017 Next adjustment scheduled: Not applicable Fund: Enterprise Fund: Not applicable
Base charge (⅝" meter) $21.00/bill Community not sewered. 1 – 50 HCF $ 1.44/HCF >50 – 150 HCF $ 4.06 "
>150 HCF $ 7.57 "
Billing Frequency: Semi-Annually
Annual Cost AWWA Standard for Historical Comparison
(120 HCF ≈ 90,000 gals.)
Annual Cost Based on Local, State & Federal Data
(170.4 HCF – See Appendix C for Data & Calc)
Water $267.20 Water $470.20 Sewer Not Sewered Sewer Not Sewered Combined $267.20 Combined $470.20 % change from 2015 -7.9%
Commercial Water Rates:
Commercial Sewer Rates:
Same as residential Not sewered
Additional 2016 Data by Community
Does this Community Use Second Meters?
Does this Community Offer Senior and/or Low Income Discounts?
Yes, Both No
Water System Sewer System
MWRA Charges as % of Total Community Water Expenses
50-75% MWRA Charges as % of Total
Community Sewer Expenses N/A
Miles of water pipeline
replaced/rehabilitated in FY16 Less than 1
Miles of sewer pipeline
replaced/rehabilitated in FY16 N/A
Water Capital Needs over Next Five Years
$0 – 10 million
Sewer Capital Needs over Next Five Years
N/A
Anticipated Water Capital Spending over Next Five Years
$1 million - $5 million
Anticipated Sewer Capital Spending over Next Five Years
N/A
Stormwater
Current Funding Source of Stormwater-Related Costs:
Tax Levy (DPW Budget)
MWRA Advisory Board 2016 Water & Sewer Retail Rate Survey
Section I Page 58

Westwood (S)
Residential Water Rates:
Residential Sewer Rates: Last adjusted:
January 2015
Last adjusted:
July 2015
Next adjustment scheduled: January 2016 Next adjustment scheduled: July 2016 Fund: Enterprise Fund: Enterprise
Minimum charge per bill includes first 3 HCF (⅝" meter) $37.71
Base charge (⅝" meter) $15.00/quarter
0 – 25 HCF $ 5.80/HCF >3 – 42 HCF $ 4.43/HCF >25 – 70 HCF $ 8.65 " >42 – 75 HCF >75 HCF
$ 7.19 " $ 9.31 "
>70 HCF $15.50 "
Based on 100% of water usage. Billing Frequency: Quarterly
Annual Cost AWWA Standard for Historical Comparison
(120 HCF ≈ 90,000 gals.)
Annual Cost Based on Local, State & Federal Data
(80.3 HCF – See Appendix C for Data & Calc.)
Water $628.20 Water $452.08 Sewer $841.00 Sewer $569.40 Combined $1,469.20 Combined $1,021.48
% change from 2015 1.7%
Commercial Water Rates:
Commercial Sewer Rates:
Minimum charge (⅝" meter)
includes first 9 HCF $55.95 All units in excess of allowance $ 4.43/HCF
Same as residential
Additional 2016 Data by Community
Does this Community Use Second Meters?
Does this Community Offer Senior and/or Low Income Discounts?
No Yes
Water System Sewer System
MWRA Charges as % of Total Community Water Expenses
0-25% MWRA Charges as % of Total
Community Sewer Expenses 50-75%
Miles of water pipeline replaced/rehabilitated in FY16
1-3 miles Miles of sewer pipeline
replaced/rehabilitated in FY16 Less than 1
Water Capital Needs over Next Five Years
$20-50 million
Sewer Capital Needs over Next Five Years
$0 – 10 million
Anticipated Water Capital Spending over Next Five Years
Over $10 million
Anticipated Sewer Capital Spending over Next Five Years
$1 – 5 million
Stormwater
Current Funding Source of Stormwater-Related Costs:
Tax Levy (DPW Budget)
MWRA Advisory Board 2016 Water & Sewer Retail Rate Survey
Section I Page 59
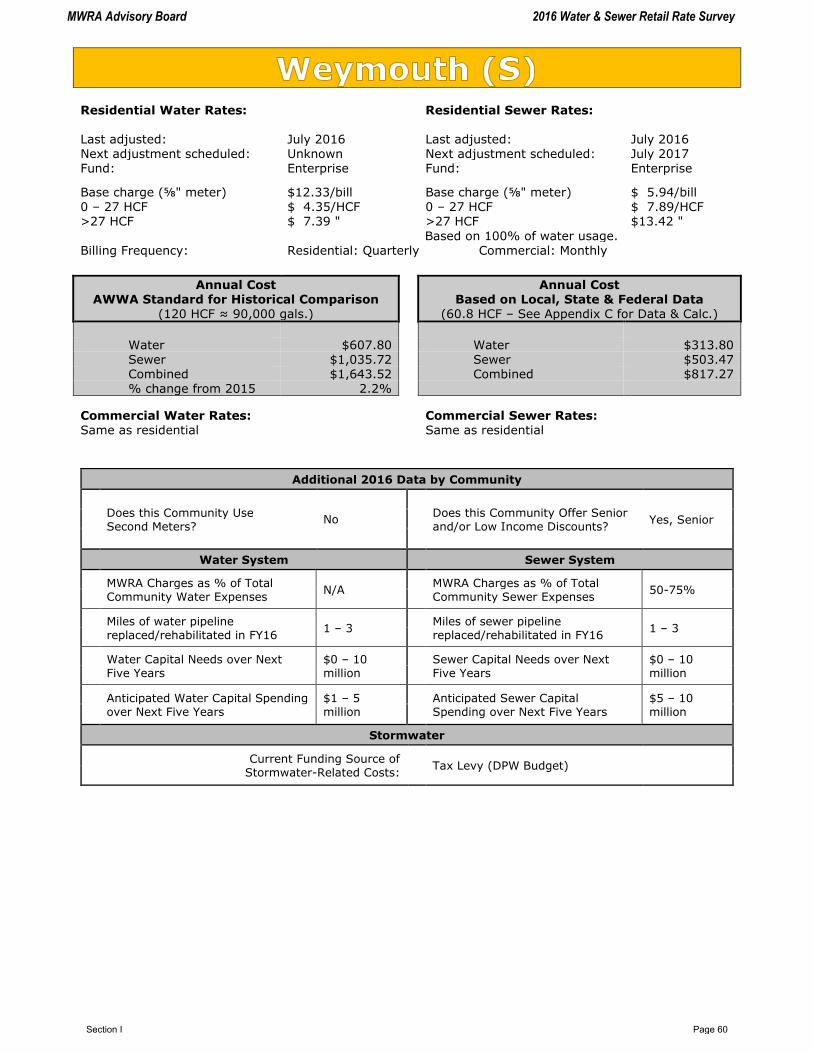
Residential Water Rates:
Residential Sewer Rates: Last adjusted:
July 2016
Last adjusted:
July 2016
Next adjustment scheduled: Unknown Next adjustment scheduled: July 2017 Fund: Enterprise Fund: Enterprise
Base charge (⅝" meter) $12.33/bill Base charge (⅝" meter) $ 5.94/bill 0 – 27 HCF $ 4.35/HCF 0 – 27 HCF $ 7.89/HCF >27 HCF $ 7.39 " >27 HCF $13.42 "
Based on 100% of water usage. Billing Frequency: Residential: Quarterly Commercial: Monthly
Annual Cost AWWA Standard for Historical Comparison
(120 HCF ≈ 90,000 gals.)
Annual Cost Based on Local, State & Federal Data
(60.8 HCF – See Appendix C for Data & Calc.)
Water $607.80 Water $313.80 Sewer $1,035.72 Sewer $503.47 Combined $1,643.52 Combined $817.27 % change from 2015 2.2%
Commercial Water Rates:
Commercial Sewer Rates:
Same as residential Same as residential
Additional 2016 Data by Community
Does this Community Use Second Meters?
Does this Community Offer Senior and/or Low Income Discounts?
Yes, Senior No
Water System Sewer System
MWRA Charges as % of Total Community Water Expenses
N/A MWRA Charges as % of Total
Community Sewer Expenses 50-75%
Miles of water pipeline replaced/rehabilitated in FY16
1 – 3 Miles of sewer pipeline
replaced/rehabilitated in FY16 1 – 3
Water Capital Needs over Next Five Years
$0 – 10 million
Sewer Capital Needs over Next Five Years
$0 – 10 million
Anticipated Water Capital Spending over Next Five Years
$1 – 5 million
Anticipated Sewer Capital Spending over Next Five Years
$5 – 10 million
Stormwater
Current Funding Source of Stormwater-Related Costs:
Tax Levy (DPW Budget)
MWRA Advisory Board 2016 Water & Sewer Retail Rate Survey
Section I Page 60

Wilbraham (W)
Residential Water Rates:
Residential Sewer Rates: Last adjusted:
October 2013
Last adjusted:
October 2008
Next adjustment scheduled: No response Next adjustment scheduled: No response Fund: Enterprise Fund: Enterprise
Minimum bill $61.80 Minimum bill $52.50 0 – 100 HCF $ 4.12/HCF All units $ 4.10/HCF >100 – 200 HCF $ 4.32 "
>200 HCF $ 4.52 " Based on 100% of water usage. Billing Frequency: Semi-annually
Annual Cost AWWA Standard for Historical Comparison
(120 HCF ≈ 90,000 gals.)
Annual Cost Based on Local, State & Federal Data
(76.9 HCF – See Appendix C for Data & Calc.)
Water $494.40 Water $316.83 Sewer $492.00 Sewer $315.29 Combined $986.40 Combined $632.12 % change from 2015 0.0%
Commercial Water Rates:
Commercial Sewer Rates:
All units $4.12/HCF Commercial Minimum: same as residential
All units $ 5.00/HCF Commercial Minimum: $60.00
Additional 2016 Data by Community
Does this Community Use Second Meters?
Does this Community Offer Senior and/or Low Income Discounts?
No Yes
Water System Sewer System
MWRA Charges as % of Total Community Water Expenses
25-50% MWRA Charges as % of Total
Community Sewer Expenses N/A
Miles of water pipeline replaced/rehabilitated in FY16
Less than 1 Miles of sewer pipeline
replaced/rehabilitated in FY16 No Response
Water Capital Needs over Next Five Years
$0-10 million Sewer Capital Needs over Next
Five Years $0-10 million
Anticipated Water Capital Spending over Next Five Years
No Response Anticipated Sewer Capital
Spending over Next Five Years No Response
Stormwater
Current Funding Source of Stormwater-Related Costs:
Tax Levy (DPW Budget)
Wilbraham receives wholesale water from MWRA and wastewater services from the City of Springfield.
MWRA Advisory Board 2016 Water & Sewer Retail Rate Survey
Section I Page 61

Wilmington (S/partial W)
Residential Water Rates:
Residential Sewer Rates: Last adjusted:
February 2016
Last adjusted:
February 2016
Next adjustment scheduled: Unknown Next adjustment scheduled: Unknown Fund: Special Revenue Fund: General
0 – 10 HCF $3.53/HCF All units $5.14/HCF >10 – 20 HCF $3.91 " >20 – 30 HCF $4.70 "
>30 HCF $6.27 " Based on 100% of water usage. Billing Frequency: Quarterly
Annual Cost AWWA Standard for Historical Comparison
(120 HCF ≈ 90,000 gals.)
Annual Cost Based on Local, State & Federal Data
(80.9 HCF – See Appendix C for Data & Calc.)
Water $485.60 Water $301.83 Sewer $616.80 Sewer $415.83 Combined $1,102.40 Combined $717.66 % change from 2015 5.2%
Commercial Water Rates:
Commercial Sewer Rates:
0 – 50 HCF $3.86/HCF >50 – 200 HCF $4.13 "
>200 HCF $4.51 "
All units $6.15/HCF
Additional 2016 Data by Community
Does this Community Use Second Meters?
Does this Community Offer Senior and/or Low Income Discounts?
No No
Water System Sewer System
MWRA Charges as % of Total Community Water Expenses
0-25% MWRA Charges as % of Total
Community Sewer Expenses 0-25%
Miles of water pipeline replaced/rehabilitated in FY16
Less than 1 Miles of sewer pipeline
replaced/rehabilitated in FY16 Less than 1
Water Capital Needs over Next Five Years
$0 – 10 million
Sewer Capital Needs over Next Five Years
$0 – 10 million
Anticipated Water Capital Spending over Next Five Years
$1 – 5 million
Anticipated Sewer Capital Spending over Next Five Years
$1 – 5 million
Stormwater
Current Funding Source of Stormwater-Related Costs:
Tax Levy (DPW Budget)
MWRA Advisory Board 2016 Water & Sewer Retail Rate Survey
Section I Page 62

Winchester (S/ partial W)
Residential Water Rates:
Residential Sewer Rates: Last adjusted:
January 2016
Last adjusted:
January 2016
Next adjustment scheduled: July 2017 Next adjustment scheduled: July 2017 Fund: Enterprise Fund: Enterprise
Service charge $5.00/bill 0 – 15 HCF $1.32/HCF 0 – 15 HCF $1.35/HCF >15 – 45 HCF $3.29 " >15 – 45 HCF $4.29 "
>45 HCF $5.26 " >45 HCF $6.66 " Based on 100% of water usage. Billing Frequency: Quarterly
Annual Cost AWWA Standard for Historical Comparison
(120 HCF ≈ 90,000 gals.)
Annual Cost Based on Local, State & Federal Data
(100.1 HCF – See Appendix C for Data & Calc.)
Water $296.60 Water $231.13 Sewer $338.40 Sewer $253.03 Combined $635.00 Combined $484.16 % change from 2015 7.8%
Commercial Water Rates:
Commercial Sewer Rates:
0 – 75 HCF $5.32/HCF >75 HCF $6.52 "
0 – 75 HCF $6.94/HCF >75 HCF $9.42 "
Additional 2016 Data by Community
Does this Community Use Second Meters?
Does this Community Offer Senior and/or Low Income Discounts?
Yes, Low Income No
Water System Sewer System
MWRA Charges as % of Total Community Water Expenses
25-50% MWRA Charges as % of Total
Community Sewer Expenses 25-50%
Miles of water pipeline
replaced/rehabilitated in FY16 Less than 1
Miles of sewer pipeline
replaced/rehabilitated in FY16 Less than 1
Water Capital Needs over Next Five Years
$0 – 10 million
Sewer Capital Needs over Next Five Years
$0 – 10 million
Anticipated Water Capital Spending over Next Five Years
$1 – 5 million
Anticipated Sewer Capital Spending over Next Five Years
$1 – 5 million
Stormwater
Current Funding Source of Stormwater-Related Costs:
Water/Sewer Rates
Winchester utilizes the debt service exclusion as permitted under General Law 59 Section 21C(n)
MWRA Advisory Board 2016 Water & Sewer Retail Rate Survey
Section I Page 63

Winthrop (W/S)
Residential Water Rates:
Residential Sewer Rates: Last adjusted:
July 2016
Last adjusted:
July 2014
Next adjustment scheduled: Unknown Next adjustment scheduled: Unknown Fund: Enterprise Fund: Enterprise
Minimum charge $18.27/quarter Minimum charge $31.73/quarter All units $ 6.50/HCF All units $ 9.90/HCF Based on 100% of water usage.
Billing Frequency: Quarterly
Annual Cost AWWA Standard for Historical Comparison
(120 HCF ≈ 90,000 gals.)
Annual Cost Based on Local, State & Federal Data
(61.6 HCF – See Appendix C for Data & Calc.)
Water $780.00 Water $400.40 Sewer $1,188.00 Sewer $609.84 Combined $1,968.00 Combined $1,010.24 % change from 2015 2.8%
Commercial Water Rates:
Commercial Sewer Rates:
Same as residential Same as residential
Additional 2016 Data by Community
Does this Community Use Second Meters?
Does this Community Offer Senior and/or Low Income Discounts?
No No
Water System Sewer System
MWRA Charges as % of Total Community Water Expenses
50-75% MWRA Charges as % of Total
Community Sewer Expenses 50-75%
Miles of water pipeline replaced/rehabilitated in FY16
1 – 3 Miles of sewer pipeline
replaced/rehabilitated in FY16 1 – 3
Water Capital Needs over Next Five Years
$0 – 10 million
Sewer Capital Needs over Next Five Years
$0 – 10 million
Anticipated Water Capital Spending over Next Five Years
$1 – 5 million
Anticipated Sewer Capital Spending over Next Five Years
$1 – 5 million
Stormwater
Current Funding Source of Stormwater-Related Costs:
Tax Levy (DPW Budget)
The 2013 document misstated the water and sewer rates for Winthrop. The 2013 figures were corrected in this document so that the percentage change from 2013 to 2014 is accurate. See Appendix A for updated 2013 data.
MWRA Advisory Board 2016 Water & Sewer Retail Rate Survey
Section I Page 64

Woburn (S/ partial W)
Residential Water Rates:
Residential Sewer Rates: Last adjusted:
July 2010
Last adjusted:
July 2010
Next adjustment scheduled: Unknown Next adjustment scheduled: Unknown Fund: Enterprise Fund: Enterprise
Flat rate of $102.50 per bill Flat rate of $164.00 per bill
Billing Frequency: Semi-Annually
Annual Cost AWWA Standard for Historical Comparison
(120 HCF ≈ 90,000 gals.)
Annual Cost Based on Local, State & Federal Data
(140.1 HCF – See Appendix C for Data & Calc.)
Water $205.00 Water $205.00
Sewer $328.00 Sewer $328.00
Combined $533.00 Combined $533.00 % change from 2015 0.0%
Commercial Water Rates:
Commercial Sewer Rates:
Minimum charge: $113.21 All units $ 4.60/HCF
Minimum charge: $344.15 All units 304% of water bill
Additional 2016 Data by Community
Does this Community Use Second Meters?
Does this Community Offer Senior and/or Low Income Discounts?
Yes, Senior No
Water System Sewer System
MWRA Charges as % of Total Community Water Expenses
0-25% MWRA Charges as % of Total
Community Sewer Expenses Over 75%
Miles of water pipeline replaced/rehabilitated in FY16
1 – 3 Miles of sewer pipeline
replaced/rehabilitated in FY16 1 – 3
Water Capital Needs over Next Five Years
$0 – 10 million
Sewer Capital Needs over Next Five Years
$0 – 10 million
Anticipated Water Capital Spending over Next Five Years
$1 – 5 million
Anticipated Sewer Capital Spending over Next Five Years
$1-5 million
Stormwater
Current Funding Source of Stormwater-Related Costs:
Tax Levy (DPW Budget)
MWRA Advisory Board 2016 Water & Sewer Retail Rate Survey
Section I Page 65
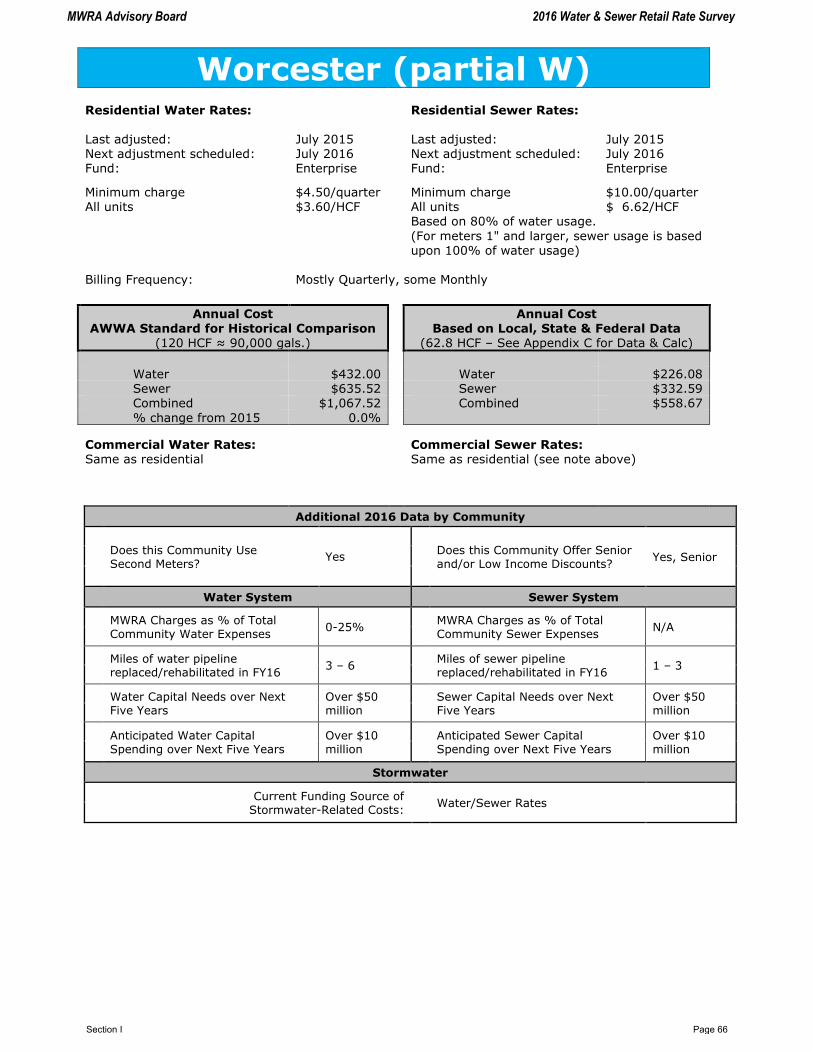
Worcester (partial W)
Residential Water Rates:
Residential Sewer Rates: Last adjusted:
July 2015
Last adjusted:
July 2015
Next adjustment scheduled: July 2016 Next adjustment scheduled: July 2016 Fund: Enterprise Fund: Enterprise
Minimum charge $4.50/quarter Minimum charge $10.00/quarter All units $3.60/HCF All units $ 6.62/HCF Based on 80% of water usage.
(For meters 1" and larger, sewer usage is based upon 100% of water usage)
Billing Frequency: Mostly Quarterly, some Monthly
Annual Cost AWWA Standard for Historical Comparison
(120 HCF ≈ 90,000 gals.)
Annual Cost Based on Local, State & Federal Data
(62.8 HCF – See Appendix C for Data & Calc)
Water $432.00 Water $226.08 Sewer $635.52 Sewer $332.59 Combined $1,067.52 Combined $558.67
% change from 2015 0.0%
Commercial Water Rates:
Commercial Sewer Rates:
Same as residential Same as residential (see note above)
Additional 2016 Data by Community
Does this Community Use Second Meters?
Does this Community Offer Senior and/or Low Income Discounts?
Yes, Senior Yes
Water System Sewer System
MWRA Charges as % of Total Community Water Expenses
0-25% MWRA Charges as % of Total
Community Sewer Expenses N/A
Miles of water pipeline replaced/rehabilitated in FY16
3 – 6 Miles of sewer pipeline
replaced/rehabilitated in FY16 1 – 3
Water Capital Needs over Next Five Years
Over $50 million
Sewer Capital Needs over Next Five Years
Over $50 million
Anticipated Water Capital Spending over Next Five Years
Over $10 million
Anticipated Sewer Capital Spending over Next Five Years
Over $10 million
Stormwater
Current Funding Source of Stormwater-Related Costs:
Water/Sewer Rates
MWRA Advisory Board 2016 Water & Sewer Retail Rate Survey
Section I Page 66

SELECT NON‐M
WRA M
ASSACHUSETTS COMMUNITIES 2016
WATER AND SEW
ER CHARGES
MWRA Advisory Board 2016 Water & Sewer Retail Rate Survey
Section II Page 1

Water Sewer Combined Change
Abington $618.00 $640.00 $1,258.00 0.0%
Agawam $317.20 $376.32 $693.52 0.0%
Ayer $342.40 $899.20 $1,241.60 2.7%
Beverly $427.20 $673.20 $1,100.40 0.0%
Brockton $487.80 $446.00 $933.80 5.0%
Danvers $758.60 $786.00 $1,544.60 2.0%
Fairhaven $681.35 $824.00 $1,505.35 8.1%
Fall River $392.40 $633.60 $1,026.00 16.5%
Fitchburg $367.44 $839.40 $1,206.84 0.0%
Gloucester $684.90 $1,330.20 $2,015.10 7.6%
Haverhill $333.60 $514.80 $848.40 2.5%
Holyoke $387.81 $486.00 $873.81 0.0%
Hudson $471.60 $634.80 $1,106.40 0.0%
Lawrence $372.00 $402.00 $774.00 0.0%
Lowell $249.12 $410.16 $659.28 0.0%
Medfield $437.88 $635.60 $1,073.48 2.4%
New Bedford $297.99 $568.00 $865.99 0.0%
North Reading $790.40 Not Sewered $790.40 5.8%
Salem $357.60 $729.60 $1,087.20 2.0%
Shrewsbury $355.00 $795.00 $1,150.00 0.0%
Springfield $376.80 $568.80 $945.60 3.8%
Tewksbury $893.22 $844.98 $1,738.20 -0.9%
AVERAGE $472.74 $668.46 $1,141.20 2.7%
COMPARATIVE ANNUAL RESIDENTIAL WATER AND SEWER CHARGES FOR SELECTED
NON-MWRA COMMUNITIES IN MASSACHUSETTS
2016
Water and sewer charges based on an annual water consumption of 120 HCF ≈ 90 kgal
Average does not include unavilable data or non-sewered communities.
MWRA Advisory Board 2016 Water & Sewer Retail Rate Survey
Section II Page 2

Abington
Residential Water Rates: Residential Sewer Rates:
Last adjusted: December 2012 Last adjusted: October 2009 Next adjustment scheduled: Unknown Next adjustment scheduled: No response Fund: Special Revenue Fund: Enterprise
Base charge $42.00/bill Minimum Charge $10.00/bill All units $ 3.75/HCF 0 – 30 HCF $ 5.00/HCF >30 HCF $ 7.00 " Based on 100% of water usage.
Billing Frequency: Quarterly
Annual Cost
AWWA Standard for Historical Comparison
(120 HCF ≈ 90,000 gals.)
Water $618.00 Sewer $640.00 Combined $1,258.00 % change from 2015 0.0%
Commercial Water Rates:
Commercial Sewer Rates:
Same as residential Same as residential
Senior and/or Low Income Discounts: None
Agawam
Residential Water Rates: Residential Sewer Rates:
Last adjusted: September 2014 Last adjusted: July 2016 Next adjustment scheduled: Unknown Next adjustment scheduled: Unknown Fund: Enterprise Fund: Enterprise
Annual service charge $70.00 Annual minimum charge $24.00 0 – 40 CF $ 1.90/HCF All units $ 3.04/HCF >40 CF $ 2.38 " Based on 90% of water usage.
Billing Frequency: Semi-Annually
Annual Cost
AWWA Standard for Historical Comparison
(120 HCF ≈ 90,000 gals.)
Water $317.20 Sewer $376.32 Combined $693.52 % change from 2015 0.0%
Commercial Water Rates:
Commercial Sewer Rates:
Annual service charge $70.00 Same as residential except sewer usage is based on 100% of water usage. All units $ 2.38/HCF
Senior and/or Low Income Discounts: Yes
MWRA Advisory Board 2016 Water & Sewer Retail Rate Survey
Section II Page 3

Ayer
Residential Water Rates: Residential Sewer Rates:
Last adjusted: July 2016 Last adjusted: July 2016 Next adjustment scheduled: July 2017 Next adjustment scheduled: July 2017 Fund: Enterprise Fund: Enterprise
Minimum charge $10.00 Minimum charge $10.00 0 – 60 HCF $ 2.52/HCF 0 – 60 HCF $ 7.16/HCF >60 – 120 HCF $ 3.12 " >60 – 120 HCF $ 8.20 " >120 HCF $ 3.69 " >120 HCF $ 9.33 "
Based on 100% of water usage.
Billing Frequency: Residential: Semi-Annually, Commercial: Quarterly
Annual Cost
AWWA Standard for Historical Comparison
(120 HCF ≈ 90,000 gals.)
Water $342.40 Sewer $899.20 Combined $1,241.60 % change from 2015 2.7%
Commercial Water Rates:
Commercial Sewer Rates:
Same as residential Same as residential
Senior and/or Low Income Discounts: No response
Beverly
Residential Water Rates: Residential Sewer Rates:
Last adjusted: July 2015 Last adjusted: July 2015 Next adjustment scheduled: No response Next adjustment scheduled: No response Fund: Enterprise Fund: Enterprise
All units $3.56/HCF All units $5.61/HCF Based on 100% of water usage.
Billing Frequency: Quarterly
Annual Cost
AWWA Standard for Historical Comparison
(120 HCF ≈ 90,000 gals.)
Water $427.20 Sewer $673.20 Combined $1,100.40 % change from 2015 0.0%
Commercial Water Rates:
Commercial Sewer Rates:
Same as residential Same as residential
Senior and/or Low Income Discounts: None
MWRA Advisory Board 2016 Water & Sewer Retail Rate Survey
Section II Page 4

Brockton
Residential Water Rates: Residential Sewer Rates:
Last adjusted: January 2016 Last adjusted: January 2016 Next adjustment scheduled: January 2017 Next adjustment scheduled: January 2017 Fund: Enterprise Fund: Enterprise
Minimum charge (⅝" meter) $24.68/bill 0 – 12.5 HCF $ 3.29/HCF " 0 – 12.5 HCF $ 2.93/HCF " >12 – 25 HCF $ 4.19 " >12 – 25 HCF $ 3.91 " >25 – 50 HCF $ 5.69 " >25 – 50 HCF $ 5.20 " >50 – 100 HCF $ 6.18 " >50 – 100 HCF $ 6.91 " >100 – 250 HCF $ 6.46 " >100 – 250 HCF $ 9.22 " >250 HCF $ 6.72 " >250 – 8750 HCF $12.23 " >8750 HCF $16.26 " Based on 100% of water usage.
Billing Frequency: Residential: Quarterly
Annual Cost
AWWA Standard for Historical Comparison
(120 HCF ≈ 90,000 gals.)
Water $487.80 Sewer $446.00 Combined $933.80 % change from 2015 5.0%
Commercial Water Rates:
Commercial Sewer Rates:
Same as residential Same as residential
Senior and/or Low Income Discounts: None
Danvers
Residential Water Rates: Residential Sewer Rates:
Last adjusted: June 2016 Last adjusted: June 2016 Next adjustment scheduled:
June 2017 Next adjustment scheduled:
June 2017
Fund: Enterprise Fund: Enterprise
Base Charge $11.25/bill 0 – 20 HCF $ 5.71/HCF 0 – 20 HCF $ 6.46/HCF >20 – 24 HCF $ 6.42 " >20 – 24 HCF $ 6.73 " >24 HCF $ 8.23 >24 HCF $ 8.09 Based on 100% of water usage.
Billing Frequency: Residential: Quarterly Commercial: Monthly
Annual Cost
AWWA Standard for Historical Comparison
(120 HCF ≈ 90,000 gals.)
Water $758.60 Sewer $786.00 Combined $1,544.60 % change from 2015 2.0%
Commercial Water Rates:
Commercial Sewer Rates: 0 – 40 HCF $5.71/HCF 0 – 40 HCF $6.46/HCF >40 HCF $6.42 " >40 HCF $6.73 " Senior and/or Low Income Discounts: None
MWRA Advisory Board 2016 Water & Sewer Retail Rate Survey
Section II Page 5

Fairhaven
Residential Water Rates: Residential Sewer Rates:
Last adjusted: April 2016 Last adjusted: April 2016 Next adjustment scheduled:
Unknown Next adjustment scheduled:
Unknown
Fund: Enterprise Fund: Enterprise
Base Charge $55.00/bill Base Charge $25.00/bill 0 – 22.5 HCF $ 2.09/HCF All units $6.45/HCF >22.5 – 45 HCF $ 5.12 " >45 HCF $ 8.23 Based on 100% of water usage.
Billing Frequency: Semi-Annually
Annual Cost
AWWA Standard for Historical Comparison
(120 HCF ≈ 90,000 gals.)
Water $681.35 Sewer $824.00 Combined $1,505.35 % change from 2015 8.1%
Commercial Water
Rates:
Commercial Sewer
Rates:
Same as residential Same as residential
Senior and/or Low Income Discounts: None
Fall River
Residential Water Rates: Residential Sewer Rates:
Last adjusted: July 2016 Last adjusted: July 2016 Next adjustment scheduled: Unknown Next adjustment scheduled: Unknown Fund: Enterprise Fund: Enterprise
Service connection fee (¾" meter) $12.00/quarter
All units $ 2.87/HCF All units $ 5.28/HCF Billing Frequency: Quarterly Based on 100% of water usage.
Annual Cost
AWWA Standard for Historical Comparison
(120 HCF ≈ 90,000 gals.)
Water $392.40 Sewer $633.60 Combined $1,026.00 % change from 2015 16.5%
Commercial Water Rates:
Commercial Sewer Rates:
Same as residential Same as residential
Senior and/or Low Income Discounts: None Stormwater Fee: $40.00/quarter (not included in sewer calculation)
MWRA Advisory Board 2016 Water & Sewer Retail Rate Survey
Section II Page 6

Fitchburg
Residential Water Rates: Residential Sewer Rates:
Last adjusted: July 2011 Last adjusted: July 2011 Next adjustment scheduled: Unknown Next adjustment scheduled: Unknown Fund: Enterprise Fund: Enterprise
Base charge includes 5 HCF $5.34/bill Minimum includes 3 HCF $18.85/bill >5 HCF $ 3.16/HCF >3HCF $ 7.30/HCF Based on 100% of water usage.
Billing Frequency: Monthly
Annual Cost
AWWA Standard for Historical Comparison
(120 HCF ≈ 90,000 gals.)
Water $367.44 Sewer $839.40 Combined $1,206.84 % change from 2010 0.0%
Commercial Water Rates:
Commercial Sewer Rates:
Same as residential Same as residential
Senior and/or Low Income Discounts: None
Gloucester
Residential Water Rates: Residential Sewer Rates:
Last adjusted: July 2016 Last adjusted: July 2016 Next adjustment scheduled: July 2017 Next adjustment scheduled: July 2017 Fund: Enterprise Fund: Enterprise
All units $7.61/kgal All units $14.78/kgal Based on 100% of water usage.
Billing Frequency: Quarterly
Annual Cost
AWWA Standard for Historical Comparison
(120 HCF ≈ 90,000 gals.)
Water $684.90 Sewer $1,330.20 Combined $2,015.10 % change from 2015 7.6%
Commercial Water Rates:
Commercial Sewer Rates:
Same as residential Same as residential
Senior and/or Low Income Discounts: None
If sewer usage exceeds minimum charge, the unit charge is applied to the full usage. Last year’s survey incorrectly calculated Fitchburg’s sewer charge. Adjustments have been made to both 2014
and 2015 calculations.
MWRA Advisory Board 2016 Water & Sewer Retail Rate Survey
Section II Page 7

Haverhill
Residential Water Rates: Residential Sewer Rates:
Last adjusted: July 2015 Last adjusted: July 2016 Next adjustment scheduled: Unknown Next adjustment scheduled: Unknown Fund: Enterprise Fund: Enterprise
All units $2.78/HCF All units $4.29/HCF Based on 100% of water usage.
Billing Frequency: Quarterly
Annual Cost
AWWA Standard for Historical Comparison
(120 HCF ≈ 90,000 gals.)
Water $333.60 Sewer $514.80 Combined $848.40 % change from 2015 2.5%
Commercial Water Rates:
Commercial Sewer Rates:
Same as residential Same as residential
Senior and/or Low Income Discounts: 15% discount on both water and sewer for low income senior citizens over 65 years old
Holyoke
Residential Water Rates: Residential Sewer Rates:
Last adjusted: July 2009 Last adjusted: November 2008 Next adjustment scheduled: Unknown Next adjustment scheduled: No response Fund: Enterprise Fund: Enterprise
Minimum charge includes first 10,000 gallons
$43.09/bill Base charge $5.00/bill
>10,000 gallons $ 4.309/kgal All units $5.40/kgal Based on 100% of water usage.
Billing Frequency: Quarterly
Annual Cost
AWWA Standard for Historical Comparison
(120 HCF ≈ 90,000 gals.)
Water $387.81 Sewer $486.00 Combined $873.81 % change from 2015 0.0%
Commercial Water Rates:
Commercial Sewer Rates:
Same as residential Two entities are provided with a commercial rate
Senior and/or Low Income Discounts: None
MWRA Advisory Board 2016 Water & Sewer Retail Rate Survey
Section II Page 8

Hudson
Residential Water Rates: Residential Sewer Rates:
Last adjusted: July 2013 Last adjusted: July 2013 Next adjustment scheduled: No Response Next adjustment scheduled: No Response Fund: General Fund: General
Minimum charge $14.68 Minimum charge includes 4 HCF $21.16/bill >0 – 15 HCF $ 3.67/kgal All units $ 5.26/kgal >15 – 30 HCF $ 4.19 " Based on 100% of water usage. >30 – 50 HCF $ 4.26 " >50 – 150 HCF $ 4.33 " >150 HCF $ 4.41 " Billing Frequency: Quarterly
Annual Cost
AWWA Standard for Historical Comparison
(120 HCF ≈ 90,000 gals.)
Water $471.60 Sewer $634.80 Combined $1,106.40 % change from 2015 0.0%
Commercial Water Rates:
Commercial Sewer Rates:
Same as residential Same as residential
Senior and/or Low Income Discounts: None
Lawrence
Residential Water Rates: Residential Sewer Rates:
Last adjusted: July 2009 Last adjusted: July 2009 Next adjustment scheduled: No response Next adjustment scheduled: No response Fund: Enterprise Fund: Enterprise
All units $3.10/HCF All units $3.35/HCF Based on 100% of water usage.
Billing Frequency: Quarterly
Annual Cost
AWWA Standard for Historical Comparison
(120 HCF ≈ 90,000 gals.)
Water $372.00 Sewer $402.00 Combined $774.00 % change from 2015 0.0%
Commercial Water Rates:
Commercial Sewer Rates:
Same as residential Same as residential
Senior and/or Low Income Discounts: None
MWRA Advisory Board 2016 Water & Sewer Retail Rate Survey
Section II Page 9

Lowell
Residential Water Rates: Residential Sewer Rates:
Last adjusted: April 2011 Last adjusted: July 2015 Next adjustment scheduled: Unknown Next adjustment scheduled: Unknown Fund: Enterprise Fund: Enterprise
0 – 50 HCF $2.076/HCF 0 – 50 HCF $3.418/HCF >50 – 100 HCF $2.451 " >50 – 100 HCF $3.609 " >100 – 200 HCF $2.490 " >100 – 200 HCF $3.665 " >200 – 500 HCF $2.527 " >200 – 500 HCF $3.725 " >500 HCF $2.547 " >500 HCF $3.780 "
Based on 100% of water usage.
Billing Frequency: Quarterly
Annual Cost
AWWA Standard for Historical Comparison
(120 HCF ≈ 90,000 gals.)
Water $249.12 Sewer $410.16 Combined $659.28 % change from 2015 0.0%
Commercial Water Rates:
Commercial Sewer Rates:
Same as residential Same as residential
Senior and/or Low Income Discounts: Yes, senior citizen discount for water
Medfield
Residential Water Rates: Residential Sewer Rates:
Last adjusted: April 2016 Last adjusted: April 2016 Next adjustment scheduled: Unknown Next adjustment scheduled: Unknown Fund: Enterprise Fund: Enterprise
Minimum bill includes 10,000 gals. $47.49/bill
Minimum bill includes 10,000 gals. $85.75/bill
>10 – 35 kgal $ 4.19/kgal >10 kgal $ 8.84/kgal >35 – 70 kgal $ 6.67 " >70 kgal $ 9.45 "
Based on 75% of water usage.
Billing Frequency: Semi-Annually
Annual Cost
AWWA Standard for Historical Comparison
(120 HCF ≈ 90,000 gals.)
Water $437.88 Sewer $635.60 Combined $1,073.48 % change from 2015 2.4%
Commercial Water Rates:
Commercial Sewer Rates:
Same as residential Same as residential
Senior and/or Low Income Discounts: None
MWRA Advisory Board 2016 Water & Sewer Retail Rate Survey
Section II Page 10

New Bedford
Residential Water Rates: Residential Sewer Rates:
Last adjusted: July 2014 Last adjusted: June 2010 Next adjustment scheduled: July 2016 Next adjustment scheduled: Unknown Fund: Enterprise Fund: Enterprise
Base charge $26.17/year Base charge $70.00/year Meter rental fee (⅝" meter) $11.42/year All units $ 2.17/HCF All units $ 4.15/HCF
Based on 100% of water usage.
Billing Frequency: Monthly
Annual Cost
AWWA Standard for Historical Comparison
(120 HCF ≈ 90,000 gals.)
Water $297.99 Sewer $568.00 Combined $865.99 % change from 2015 0.0%
Commercial Water Rates:
Commercial Sewer Rates:
Same as residential Same as residential
Senior and/or Low Income Discounts: None
North Reading
Residential Water Rates: Residential Sewer Rates:
Last adjusted: July 2016 Last adjusted: Not applicable Next adjustment scheduled: No Response Next adjustment scheduled: Not applicable Fund: Enterprise Fund: Not applicable
Base Charge (⅝" meter) $ 5.00/bill 0 – 10 kgal $ 8.56/kgal Community not sewered. >10 – 22.5 kgal $12.56/ " >22.5 kgal $17.12/ " Billing Frequency: Quarterly
Annual Cost
AWWA Standard for Historical Comparison
(120 HCF ≈ 90,000 gals.)
Water $790.40 Sewer Not sewered Combined $790.40 % change from 2015 5.8%
Commercial Water Rates:
Commercial Sewer Rates:
Same as residential Same as residential
Senior and/or Low Income Discounts: Neither
MWRA Advisory Board 2016 Water & Sewer Retail Rate Survey
Section II Page 11

Salem
Residential Water Rates: Residential Sewer Rates:
Last adjusted: August 2015 Last adjusted: August 2015 Next adjustment scheduled: Unknown Next adjustment scheduled: Unknown Fund: Enterprise Fund: Enterprise
Minimum bill (⅝" meter) $29.80 All units $6.08/HCF All units $ 2.98/HCF Based on 100% of water usage.
Billing Frequency: Quarterly
Annual Cost
AWWA Standard for Historical Comparison
(120 HCF ≈ 90,000 gals.)
Water $357.60 Sewer $729.60 Combined $1,087.20 % change from 2015 2.0%
Commercial Water Rates:
Commercial Sewer Rates:
All units $4.04/HCF 0 – 250 HCF/month >250 HCF/month
$ 9.21/HCF $11.79/HCF
Senior and/or Low Income Discounts: None
Shrewsbury
Residential Water Rates: Residential Sewer Rates:
Last adjusted: November 2012 Last adjusted: January 2016 Next adjustment scheduled: Unknown Next adjustment scheduled: Unknown Fund: No Response Fund: No Response
Minimum bill includes 5 kgal $24.00/bill Base charge $30.00/bill >5 – 25 kgal $ 3.70/kgal All units $ 7.50/kgal >25 – 60 kgal $ 6.90/ " >60 kgal $14.00/ " Based on 100% of water usage. Billing Frequency: Quarterly
Annual Cost
AWWA Standard for Historical Comparison
(120 HCF ≈ 90,000 gals.)
Water $355.00 Sewer $795.00 Combined $1,150.00 % change from 2015 0.0%
Commercial Water Rates:
Commercial Sewer Rates:
Minimum includes 5 kgal $40.00/bill Base charge $30.00/bill 5 – 25 kgal $ 3.30/kgal All units $ 9.30/kgal >25 kgal $ 4.30/ " Senior and/or Low Income Discounts: No response
The rates cited above exclude a 10% discount for all residential water (not sewer) bills paid within 20 days of the bill date.
MWRA Advisory Board 2016 Water & Sewer Retail Rate Survey
Section II Page 12

Springfield
Residential Water Rates: Residential Sewer Rates:
Last adjusted: July 2015 Last adjusted: July 2015 Next adjustment scheduled: July 2016 Next adjustment scheduled: July 2016 Fund: Chapter 40N Fund: Chapter 40N
Service charge (⅝" meter) $2.50/month All units $4.74/HCF All units $2.89/HCF Based on 100% of water usage.
Billing Frequency: Monthly
Annual Cost
AWWA Standard for Historical Comparison
(120 HCF ≈ 90,000 gals.)
Water $376.80 Sewer $568.80 Combined $945.60 % change from 2015 3.8%
Commercial Water Rates:
Commercial Sewer Rates:
Same as residential All units
$5.01/HCF
Senior and/or Low Income Discounts: $2.50/month discount for senior citizens, disabled or legally blind persons
Tewksbury
Residential Water Rates: Residential Sewer Rates:
Last adjusted: July 2016 Last adjusted: July 2016 Next adjustment scheduled: July 2017 Next adjustment scheduled: July 2017 Fund: Enterprise Fund: Enterprise
1 – 34 kgal/year $ 7.29/kgal 1 – 34 kgal/year $ 7.23/kgal >34 – 70 kgal/year $10.31 " >34 – 70 kgal/year $ 9.31 " >70 – 140 kgal/year $13.71 " >70 – 140 kgal/year $13.20 " >140 kgal/year $17.13 " >140 kgal/year $15.44 " Based on 100% of water usage. Billing Frequency: Trianually
Annual Cost
AWWA Standard for Historical Comparison
(120 HCF ≈ 90,000 gals.)
Water $887.82 Sewer $844.98 Combined $1,738.20 % change from 2015 -0.9%
Commercial Water Rates:
Commercial Sewer Rates:
Same as residential Same as residential
Senior and/or Low Income Discounts: None
MWRA Advisory Board 2016 Water & Sewer Retail Rate Survey
Section II Page 13

COMPARATIVE RESIDEN
TIAL 2016
WATER AND SEW
ER CHARGES FOR U.S. CITIES
Flin
t ●
MWRA Advisory Board 2016 Water & Sewer Retail Rate Survey
Section III Page 1
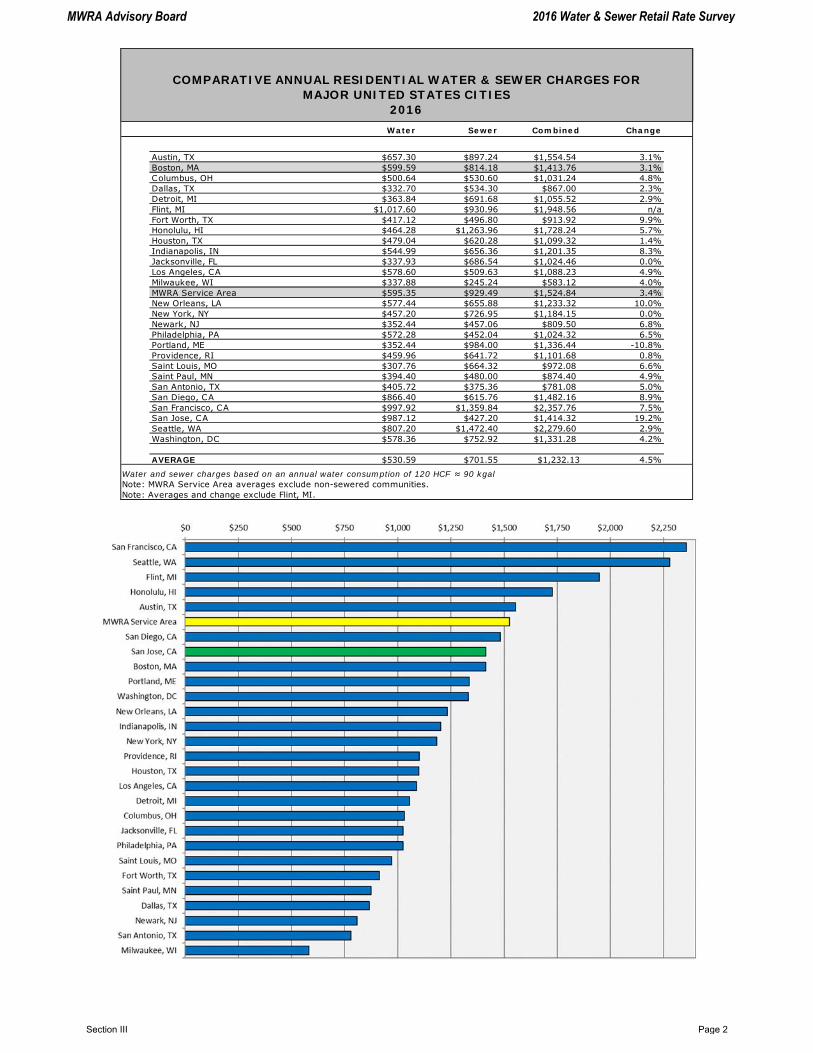
Water Sewer Combined Change
Austin, TX $657.30 $897.24 $1,554.54 3.1%Boston, MA $599.59 $814.18 $1,413.76 3.1%Columbus, OH $500.64 $530.60 $1,031.24 4.8%Dallas, TX $332.70 $534.30 $867.00 2.3%Detroit, MI $363.84 $691.68 $1,055.52 2.9%Flint, MI $1,017.60 $930.96 $1,948.56 n/aFort Worth, TX $417.12 $496.80 $913.92 9.9%Honolulu, HI $464.28 $1,263.96 $1,728.24 5.7%Houston, TX $479.04 $620.28 $1,099.32 1.4%Indianapolis, IN $544.99 $656.36 $1,201.35 8.3%Jacksonville, FL $337.93 $686.54 $1,024.46 0.0%Los Angeles, CA $578.60 $509.63 $1,088.23 4.9%Milwaukee, WI $337.88 $245.24 $583.12 4.0%MWRA Service Area $595.35 $929.49 $1,524.84 3.4%New Orleans, LA $577.44 $655.88 $1,233.32 10.0%New York, NY $457.20 $726.95 $1,184.15 0.0%Newark, NJ $352.44 $457.06 $809.50 6.8%Philadelphia, PA $572.28 $452.04 $1,024.32 6.5%Portland, ME $352.44 $984.00 $1,336.44 -10.8%Providence, RI $459.96 $641.72 $1,101.68 0.8%Saint Louis, MO $307.76 $664.32 $972.08 6.6%Saint Paul, MN $394.40 $480.00 $874.40 4.9%San Antonio, TX $405.72 $375.36 $781.08 5.0%San Diego, CA $866.40 $615.76 $1,482.16 8.9%San Francisco, CA $997.92 $1,359.84 $2,357.76 7.5%San Jose, CA $987.12 $427.20 $1,414.32 19.2%Seattle, WA $807.20 $1,472.40 $2,279.60 2.9%Washington, DC $578.36 $752.92 $1,331.28 4.2%
AVERAGE $530.59 $701.55 $1,232.13 4.5%
COMPARATIVE ANNUAL RESIDENTIAL WATER & SEWER CHARGES FOR
MAJOR UNITED STATES CITIES
2016
Water and sewer charges based on an annual water consumption of 120 HCF ≈ 90 kgalNote: MWRA Service Area averages exclude non-sewered communities.Note: Averages and change exclude Flint, MI.
MWRA Advisory Board 2016 Water & Sewer Retail Rate Survey
Section III Page 2

Austin, Texas Residential Water Rates:
Last adjusted: November 2016 Next adjustment scheduled: Unknown
Fund: Enterprise
Base charge (⅝" meter) $ 7.10/month Billing Frequency: Monthly
0 – 2 kgal $ 3.16/kgal 2 – 6 kgal $ 4.84 " 6 – 11 kgal $ 7.88 "
11 – 20 kgal $11.90 " >20 kgal $14.16 " Residential Sewer Rates:
Last adjusted: November 2016 Next adjustment scheduled: Unknown
Fund: Enterprise Base charge $10.30/month Billing Frequency: Monthly 0 – 2 kgal $ 4.90/kgal >2 kgal $ 9.94 " Based on winter average
Residential Stormwater Rates
Last adjusted: November 2016 Next adjustment scheduled: Unknown
Fund: Enterprise
All Units (per IA (Acre) Online Calculator Billing Frequency: Monthly www.AustinTexas.gov
Stormwater fee based on impervious acreage of residential units. A calculator is available online for homeowners to calculate their
stormwater fee. See Appendix G also for additional stormwater information.
Annual Cost AWWA Standard for Historical Comparison
(120 HCF ≈ 90,000 gals.)
Water $657.30 Sewer $897.24 Combined $1,554.54
% change from 2015 3.1%
Stormwater fee not included in annual rates.
Included in the cost of water is a tiered minimum charge for water usage. Based on 7.5 kgal used per month, or 90 kgal per year, that cost is $8.75 per month, or $105.00 per year.
Also included in the cost of water is a Water Revenue Stability Reserve Fund Surcharge of $0.19/kgal. Based on 7.5 kgal used per month, this is $1.42 per month, or $17.10 per year.
MWRA Advisory Board 2016 Water & Sewer Retail Rate Survey
Section III Page 3

Columbus, Ohio Residential Water Rates:
Last adjusted: January 2016 Next adjustment scheduled: Unknown
Fund: Enterprise
Base charge per bill $ 34.01 Billing Frequency: Quarterly
0 – 5 HCF $ 2.78/HCF >5 HCF $ 3.09 "
Residential Sewer Rates:
Last adjusted: January 2016 Next adjustment scheduled: Unknown Fund: Enterprise Base charge per bill $ 11.75 Billing Frequency: Quarterly
All Units $ 4.03/HCF Based on 100% of water usage.
Residential Stormwater Rates
Last adjusted: January 2016 Next adjustment scheduled: Unknown
Fund: Enterprise Billing Frequency: Quarterly
All Units $ 0.1515/ERU All Units (Clear Rivers Fee) $ 0.1089/ERU
Customers are charged based on the impervious (non-penetrable) area a property is known to have, such as pavement and
rooftops. A billing unit, called an Equivalent Residential Unit (or ERU), is equal to 2000
square feet of impervious area. Even properties that do not have a storm sewer, or water or sanitary sewer service, receive a stormwater bill. This is because all properties with impervious surface contribute to an area's
stormwater runoff. All single-family residential properties are calculated at 1 ERU and are billed the same flat daily rate.
Annual Cost AWWA Standard for Historical Comparison
(120 HCF ≈ 90,000 gals.)
Water $500.64 Sewer $530.60 Combined $1,031.24 % change from 2015 4.8%
Stormwater fee not included in annual rates.
MWRA Advisory Board 2016 Water & Sewer Retail Rate Survey
Section III Page 4

Dallas, Texas
Residential Water Rates:
Last adjusted: October 2016 Next adjustment scheduled: Unknown
Fund: Enterprise Base charge (⅝" meter) $5.25/bill Billing Frequency: Monthly
0 – 4 kgal $1.90/kgal >4 – 10 kgal $4.25 " >10 – 15 kgal $6.03 " >15 kgal $8.55 "
Residential Sewer Rates:
Last adjusted: October 2016 Next adjustment scheduled: Unknown Fund: Enterprise Base charge (⅝" meter) $4.70/bill Billing Frequency: Monthly
All units $5.31/kgal
Based on the annually adjusted average water consumed during the winter months of December, January, February, and March; 40 kgal maximum or actual consumption rate per month, whichever is less.
Residential Stormwater Rates
Last adjusted: October 2009 Next adjustment scheduled: Unknown
Fund: Enterprise
All Units (flat fee) $3.65/month Billing Frequency: Monthly
See Appendix G also for additional stormwater information.
Annual Cost
AWWA Standard for Historical Comparison
(120 HCF ≈ 90,000 gals.)
Water $332.70 Sewer $534.30 Combined $867.00
% change from 2015 2.3%
Stormwater fee not included in annual rates.
MWRA Advisory Board 2016 Water & Sewer Retail Rate Survey
Section III Page 5

Detroit, Michigan Residential Water Rates:
Last adjusted: October 2016 Next adjustment scheduled: Unknown
Fund: Enterprise Meter charge (⅝" meter) $6.82/bill Billing Frequency: Monthly
All units $2.350/HCF
Residential Sewer Rates:
Last adjusted: October 2016 Next adjustment scheduled: Unknown Fund: Enterprise
Base charge $ 5.62/bill Billing Frequency: Monthly
All units $ 5.202/HCF Based on 100% of water usage.
Residential Stormwater Rates
Last adjusted: November 2016 Next adjustment scheduled: Unknown
Fund: Enterprise
All Units $750/Impervious Acre Billing Frequency: Monthly
Residential customers are currently being phased from a flat monthly stormwater fee to a monthly fee based on impervious surface per property. Most residential customers will be
phased into the new impervious acreage rate
beginning in October 2017. See Appendix G also for additional stormwater information.
Annual Cost AWWA Standard for Historical Comparison
(120 HCF ≈ 90,000 gals.)
Water $363.84
Sewer $691.68 Combined $1,055.52 % change from 2015 2.9%
Stormwater fee not included in annual rates.
MWRA Advisory Board 2016 Water & Sewer Retail Rate Survey
Section III Page 6
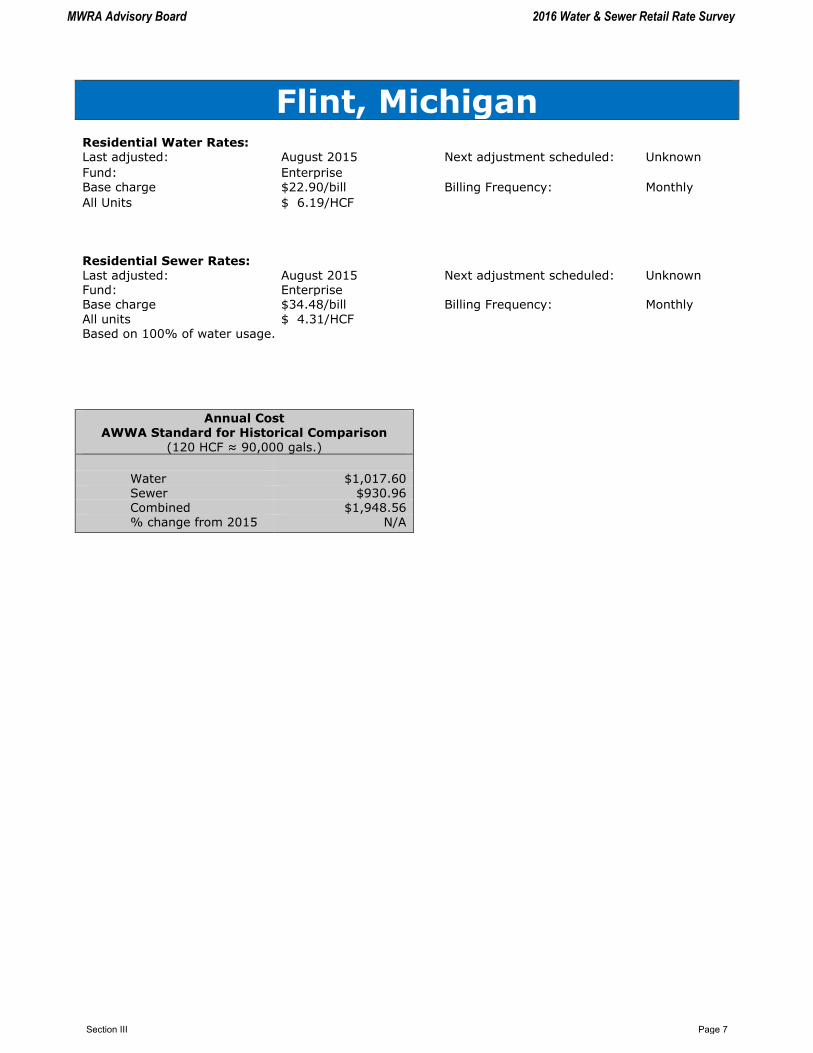
Flint, Michigan Residential Water Rates:
Last adjusted: August 2015 Next adjustment scheduled: Unknown
Fund: Enterprise Base charge $22.90/bill Billing Frequency: Monthly
All Units $ 6.19/HCF
Residential Sewer Rates:
Last adjusted: August 2015 Next adjustment scheduled: Unknown Fund: Enterprise Base charge $34.48/bill Billing Frequency: Monthly
All units $ 4.31/HCF
Based on 100% of water usage.
Annual Cost
AWWA Standard for Historical Comparison (120 HCF ≈ 90,000 gals.)
Water $1,017.60 Sewer $930.96 Combined $1,948.56 % change from 2015 N/A
MWRA Advisory Board 2016 Water & Sewer Retail Rate Survey
Section III Page 7

Fort Worth, Texas
Residential Water Rates:
Last adjusted: January 2016 Next adjustment scheduled: January 2017
Fund: Enterprise Service charge (⅝" meter) $10.50/bill Billing Frequency: Monthly
0 – 8 HCF $ 2.07/HCF >8 – 20 HCF $ 2.96 " >20 – 30 HCF $ 3.69 " >30 HCF $ 4.44 "
Residential Sewer Rates:
Last adjusted: January 2016 Next adjustment scheduled: January 2017 Fund: Enterprise
Base charge $6.50/bill Billing Frequency: Monthly
All units $3.49/HCF Based on an individual customer’s average monthly usage during the preceding months of December, January, and February.
Residential Stormwater Rates
Last adjusted: January 2012 Next adjustment scheduled: Unknown Fund: Enterprise
0.5 ERU $ 2.70/month Billing Frequency: Monthly 0.1 ERU $ 5.40/month 1.5 ERU $ 8.10/month 2.0 ERU $10.80/month See Appendix G also for additional stormwater
information.
Annual Cost AWWA Standard for Historical Comparison
(120 HCF ≈ 90,000 gals.)
Water $417.12
Sewer $496.80 Combined $913.92 % change from 2015 9.9%
Stormwater fee not included in annual rates.
MWRA Advisory Board 2016 Water & Sewer Retail Rate Survey
Section III Page 8
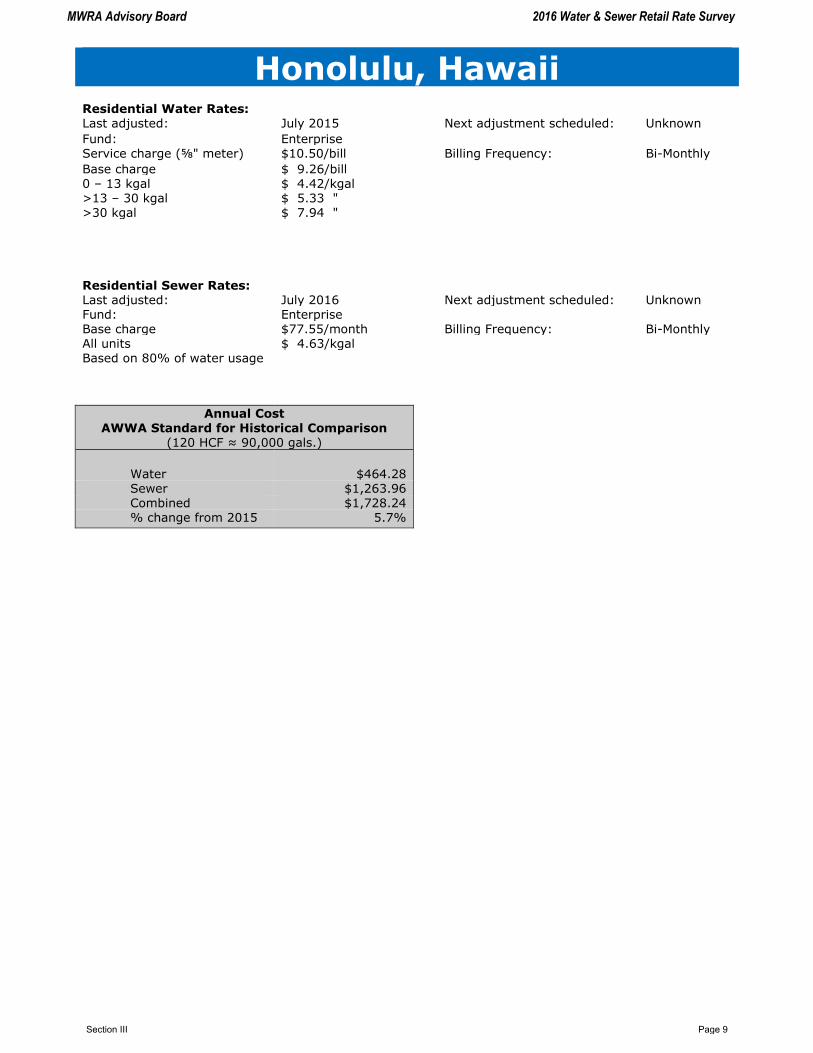
Honolulu, Hawaii
Residential Water Rates:
Last adjusted: July 2015 Next adjustment scheduled: Unknown
Fund: Enterprise Service charge (⅝" meter) $10.50/bill Billing Frequency: Bi-Monthly
Base charge $ 9.26/bill 0 – 13 kgal $ 4.42/kgal >13 – 30 kgal $ 5.33 " >30 kgal $ 7.94 "
Residential Sewer Rates:
Last adjusted: July 2016 Next adjustment scheduled: Unknown Fund: Enterprise Base charge $77.55/month Billing Frequency: Bi-Monthly
All units $ 4.63/kgal Based on 80% of water usage
Annual Cost AWWA Standard for Historical Comparison
(120 HCF ≈ 90,000 gals.)
Water $464.28 Sewer $1,263.96 Combined $1,728.24 % change from 2015 5.7%
MWRA Advisory Board 2016 Water & Sewer Retail Rate Survey
Section III Page 9

Houston, Texas
Residential Water Rates:
Last adjusted: April 2016 Next adjustment scheduled: April 2017
Fund: Enterprise Base charge (⅝" meter) $ 5.07/bill Billing Frequency: Monthly
0 – 1 kgal $ 5.20/kgal >1 – 2 kgal $11.87 " >2 – 3 kgal $12.26 " >3 – 4 kgal $23.20 " >4 – 5 kgal $27.81 "
>5 – 6 kgal $32.42 " >6 – 12 kgal $32.42 + $5.00 per
additional kgal
>12 kgal $62.42 + $8.23 per additional kgal
Residential Sewer Rates:
Last adjusted: April 2016 Next adjustment scheduled: April 2017 Fund: Enterprise Base charge $10.77/bill Billing Frequency: Monthly 0 – 1 kgal $10.94/kgal >1 – 2 kgal $11.30 "
>2 – 3 kgal $11.59 " >3 – 4 kgal $26.57 " >4 – 5 kgal $31.99 " >5 – 6 kgal $39.87 " >6 kgal $39.87 + $7.78 per
additional kgal
Based on 100% of water usage
Residential Stormwater Rates
Last adjusted: July 2011 Next adjustment scheduled: Unknown Fund: Enterprise
All Units (IA) $0.032/square foot Billing Frequency: Monthly
Stormwater fee is calculated annually (divided into monthly billing cycles).
See Appendix G also for additional stormwater information.
Annual Cost AWWA Standard for Historical Comparison
(120 HCF ≈ 90,000 gals.)
Water $479.04 Sewer $620.28 Combined $1,099.32
% change from 2015 1.4%
Stormwater fee not included in annual rates.
MWRA Advisory Board 2016 Water & Sewer Retail Rate Survey
Section III Page 10

Indianapolis, Indiana
Residential Water Rates:
Last adjusted: July 2016 Next adjustment scheduled: Unknown
Fund: Enterprise Base charge (⅝" meter) $8.68/bill Billing Frequency: Monthly
All Units $3.6736/HCF
Residential Sewer Rates:
Last adjusted: July 2016 Next adjustment scheduled: Unknown Fund: General Base charge $ 18.75/bill Billing Frequency: Monthly 0 – 10 HCF $ 4.7929/HCF >10 HCF $ 5.4281 "
Based on 100% of water usage
See Appendix G also for additional stormwater information. Annual Cost
AWWA Standard for Historical Comparison
(120 HCF ≈ 90,000 gals.)
Water $544.99 Sewer $656.36 Combined $1,201.35
% change from 2015 8.3%
Stormwater fee not included in annual rates.
MWRA Advisory Board 2016 Water & Sewer Retail Rate Survey
Section III Page 11

Jacksonville, Florida
Residential Water Rates:
Last adjusted: October 2012 Next adjustment scheduled: Unknown
Fund: Enterprise Base charge (⅝" meter) $12.60/bill Billing Frequency: Monthly
0 – 6 kgal $ 0.93/kgal >6 – 20 kgal $ 2.60 " >20 kgal $ 5.60 " Environmental (all kgal) $ 0.37 "
Residential Sewer Rates:
Last adjusted: October 2012 Next adjustment scheduled: Unknown Fund: Enterprise Base charge $ 14.10/bill Billing Frequency: Monthly 0 – 6 kgal $ 4.94/kgal
>6 – 20 kgal $ 6.02 "
Environmental 1 – 20 kgal $ 0.37 " MAXIMUM BILL $135.42 Based on 100% of water usage up to 20 kgal Residential Stormwater Rates
Last adjusted: October 2012 Next adjustment scheduled: Unknown Fund: Enterprise
0 – 1,549 square feet (IA) $2.50/month Billing Frequency: Monthly
1,550 – 4650 square feet (IA) $5.00 " > 4,650 square feet (IA) $7.50 " See Appendix G also for additional stormwater
information. Annual Cost
AWWA Standard for Historical Comparison
(120 HCF ≈ 90,000 gals.)
Water $337.93 Sewer $686.54 Combined $1,024.47 % change from 2015 0.0%
Stormwater fee not included in annual rates.
A 10% Public Service Tax, 3% Franchise Fee
and Environmental Charges (water and sewer)
are included.
MWRA Advisory Board 2016 Water & Sewer Retail Rate Survey
Section III Page 12

Los Angeles, California
Residential Water Rates:
Last adjusted: January 2016 Next adjustment scheduled: Unknown
Fund: Enterprise November 1 to May 31 Billing Frequency: Bi-Monthly
0 – 28 HCF (average rate) $4.87/HCF >28 HCF (average rate) $6.16 " June 1 to October 31 0 – 44 HCF (average rate) $4.80/HCF >44 HCF (average rate) $6.16 "
Residential Sewer Rates:
Last adjusted: July 2016 Next adjustment scheduled: July 2017 Fund: Enterprise
All units $4.51/HCF Billing Frequency: Bi-Monthly
Dry Winter Compensation factor is 84%.
Annual Cost AWWA Standard for Historical Comparison
(120 HCF ≈ 90,000 gals.)
Water $578.60 Sewer $509.63 Combined $1,088.23
% change from 2015 4.9%
The Los Angeles Department of Water and Power uses lot size, temperature zone and household size to determine the number of HCF each customer has at the first tier rate.
Residential sewer rates are based on the period with the minimum winter water used daily average times the dry winter compensation factor of 84%. Periods after July of each year have the calculated daily volume multiplied by the days in the period times $4.51/HCF.
MWRA Advisory Board 2016 Water & Sewer Retail Rate Survey
Section III Page 13

Milwaukee, Wisconsin
Residential Water Rates:
Last adjusted: November 2014 Next adjustment scheduled: Unknown
Fund: Enterprise November 1 to May 31 Billing Frequency: Quarterly
Base charge (¾" meter) $25.67/bill All units $ 1.96/HCF
Residential Sewer Rates:
Last adjusted: February 2016 Next adjustment scheduled: Unknown Fund: Enterprise Service charge $12.71/bill Billing Frequency: Quarterly
All units (volume charge) $ 1.62/HCF
Based on winter water usage Residential Stormwater Rates
Last adjusted: October 2012 Next adjustment scheduled: Unknown Fund: Enterprise
All Units $ 19.22/ERU Billing Frequency: Quarterly
For one to four unit properties the current quarterly stormwater fee is $19.22 fper 1 ERU (Equivalent Residential Unit) For all other properties the stormwater fee is
based on the total area of impervious surface
on the property. One ERU is equivalent to 1,610 square feet of impervious surface. Thus the annual fee is $0.048/square foot impervious surface [($19.22 x 4 quarters)/1610].
See Appendix G also for additional stormwater information.
Annual Cost AWWA Standard for Historical Comparison
(120 HCF ≈ 90,000 gals.)
Water $337.88 Sewer $245.24 Combined % change from 2015
$583.12 4.0%
Stormwater fee not included in annual rates.
Base charge includes fire protection fee.
MWRA Advisory Board 2016 Water & Sewer Retail Rate Survey
Section III Page 14

New Orleans, Louisana
Residential Water Rates:
Last adjusted: January 2016 Next adjustment scheduled: January 2017
Fund: Enterprise Service charge (⅝" meter) $5.94/bill Billing Frequency: Monthly
0 – 3 kgal $3.95/kgal >3 – 20 kgal $6.74 " >20 – 1,000 kgal $5.30 " >1,000 kgal $4.44 "
Residential Sewer Rates:
Last adjusted: January 2016 Next adjustment scheduled: January 2017
Fund: Enterprise
Service charge (⅝" meter) $16.98/bill Billing Frequency: Monthly All units $ 5.91/kgal Based on 85% of water usage
Annual Cost AWWA Standard for Historical Comparison
(120 HCF ≈ 90,000 gals.)
Water $577.44 Sewer $655.88 Combined $1,233.32 % change from 2015 10.0%
MWRA Advisory Board 2016 Water & Sewer Retail Rate Survey
Section III Page 15

New York, New York
Residential Water Rates:
Last adjusted: July 2015 Next adjustment scheduled: Unknown
Fund: Enterprise Minimum charge $44.10 Billing Frequency: Quarterly
All units $ 3.81/HCF
Residential Sewer Rates:
Last adjusted: July 2015 Next adjustment scheduled: Unknown Fund: Enterprise Minimum charge $70.20 Billing Frequency: Quarterly
All units $ 6.06/HCF
Based on 159% of water rate.
Annual Cost
AWWA Standard for Historical Comparison (120 HCF ≈ 90,000 gals.)
Water $457.20 Sewer $726.95
Combined $1,184.15 % change from 2015 0.0%
MWRA Advisory Board 2016 Water & Sewer Retail Rate Survey
Section III Page 16
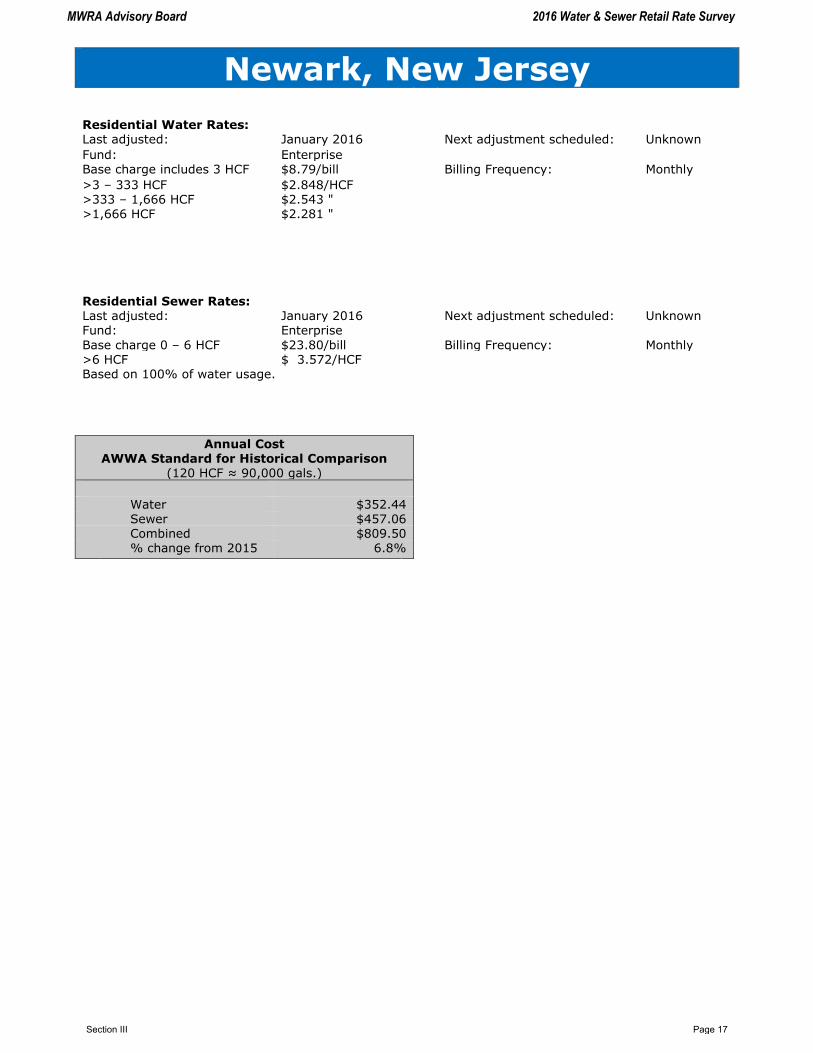
Newark, New Jersey
Residential Water Rates:
Last adjusted: January 2016 Next adjustment scheduled: Unknown
Fund: Enterprise Base charge includes 3 HCF $8.79/bill Billing Frequency: Monthly
>3 – 333 HCF $2.848/HCF >333 – 1,666 HCF $2.543 " >1,666 HCF $2.281 "
Residential Sewer Rates:
Last adjusted: January 2016 Next adjustment scheduled: Unknown
Fund: Enterprise
Base charge 0 – 6 HCF $23.80/bill Billing Frequency: Monthly >6 HCF $ 3.572/HCF Based on 100% of water usage.
Annual Cost AWWA Standard for Historical Comparison
(120 HCF ≈ 90,000 gals.)
Water $352.44 Sewer $457.06 Combined $809.50 % change from 2015 6.8%
MWRA Advisory Board 2016 Water & Sewer Retail Rate Survey
Section III Page 17

Philadelphia, Pennsylvania
Residential Water Rates:
Last adjusted: July 2016 Next adjustment scheduled: Unknown
Fund: Enterprise Base charge (⅝" meter) $6.58/bill Billing Frequency: Monthly
0 – 20 HCF $4.111/HCF >20 – 980 HCF $3.591 " >980 – 19,000 HCF $2.793 " >19,000 HCF $2.714 "
Residential Sewer Rates:
Last adjusted: July 2016 Next adjustment scheduled: Unknown Fund: Enterprise
Base charge (⅝" meter) $ 7.17/bill Billing Frequency: Monthly
All units $ 3.055/HCF Based on 100% of water usage
Residential Stormwater Rates
Last adjusted: Unknown Next adjustment scheduled: Unknown
Fund: Enterprise
All Units (per IA (Acre) Online Calculator Billing Frequency: Monthly www.Phila.gov
Residential stormwater customers pay a standard amount based on the average surface area of impervious cover on residential
properties throughout the city.
See Appendix G also for additional stormwater information.
Annual Cost AWWA Standard for Historical Comparison
(120 HCF ≈ 90,000 gals.)
Water $572.28 Sewer $452.04 Combined $1,024.32 % change from 2015 6.5%
Stormwater fee not included in annual rates.
MWRA Advisory Board 2016 Water & Sewer Retail Rate Survey
Section III Page 18

Portland, Maine
Residential Water Rates:
Last adjusted: May 2016 Next adjustment scheduled: Unknown
Fund: Enterprise Minimum charge (⅝" meter)
includes 1 HCF $9.03/bill
Billing Frequency: Monthly
>1 – 30 HCF $2.26/HCF >30 – 100 HCF $1.90 " >100 – 500 HCF $1.68 " >500 HCF $0.94 "
Residential Sewer Rates:
Last adjusted: May 2016 Next adjustment scheduled: Unknown
Fund: Enterprise Minimum charge (⅝" meter)
includes 1 HCF $8.20/bill
Billing Frequency: Monthly
>1 $8.20/HCF Based on 100% of water usage.
Annual Cost AWWA Standard for Historical Comparison
(120 HCF ≈ 90,000 gals.)
Water $352.44 Sewer $984.00
Combined $1,336.44 % change from 2015 -10.8%
MWRA Advisory Board 2016 Water & Sewer Retail Rate Survey
Section III Page 19
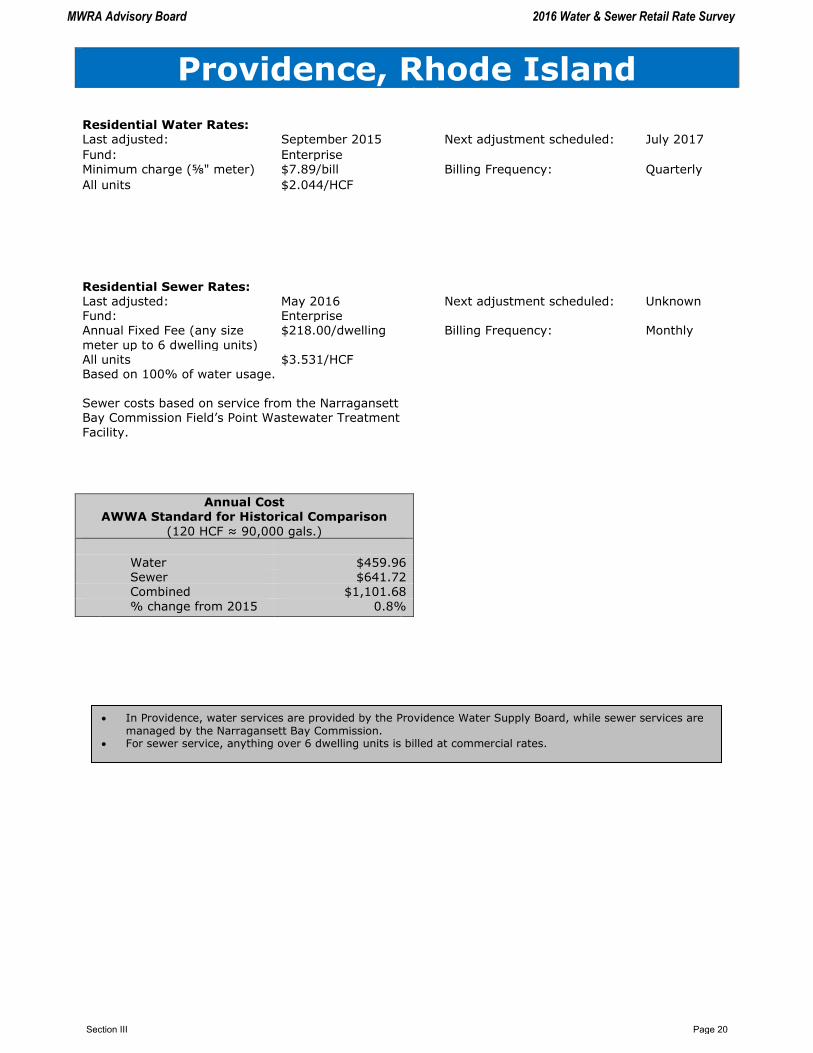
Providence, Rhode Island
Residential Water Rates:
Last adjusted: September 2015 Next adjustment scheduled: July 2017
Fund: Enterprise Minimum charge (⅝" meter) $7.89/bill Billing Frequency: Quarterly
All units $2.044/HCF
Residential Sewer Rates:
Last adjusted: May 2016 Next adjustment scheduled: Unknown Fund: Enterprise
Annual Fixed Fee (any size
meter up to 6 dwelling units)
$218.00/dwelling Billing Frequency: Monthly
All units $3.531/HCF Based on 100% of water usage. Sewer costs based on service from the Narragansett Bay Commission Field’s Point Wastewater Treatment
Facility.
Annual Cost AWWA Standard for Historical Comparison
(120 HCF ≈ 90,000 gals.)
Water $459.96 Sewer $641.72 Combined $1,101.68
% change from 2015 0.8%
In Providence, water services are provided by the Providence Water Supply Board, while sewer services are managed by the Narragansett Bay Commission.
For sewer service, anything over 6 dwelling units is billed at commercial rates.
MWRA Advisory Board 2016 Water & Sewer Retail Rate Survey
Section III Page 20

Saint Louis, Missouri
Residential Water Rates:
Last adjusted: July 2010 Next adjustment scheduled: Unknown
Fund: Enterprise Base charge (⅝" meter) $23.84 Billing Frequency: Quarterly
0 – 250 HCF $ 1.77/HCF >250 – 20,000 HCF $ 1.38 " >20,000 HCF $ 1.04 "
Residential Sewer Rates:
Last adjusted: July 2016 Next adjustment scheduled: July 2017
Fund: Special Revenue Base charge $19.46/bill Billing Frequency: Monthly All units $ 3.59/HCF Based on 100% of water usage. .
Annual Cost AWWA Standard for Historical Comparison
(120 HCF ≈ 90,000 gals.)
Water $307.76
Sewer $664.32 Combined $972.08 % change from 2015 6.6%
Saint Louis offers flat rates for domestic use based on such factors as the number of rooms and bathrooms within each residence. Utilization of the flat rate structure provides for unlimited water usage within each participating household. For the purposes of the MWRA Advisory Board Retail Rate Survey, charges are based upon the metered rates as specified within the City of Saint Louis Ordinance #68694.
The stormwater fee that existed in prior years was removed due to a legal decision.
MWRA Advisory Board 2016 Water & Sewer Retail Rate Survey
Section III Page 21

Saint Paul, Minnesota
Residential Water Rates:
Last adjusted: January 2016 Next adjustment scheduled: January 2017
Fund: Enterprise Service Base Fee (<1") $15.00/quarter Billing Frequency: Quarterly
Right of Way Recovery Fee $ 4.50/" Winter – December to May: All units $2.52/HCF Summer – June to
November:
All units $2.62/HCF Annual testing charge $6.36/household
Residential Sewer Rates:
Last adjusted: January 2016 Next adjustment scheduled: January 2017 Fund: Enterprise Service Base Fee $3.00/quarter Billing Frequency: Quarterly 0 – 1,000 HCF $3.77/HCF >1,000 – 5,000 HCF $3.69 "
>5,000 HCF $3.62 " Minimum charge of $7.20 for 1" and smaller meters.
Based on 100% of water usage
Residential Stormwater Rates
Last adjusted: January 2016 Next adjustment scheduled: Unknown
Fund: Enterprise
All Units $ 88.35/year Billing Frequency: Quarterly
Annual stormwater rate for condominiums and town homes is $59.43.
See Appendix G also for additional stormwater information.
Annual Cost AWWA Standard for Historical Comparison
(120 HCF ≈ 90,000 gals.)
Water $394.40 Sewer $480.00
Combined $874.40
% change from 2015
4.9%
Stormwater fee not included in annual rates.
MWRA Advisory Board 2016 Water & Sewer Retail Rate Survey
Section III Page 22

San Antonio, Texas Residential Water Rates:
Last adjusted: January 2016 Next adjustment scheduled: January 2017
Fund: Enterprise Billing Frequency: Monthly
Base charge (⅝" meter) $10.72/bill Water Supply Fee 0 – 2.992 kgal $0.892/kgal >2.992 – 4.489 kgal $1.561 " >4.489 – 5.985 kgal $2.007 " >5.985 – 7.481 kgal $2.454 " >7.481 – 10.473 kgal $2.900 "
>10.473 – 14.962 kgal $3.346 " >14.962 – 20.119 kgal $4.015 " >20.119 kgal $5.798 " Monthly Volume Charge:
0 – 2.992 kgal $0.619/kgal >2.992 – 4.489 kgal $1.083 "
>4.489 – 5.985 kgal $1.391 " >5.985 – 7.481 kgal $1.701 " >7.481 – 10.473 kgal $2.010 " >10.473 – 14.962 kgal $2.320 " >14.962 – 20.119 kgal $2.784 " >20.119 kgal $4.020 "
EAA Fee: $0.3311/kgal Texas Commission on Environmental Quality Fee:
$0.18/monthy
Residential Sewer Rates:
Last adjusted: January 2016 Next adjustment scheduled: January 2017
Fund: Enterprise Minimum charge includes 1.496 kgal $12.69
Billing Frequency: Monthly
>1.496 kgal $ 0.00/kgal >1.496 – 2.992 HCF $ 3.153 " >2.992 HCF $ 4.729 "
Based on winter usage.
Residential Stormwater Rates: Last adjusted: January 2016 Next adjustment scheduled: January 2017 Fund: Enterprise
≤2,750 Sq. Ft. IA $3.22 Billing Frequency: Monthly >2,750 - 4,220 Sq. Ft. IA $4.25 >4,220 Sq. Ft. IA $8.98
See Appendix G also for additional stormwater information.
Annual Cost
AWWA Standard for Historical Comparison (120 HCF ≈ 90,000 gals.)
Water $405.72 Sewer $375.36
Combined $781.08
% change from 2015
5.0%
Stormwater fee not included in annual rates.
San Antonio has two water systems; the water rates cited are provided by the San Antonio Water System.
MWRA Advisory Board 2016 Water & Sewer Retail Rate Survey
Section III Page 23

San Diego, California
Residential Water Rates:
Last adjusted: August 2016 Next adjustment scheduled: Unknown
Fund: Enterprise Base charge (⅝" meter) $47.84/bill Billing Frequency: Bi-Monthly
0 – 8 HCF/month $ 4.504/HCF >8 – 24 HCF/month $ 5.044 " >24 – 36 HCF/month $ 7.206 " >36 HCF/month $10.134 "
Residential Sewer Rates:
Last adjusted: March 2012 Next adjustment scheduled: Unknown Fund: Special Revenue Base charge $ 30.66/bill Billing Frequency: Bi-Monthly
All units $ 3.5983/HCF
Charge for SRF customers without winter use history $95.43
Based on a cap of 9 HCF.
Residential Stormwater Rates
Last adjusted: Unknown Next adjustment scheduled: Unknown
Fund: Enterprise All Units $0.95/month Billing Frequency: Monthly
See Appendix G also for additional stormwater information.
Annual Cost
AWWA Standard for Historical Comparison (120 HCF ≈ 90,000 gals.)
Water $866.40 Sewer $615.76 Combined $1,482.16 % change from 2015 8.9%
Stormwater fee not included in annual rates.
MWRA Advisory Board 2016 Water & Sewer Retail Rate Survey
Section III Page 24

San Francisco, California
Residential Water Rates:
Last adjusted: July 2016 Next adjustment scheduled: July 2017
Fund: Enterprise Base charge (⅝" meter) $10.86 Billing Frequency: Monthly
0 – 4 HCF/month $ 6.00/HCF >4 HCF/month $ 8.05 "
Residential Sewer Rates:
Last adjusted: July 2016 Next adjustment scheduled: July 2017 Fund: Special Revenue 0 – 3 HCF/dwelling unit/mo $10.84/HCF Billing Frequency: Monthly >3 HCF $11.66 "
Based on 90% of water usage.
Annual Cost AWWA Standard for Historical Comparison
(120 HCF ≈ 90,000 gals.)
Water $997.92
Sewer $1,359.84 Combined $2,357.76 % change from 2015 7.5%
San Francisco calculates its bills bi-monthly, but bills its customers every month. San Francisco reports that single-family residential customers have an average use of 72 HCF/year. At this level, annual costs per household would be $611.52 (water) and $800.16 (sewer).
While multiple family dwelling units in San Francisco vary widely in water usage, a dwelling unit consuming 48 HCF/year would have an annual water bill of $418.32 and an annual sewer bill of $520.32.
MWRA Advisory Board 2016 Water & Sewer Retail Rate Survey
Section III Page 25
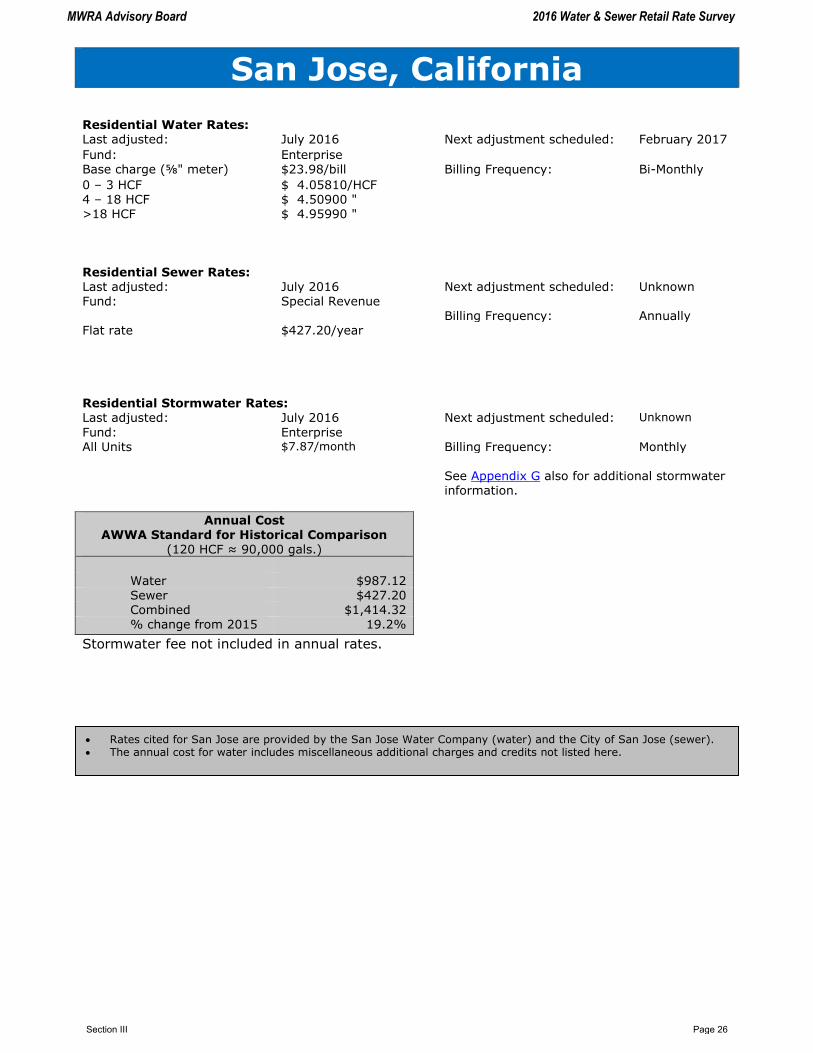
San Jose, California
Residential Water Rates:
Last adjusted: July 2016 Next adjustment scheduled: February 2017
Fund: Enterprise Base charge (⅝" meter) $23.98/bill Billing Frequency: Bi-Monthly
0 – 3 HCF $ 4.05810/HCF 4 – 18 HCF >18 HCF
$ 4.50900 " $ 4.95990 "
Residential Sewer Rates:
Last adjusted: July 2016 Next adjustment scheduled: Unknown Fund: Special Revenue Billing Frequency: Annually
Flat rate $427.20/year
Residential Stormwater Rates:
Last adjusted: July 2016 Next adjustment scheduled: Unknown
Fund: Enterprise All Units $7.87/month Billing Frequency: Monthly
See Appendix G also for additional stormwater information.
Annual Cost AWWA Standard for Historical Comparison
(120 HCF ≈ 90,000 gals.)
Water $987.12 Sewer $427.20 Combined $1,414.32 % change from 2015 19.2%
Stormwater fee not included in annual rates.
Rates cited for San Jose are provided by the San Jose Water Company (water) and the City of San Jose (sewer). The annual cost for water includes miscellaneous additional charges and credits not listed here.
MWRA Advisory Board 2016 Water & Sewer Retail Rate Survey
Section III Page 26

Seattle, Washington
Residential Water Rates:
Last adjusted: January 2016 Next adjustment scheduled: January 2017
Fund: Enterprise Base charge (¾" meter) $14.15/month Billing Frequency: Bi-Monthly
Winter – September 16 to May 15:
All units $ 5.06 /HCF Summer – May 16
To September 15:
0 – 5 HCF $ 5.20/HCF 5 – 18 HCF $ 6.43 " >18 HCF $11.80 "
Residential Sewer Rates:
Last adjusted: January 2016 Next adjustment scheduled: January 2017 Fund: Enterprise All units $12.27/HCF Billing Frequency: Bi-Monthly All units $ 3.5983/HCF Summer residential sewer bills are based on their prior winter water use or their actual summer use,
whichever is less. Summer non-residential and multi-family bills are based on 100% of annual water consumption
Residential Stormwater Rates
Last adjusted: January 2016 Next adjustment scheduled: January 2017
Fund: Enterprise All Units $198.83/year Billing Frequency: Annually
See Appendix G also for additional stormwater information.
Annual Cost AWWA Standard for Historical Comparison
(120 HCF ≈ 90,000 gals.)
Water $807.20 Sewer $1,472.40 Combined $2,279.60 % change from 2015 2.9%
Stormwater fee not included in annual rates.
Seattle reports that the typical single-family residential customer uses 60 HCF/year of water and 51.6 HCF/year of sewer. The annual cost for service at this level of usage would be $476.2 (water) and $633.13 (sewer).
MWRA Advisory Board 2016 Water & Sewer Retail Rate Survey
Section III Page 27
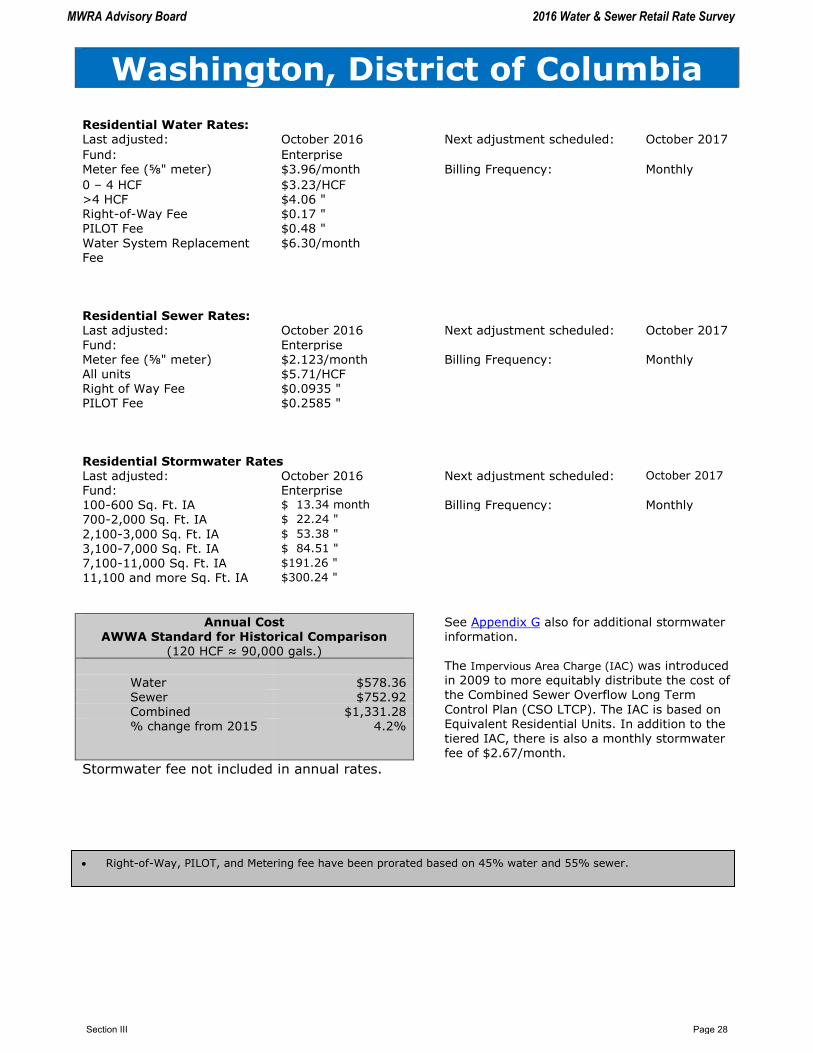
Washington, District of Columbia
Residential Water Rates:
Last adjusted: October 2016 Next adjustment scheduled: October 2017
Fund: Enterprise Meter fee (⅝" meter) $3.96/month Billing Frequency: Monthly
0 – 4 HCF $3.23/HCF >4 HCF $4.06 " Right-of-Way Fee $0.17 " PILOT Fee $0.48 "
Water System Replacement Fee
$6.30/month
Residential Sewer Rates:
Last adjusted: October 2016 Next adjustment scheduled: October 2017
Fund: Enterprise Meter fee (⅝" meter) $2.123/month Billing Frequency: Monthly All units $5.71/HCF Right of Way Fee $0.0935 " PILOT Fee $0.2585 "
Residential Stormwater Rates
Last adjusted: October 2016 Next adjustment scheduled: October 2017
Fund: Enterprise 100-600 Sq. Ft. IA $ 13.34 month Billing Frequency: Monthly 700-2,000 Sq. Ft. IA $ 22.24 "
2,100-3,000 Sq. Ft. IA $ 53.38 " 3,100-7,000 Sq. Ft. IA $ 84.51 "
7,100-11,000 Sq. Ft. IA $191.26 " 11,100 and more Sq. Ft. IA $300.24 "
Annual Cost AWWA Standard for Historical Comparison
(120 HCF ≈ 90,000 gals.)
See Appendix G also for additional stormwater information. The Impervious Area Charge (IAC) was introduced in 2009 to more equitably distribute the cost of the Combined Sewer Overflow Long Term
Control Plan (CSO LTCP). The IAC is based on Equivalent Residential Units. In addition to the tiered IAC, there is also a monthly stormwater fee of $2.67/month.
Water $578.36 Sewer $752.92 Combined $1,331.28 % change from 2015 4.2%
Stormwater fee not included in annual rates.
Right-of-Way, PILOT, and Metering fee have been prorated based on 45% water and 55% sewer.
MWRA Advisory Board 2016 Water & Sewer Retail Rate Survey
Section III Page 28
APPENDIX A
NOTE: The Advisory Board endeavors to portray the most accurate information possible at time of print. As a result, some 2015 rates and calculations may differ from the information published in the 2015 Retail Rate Survey to reflect more accurate information obtained since that time.
2015 WATER & SEWER RETAIL RATE INFORMATION
MWRA Advisory Board 2016 Water & Sewer Retail Rate Survey
Appendix A Page 1

Water Sewer Combined Change
Arlington (W/S)* $611.20 $730.04 $1,341.24 0.0%Ashland (S) $452.80 $1,495.60 $1,948.40 4.0%Bedford (S/partial W) $631.00 $1,053.00 $1,684.00 7.7%Belmont (W/S) $819.72 $1,529.20 $2,348.92 3.7%Boston (W/S) $599.59 $771.02 $1,370.61 5.1%Braintree (S) $508.60 $769.00 $1,277.60 4.5%Brookline (W/S) $677.80 $960.60 $1,638.40 6.3%Burlington (S) $196.50 $391.50 $588.00 0.0%Cambridge (S/partial W) $380.00 $1,147.60 $1,527.60 5.0%Canton (S/partial W) $610.00 $1,013.60 $1,623.60 0.0%Chelsea (W/S) $511.20 $973.20 $1,484.40 2.0%Chicopee (W) $417.60 $721.69 $1,139.29 11.3%Clinton (W/S) $343.60 $257.70 $601.30 0.0%Dedham (S/partial W) $616.56 $937.28 $1,553.84 0.8%Everett (W/S) $268.80 $733.20 $1,002.00 0.4%Framingham (W/S) $740.64 $894.12 $1,634.76 5.9%Hingham (S) $939.68 $1,110.00 $2,049.68 0.0%Holbrook (S) $636.00 $834.00 $1,470.00 9.3%Leominster (partial W) $455.84 $508.76 $964.60 0.0%Lexington (W/S) $501.60 $978.00 $1,479.60 -1.9%Lynn (partial W) $423.72 $777.84 $1,201.56 2.5%Malden (W/S) $664.92 $771.24 $1,436.16 10.9%Marblehead (W) $624.00 $1,069.00 $1,693.00 -1.2%Marlborough (partial W) $826.80 $853.20 $1,680.00 23.0%Medford (W/S) $727.20 $908.40 $1,635.60 0.0%Melrose (W/S) $870.40 $1,184.28 $2,054.68 5.8%Milton (W/S) $761.04 $1,277.52 $2,038.56 3.2%Nahant (W)* $834.00 $1,066.80 $1,900.80 1.5%Natick (S) $342.00 $1,037.60 $1,379.60 2.0%Needham (S/partial W) $471.60 $1,114.80 $1,586.40 1.5%Newton (W/S) $824.00 $1,185.00 $2,009.00 4.6%Northborough (partial W) $587.08 $911.52 $1,498.60 11.3%Norwood (W/S) $600.12 $829.08 $1,429.20 7.8%Peabody (partial W) $306.00 $409.80 $715.80 0.0%Quincy (W/S) $710.40 $1,090.32 $1,800.72 5.3%Randolph (S) $597.80 $918.00 $1,515.80 2.8%Reading (W/S) $1,059.60 $1,171.20 $2,230.80 -4.9%Revere (W/S) $458.40 $1,452.00 $1,910.40 1.9%Saugus (W) $580.40 $354.40 $934.80 3.1%Somerville (W/S) $645.03 $1,008.36 $1,653.39 11.0%Stoneham (W/S) $720.00 $1,086.00 $1,806.00 1.7%Stoughton (S/partial W) $540.48 $1,152.00 $1,692.48 0.7%Swampscott (W) $788.00 $689.00 $1,477.00 0.0%Wakefield (S/partial W) $610.20 $1,128.60 $1,738.80 0.0%Walpole (S) $658.56 $792.86 $1,451.42 6.2%Waltham (W/S) $428.64 $753.00 $1,181.64 0.0%Watertown (W/S) $565.08 $967.20 $1,532.28 3.7%Wellesley (S/partial W) $445.68 $1,011.60 $1,457.28 0.0%Westwood (S/partial W) $616.56 $828.00 $1,444.56 1.8%Weymouth (S) $602.16 $1,006.72 $1,608.88 2.6%Wilbraham (W) $494.40 $492.00 $986.40 3.4%Wilmington (S/partial W) $449.60 $598.80 $1,048.40 0.0%Winchester (S/partial W)* $275.60 $313.20 $588.80 0.0%Winthrop (W/S) $726.00 $1,188.00 $1,914.00 0.0%Woburn (S/partial W) $205.00 $328.00 $533.00 0.0%Worcester (partial W) $432.00 $635.52 $1,067.52 3.8%
AVERAGE $578.41 $895.89 $1,474.31 3.2%
Combined Annual Water and Sewer Charges for
Communities Receiving Services from the MWRA
2015Charges include MWRA, community, and alternatively supplied services.
Rates based on average annual household use of 120 hundred cubic feet (HCF), or approximately 90,000 gallons.
The following communities do not provide municipal sewer services and, therefore, are not listed: Lynnfield Water District, South Hadley Fire District #1, Southborough and Weston. (*) Indicates communities that utilize the debt service exclusion as permitted under General Law 59 Section 21C(n).
MWRA Advisory Board 2016 Water & Sewer Retail Rate Survey
Appendix A Page 2
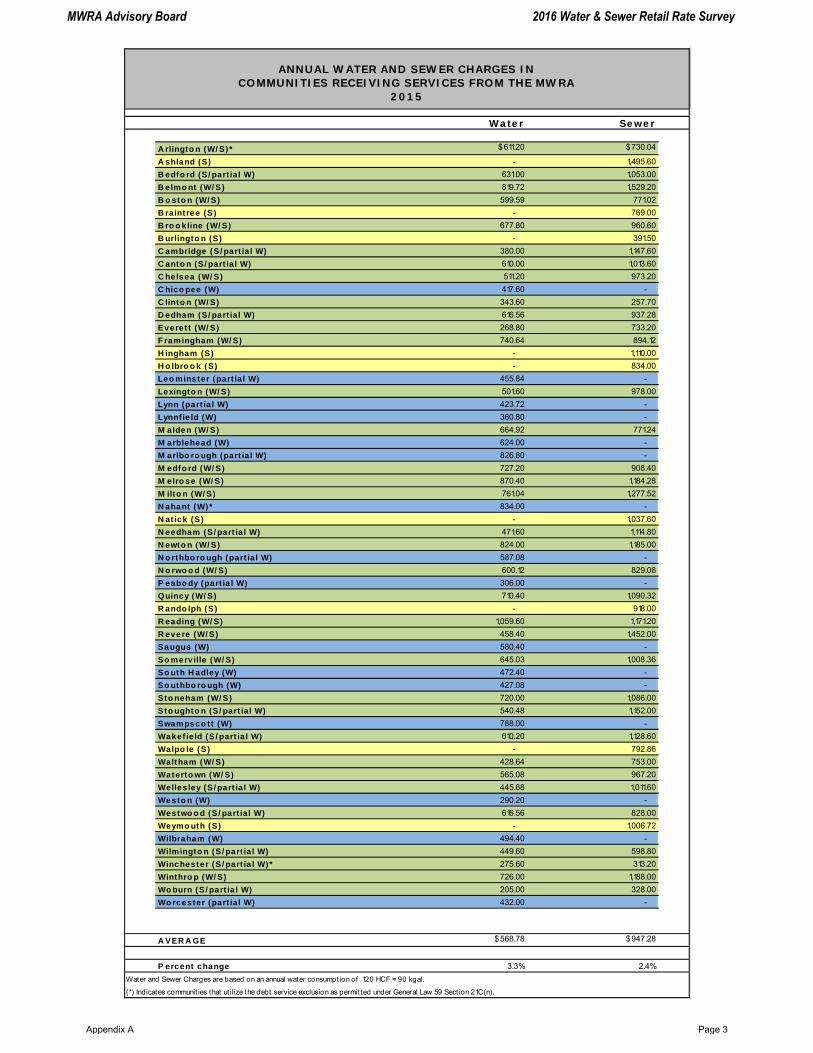
Water Sewer
A rlingto n (W/ S)* $611.20 $730.04
A shland (S) - 1,495.60
B edfo rd (S/ part ial W) 631.00 1,053.00
B elmo nt (W/ S) 819.72 1,529.20
B o sto n (W/ S) 599.59 771.02
B raintree (S) - 769.00
B ro o kline (W/ S) 677.80 960.60
B urlingto n (S) - 391.50
C ambridge (S/ part ia l W) 380.00 1,147.60
C anto n (S/ part ia l W) 610.00 1,013.60
C helsea (W/ S) 511.20 973.20
C hico pee (W) 417.60 -
C linto n (W/ S) 343.60 257.70
D edham (S/ part ial W) 616.56 937.28
Everett (W/ S) 268.80 733.20
F ramingham (W/ S) 740.64 894.12
H ingham (S) - 1,110.00
H o lbro o k (S) - 834.00
Leo minster (part ial W) 455.84 -
Lexingto n (W/ S) 501.60 978.00
Lynn (part ia l W) 423.72 -
Lynnf ie ld (W) 360.80 -
M alden (W/ S) 664.92 771.24
M arblehead (W) 624.00 -
M arlbo ro ugh (part ia l W) 826.80 -
M edfo rd (W/ S) 727.20 908.40
M elro se (W/ S) 870.40 1,184.28
M ilto n (W/ S) 761.04 1,277.52
N ahant (W)* 834.00 -
N atick (S) - 1,037.60
N eedham (S/ part ia l W) 471.60 1,114.80
N ewto n (W/ S) 824.00 1,185.00
N o rthbo ro ugh (part ial W) 587.08 -
N o rwo o d (W/ S) 600.12 829.08
P eabo dy (part ia l W) 306.00 -
Quincy (W/ S) 710.40 1,090.32
R ando lph (S) - 918.00
R eading (W/ S) 1,059.60 1,171.20
R evere (W/ S) 458.40 1,452.00
Saugus (W) 580.40 -
So merville (W/ S) 645.03 1,008.36
So uth H adley (W) 472.40 -
So uthbo ro ugh (W) 427.08 -
Sto neham (W/ S) 720.00 1,086.00
Sto ughto n (S/ part ial W) 540.48 1,152.00
Swampsco tt (W) 788.00 -
Wakef ie ld (S/ part ia l W) 610.20 1,128.60
Walpo le (S) - 792.86
Waltham (W/ S) 428.64 753.00
Waterto wn (W/ S) 565.08 967.20
Wellesley (S/ part ia l W) 445.68 1,011.60
Westo n (W) 290.20 -
Westwo o d (S/ part ia l W) 616.56 828.00
Weymo uth (S) - 1,006.72
Wilbraham (W) 494.40 -
Wilmingto n (S/ part ia l W) 449.60 598.80
Winchester (S/ part ia l W)* 275.60 313.20
Winthro p (W/ S) 726.00 1,188.00
Wo burn (S/ part ia l W) 205.00 328.00
Wo rcester (part ial W) 432.00 -
A VER A GE $568.78 $947.28
P ercent change 3.3% 2.4%
ANNUAL WATER AND SEWER CHARGES IN
COMMUNITIES RECEIVING SERVICES FROM THE MWRA
2015
Water and Sewer Charges are based on an annual water consumption of 120 HCF ≈ 90 kgal.
(*) Indicates communit ies that ut ilize the debt service exclusion as permitted under General Law 59 Sect ion 21C(n).
MWRA Advisory Board 2016 Water & Sewer Retail Rate Survey
Appendix A Page 3

Water Sewer Combined Change
Abington $618.00 $640.00 $1,258.00 0.0%Agawam $317.20 $376.32 $693.52 9.9%Ayer $336.40 $872.80 $1,209.20 6.6%Beverly $427.20 $673.20 $1,100.40 2.5%Brockton $443.40 $446.00 $889.40 0.0%Danvers $744.60 $770.40 $1,515.00 0.0%Fairhaven $618.25 $774.00 $1,392.25 0.0%Fall River $366.00 $514.80 $880.80 2.8%Fitchburg $367.44 $839.40 $1,206.84 0.0%Gloucester $630.00 $1,242.00 $1,872.00 5.2%Haverhill $333.60 $494.40 $828.00 4.4%Holyoke $387.81 $486.00 $873.81 0.0%Hudson $471.60 $634.80 $1,106.40 0.0%Lawrence $372.00 $402.00 $774.00 0.0%Lowell $249.12 $410.16 $659.28 4.3%Medfield $425.32 $623.32 $1,048.64 4.3%New Bedford $297.99 $568.00 $865.99 0.0%North Reading $747.20 Not sewered $747.20 7.8%Salem $350.40 $715.20 $1,065.60 2.3%Shrewsbury $355.00 $795.00 $1,150.00 UnknownSpringfield $363.60 $547.20 $910.80 4.7%Tewksbury $887.82 $866.06 $1,753.88 5.5%
AVERAGE $459.54 $651.96 $1,111.50 3.4%
COMPARATIVE ANNUAL RESIDENTIAL WATER AND SEWER CHARGES FOR SELECTED
NON-MWRA COMMUNITIES IN MASSACHUSETTS
2015
Water and sewer charges based on an annual water consumption of 120 HCF ≈ 90 kgal
Average does not include unavilable data or non-sewered communities.
Water Sewer Combined Change
Austin, TX $610.56 $897.24 $1,507.80 3.9%Boston, MA 599.59 771.02 1,370.61 5.1%Columbus, OH 469.62 514.84 984.46 3.0%Dallas, TX 324.66 522.96 847.62 4.9%Detroit, MI 352.44 673.80 1,026.24 7.2%Fort Worth, TX 389.76 441.60 831.36 5.8%Honolulu, HI 464.28 1,170.60 1,634.88 6.3%Houston, TX 472.38 611.58 1,083.96 4.4%Indianapolis, IN 469.08 640.10 1,109.18 -0.6%Jacksonville, FL 337.93 686.54 1,024.46 0.0%Los Angeles, CA 578.40 458.67 1,037.07 1.8%Milwaukee, WI 337.88 223.08 560.96 8.1%MWRA Service Area 578.41 895.89 1,474.31 3.2%New Orleans, LA 525.06 596.09 1,121.15 4.5%New York, NY 457.20 726.95 1,184.15 3.0%Newark, NJ 326.99 431.28 758.27 8.9%Philadelphia, PA 546.12 415.44 961.56 0.0%Portland, ME 333.84 1,164.00 1,497.84 7.9%Providence, RI 459.96 632.86 1,092.82 3.2%Saint Louis, MO 307.76 604.20 911.96 8.4%Saint Paul, MN 380.76 452.40 833.16 6.3%San Antonio, TX 348.47 395.40 743.87 5.1%San Diego, CA 744.94 615.76 1,360.69 3.8%San Francisco, CA 906.36 1,287.84 2,194.20 24.9%San Jose, CA 781.45 405.05 1,186.50 4.1%Seattle, WA 793.60 1,420.80 2,214.40 0.5%Washington, DC 557.48 720.52 1,278.00 10.5%
AVERAGE $498.33 $680.61 $1,178.94 5.5%
COMPARATIVE ANNUAL RESIDENTIAL WATER & SEWER CHARGES FOR
MAJOR UNITED STATES CITIES
2015
Water and sewer charges based on an annual water consumption of 120 HCF ≈ 90 kgalNote: MWRA Service Area averages exclude non-sewered communities.
MWRA Advisory Board 2016 Water & Sewer Retail Rate Survey
Appendix A Page 4

APPENDIX B
SECOND METER INFORMATION
AND
GLOSSARY
MWRA Advisory Board 2016 Water & Sewer Retail Rate Survey
Appendix B Page 1

Number Percent
MWRA or partially supplied communities utilizing second meters to adjust water bills
YES: 38 NO: 22
YES: 63.3% NO: 36.7%
Ashland (S) Yes Arlington (W/S)* No Bedford (S/partial W) Yes Braintree (S) No Belmont (W/S) Yes Clinton (W/S) No Boston (W/S) Yes Everett (W/S) No Brookline (W/S) Yes Hingham (S) No Burlington (S) Yes Holbrook (S) No Cambridge (S/partial W) Yes Lynnfield (W) No Canton (S/partial W) Yes Malden (W/S) No Chelsea (W/S) Yes Northborough (partial W) No Chicopee (W) Yes Randolph (S) No Dedham (S/partial W) Yes Reading (W/S) No Framingham (W/S) Yes Somerville (W/S) No Leominster (partial W) Yes South Hadley (W) No Lexington (W/S) Yes Southborough (W) No Lynn (partial W) Yes Stoughton (S/partial W) No Marblehead (W) Yes Wakefield (S/partial W) No Marlborough (partial W) Yes Weston (W) No Medford (W/S) Yes Weymouth (S) No Melrose (W/S) Yes Wilmington (S/partial W) No Milton (W/S) Yes Winchester (S/partial W)* No Nahant (W)* Yes Winthrop (W/S) No Natick (S) Yes Woburn (S/partial W) No Needham (S/partial W) Yes Newton (W/S) Yes Norwood (W/S) Yes Peabody (partial W) Yes Quincy (W/S) Yes Revere (W/S) Yes Saugus (W) Yes Stoneham (W/S) Yes Swampscott (W) Yes Walpole (S) Yes Waltham (W/S) Yes Watertown (W/S) Yes Wellesley (S/partial W) Yes Westwood (S/partial W) Yes Wilbraham (W) Yes Worcester (partial W) Yes
SECOND METER INFORMATION:
MWRA Advisory Board 2016 Water & Sewer Retail Rate Survey
Appendix B Page 2

ABBREVIATIONS/DESIGNATIONS
(W/S) = MWRA Water and Sewer Community
(W) = MWRA Water Only Community
(S) = MWRA Sewer Only Community
CF = Cubic Foot
HCF = Hundred Cubic Feet
1 HCF = 100 Cubic Feet = 748 Gallons
kgal = 1,000 gallons
n/a = No answer All of the information cited below is taken directly from Massachusetts Water Resources Authority Technical Assistance Program: Municipal Water and Sewer Rate Making, A Guide for Local Officials. May, 1989. DEBT EXCLUSION A referendum to increase the levy limit by the amount of principal and interest payable each year on specific long‐term bonds issued by a community; this exclusion remains in effect for the life of the debt only. WATER AND SEWER WHOLESALE CHARGES Within the MWRA service area, these are the charges that are made by the MWRA to each community for the total amount of water and/or sewer treatment service, which is provided to that community for a fiscal year; MWRA wholesale charges constitute one component of each community's total water and sewer service costs. WATER AND SEWER RETAIL CHARGES User charges which are billed to specific properties by a municipality or public utility for the provision of water and sewer service; these charges are generally billed periodically during the year and are generally based on the metered flow of water into each property; also known as "retail rates." GENERAL FUND ‐ 6 water, 6 sewer (full and partial MWRA communities) General fund accounting for water and sewer operations is typically the most understood accounting support alternative. This option does not require adoption of any legislation. Essentially, water and sewer expenditure and revenue accounts exist with the general fund along with other community financial activity. No segregation of utility costs and revenues is provided for. General fund accounting is on the budgetary (cash) basis and period‐end or year‐end reporting is on the modified accrual basis. SPECIAL REVENUE FUND ‐ 3 water, 3 sewer (full and partial MWRA communities) A special revenue fund is defined as "a fund used to account for the proceeds of specific revenue sources (other than expendable trusts or major capital projects) that are legally restricted to expenditure for specified purposes". Special revenue fund accounting provides for segregation of water/sewer costs and revenues from other municipal financial activity. Like the general fund, special revenue fund accounting is on the budgetary (cash) basis and financial reporting is on the modified accrual basis.
GLOSSARY:
MWRA Advisory Board 2016 Water & Sewer Retail Rate Survey
Appendix B Page 3

ENTERPRISE FUND ‐ 50 water, 47 sewer (full and partial MWRA Communities) A fund established to account for operations financed and operated in a manner similar to private business enterprises. In this instance the governing body intends that costs (expenses, including depreciation) of providing goods or services to the general public on a continuing basis be recovered primarily through user charges. A fund established because the governing body has decided that periodic determination of revenues earned, expenses incurred and/or net income is appropriate for capital maintenance, public policy management control, accountability or other purposes. Like special revenue funds, enterprise funds allow communities to separately account for the expenditures and revenues of their water/sewer operations. Similarly, this segregated accounting provides enhanced information regarding the results of operations and facilitates rate setting and rate analyses. A community may elect to adopt enterprise fund(s) through city council or town meeting vote. Each enterprise fund must be adopted individually. Enterprise fund accounting is generally the most complex of the accounting alternatives. Its accounting may be on the accrual basis or budgetary (cash) basis. Reporting, however, should be on the accrual basis. Accordingly, if accounting is on the budgetary basis, year‐end accrual adjustments will be required to attain accrual basis reporting. These year‐end accrual adjustments will generally include:
Fixed asset capitalization and related depreciation
Pension liabilities
Sick, vacation and other compensated absences
Revenue
Contributed capital
Other year‐end accruals PRIVATE COMPANY ‐ 1 water A privately funded and managed business used to account for water or sewer service. In this option, the private business sets all rates and is responsible for operational costs. At this time the only privately managed water system among the surveyed MWRA communities is Hingham, operated by Aquarion Water Company.
Enterprise86%
General9%
SpecialRevenue
5%
Other0%
Sewer
Enterprise82%
General10%
Special Revenue
7%
Other
1%
Water
MWRA Advisory Board 2016 Water & Sewer Retail Rate Survey
Appendix B Page 4
APPENDIX C
2016 Residential Cost Based
on Community Water Use Data
MWRA Advisory Board 2016 Water & Sewer Retail Rate Survey
Appendix C Page 1
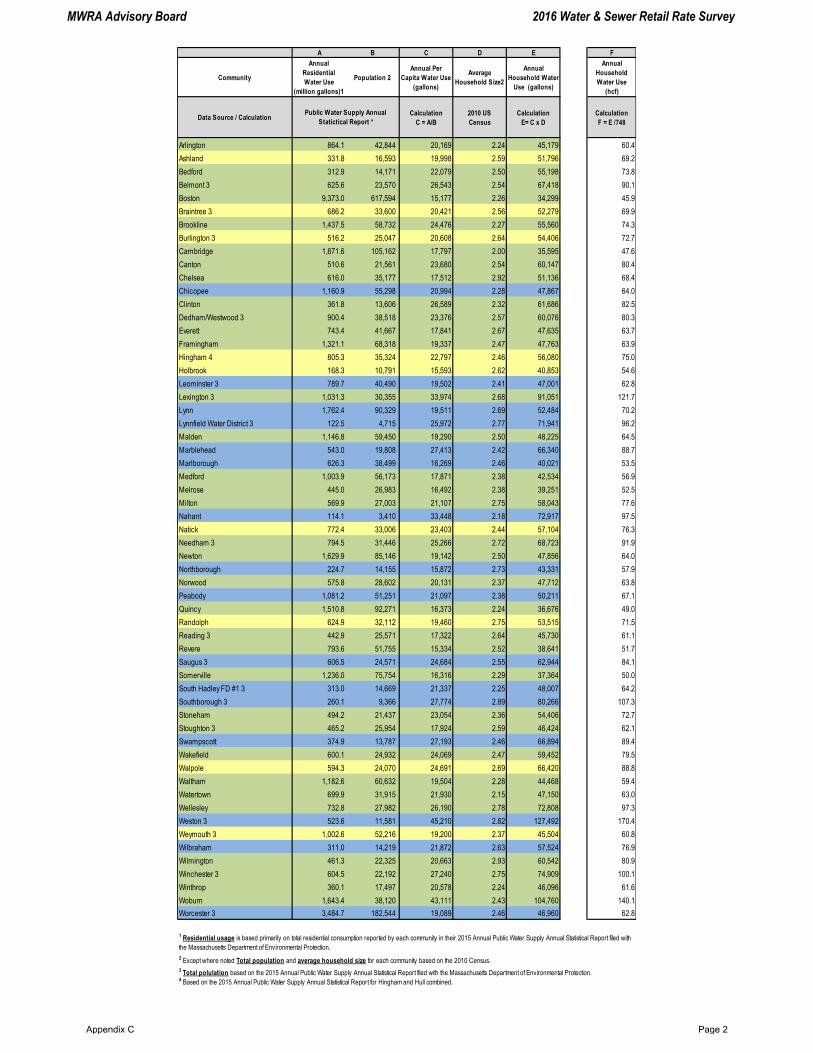
A B C D E F
Community
Annual
Residential
Water Use
(million gallons)1
Population 2
Annual Per
Capita Water Use
(gallons)
Average
Household Size2
Annual
Household Water
Use (gallons)
Annual
Household
Water Use
(hcf)
Data Source / CalculationCalculation
C = A/B
2010 US
Census
Calculation
E= C x D
Calculation
F = E /748
Arlington 864.1 42,844 20,169 2.24 45,179 60.4
Ashland 331.8 16,593 19,998 2.59 51,796 69.2
Bedford 312.9 14,171 22,079 2.50 55,198 73.8
Belmont 3 625.6 23,570 26,543 2.54 67,418 90.1
Boston 9,373.0 617,594 15,177 2.26 34,299 45.9
Braintree 3 686.2 33,600 20,421 2.56 52,279 69.9
Brookline 1,437.5 58,732 24,476 2.27 55,560 74.3
Burlington 3 516.2 25,047 20,608 2.64 54,406 72.7
Cambridge 1,871.6 105,162 17,797 2.00 35,595 47.6
Canton 510.6 21,561 23,680 2.54 60,147 80.4
Chelsea 616.0 35,177 17,512 2.92 51,136 68.4
Chicopee 1,160.9 55,298 20,994 2.28 47,867 64.0
Clinton 361.8 13,606 26,589 2.32 61,686 82.5
Dedham/Westwood 3 900.4 38,518 23,376 2.57 60,076 80.3
Everett 743.4 41,667 17,841 2.67 47,635 63.7
Framingham 1,321.1 68,318 19,337 2.47 47,763 63.9
Hingham 4 805.3 35,324 22,797 2.46 56,080 75.0
Holbrook 168.3 10,791 15,593 2.62 40,853 54.6
Leominster 3 789.7 40,490 19,502 2.41 47,001 62.8
Lexington 3 1,031.3 30,355 33,974 2.68 91,051 121.7
Lynn 1,762.4 90,329 19,511 2.69 52,484 70.2
Lynnfield Water District 3 122.5 4,715 25,972 2.77 71,941 96.2
Malden 1,146.8 59,450 19,290 2.50 48,225 64.5
Marblehead 543.0 19,808 27,413 2.42 66,340 88.7
Marlborough 626.3 38,499 16,269 2.46 40,021 53.5
Medford 1,003.9 56,173 17,871 2.38 42,534 56.9
Melrose 445.0 26,983 16,492 2.38 39,251 52.5
Milton 569.9 27,003 21,107 2.75 58,043 77.6
Nahant 114.1 3,410 33,448 2.18 72,917 97.5
Natick 772.4 33,006 23,403 2.44 57,104 76.3
Needham 3 794.5 31,446 25,266 2.72 68,723 91.9
Newton 1,629.9 85,146 19,142 2.50 47,856 64.0
Northborough 224.7 14,155 15,872 2.73 43,331 57.9
Norwood 575.8 28,602 20,131 2.37 47,712 63.8
Peabody 1,081.2 51,251 21,097 2.38 50,211 67.1
Quincy 1,510.8 92,271 16,373 2.24 36,676 49.0
Randolph 624.9 32,112 19,460 2.75 53,515 71.5
Reading 3 442.9 25,571 17,322 2.64 45,730 61.1
Revere 793.6 51,755 15,334 2.52 38,641 51.7
Saugus 3 606.5 24,571 24,684 2.55 62,944 84.1
Somerville 1,236.0 75,754 16,316 2.29 37,364 50.0
South Hadley FD #1 3 313.0 14,669 21,337 2.25 48,007 64.2
Southborough 3 260.1 9,366 27,774 2.89 80,266 107.3
Stoneham 494.2 21,437 23,054 2.36 54,406 72.7
Stoughton 3 465.2 25,954 17,924 2.59 46,424 62.1
Swampscott 374.9 13,787 27,193 2.46 66,894 89.4
Wakefield 600.1 24,932 24,069 2.47 59,452 79.5
Walpole 594.3 24,070 24,691 2.69 66,420 88.8
Waltham 1,182.6 60,632 19,504 2.28 44,468 59.4
Watertown 699.9 31,915 21,930 2.15 47,150 63.0
Wellesley 732.8 27,982 26,190 2.78 72,808 97.3
Weston 3 523.6 11,581 45,210 2.82 127,492 170.4
Weymouth 3 1,002.6 52,216 19,200 2.37 45,504 60.8
Wilbraham 311.0 14,219 21,872 2.63 57,524 76.9
Wilmington 461.3 22,325 20,663 2.93 60,542 80.9
Winchester 3 604.5 22,192 27,240 2.75 74,909 100.1
Winthrop 360.1 17,497 20,578 2.24 46,096 61.6
Woburn 1,643.4 38,120 43,111 2.43 104,760 140.1
Worcester 3 3,484.7 182,544 19,089 2.46 46,960 62.8
1 Residential usage is based primarily on total residential consumption reported by each community in their 2015 Annual Public Water Supply Annual Statistical Report filed with
the Massachusetts Department of Environmental Protection.
2 Except where noted Total population and average household size for each community based on the 2010 Census.
3 Total polulation based on the 2015 Annual Public Water Supply Annual Statistical Report filed with the Massachusetts Department of Environmental Protection.4 Based on the 2015 Annual Public Water Supply Annual Statistical Report for Hingham and Hull combined.
Public Water Supply Annual
Statictical Report *
MWRA Advisory Board 2016 Water & Sewer Retail Rate Survey
Appendix C Page 2

Household
Usage (HCF)
Household
Usage (kgal) Water Sewer Combined
Belmont 90.1 67.4 $653.32 $1,214.15 $1,867.46
Lexington 121.7 91.1 $535.99 $1,012.99 $1,548.98
Nahant 97.5 72.9 $677.63 $866.78 $1,544.40
Marblehead 88.7 66.3 $486.76 $843.87 $1,330.63
Milton 77.6 58.0 $482.47 $839.08 $1,321.55
Hingham 75.0 56.1 $553.98 $699.36 $1,253.34
Needham 91.9 68.7 $365.26 $884.06 $1,249.32
Wellesley 97.3 72.8 $392.06 $855.20 $1,247.26
Wakefield 79.5 59.5 $440.03 $754.85 $1,194.89
Reading 61.1 45.7 $589.00 $603.67 $1,192.67
Ashland 69.2 51.8 $281.10 $873.30 $1,154.40
Swampscott 89.4 66.9 $642.98 $499.88 $1,142.86
Dedham 80.3 60.1 $452.08 $678.72 $1,130.80
Walpole 88.8 66.4 $507.05 $604.27 $1,111.31
Newton 64.0 47.9 $435.60 $640.80 $1,076.40
Stoneham 72.7 54.4 $418.03 $657.94 $1,075.96
Brookline 74.3 55.6 $430.17 $631.15 $1,061.32
Melrose 52.5 39.3 $402.42 $653.34 $1,055.76
Canton 80.4 60.1 $368.44 $665.52 $1,033.96
Westwood 80.3 60.1 $452.08 $569.40 $1,021.48
Winthrop 61.6 46.1 $400.40 $609.84 $1,010.24
Bedford 73.8 55.2 $338.36 $618.26 $956.62
Randolph 71.5 53.5 $389.58 $529.05 $918.63
Stoughton 62.1 46.4 $293.92 $596.16 $890.08
Chelsea 68.4 51.1 $320.80 $565.67 $886.46
Framingham 63.9 47.8 $386.87 $492.65 $879.52
Revere 51.7 38.6 $193.88 $641.60 $835.47
Watertown 63.0 47.1 $309.72 $521.64 $831.36
Northborough 57.9 43.3 $292.28 $531.00 $823.28
Weymouth 60.8 45.5 $313.80 $503.47 $817.27
Braintree 69.9 52.3 $326.99 $487.36 $814.35
Medford 56.9 42.5 $349.11 $456.10 $805.20
Quincy 49.0 36.7 $307.96 $469.53 $777.49
Marlborough 53.5 40.0 $379.85 $391.62 $771.47
Somerville 50.0 37.4 $225.94 $512.26 $738.20
Holbrook 54.6 40.9 $352.98 $379.47 $732.45
Wilmington 80.9 60.5 $301.83 $415.83 $717.66
Malden 64.5 48.2 $318.51 $383.01 $701.52
Lynn 70.2 52.5 $247.10 $453.49 $700.60
Natick 76.3 57.1 $183.51 $495.21 $678.72
Saugus 84.1 62.9 $413.68 $261.69 $675.37
Arlington 60.4 45.2 $308.43 $366.48 $674.91
Chicopee 64.0 47.9 $252.80 $379.44 $632.24
Wilbraham 76.9 57.5 $316.83 $315.29 $632.12
Norwood 63.8 47.7 $286.17 $344.41 $630.58
Leominster 62.8 47.0 $298.54 $329.32 $627.86
Cambridge 47.6 35.6 $145.42 $456.38 $601.80
Worcester 62.8 47.0 $226.08 $332.59 $558.67
Everett 63.7 47.6 $145.24 $396.85 $542.09
Boston 45.9 34.3 $224.91 $316.89 $541.80
Waltham 59.4 44.5 $191.86 $341.55 $533.41
Woburn 140.1 104.8 $205.00 $328.00 $533.00
Clinton 82.5 61.7 $289.00 $216.75 $505.75
Winchester 100.1 74.9 $231.13 $253.03 $484.16
Weston 170.4 127.5 $470.20 $0.00 $470.20
Lynnfield 96.2 71.9 $407.13 $0.00 $407.13
Peabody 67.1 50.2 $165.29 $220.42 $385.70
Southborough 107.3 80.3 $382.98 $0.00 $382.98
South Hadley 64.2 48.0 $262.03 $0.00 $262.03
Burlington 72.7 54.4 $84.88 $116.64 $201.52
Average (minus non-sewered communities) $349.73 $537.09 $886.83
Combined Annual Water and Sewer Charges for
Communities Receiving Services from the MWRA
Household Usage Based on Local, State & Federal Data
2016Charges include MWRA, community, and alternatively supplied services.
Rates based on consumption provided to DEP by the communities and calculated by MWRA staff.
MWRA Advisory Board 2016 Water & Sewer Retail Rate Survey
Appendix C Page 3
APPENDIX D
FINAL MWRA FISCAL YEAR 2017 BILLABLE
WATER AND SEWER CHARGES
MWRA Advisory Board 2016 Water & Sewer Retail Rate Survey
Appendix D Page 1

MW
RA
Cu
sto
mer
Fin
al FY
16
Wate
r
Assessm
en
t
Fin
al FY
17
Wate
r
Assessm
en
t
Percen
t
Ch
an
ge
fro
m F
Y1
6
Fin
al FY
16
Sew
er
Assessm
en
t
Fin
al FY
17
Sew
er
Assessm
en
t
Percen
t
Ch
an
ge
fro
m F
Y1
6
Fin
al FY
16
Co
mb
ined
Assessm
en
t
Fin
al FY
17
Co
mb
ined
Assessm
en
t
Do
llar C
han
ge
fro
m F
Y1
6
Percen
t
Ch
an
ge
fro
m F
Y1
6
ARLIN
GTO
N4,7
24,9
70
4,9
76,5
64
5.3
%7,6
99,2
78
7,9
93,1
20
3.8
%12,4
24,2
48
12,9
69,6
84
545,4
36
4.4
%
ASH
LAN
D2,3
80,6
35
2,4
85,1
74
4.4
%2,3
80,6
35
2,4
85,1
74
104,5
39
4.4
%
BED
FO
RD
3,1
99,1
85
3,3
68,3
31
5.3
%3,1
99,1
85
3,3
68,3
31
169,1
46
5.3
%
BELM
ON
T2,6
74,5
76
2,8
28,4
56
5.8
%4,6
24,8
61
4,8
25,4
79
4.3
%7,2
99,4
37
7,6
53,9
35
354,4
98
4.9
%
BO
STO
N
(BW
SC)
80,2
05,2
08
82,7
71,7
09
3.2
%129,7
01,3
92
132,2
71,8
45
2.0
%209,9
06,6
00
215,0
43,5
54
5,1
36,9
54
2.4
%
BRAIN
TREE
8,5
07,3
87
9,1
00,2
70
7.0
%8,5
07,3
87
9,1
00,2
70
592,8
83
7.0
%
BRO
OKLIN
E6,9
10,8
63
7,0
46,6
91
2.0
%12,6
39,5
75
12,8
94,4
19
2.0
%19,5
50,4
38
19,9
41,1
10
390,6
72
2.0
%
BU
RLIN
GTO
N4,9
05,3
53
5,0
78,4
61
3.5
%4,9
05,3
53
5,0
78,4
61
173,1
08
3.5
%
CAM
BRID
GE
23,2
59,6
70
23,7
45,6
95
2.1
%23,2
59,6
70
23,7
45,6
95
486,0
25
2.1
%
CAN
TO
N1,2
86,7
28
1,6
73,7
54
30.1
%3,9
33,9
60
4,1
37,1
62
5.2
%5,2
20,6
88
5,8
10,9
16
590,2
28
11.3
%
CH
ELSEA
4,1
55,1
84
4,2
15,0
80
1.4
%7,4
35,2
43
7,6
63,3
15
3.1
%11,5
90,4
27
11,8
78,3
95
287,9
68
2.5
%
DED
HAM
5,0
63,9
31
5,3
11,5
72
4.9
%5,0
63,9
31
5,3
11,5
72
247,6
41
4.9
%
DED
HAM
-WESTW
OO
D W
ATER D
ISTRIC
T305,5
32
196,3
81
-35.7
%305,5
32
196,3
81
-109,1
51
-35.7
%
EVERETT
4,6
36,6
54
4,9
48,1
91
6.7
%8,0
56,4
04
8,1
24,1
01
0.8
%12,6
93,0
58
13,0
72,2
92
379,2
34
3.0
%
FRAM
ING
HAM
8,2
43,8
26
8,1
59,8
08
-1.0
%11,8
93,9
82
12,8
24,9
62
7.8
%20,1
37,8
08
20,9
84,7
70
846,9
62
4.2
%
HIN
GH
AM
SEW
ER
DIS
TRIC
T1,6
95,0
96
1,7
98,0
28
6.1
%1,6
95,0
96
1,7
98,0
28
102,9
32
6.1
%
HO
LBRO
OK
1,6
57,6
60
1,7
59,9
96
6.2
%1,6
57,6
60
1,7
59,9
96
102,3
36
6.2
%
LEXIN
GTO
N6,6
95,1
44
7,3
49,6
61
9.8
%6,9
70,1
76
7,2
65,8
70
4.2
%13,6
65,3
20
14,6
15,5
31
950,2
11
7.0
%
LYN
N
(LW
SC)
264,8
73
243,9
38
-7.9
%264,8
73
243,9
38
-20,9
35
-7.9
%
LYN
NFIE
LD
WATER D
ISTRIC
T614,1
85
643,3
48
4.7
%614,1
85
643,3
48
29,1
63
4.7
%
MALD
EN
6,9
41,8
18
6,9
50,7
68
0.1
%12,4
39,0
49
12,9
41,0
73
4.0
%19,3
80,8
67
19,8
91,8
41
510,9
74
2.6
%
MARBLEH
EAD
2,2
78,3
25
2,3
41,4
15
2.8
%2,2
78,3
25
2,3
41,4
15
63,0
90
2.8
%
MARLBO
RO
UG
H3,8
94,0
26
3,8
87,8
76
-0.2
%3,8
94,0
26
3,8
87,8
76
-6,1
50
-0.2
%
MED
FO
RD
6,4
32,0
09
6,4
32,2
19
0.0
%11,3
55,4
58
11,8
78,7
89
4.6
%17,7
87,4
67
18,3
11,0
08
523,5
41
2.9
%
MELRO
SE
2,8
53,9
30
2,9
15,6
35
2.2
%6,0
54,8
75
6,2
51,9
52
3.3
%8,9
08,8
05
9,1
67,5
87
258,7
82
2.9
%
MIL
TO
N3,1
56,8
24
3,3
60,3
96
6.4
%5,0
18,9
15
5,3
62,0
55
6.8
%8,1
75,7
39
8,7
22,4
51
546,7
12
6.7
%
NAH
AN
T425,5
27
476,5
32
12.0
%425,5
27
476,5
32
51,0
05
12.0
%
NATIC
K5,5
26,6
14
5,7
56,7
05
4.2
%5,5
26,6
14
5,7
56,7
05
230,0
91
4.2
%
NEED
HAM
1,0
12,9
62
1,0
39,3
72
2.6
%5,4
08,4
45
5,6
83,9
15
5.1
%6,4
21,4
07
6,7
23,2
87
301,8
80
4.7
%
NEW
TO
N12,2
05,2
71
12,9
50,5
52
6.1
%19,7
10,6
07
20,5
18,2
41
4.1
%31,9
15,8
78
33,4
68,7
93
1,5
52,9
15
4.9
%
NO
RTH
BO
RO
UG
H1,1
03,5
42
1,1
35,7
72
2.9
%1,1
03,5
42
1,1
35,7
72
32,2
30
2.9
%
NO
RW
OO
D3,7
55,1
01
3,6
52,8
67
-2.7
%6,7
18,8
85
7,0
23,1
66
4.5
%10,4
73,9
86
10,6
76,0
33
202,0
47
1.9
%
PEABO
DY
1,4
80,3
93
1,5
07,2
69
1.8
%1,4
80,3
93
1,5
07,2
69
26,8
76
1.8
%
QU
INCY
11,9
18,0
42
11,7
76,3
11
-1.2
%19,4
81,0
76
19,9
71,9
78
2.5
%31,3
99,1
18
31,7
48,2
89
349,1
71
1.1
%
RAN
DO
LPH
6,0
11,8
17
6,2
72,1
86
4.3
%6,0
11,8
17
6,2
72,1
86
260,3
69
4.3
%
READ
ING
2,0
32,7
66
2,1
09,5
49
3.8
%4,6
24,3
78
4,7
69,9
28
3.1
%6,6
57,1
44
6,8
79,4
77
222,3
33
3.3
%
REVERE
5,0
13,2
81
4,9
43,9
64
-1.4
%10,2
61,6
23
10,6
11,5
49
3.4
%15,2
74,9
04
15,5
55,5
13
280,6
09
1.8
%
SAU
GU
S3,6
45,0
83
3,6
92,8
89
1.3
%3,6
45,0
83
3,6
92,8
89
47,8
06
1.3
%
SO
MERVIL
LE
7,0
60,4
00
7,6
58,2
90
8.5
%15,5
85,8
94
15,9
18,0
35
2.1
%22,6
46,2
94
23,5
76,3
25
930,0
31
4.1
%
SO
UTH
BO
RO
UG
H850,0
20
948,4
22
11.6
%850,0
20
948,4
22
98,4
02
11.6
%
STO
NEH
AM
3,3
81,3
01
3,1
74,6
90
-6.1
%4,4
29,2
20
4,5
42,0
49
2.5
%7,8
10,5
21
7,7
16,7
39
-93,7
82
-1.2
%
STO
UG
HTO
N1,1
06,3
44
1,1
44,2
45
3.4
%4,3
92,8
63
4,7
47,3
41
8.1
%5,4
99,2
07
5,8
91,5
86
392,3
79
7.1
%
SW
AM
PSCO
TT
1,8
27,9
59
1,8
34,1
51
0.3
%1,8
27,9
59
1,8
34,1
51
6,1
92
0.3
%
WAKEFIE
LD
1,8
55,0
71
1,8
52,2
18
-0.2
%5,5
63,2
82
5,8
13,6
97
4.5
%7,4
18,3
53
7,6
65,9
15
247,5
62
3.3
%
WALPO
LE
3,5
59,0
98
3,7
13,8
77
4.3
%3,5
59,0
98
3,7
13,8
77
154,7
79
4.3
%
WALTH
AM
8,6
31,1
71
9,3
84,1
59
8.7
%12,6
80,4
25
13,1
22,1
22
3.5
%21,3
11,5
96
22,5
06,2
81
1,1
94,6
85
5.6
%
WATERTO
WN
3,3
92,3
82
3,2
90,9
86
-3.0
%5,7
60,0
51
5,9
71,3
77
3.7
%9,1
52,4
33
9,2
62,3
63
109,9
30
1.2
%
WELLESLEY
852,4
77
1,0
56,2
94
23.9
%5,2
78,3
00
5,4
59,7
50
3.4
%6,1
30,7
77
6,5
16,0
44
385,2
67
6.3
%
WESTO
N2,2
40,6
75
2,4
45,9
70
9.2
%2,2
40,6
75
2,4
45,9
70
205,2
95
9.2
%
WESTW
OO
D2,4
73,2
96
2,5
98,2
65
5.1
%2,4
73,2
96
2,5
98,2
65
124,9
69
5.1
%
WEYM
OU
TH
11,0
87,5
03
11,7
65,8
11
6.1
%11,0
87,5
03
11,7
65,8
11
678,3
08
6.1
%
WIL
MIN
GTO
N353,3
79
703,0
75
99.0
%2,4
76,8
67
2,5
95,6
01
4.8
%2,8
30,2
46
3,2
98,6
76
468,4
30
16.6
%
WIN
CH
ESTER
1,2
34,2
22
1,5
44,3
49
25.1
%3,8
68,4
61
4,0
33,7
70
4.3
%5,1
02,6
83
5,5
78,1
19
475,4
36
9.3
%
WIN
TH
RO
P1,6
29,5
50
1,6
43,6
15
0.9
%3,1
83,3
39
3,3
20,0
69
4.3
%4,8
12,8
89
4,9
63,6
84
150,7
95
3.1
%
WO
BU
RN
3,0
91,2
83
3,3
55,3
06
8.5
%9,4
92,9
94
9,3
24,6
62
-1.8
%12,5
84,2
77
12,6
79,9
68
95,6
91
0.8
%
TO
TA
L$
22
6,3
72
,87
7$
23
4,2
62
,73
73
.5%
$4
46
,06
7,1
23
$4
60
,61
5,7
63
3.3
%$
67
2,4
40
,00
0$
69
4,8
78
,50
0$
22
,43
8,5
00
3.3
%
(1)
Som
e c
om
munitie
s r
eceiv
e p
art
ial w
ate
r or
sew
er
serv
ices f
rom
MW
RA.
MA
SS
AC
HU
SE
TT
S W
AT
ER
RE
SO
UR
CE
S A
UT
HO
RIT
YF
INA
L F
Y17
BIL
LA
BL
E W
AT
ER
AN
D S
EW
ER
CH
AR
GE
S
MWRA Advisory Board 2016 Water & Sewer Retail Rate Survey
Appendix D Page 2

APPENDIX E
ADDITIONAL 2016 DATA FOR MWRA COMMUNITIES
MWRA Advisory Board 2016 Water & Sewer Retail Rate Survey
Appendix E Page 1

PERCENTAGE OF WATER UNACCOUNTED FOR
No answer 3
0 – 5% 7
5 – 10% 17
10 – 15% 13
15+% 20
Invalid Data 0
Not applicable 0
PERCENTAGE OF WATER SERVICE BILLS LIENED
No answer 3
0 – 5% 41
5 – 10% 10
10 – 15% 3
15+% 3
Invalid Data 0
Not applicable 0
PERCENTAGE OF SEWER SERVICE BILLS LIENED
No answer 4
0 – 5% 33
5 – 10% 13
10 – 15% 2
15+% 4
Invalid Data 0
Not applicable 4
COMMUNITIES WITH SHORTFALLS DUE TO LOWER THAN PROJECTED WATER USE (WATER FUNDS)
No answer 4
Yes 18
No 38
Invalid Data 0
Not applicable 0
COMMUNITIES WITH SHORTFALLS DUE TO LOWER THAN PROJECTED WATER USE (SEWER FUNDS)
No answer 4
Yes 16
No 36
Invalid Data 0
Not applicable 4
MWRA CHARGES AS A PERCENTAGE OF TOTAL EXPENSES (WATER FUNDS)
No answer 5
0 – 25% 16
25 – 50% 17
50 – 75% 19
75+% 3
Not applicable 0
MWRA Advisory Board 2016 Water & Sewer Retail Rate Survey
Appendix E Page 2

MWRA CHARGES AS A PERCENTAGE OF TOTAL EXPENSES (SEWER FUNDS)
No answer 8
0 – 25% 10
25 – 50% 9
50 – 75% 16
75+% 13
Not applicable 4
NUMBER OF MILES OF WATER PIPELINE REHABILITATED OR REPLACED IN FY16
No answer 2
Less than 1 25
1 – 3 miles 24
3 – 6 miles 6
6+ miles 3
Invalid Data 0
Not applicable 0
NUMBER OF MILES OF SEWER PIPELINE REHABILITATED OR REPLACED IN FY16
No answer 1
Less than 1 28
1 – 3 miles 17
3 – 6 miles 5
6+ miles 5
Invalid Data 0
Not applicable 4
ACTUAL WATER CAPITAL NEEDS OVER NEXT FIVE YEARS
No answer 2
$0 – $10 million 36
$10 – $20 million 14
$20 – $50 million 3
$50+ million 5
Invalid Data 0
Not applicable 0
ANTICIPATED WATER CAPITAL SPENDING OVER NEXT FIVE YEARS
No answer 3
$100 thousand – $1 million 7
$1 – $5 million 23
$5 – $10 million 17
$10+ million 10
Invalid Data 0
Not applicable 0
MWRA Advisory Board 2016 Water & Sewer Retail Rate Survey
Appendix E Page 3

ACTUAL SEWER CAPITAL NEEDS OVER NEXT FIVE YEARS
No answer 3
$0 – $10 million 31
$10 – $20 million 9
$20 – $50 million 7
$50+ million 6
Invalid Data 0
Not applicable 4
ANTICIPATED SEWER CAPITAL SPENDING OVER NEXT FIVE YEARS
No answer 2
$100 thousand – $1 million 5
$1 – $5 million 23
$5 – $10 million 19
$10+ million 7
Invalid Data 0
Not applicable 4
HOW COMMUNITIES RECOVER STORMWATER COSTS (SEE APPENDIX G)
No answer 1
Water/Sewer Rates 12
Special Assessment 4
DPW Budget 40
Invalid Data 0
Not applicable 2
Other 1
MWRA Advisory Board 2016 Water & Sewer Retail Rate Survey
Appendix E Page 4
APPENDIX F
MWRA Water System Sales
1980 – 2015
MWRA Advisory Board 2016 Water & Sewer Retail Rate Survey
Appendix F Page 1
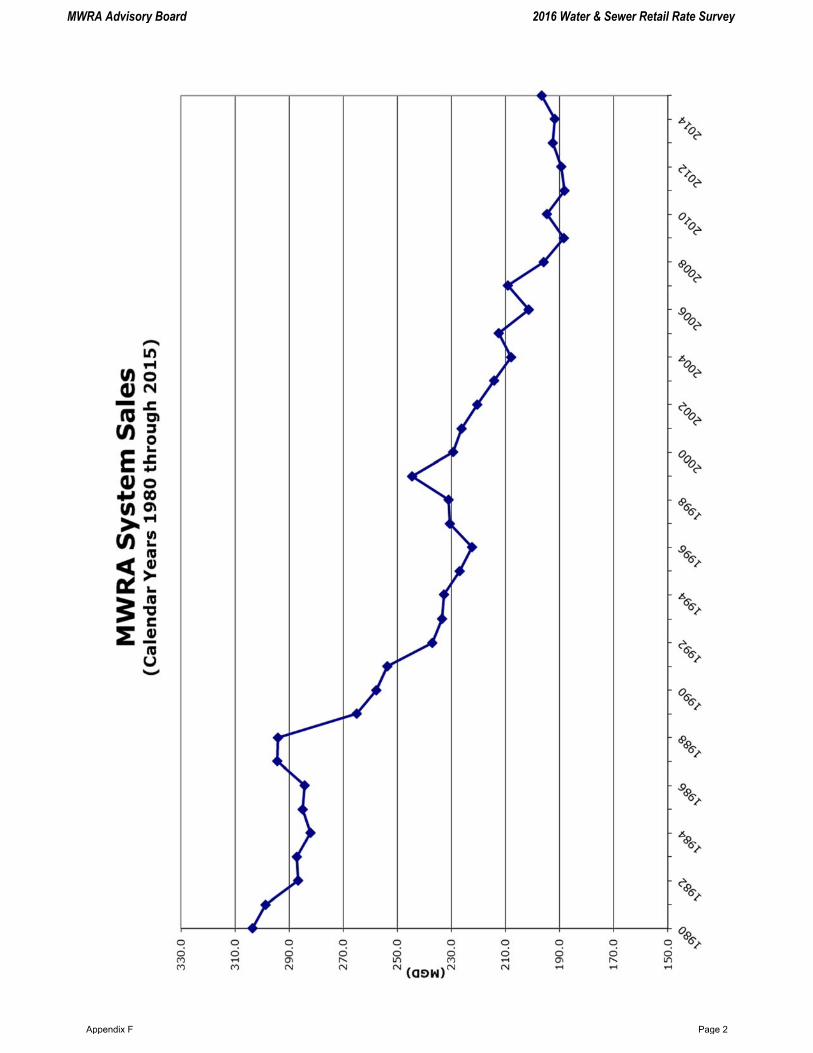
MWRA Advisory Board 2016 Water & Sewer Retail Rate Survey
Appendix F Page 2

APPENDIX G
2016 STORMWATER FEES
MWRA Advisory Board 2016 Water & Sewer Retail Rate Survey
Appendix G Page 1

BACKGROUND – WHAT IS STORMWATER? “Stormwater” is a term used to describe the result of rain storms, snow storms, and other wet weather events. Though stormwater can be taken care of naturally by the ground and surface waters – i.e. streams, tributaries, rivers, etc. – this natural process is disrupted by impervious area (IA), such as concrete roadways, driveways or parking lots, and the roofs of buildings, all of which divert water. To combat this disruption, communities must direct stormwater to natural or man‐made outlets which can treat the water to ensure that water quality is not negatively impacted by chemical and biological materials which can be carried by the flow of stormwater into nearby bodies of water. NEW CHALLENGES – STRINGENT FEDERAL REGULATIONS To protect the many bodies of water that can be easily impacted by stormwater, the Environmental Protection Agency (EPA) has advanced the Stormwater Permitting Program through its National Pollutant Discharge Elimination System (NPDES) to mitigate these impacts. The regulatory requirements for stormwater were rolled out in the form of the Municipal Separate Storm Sewer Systems (MS4) general permit. With the general permit for stormwater discharges will be effective on July 1, 2017.
Due to these most recent MS4 permit revisions and new NPDES permits being issued, municipalities across the United States are facing increased needs for funding of new stormwater infrastructure and ongoing infrastructure maintenance and rehabilitation. New challenges in stormwater management include meeting Phosphorous Total Maximum Daily Load (TMDL) Waste Load Allocations (WLA) and creating public outreach programs to educate residents on stormwater challenges, solutions and costs. FUNDING STORMWATER INFRASTRUCTURE Because of increasing local taxes and water/sewer rates over the past two decades, communities are looking at other mechanisms to fund their growing stormwater costs. Nationally, special assessments known as Stormwater Fees, Drainage Fees or Impervious Area Charges have become commonplace for municipalities in need of a designated funding source, but they have also been met by some public backlash, sometimes being referred to by opponents as a “Rain Tax.” Of the MWRA’s 60 communities (Chart 1), only 3 have implemented a stormwater fee to recover stormwater‐related costs. An additional community has approved a structure for funding stormwater costs which will be in place for next year’s survey. A majority of MWRA communities continue to pay for stormwater projects through their DPW budgets, supported by the tax levy, or through increases to their water and sewer rates. Of the 25 national communities (Chart 2) surveyed, 16 have implemented a stormwater fee to fund stormwater‐related costs. Additionally, 3 national communities surveyed have their stormwater‐related costs and revenue generated by a regional agency, such as a county system. This year's survey includes more detailed information about each national community’s storm water financing methodologies. This information should be helpful for MWRA communities as they prepare for the new MS4 permit to be effective.
STORMWATER: The New Challenge for Municipalities
Chart 2
Chart 1
MWRA Advisory Board 2016 Water & Sewer Retail Rate Survey
Appendix G Page 2
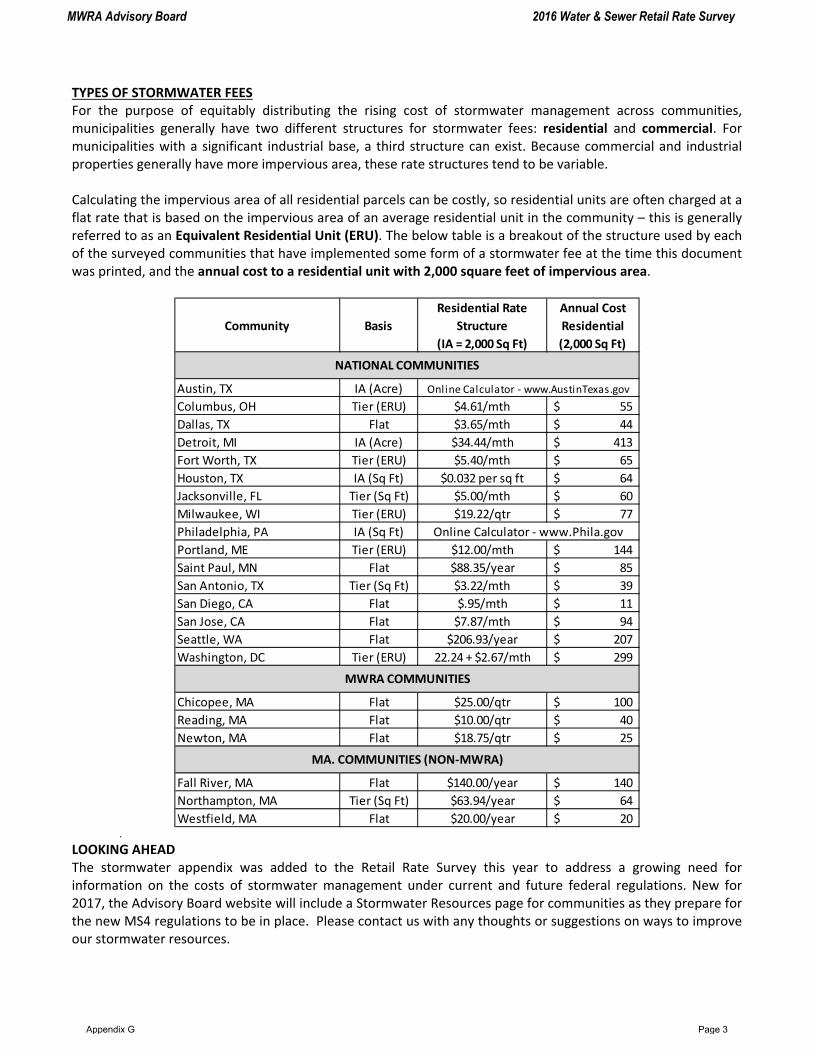
TYPES OF STORMWATER FEES For the purpose of equitably distributing the rising cost of stormwater management across communities, municipalities generally have two different structures for stormwater fees: residential and commercial. For municipalities with a significant industrial base, a third structure can exist. Because commercial and industrial properties generally have more impervious area, these rate structures tend to be variable. Calculating the impervious area of all residential parcels can be costly, so residential units are often charged at a flat rate that is based on the impervious area of an average residential unit in the community – this is generally referred to as an Equivalent Residential Unit (ERU). The below table is a breakout of the structure used by each of the surveyed communities that have implemented some form of a stormwater fee at the time this document was printed, and the annual cost to a residential unit with 2,000 square feet of impervious area.
.
LOOKING AHEAD The stormwater appendix was added to the Retail Rate Survey this year to address a growing need for information on the costs of stormwater management under current and future federal regulations. New for 2017, the Advisory Board website will include a Stormwater Resources page for communities as they prepare for the new MS4 regulations to be in place. Please contact us with any thoughts or suggestions on ways to improve our stormwater resources.
Community Basis
Residential Rate
Structure
(IA = 2,000 Sq Ft)
Annual Cost
Residential
(2,000 Sq Ft)
Austin, TX IA (Acre)
Columbus, OH Tier (ERU) $4.61/mth 55$
Dallas, TX Flat $3.65/mth 44$
Detroit, MI IA (Acre) $34.44/mth 413$
Fort Worth, TX Tier (ERU) $5.40/mth 65$
Houston, TX IA (Sq Ft) $0.032 per sq ft 64$
Jacksonville, FL Tier (Sq Ft) $5.00/mth 60$
Milwaukee, WI Tier (ERU) $19.22/qtr 77$
Philadelphia, PA IA (Sq Ft)
Portland, ME Tier (ERU) $12.00/mth 144$
Saint Paul, MN Flat $88.35/year 85$
San Antonio, TX Tier (Sq Ft) $3.22/mth 39$
San Diego, CA Flat $.95/mth 11$
San Jose, CA Flat $7.87/mth 94$
Seattle, WA Flat $206.93/year 207$
Washington, DC Tier (ERU) 22.24 + $2.67/mth 299$
Chicopee, MA Flat $25.00/qtr 100$
Reading, MA Flat $10.00/qtr 40$
Newton, MA Flat $18.75/qtr 25$
Fall River, MA Flat $140.00/year 140$
Northampton, MA Tier (Sq Ft) $63.94/year 64$
Westfield, MA Flat $20.00/year 20$
MA. COMMUNITIES (NON‐MWRA)
NATIONAL COMMUNITIES
MWRA COMMUNITIES
Online Calculator ‐ www.AustinTexas.gov
Online Calculator ‐ www.Phila.gov
MWRA Advisory Board 2016 Water & Sewer Retail Rate Survey
Appendix G Page 3

MWRA ADVISORY BOARD MEMBERS CITY/TOWN CEO DESIGNEE
ARLINGTON Diane M. Mahon Michael Rademacher* ASHLAND Joseph J. Magnani, Jr. BEDFORD Michael Rosenberg David Manugian* BELMONT Mark A. Paolillo Jason Marcotte/Michael Bishop BOSTON Hon. Martin J. Walsh John Sullivan, Jr.* BRAINTREE Hon. Joseph C. Sullivan Greg Riley BROOKLINE Neil Wishinsky Jay Hersey BURLINGTON Daniel J. Grattan John Sanchez* Gubernatorial Appointees CAMBRIDGE Hon. E. Denise Simmons Timothy MacDonald* Quabbin and Ware Watershed –J. R. Greene CANTON Robert E. Burr, Jr. Michael Trotta Wachusett Watershed – Barbara Wyatt CHELSEA Thomas G. Ambrosino Andrew DeSantis* Environmental Protection – CHICOPEE Hon. Richard J. Kos Andrew Chalker Fisk CLINTON James J. LeBlanc Connecticut River Basin – DEDHAM Michael L. Butler Jason L. Mammone Richard N. Palmer EVERETT Hon. Carlo DeMaria Eric Demas Boston Harbor – Vacant (2) FRAMINGHAM Cheryl Tully Stoll Peter Sellers /Blake Lukis HINGHAM Paul Healey Robert Higgins MAPC Appointee: HOLBROOK Matthew V. Moore Thomas Cummings Edward G. Bates LEOMINSTER Hon. Dean Mazzarella LEXINGTON Suzie Barry Ralph Pecora LYNN Hon. Judith Flanagan Kennedy Daniel F. O’Neill Advisory Board Designees to the LYNNFIELD Philip Crawford James Finegan MWRA Board of Directors: MALDEN Hon. Gary Christenson John Russell MARBLEHEAD Jackie Belf-Becker Amy McHugh John Carroll – Norwood MARLBOROUGH Hon. Arthur Vigeant Ron LaFreniere Andrew Pappastergion - Brookline MEDFORD Hon. Stephanie M. Burke Cassandra Koutalidis Joseph Foti - Chelsea MELROSE Hon. Robert J. Dolan Elena Proakis Ellis MILTON Kathleen M. Conlon NAHANT Richard J. Lombard F. Thom Donahue NATICK Richard Jennett, Jr. Jeremy Marsette* NEEDHAM Matthew Borrelli John Cosgrove/Vincent Roy NEWTON Hon. Setti D. Warren Lou Taverna** NORTHBOROUGH Jeff Amberson Daniel F. Nason NORWOOD Allan D. Howard Bernard Cooper* PEABODY Hon. Edward A. Bettencourt Michael Sheu QUINCY Hon. Thomas P. Koch Michael Coffey*/Lawrence Prendeville RANDOLPH Jason R. Adams Richard Brewer READING John R. Halsey Jeffrey Zager REVERE Hon. Brian Arrigo Nicholas J. Rystrom* SAUGUS Debra Panetta Brendan O’Regan* SOMERVILLE Hon. Joseph A. Curtatone Robert King* SOUTH HADLEY John R. Hine John Mikuszewski SOUTHBOROUGH John F. Rooney III Karen Gilligan STONEHAM Anne Marie O’Neill John DeAmicis* STOUGHTON David J. Sousa Jack Mitchell/Michael Hartman SWAMPSCOTT Naomi Dreeben Gino A. Cresta, Jr. WAKEFIELD Patrick S. Glynn Carol Antonelli*/Richard Stinson WALPOLE Clifton K. Snuffer Patrick Fasanello WALTHAM Hon. Jeannette A. McCarthy WATERTOWN Mark S. Sideris Gerald Mee WELLESLEY David L. Murphy Walter Woods* WESTON Michael H. Harrity WESTWOOD Nancy C. Hyde Jeffrey Bina WEYMOUTH Hon. Robert L. Hedlund Kenan J. Connell/Kenneth Morse WILBRAHAM Robert J. Boilard WILMINGTON Michael Champoux Michael Woods/Joseph Lobao WINCHESTER Lance Grenzeback James Gibbons WINTHROP Robert L. Driscoll Thomas E. Reilly WOBURN Hon. Scott Galvin Anthony Blazejowski WORCESTER Hon. Joseph M. Petty
*Member of the Executive Committee ** Chairman of the Executive Committee