Embed Size (px)
Citation preview

NBER WORKING PAPER SERIES
WATCH WHAT I DO, NOT WHAT I SAY:THE UNINTENDED CONSEQUENCES OF THE HOMELAND INVESTMENT ACT
Dhammika DharmapalaC. Fritz Foley
Kristin J. Forbes
Working Paper 15023http://www.nber.org/papers/w15023
NATIONAL BUREAU OF ECONOMIC RESEARCH1050 Massachusetts Avenue
Cambridge, MA 02138June 2009
The statistical analysis of firm-level data on U.S. multinational companies was conducted at the Bureauof Economic Analysis, U.S. Department of Commerce under arrangements that maintain legal confidentialityrequirements. The views expressed are those of the authors and do not reflect official positions of theU.S. Department of Commerce. We thank Anil Kashyap for inspiration for the title, and Heitor Almeida,Alan Auerbach, Jennifer Blouin, Tom Brennan, Alex Brill, Robin Greenwood, Michelle Hanlon, JimHines, David Weisbach, Rohan Williamson, Jeff Wurgler, Bill Zeile, and seminar and conferenceparticipants at Harvard, MIT, the NBER, the National Tax Association, Rutgers, and the Universityof North Carolina Tax Symposium for helpful comments and suggestions. Foley thanks the Divisionof Research of the Harvard Business School for financial support. First draft: September, 2008. Theviews expressed herein are those of the author(s) and do not necessarily reflect the views of the NationalBureau of Economic Research.
© 2009 by Dhammika Dharmapala, C. Fritz Foley, and Kristin J. Forbes. All rights reserved. Shortsections of text, not to exceed two paragraphs, may be quoted without explicit permission providedthat full credit, including © notice, is given to the source.
Watch What I Do, Not What I Say: ¸˛The Unintended Consequences of the Homeland InvestmentActDhammika Dharmapala, C. Fritz Foley, and Kristin J. ForbesNBER Working Paper No. 15023June 2009JEL No. F23,G14,G18,G3,H25,H26
ABSTRACT
This paper analyzes the impact on firm behavior of the Homeland Investment Act of 2004, which provideda one-time tax holiday for the repatriation of foreign earnings by U.S. multinationals. The analysiscontrols for endogeneity and omitted variable bias by using instruments that identify the firms likelyto receive the largest tax benefits from the holiday. Repatriations did not lead to an increase in domesticinvestment, employment or R&D—even for the firms that lobbied for the tax holiday stating theseintentions and for firms that appeared to be financially constrained. Instead, a $1 increase in repatriationswas associated with an increase of almost $1 in payouts to shareholders. These results suggest thatthe domestic operations of U.S. multinationals were not financially constrained and that these firmswere reasonably well-governed. The results have important implications for understanding the impactof U.S. corporate tax policy on multinational firms.
Dhammika DharmapalaDepartment of EconomicsUniversity of Connecticut341 Mansfield Road, U-1063Storrs, CT [email protected]
C. Fritz FoleyHarvard Business SchoolSoldiers FieldBoston, MA 02163and [email protected]
Kristin J. ForbesMIT Sloan School Room E52-45550 Memorial DriveCambridge, MA 02142and [email protected]
1
I. Introduction
The Homeland Investment Act (HIA) provided for a one-time tax holiday on the repatriation
of foreign earnings by U.S.-based multinational enterprises (MNEs)1 and was passed in 2004
as part of the American Jobs Creation Act (AJCA). Congressmen argued that it would create
more than 500,000 jobs over 2 years by raising investment in the United States. Analysts at
J.P. Morgan Securities estimated that businesses would increase capital spending by 2% to
3% over two years.2 A confidential survey of firms indicated that they would primarily use
the repatriated funds to pay down debt, finance capital spending, and fund research and
development, venture capital, and acquisitions;3 some firms also stated these intentions
publicly. Many economists, however, argued that the tax holiday would have little impact on
U.S. investment, R&D or employment. The White House’s Council of Economic Advisers
stated that “the repatriation provision would not produce any substantial economic benefits.”4
In response to the HIA, repatriations of foreign earnings from affiliates to parents of U.S.
MNEs surged. According to the Bureau of Economic Analysis, U.S. multinationals
repatriated about $300 billion in 2005 after the HIA was passed, up sharply from an average
of around $60 billion over the previous five years.5 The magnitude of these repatriations
exceeded most predictions.
Firms’ responses to the HIA provide an opportunity to test several hypotheses about financial
constraints, corporate governance, and international tax policy. The temporary tax holiday
effectively reduced the cost to U.S. multinationals of accessing internal capital that was held
abroad as reinvested earnings. The framers of the Act justified the tax holiday based on the
premise that these firms’ domestic operations were financially constrained. If this were true,
repatriated cash could be invested in U.S. projects that had a positive net present value for the
1 The term “repatriation” refers to the payment of dividends by a foreign subsidiary to its U.S. parent firm. 2 J.P. Morgan Chase Bank, Economic & Policy Research report “Introducing the Homeland Investment Act,” May 1, 2003. 3 Survey conducted by J.P. Morgan Chase Bank and reported in their research report, “Status Report on Repatriation Legislation-aka the Homeland Investment Act,” September 17, 2003. 4 Wall Street Journal, “Tax Windfall May Not Boost Hiring Despite Claims; Some Companies Plan to Use New Break on Foreign Profits for Debt and Other Needs,” October 13, 2004, pg. A1. 5 Data are from the Bureau of Economic Analysis, U.S. International Transactions Accounts Data, Table 7b, line 3 for distributed earnings.
2
firm based on the temporarily lower cost of internal capital but which were not profitable at
the higher cost of external finance. Hubbard (1998) and Stein (2003) review the large
literature on financial constraints.6 There are reasons to be skeptical about the stated
justifications for the Act because large firms are typically less constrained than small ones,
and multinationals are generally thought to be less constrained than other firms. In the
presence of high repatriation tax costs, however, the domestic activities of MNEs or a subset
of MNEs could face constraints. Studying changes in firms’ domestic investment,
employment, and R&D expenditures under the HIA reveals whether the domestic operations
of U.S. multinationals were in fact financially constrained, and if the reduced tax costs of
accessing internal funds spurred domestic activity in accordance with the stated goal of
lawmakers.
If firms are not financially constrained, then well-governed firms would return any internal
capital accessed under the HIA to shareholders through mechanisms such as share
repurchases or dividend payments. In the absence of financial constraints, well-governed
firms would choose optimal levels of investment and employment before the tax holiday, so
they would not increase expenditures on capital and labor when the holiday occurred. If firms
are not well-governed, however, any internal cash accessed under the HIA could be
squandered. This cash would reduce the constraints on managers and give them more
freedom to pursue projects that provide a greater private benefit than shareholder benefit—
such as raising management compensation, upgrading corporate headquarters, or increasing
investment in low-return projects. This possibility is discussed in Jensen (1986), and
evidence of such behavior appears in several papers, such as Morck, Shleifer and Vishny
(1990), Lang, Stulz and Walkling (1991), Blanchard, López-de-Silanes, and Shleifer (1994),
Bates (2005), and Dittmar and Mahrt-Smith (2007). This paper analyzes the effects of the
HIA on payouts to shareholders and tests whether corporate governance affects the extent to
which firms returned funds to shareholders.
6 Some of the key contributions in this extensive literature include: Fazzari, Hubbard and Petersen (1988), Blanchard, López-de-Silanes and Shleifer (1994), Lamont (1997), and Rauh (2006). Kaplan and Zingales (1997) discuss problems in measuring financial constraints. For evidence on financial constraints and R&D, see Hall (1992) and Himmelberg and Petersen (1994).
3
Firms’ responses to the HIA also have important implications for international tax policy,
including implications for the effects of how the United States taxes foreign source income
and for the regulation of how repatriations are spent. Altshuler and Grubert (2003) argue that
U.S. multinationals are able to use tax planning strategies that allow them to effectively avoid
repatriation taxes even in the absence of a tax holiday. On the other hand, several papers find
that repatriation taxes significantly distort repatriation decisions.7 Evidence that firms made
extensive use of the HIA tax holiday and in particular that those firms that took greatest
advantage of the holiday had previously attempted to reduce their repatriation taxes through
alternative strategies would suggest that repatriation taxes do impose burdens, despite the
availability of strategies to escape the taxes. This finding is particularly timely in view of
current proposals to restrict U.S. firms’ ability to defer repatriation taxes.8
A more general policy issue addressed in this paper is whether government regulation can
affect firms’ spending patterns. The U.S. Treasury Department issued explicit guidelines on
how earnings returned to the United States could be spent. The funds had to be used for
“permitted investments,” which included hiring U.S. workers, U.S. investment, research and
development, and certain acquisitions. Certain uses, such as executive compensation,
dividends, and stock redemptions, would disqualify repatriations from the holiday. The
literature on the “flypaper effect” suggests that regulations directing how funds are used have
a significant impact. More specifically, this literature finds that money tends to “stick where
it hits”, i.e., that targeted grants have large effects on expenditures even though cash is
fungible.9 Although most papers on the flypaper effect focus on inter-government transfers,
Hines and Thaler (1995) review this literature and point out similar effects in the corporate
sector. How U.S. multinationals responded to the restrictions on the use of cash repatriated
under the HIA provides a test of the effectiveness of these types of regulations.
The empirical analysis in this paper utilizes the most extensive data available on U.S.
multinational firms by combining information from the U.S. Bureau of Economic Analysis 7 Papers that document an effect of taxes on repatriations include Hines and Hubbard (1990) and Desai, Foley, and Hines (2007). 8 See “Obama Calls for Curbs on Offshore Tax Havens,” New York Times, May 4, 2009. 9 For examples of papers on the flypaper effect, see Pack and Pack (1993), Knight (2002), Gordon (2004), Baicker and Staiger (2005), and van de Walle (2007).
4
(BEA) Survey of Direct Transactions of U.S. Reporter with Foreign Affiliate and Survey of
U.S. Direct Investment Abroad with data drawn from Compustat, ExecuComp, and other
sources. There are, however, two fundamental challenges in analyzing the effects of
repatriations under the HIA: endogeneity and omitted variable bias. Firms choose how much
to repatriate while simultaneously making other financial decisions. In addition, common
omitted factors, such as levels of domestic cash flows, could affect both repatriations and
other choices. This paper addresses these problems by instrumenting for repatriations under
the HIA using firm characteristics that predict which firms are more likely to receive a large
tax benefit from HIA repatriations but that are predetermined in relation to the Act. More
specifically, the instruments identify firms that, prior to the HIA, faced high tax costs of
repatriating funds and that shielded foreign income from U.S. taxation by using tax haven
affiliates or holding companies. The first-stage results indicate that these characteristics are
strong predictors of the extent to which firms took advantage of the HIA.
The second stage results and additional evidence in this paper are inconsistent with the claim
that the domestic operations of MNEs were financially constrained and that the tax holiday
spurred U.S. job creation or investment. More specifically, higher levels of repatriations were
not associated with increased domestic capital expenditures, domestic employment
compensation, or research and development (R&D) expenditures. In fact, increased
repatriations in response to the HIA had small negative, but insignificant, effects on domestic
employment and R&D expenditures in instrumental variable specifications. These results
hold not only for the full sample of firms, but also for subsamples of firms that appear to be
financially constrained and that lobbied for the Act.
Additional results from the analysis of equity provisions by parent firms to their affiliates
provide further evidence that firms did not face domestic financial constraints. Before the tax
holiday, firms that increased equity provisions from their parents to their affiliates repatriated
less to the United States. Firms that increased parent equity provisions around the time of the
tax holiday, however, had significantly higher levels of repatriations. This pattern suggests
that the domestic operations of U.S. MNEs were not capital constrained and were instead
providing liquidity to affiliates. These firms seem to have taken advantage of the HIA by
5
“roundtripping,” that is by replacing retained earnings that would be subject to high
repatriation taxes if there were no tax holiday with new paid-in capital.
Rather than being associated with increased expenditures on domestic investment or
employment, repatriations were associated with significantly higher levels of shareholder
payouts, mainly through share repurchases. The instrumental variable estimates imply that a
$1 increase in repatriations was associated with a $0.79 increase in share repurchases and a
$0.15 increase in dividends. Also, higher levels of repatriations were not associated with
higher levels of management compensation. These results are consistent with the hypothesis
that firms are well-governed on average, in the sense that they paid out the cash accessed
under the HIA and did not use it to increase executive compensation or to inefficiently
increase the scale or scope of firm activities. Additional results highlight the importance of
corporate governance in shaping firm responses to the HIA. Increased repatriations are
associated with higher payouts to shareholders only for firms with reasonably strong
corporate governance as measured by Gompers, Ishii, and Metrick (2003).
The results in this paper inform policy in three ways. First, firms that employed strategies to
reduce repatriation taxes tended to repatriate more under the HIA than other firms, indicating
that it is not possible to eliminate the burden of repatriation taxes.10 Second, the results on
governance suggest that agency issues should be considered when designing corporate tax
policy, as also argued in Chetty and Saez (2005) and Crocker and Slemrod (2005). Finally,
government regulations on how firms used the repatriated funds appear to have been
ineffective. Although the results in this paper do not imply that firms violated the provisions
of the HIA, it is clear that they were able to reallocate funds internally to bypass the publicly-
stated goals of the Act.
The HIA has already attracted considerable scholarly attention. Using more limited samples
of firms and tests that do not address potential endogeneity or omitted variable problems,
10 Other studies of the HIA and of tax holidays provide further evidence of the effects of taxes on repatriations. Graham, Hanlon and Shevlin (2008a, b) provide survey evidence that taxes and accounting-expense recognition are important in repatriation decisions. Albring, Dzuranin, and Mills (2005) estimate a high tax cost of the HIA, and De Waegenaere and Sansing (2008) show theoretically how a repatriation tax holiday would increase firm value.
6
Baghai (2009), Blouin and Krull (2008) and Clemons and Kinney (2007) find that firms
which repatriated or reported definite plans to repatriate during the tax holiday increased share
repurchases more than firms that did not repatriate, a result consistent with our findings.
Using a smaller sample drawn from the S&P 500, Brennan (2008) finds that repatriating firms
did not return funds to shareholders through share repurchases, dividends or net debt
buybacks. He and Baghai (2009) also find that valuations of firms that repatriated under the
HIA, especially those with weak corporate governance, fell around the time of its passage.
They interpret this as evidence that investors believed that repatriated funds would be spent
on activities that destroyed value. In contrast, Oler, Shevlin and Wilson (2007) find that firms
with foreign earnings in low-tax jurisdictions experienced a significant increase in stock
prices and market value prior to the passage of the Act. Interpreting the results of these event
studies is complicated, however, because the Act was discussed for some time before it
became law.
The remainder of this paper is organized as follows. Section II describes U.S. international
tax policy and the implications of the HIA. Section III describes the data, and Section IV
discusses estimation issues. Section V reports the results, and Section VI concludes.
II. U.S. International Tax Policy
The United States and many other countries tax the foreign income of their residents. In order
to avoid double taxation of foreign income, U.S. law grants tax credits for foreign income
taxes paid abroad. U.S. MNEs are permitted to defer U.S. tax liabilities on certain foreign
profits until they are repatriated. Taxes due upon repatriation are generally equal to the
difference between foreign income taxes paid and tax payments that would be due if earnings
were taxed at the U.S. rate. For example, if the U.S. tax rate is 35%, and a U.S. MNE earns
$100 abroad and pays $20 in host country income taxes, an additional $15 would be due in
U.S. taxes when the earnings are repatriated. If foreign income taxes paid exceed the amount
that would be due if earnings were taxed at the U.S. rate, then no additional taxes are owed.
Total U.S. tax obligations on distributed foreign earnings are determined by worldwide
averaging. This approach allows firms that pay tax rates above the U.S. tax rate in a

7
particular jurisdiction to use the foreign tax credits from this jurisdiction to shield income
repatriated from low tax locations from U.S. taxation. However, these foreign tax credits
cannot be used to reduce tax obligations related to income earned within the United States.
There are some limits to the extent to which firms can avoid U.S. taxation through deferral.
Under the Subpart F provisions of the U.S. law, certain kinds of income, classified as “passive
income,” are deemed distributed and therefore immediately taxable by the United States even
if not repatriated. Passive income includes interest income and dividends received from
investment in securities.
These rules provide incentives for firms to engage in avoidance behavior and suggest that
certain kinds of firms are most likely to benefit from a tax holiday. The tax costs of
repatriations are higher for firms that operate abroad in low tax jurisdictions, and Desai,
Foley, and Hines (2007) show that such firms have lower repatriations. 11 Firms are often
better off holding earnings in a low tax jurisdiction in liquid securities rather than repatriating
them, even though earnings from these passive investments are deemed distributed and
therefore taxable. To illustrate this point, consider the previous example in which an
incorporated affiliate earned $100 and pays $20 in foreign income taxes. If the firm
repatriates these earnings immediately, it pays an additional $15 in U.S. taxes and then can
invest the remaining $65 in passive assets. Any earnings associated with this investment are
taxed at the U.S. rate. However, if the firm does not repatriate the earnings, it can invest $80
in the liquid security. While Subpart F regulations require the firm to pay U.S. taxes on
earnings associated with this investment, the firm will be better off holding cash abroad
because by doing so it defers the repatriation taxes on the original $100 of active earnings.
Foley, Hartzell, Titman, and Twite (2007) present evidence that such incentives are important
in explaining the cash holdings of firms.
Another common strategy to avoid repatriation taxes involves the indirect ownership of
foreign affiliates, either through holding companies or through affiliates in tax havens that do
11 The early literature analyzing repatriation taxes demonstrated that they should not affect the timing of repatriations if the only alternatives are to repatriate or to reinvest foreign earnings in the foreign affiliate’s operations (Sinn (1984) and Hartman (1985)). The strategy of using foreign earnings to acquire passive assets that are held in the low-tax jurisdiction is analyzed by Weichenrieder (1996).
8
not impose repatriation taxes. Under these kinds of ownership arrangements, earnings do not
need to be returned to the United States before they are invested elsewhere around the world,
thereby avoiding U.S. repatriation taxes. Altshuler and Grubert (2003) and Desai, Foley, and
Hines (2003) illustrate that holding company structures have these effects, and Desai, Foley,
and Hines (2005) show that affiliates in tax havens are instrumental in facilitating deferral
(whether or not they are classified as holding companies). These characteristics of U.S.
international tax law, when combined with the research evidence, suggest that firms facing
low tax rates abroad and firms that make use of holding company structures or tax haven
affiliates should most value the tax holiday on repatriations.
Business lobbyists had historically sought tax breaks on the repatriation of overseas profits,
but the proposal for the HIA started to gain momentum after the 2004 repeal of a tax subsidy
for U.S. exporters that was ruled illegal by the World Trade Organization. If this U.S. tax
subsidy was not repealed, the European Union planned to impose escalating tariffs on U.S.
exports. Firms and lobbyists called for some offsetting policy change. As the economy
showed signs of weakness in the first half of 2004, legislators seriously began to consider a
temporary tax holiday for repatriations, ostensibly as a way of ensuring that U.S.
multinationals had funds to invest domestically. A particularly appealing feature of the
proposal was that it could initially increase tax revenues, albeit balanced by lower revenues in
future years.12
On October 22, 2004, the U.S. Congress passed the AJCA into law. One component of the
AJCA, the HIA, was a temporary tax holiday on the repatriation of dividends from foreign
subsidiaries, subject to a number of restrictions.13 More specifically, the HIA allowed
companies to deduct 85% of their repatriations from additional U.S. taxes for the first taxable
year on or after the HIA was signed. Taxes were still due on the remaining 15% of
repatriations, but firms continued to receive tax credits for foreign income taxes paid on these 12 The Joint Committee on Taxation estimated that the HIA would raise $2.8 billion in tax revenues in fiscal year 2005 but lose $3.3 billion over the 10-year period from 2005-2014 (Kleinbard and Driessen (2008)). 13 Other provisions of the AJCA included: a tax deduction for domestic manufacturing companies, reducing the number of income baskets to calculate a firm’s credit for foreign taxes, extending “temporary” investment incentives for small businesses, allowing taxpayers in states with no income tax to deduct sales taxes from their federal taxes and a series of tax breaks to special interest groups (from tobacco farmers and cruise-ship owners to Native Alaskan whaling captains and bow-and-arrow makers).

9
earnings. For example, if a U.S. multinational earned $100 abroad and paid $20 in host
country income taxes, under the HIA 85% of the foreign earnings would be exempt from U.S.
repatriation taxes and the firm would only need to pay 15% in U.S. taxes on the remaining
$15 in earnings. The firm’s repatriation tax burden would therefore be only $2.25 (=$15 x
15%) under the Act as opposed to $15 (=$100 x 15%) without the Act. If companies did not
take advantage of this benefit by the end of their accounting year after the HIA was passed,
the lower tax rate was not available for future years.
U.S. repatriations only qualified for this tax holiday if they met several criteria. First,
repatriations had to be paid in cash. This required foreign subsidiaries that had already
invested their earnings in real assets and had low cash reserves to raise cash. Second,
qualifying repatriations could not exceed the greater of (a) $500 million, (b) the earnings
reported as permanently reinvested on the last audited financial statements filed on or before
June 30, 2003, or (c) the amount the firm had historically repatriated from its foreign
subsidiaries. This amount of qualifying repatriations was also reduced by the total debt
outstanding from the foreign subsidiary to related parties and by the amount of the increase in
related-party debt between the U.S. firm and its foreign subsidiary. These last qualifications
were intended to prevent companies from borrowing abroad or from their U.S. parent
companies in order to fund repatriations at the lower tax rate.
Finally, repatriations had to be used for certain domestic activities in accordance with a
domestic investment plan in order to qualify for the tax holiday. The investment plan had to
be approved by the company’s president, CEO, or a comparable official before the
repatriations were paid, and then subsequently approved by the company’s board of directors
or management or executive committee. Investments that were “permitted uses” for the
repatriated funds included: hiring and training domestic workers, domestic infrastructure and
capital investments, research and development, financial stabilization (including debt
repayment) for the purposes of U.S. job retention or creation, certain acquisitions of business
entities with U.S. assets, advertising and marketing, and acquisition of rights to intangible
property. Expenditures that were explicitly not permitted uses for repatriations receiving the
tax holiday were: executive compensation, intercompany transactions, dividends and other
10
shareholder distributions, stock redemptions, portfolio investments, debt instruments, and tax
payments. Some economists, such as Clausing (2005), questioned the effectiveness of
specifying “permitted uses” for repatriations. She argues that money is fungible and firms
could simply relabel existing projects that met the qualifying criteria as “new” to qualify for
the tax deduction and then have the freedom to use the repatriated cash in any way.
Even after the HIA was passed in October 2004, considerable uncertainty existed about
important details such as what funds were eligible and how repatriations under the tax holiday
could be spent. As a result, many firms discussed the possibility of using the repatriation tax
holiday in their 2004 annual filings but did not commit to specific actions. This uncertainty
was resolved in a series of clarifying documents released by the U.S. Treasury Department in
late 2004 and early 2005.14 As a result, most companies used this tax holiday in 2005 even
though they knew about it in 2004. This provided parent firms with an opportunity to send
cash abroad in the form of new paid-in capital that could replace retained earnings that were
subsequently repatriated, a practice referred to as “roundtripping.”
III. Data
Analyzing how firms responded to the repatriation tax holiday requires combining data from
several sources. Annual information on repatriations and on U.S. MNE activity from 1996 to
2005 is drawn from the results of two surveys conducted by the BEA. The first of these is the
Survey of Direct Transactions of U.S. Reporter with Foreign Affiliate, which provides
information on annual repatriations from 1996 to 2005 by U.S. MNEs. A U.S. MNE is the
combination of a single U.S. legal entity that has made a direct investment abroad, called the
U.S. parent, and at least one foreign business enterprise, called the foreign affiliate. In the
regression analysis, repatriations are scaled by beginning-of-period consolidated firm assets.
This survey of transactions captures not only repatriation data but also other direct
transactions between the U.S. operations and foreign affiliates of U.S. MNEs. It tracks new
flows of equity from parent companies to their affiliates and allows for analysis of whether
14 On December 21, 2004 the Financial Accounting Standards Board (FASB) issued a document to provide guidance for firms intending to repatriate dividends under the HIA. The U.S. Treasury Department issued a 40-page document providing guidance in January of 2005 and fact sheets with additional guidance in January and May of 2005.
11
firms that injected new paid-in capital also repatriated retained earnings, or engaged in
“roundtripping.”
Figure 1 uses the publicly available aggregates from the BEA data to show total repatriations
around the time of the HIA. Repatriations surged from an average of $62.2 billion per year
from 2000-2004 to $298.7 billion in 2005 under the tax holiday, before falling back to $91.1
billion in 2006.15
The second BEA dataset is drawn from the BEA Survey of U.S. Direct Investment Abroad,
which captures financial and operating information for both the parent companies and foreign
affiliates of U.S. multinationals.16 These data include information on the industry and
location of each affiliate, as well as firm-level information on some outcome variables that are
used to analyze responses to the HIA. These data are currently available through 2005. Firms
are required to report information on their capital expenditures and employment compensation
in the United States, as well as on parent firm liabilities. In the analysis below, investment,
employment compensation, and changes in parent liabilities are scaled by beginning-of-period
consolidated assets.17 This dataset also contains information to create one of the instruments
used for estimation and discussed in more detail in Section IV: information on whether MNE
affiliates are structured as holding companies or are located in tax havens.
Two additional datasets, Compustat and ExecuComp, are the sources of several other
outcome variables in the analysis. Research and development (R&D) expenditures (data item
46), net property, plant and equipment (data item 8), dividends (data item 127), and
repurchases of stock (data item 115) are each drawn from Compustat. These are scaled by
beginning-of-period consolidated assets, which are also measured using Compustat (data item
6). The R&D and net property, plant and equipment variables capture worldwide levels of
15 Data from Bureau of Economic Analysis website, U.S. International Transactions Accounts Data, Table 7b, line 3. 2006 data are preliminary. 16 The forms that firms are required to complete vary depending on the year, size of the parent and affiliate, and the U.S. parent’s ownership stake. The most extensive data are collected in benchmark years – 1999 and 2004. BEA uses reported data to estimate universe totals when surveys cover only larger affiliates or when only certain affiliates provide information on particular survey forms. Only reported data are used in this paper’s analysis. Additional information on the BEA data can be found in Mataloni (2003). 17 All scaled variables are winsorized at the 0.25% level in each tail.

12
activity. Missing values for R&D expenditures are assumed to be zero. ExecuComp is the
source of data on total CEO compensation, including salary, bonus, and the value of stock and
option grants. Like many other variables, CEO compensation is scaled by beginning-of-
period firm consolidated assets.
Compustat data are also used to create the other instrument for repatriations and to compute
the control variables. The second instrument measures the tax costs of repatriating foreign
earnings and is defined in Section IV. Firm leverage, one of the controls, is measured as the
ratio of total debt to the sum of total debt and the market value of equity. Firm investment
opportunities are controlled for using a proxy for Tobin’s q, defined as the ratio of the book
value of firm assets plus the market value of firm equity less the book value of firm equity to
the book value of firm assets. The final controls, firm cash holdings and firm profitability, are
measured as consolidated cash and consolidated net income, respectively, both as a ratio to
consolidated assets.
Finally, the analysis also employs firm-level measures of financial constraints, lobbying
activity, and governance drawn from a variety of sources. Three proxies for financial
constraints are taken from Compustat. The Kaplan-Zingales index is estimated following
Baker, Stein and Wurgler (2003) by using the coefficient estimates from Kaplan and Zingales
(1997).18 The bottom one-third of firms based on this index is classified as financially
constrained. Firms are classified as constrained using payout data if they do not pay
dividends or repurchase shares in 2004. They are classified as constrained based on bond
rating data if their 2004 S&P long-term debt rating is below BBB or if they do not have a
rating in 2004. One potential limitation of these measures of constraints is that they are
typically used to characterize constraints faced by firms as consolidated entities, while the
HIA was intended to alleviate domestic constraints of firms that faced high tax costs of
accessing liquidity held abroad. This issue is discussed further in Section V.
18 The index is calculated as: KZit = 1.002 CFit /Ait_1 39.368 DIVit /Ait_1 1.315 Cit / Ait_1 + 3.139 LEVit + 0.283 Qit; where CFit/Ait_1 is cash flow over lagged assets; DIVit/Ait_1 is cash dividends over assets; Cit/Ait_1 is cash balances over assets; LEVit is leverage; and Tobin’s q is the market value of equity (price times shares outstanding from CRSP) plus assets minus the book value of equity all over assets. All variables used to calculate the index are winsorized at the 1 percent level.
13
Lobbying activities are measured by two variables. The first is a dummy variable equal to one
if the firm was a member of the Homeland Investment Coalition (HIC). The HIC was a group
of firms and organizations formed with the sole purpose of lobbying to reduce the tax rate on
U.S. repatriations. The second measure is political contributions by each firm’s political
action committee to key politicians directly responsible for crafting the HIA tax legislation,
namely members of the Senate Finance and House Ways and Means Committees.19 These
data are from the Federal Election Commission website (www.fec.gov). Because it is
impossible to identify which contributions were targeted specifically at reducing the tax rate
on repatriations, the analysis uses total contributions in 2003-2004 as well as the difference in
contributions from 2003-2004 versus 2000-2001 in order to isolate any change from baseline
contributions that occurred during the period when the tax holiday was under discussion. The
data show that political contributions from firms to these two key tax-writing committees
increased from $16.6 million in 2000-2001 to $20.7 million in 2003-2004. Firm governance
is measured using the index created by Gompers, Ishii, and Metrick (2003).
Table 1 reports summary statistics for the complete data set created by the merger of this
information from the two BEA surveys, Compustat, ExecuComp, and the information on
lobbying and governance. In the full sample of 924 firms in 2005, 261 firms repatriated
foreign earnings.
IV. Estimation and First-Stage Results
The empirical analysis in this paper exploits differences in how the HIA affects the tax costs
of repatriating across firms to explore how firms respond when they face lower costs of
accessing one type of internal capital. This section discusses the estimation strategy and the
next section tests for effects on several outcome variables, including domestic capital
expenditures, domestic employment compensation, R&D expenditures, parent leverage, firm
expansion, CEO compensation, dividends to shareholders, and share repurchases.
19 Political contributions include dollar contributions plus the estimated dollar value of “in kind” contributions and “independent expenditures on behalf of candidate.” The data do not include contributions from individuals, “friends of” committees, or issue groups. The resulting data set has information on over 63,000 contributions to members of the House Ways and Means and Senate Finance Committees from 1999 through 2006.
14
A simple OLS specification to estimate the impact of dividend repatriations on each of these
outcome variables would take the following form:
Vit = βRit + Xitγ + μi + δt + εit , (1)
where Vit measures the outcome variable of interest for firm i in year t, Rit is repatriations by
firm i in year t, Xit is a vector of controls, μi is a firm effect, δt is a year effect, and εit is the
error term. In order to control for correlations that might be induced by changes in firm size
through time, the outcome variables, repatriations, and control variables are scaled.
Specifically, repatriations and all measured outcome variables are scaled by beginning-of-
period consolidated firm assets.
This general estimating framework has two potential problems, endogeneity and omitted
variable bias, either of which could cause OLS estimates of β to be biased downwards or
upwards. For example, an omitted variable such as domestic cash flows could bias estimates
of β downward. If domestic earnings were high, this could lead to an increase in domestic
investment or share repurchases while simultaneously reducing the need to repatriate
dividends from abroad. Endogeneity could be a concern because firms might simultaneously
make choices about repatriations and other financial policies. For example, plans for high
levels of domestic capital expenditures could require repatriations, causing a positive
correlation between domestic capital expenditures and repatriations. The challenge of
identifying causality is highlighted by the approaches taken in recent papers that analyze firm
responses to the HIA. Blouin and Krull (2008) regress measures of firm payouts on
repatriations, while Clemons and Kinney (2007) regress repatriations on measures of payouts
and other outcomes.
These problems of omitted variables and endogeneity can be addressed by instrumenting for
Rit. This can be accomplished by using characteristics that are predetermined in relation to
the enactment of the law and that identify firms that were likely to place the greatest value on
the tax holiday interacted with a dummy that is equal to one in 2005, the year of the tax
holiday. Otherwise it is equal to zero. This approach effectively isolates firms that

15
experienced the largest decrease in the costs of accessing earnings retained abroad. First-
stage tests reveal if repatriations in 2005 did reflect a response to the tax incentive in the HIA,
and second-stage tests reveal how firms that experienced the largest decreases in the costs of
accessing retained earnings abroad altered their behavior, relative to other firms. This
identification approach also has the advantage of making it unlikely that the estimated effects
of repatriations pick up the effect of other provisions of the AJCA or other events in 2005.
As the discussion of U.S. international tax policy in Section II illustrates, firms that should
place the highest value on a repatriation tax holiday are those that (a) face lower corporate tax
rates abroad and (b) have an affiliate that is a holding company or in a tax haven. The first
instrument is constructed by interacting a dummy for 2005 with an indicator that captures the
tax cost of repatriating earnings. These tax costs are calculated using Compustat data by
subtracting foreign taxes paid (data item 64) from the product of a firm’s foreign pretax
income (data item 273) and the U.S. statutory tax rate, with the maximum of this difference or
zero scaled by total firm assets. Foley, Hartzell, Titman, and Twite (2007) describe this
measure in more detail and show that it explains differences in the extent to which U.S. based
firms hold cash abroad. The indicator is equal to one if the parent’s foreign tax burden
exceeded the median value for the sample in 2004. The second instrument is intended to
capture whether firms have structures that allow them to relocate earnings among foreign
countries without triggering repatriation taxes. Existing research indicates that firms often use
holding companies or affiliates in tax havens to accomplish this objective. The second
instrument is therefore constructed by interacting a dummy for 2005 with an indicator
variable equal to one if the U.S. parent has an affiliate that is located in a tax haven or is a
holding company.20 This indicator is based on organizational structure as it existed in 2004,
prior to repatriations under the HIA.
This estimation approach imposes certain exclusion restrictions. First, levels of foreign taxes
paid and foreign earnings in 2004 are assumed to be exogenous to the repatriation decision.
20 Holding company affiliates are affiliates with an international survey industry code 5512. These affiliates allow U.S. parent companies to indirectly own affiliates elsewhere, thereby facilitating the deferral of U.S. taxes. Countries are identified as tax havens based on the definition in Hines and Rice (1994). Affiliates based in tax havens often perform other activities and are not classified as holding companies even though they are used in chains of ownership that facilitate deferral.
16
These are primarily driven by the location of foreign investments and economic conditions
and tax policy in those locations, factors that are unlikely to be jointly determined with
repatriations. Second, the use of tax haven affiliates and holding company affiliates in 2004 is
also assumed to be exogenous to the repatriation decision. These structures take a
considerable amount of time to establish, so this assumption seems reasonable.
Figure 2 graphs mean repatriations for firms defined as having either low or high benefits
from the tax holiday using these two instruments. More specifically, firms are defined as
having high benefits from the tax holiday if they (a) face lower corporate tax rates abroad and
(b) have an affiliate that is a holding company or in a tax haven. Firms that do not meet these
criteria are defined as having low benefits from a tax holiday. The sample includes the
balanced panel of firms for which data are available from 2001 to 2005. The figure shows
little difference in average repatriations between the two types of firms from 2001 through
2004. In 2005, however, firms classified as having higher benefits from the tax holiday
significantly increased mean repatriations from $23.4 million in 2004 to $122.0 million in
2005. In sharp contrast, firms assessed as having lower benefits from the tax holiday based
on the two instruments had only a small increase in mean repatriations, with repatriations
increasing from $17.2 million in 2004 to $31.9 million in 2005. This provides preliminary
evidence that the instruments successfully identify firms that saw the largest increase in
repatriations under the HIA.
To more formally test the strength of these instruments, Table 2 reports first-stage regressions.
Column 1 presents results of regressing the instruments on dividend repatriations scaled by
lagged consolidated assets with no controls. The specification in column 2 includes the full
set of controls. All regressions include firm and year fixed effects. The tables report the
within-firm R2 and heteroskedasticity-consistent standard errors that have been adjusted for
clustering at the firm level. In each specification the coefficients on the instruments are
positive and highly significant, implying that firms with a high tax cost of repatriating
earnings and firms that have an affiliate located in a tax haven or classified as a holding
company increased repatriations significantly more than other firms in 2005. The last row of
17
Table 2 provides the results of Wald tests for the significance of the instruments. Following
Stock and Yogo (2005), the F-statistics imply that the instruments are not weak.
The fact that firms decided to take advantage of the tax holiday to repatriate such large
amounts of cash to the United States, and that those firms that repatriated the most were those
firms likely to face the highest tax costs of repatriation prior to the holiday, indicates that the
repatriation tax does affect the allocation of cash within the firm.21 Without repatriation
taxes, firms would return more of their foreign earnings to the United States.
V. Firms’ Responses to the HIA
A. Domestic and Firm-wide Responses
Table 3 presents results of tests of the impact of repatriations on U.S. capital expenditures,
U.S. employment compensation, and R&D. This table and several that follow present two
specifications for each outcome variable. The first is based on equation (1) and is similar to
those used in previous studies of the impact of the HIA. The second is an instrumental
variables (IV) specification that uses the two instruments for repatriations. Both
specifications include firm and year fixed effects and report heteroskedasticity-consistent
standard errors clustered by firm in parentheses.
The dependent variable in columns 1 and 2 of Table 3 is U.S. capital expenditures scaled by
lagged firm consolidated assets. The 0.0212 coefficient on repatriations in column 1 is small
in magnitude and insignificant. It implies that increases in repatriations are not significantly
correlated with increases in domestic capital expenditures over the sample period. In the IV
specification in column 2, the coefficient on repatriations is close to zero and remains
insignificant. This estimate implies that those firms that, because of their characteristics,
repatriated an extra $1 of earnings from abroad under the HIA invested less than one cent
21 The large response suggests that for many firms, the effective U.S. tax burden on foreign income exceeds the 5.25% rate available during the holiday (adjusted appropriately for foreign tax credits). However, it does not reveal how much larger the burden is and so is not necessarily inconsistent with the claim that the effective U.S. tax burden on foreign income is quite low (e.g. Grubert and Mutti (2001)). Also, for the same reason, it is not necessarily the case that the tax holiday provided a large windfall gain to U.S. MNEs or their shareholders. The gain only reflects the difference between the prior effective tax burden and the 5.25% HIA rate (adjusted for foreign tax credits) and so may be quite small (as suggested by the relatively small estimates of the long-run revenue loss (Kleinbard and Driessen (2008)).

18
more domestically. The small coefficient and the standard error of 0.1272 rule out the
possibility that increased repatriations have a large positive effect on domestic investment.
These specifications include controls for the determinants of investment that are standard in
previous work. The coefficient on leverage is negative, as in Lang, Ofek, and Stulz (1996)
and other studies. The coefficient on lagged Tobin’s q is positive, as is the coefficient on
lagged profitability. Lagged cash is insignificant in explaining investment.
The specifications in columns 3 through 6 of Table 3 repeat these tests, analyzing changes in
U.S. employment compensation and levels of R&D spending, both scaled by lagged
consolidated assets. None of the coefficients on repatriations is significant, and those in the
IV specifications are negative. Alternative measures of employment yield similar results,
including U.S. employee compensation less CEO compensation scaled by lagged consolidated
assets or the change in U.S. employment scaled by lagged consolidated firm employment.
These results, along with those on U.S. capital expenditures, indicate that the decreased costs
of accessing earnings retained abroad under the HIA did not increase domestic employment,
investment, or R&D.
Table 4 repeats this analysis for three other measures of firm activity. The dependent variable
in the first two specifications is the change in parent liabilities scaled by lagged consolidated
assets. The coefficients on repatriations in the OLS and IV specifications are again
insignificant, therefore providing no evidence that firms that increased repatriations under the
HIA paid down debt and engaged in financial stabilization. Although firms do not appear to
have increased their scale through capital expenditures, they might have done so through
acquisitions. The specifications in columns 3 and 4 attempt to capture this possibility by
analyzing changes in consolidated net property, plant and equipment. The OLS and IV results
indicate that firms did not respond to the HIA by significantly expanding their scale. The last
two columns test if repatriations had an effect on CEO compensation, measured by the level
of CEO compensation scaled by lagged consolidated assets. Unlike the other outcome
variables considered in Tables 3 and 4, CEO compensation was not a “permitted use” for
repatriations under the HIA guidelines set by the U.S. Treasury. Columns 5 and 6 of Table 4
19
show that there was also no significant impact of higher repatriations on CEO compensation
according to either estimation technique.22
The tests presented in Table 5 analyze the effects of repatriations on firm payouts to
shareholders defined as the sum of dividends and share repurchases. The coefficient on
repatriations is positive and marginally significant in explaining payouts scaled by lagged
assets in the OLS specification in column 1. The IV results in column 2, however, suggest
that the impact of repatriations under the HIA on payouts is larger and statistically significant.
This estimate implies that a $1 increase in repatriations under the HIA spurred a $0.92
increase in payouts to shareholders.
In order to understand better the relation between repatriations and shareholder payouts,
columns 3 through 6 of Table 5 repeat the analysis in columns 1 and 2, but break payouts into
its two components: dividends and share repurchases. The coefficients on repatriations are
positive in each column but only significant at the 5% level for the IV results for share
repurchases. This indicates that the main effect of higher repatriations on payouts occurred
through increased share repurchases instead of increased dividend payments. Moreover, the
0.7893 coefficient on repatriations in column 6 suggests that a $1 increase in repatriations
under the HIA increased repurchases by $0.79. This series of results suggests that the primary
domestic impact of the repatriations under the HIA tax holiday was to increase share
repurchases. This use of the repatriations was not one of the political justifications for the
holiday and was explicitly specified as not being a “permitted use” of the cash repatriated
under the lower tax rate.
Two aspects of the results in Table 5 deserve comment. First, the OLS estimates of the effect
of repatriations are considerably smaller than the IV results. As explained in Section IV, the
OLS results could be biased downward for a number of reasons. For example, domestic cash
flows are not observed, and if payouts were higher and repatriations were lower when these
flows are higher, this set of relationships would generate a negative bias on the repatriation
22 This measure of executive compensation does not incorporate the potential indirect effects of repatriations on executives’ income or wealth through changes in dividends, share repurchases, or share prices.
20
coefficient. The inclusion of year and firm fixed effects also has a large impact on estimates
in the OLS specifications. They absorb most of the variation in repatriations, leaving little
scope to identify any effects. In contrast, the IV specifications identify effects using
heterogeneity in 2005 repatriations that is induced by differences in how firms responded to
the HIA. When firm and year fixed effects and controls are omitted from the OLS
specification, the coefficient on repatriations is larger; a simple OLS regression of payouts on
repatriations, both scaled by lagged consolidated assets, with no controls or firm and year
fixed effects yields a coefficient estimate of 0.4882 on repatriations with a standard error of
0.0811.
Second, although the two forms of shareholder payouts analyzed in Table 5—share
repurchases and dividends—are equivalent in simple models of the firm without taxes and
with perfect information, it is not surprising that firms chose to return the repatriated cash to
shareholders mainly through share repurchases instead of dividends. The ability to access
foreign cash at a lower cost was transitory. Because share repurchases do not imply as much
of a commitment to make regular distributions as dividend payments, firms would have been
more likely to respond to this temporary change by repurchasing shares instead of paying
dividends.23
The fact that firms increased payouts to shareholders primarily through repurchases rather
than dividends also suggests that this behavior was not simply a delayed response to the 2003
dividend tax cut. In 2003, Congress enacted the Jobs and Growth Tax Relief Reconciliation
Act, reducing the tax rate on most dividend income to 15%. Chetty and Saez (2005) show that
this reform led to a substantial increase in dividend payments by U.S. firms. The payout
response to the HIA appears to be a distinct phenomenon, however, as it primarily took the
form of repurchases rather than dividends.
23 Lintner (1956) and subsequent work indicates that firms select levels of dividend payments that can be sustained. Also, since paying dividends requires making a formal announcement, while repurchasing shares does not, firms may have preferred to return the cash to shareholders in a manner which avoided having to make a formal announcement that could draw attention to this prohibited use of the funds.
21
Taken together, the results in tables 3-5 suggest that repatriations did not alleviate any
financial constraints. Firms that valued the tax holiday the most and took greatest advantage
of it did not increase domestic investment or employment, instead returning virtually all of the
cash they repatriated to shareholders. 24 This behavior is consistent with simple models of the
firm which show that if firms are not capital constrained and are well-governed, they will
return excess cash to shareholders. Managers do not appear to have used the repatriated cash
to increase management compensation, acquisitions, or investment or to have taken any
actions that are symptomatic of certain types of agency problems. Closer examination of the
types of firms that chose to repatriate and analysis of how different kinds of firms responded
to the HIA offers further insight on these issues.
B. Further Evidence on Financial Constraints
The previous section shows that firms did not increase domestic investment when they were
able to access retained earnings abroad at lower costs, a finding which is inconsistent with the
view argued by many advocates of the HIA that firms were financially constrained. To
further explore the validity of this view, this section extends this analysis by considering the
prevalence of financial constraints among U.S. multinationals. It analyzes if such constraints
affected investment responses to the HIA and examines if firms engaged in “roundtripping.”
If U.S. MNEs were not financially constrained at the time of the HIA, they should have been
able to raise new capital at a reasonable cost if they needed domestic liquidity; they would not
be reliant on capital held abroad. Table 6 presents statistics on the prevalence of financial
constraints among three sets of firms: the full set of Compustat firms and the subsets of
multinational and non-multinational firms. These statistics are computed using 2004
Compustat data, and multinationals are defined as those firms that report pretax foreign
income (data item 273). The three measures of constraints, defined in Section III, are based
on the Kaplan-Zingales index, whether or not the firm makes payouts to shareholders, and the
24 Redmiles (2008) and several press accounts indicate that the beneficiaries of the HIA were concentrated in the pharmaceutical industry. Removing firms in this industry does not alter the main results. It has also been widely reported that repatriations may have been highly skewed, with several firms repatriating more than $10 billion. Removing these firms from the sample also does not change the key findings discussed in this paper.
22
firm’s credit rating. For each of these measures, multinationals appear less constrained than
other firms in Compustat.
A substantial fraction of multinationals are classified as being constrained using each
measure, and these firms might have increased investment in response to the HIA.
Alternatively, common measures of financial constraints may not be appropriate for
measuring if MNEs were domestically constrained because of the tax costs of accessing
foreign earnings. It is possible that firms that lobbied extensively for the Act were financially
constrained domestically in a way that is difficult to observe using consolidated firm data.
These firms may have responded to the tax holiday in a manner that is consistent with the
stated intentions of lawmakers.
The analysis presented in Table 7 considers these possibilities by repeating the test presented
in Column 2 of Table 3. The top panel shows results splitting firms into those that are
classified as being constrained or unconstrained according to each of the three measures of
financial constraints. The table only reports the key coefficient estimates on repatriations.
The estimates indicate that no matter which measure of financial constraints is used, firms
classified as being constrained did not significantly increase U.S. investment—the same result
as for the full sample of firms. Repeating this analysis to test for effects on U.S. employment
compensation and R&D expenditures yields the same finding. Repatriations under the HIA
are not associated with increased domestic investment, employment or R&D activity, even for
U.S. multinational companies that appear to be financially constrained.25
Many firms lobbied extensively for a lower tax on repatriations, and as part of this lobbying
effort, they claimed they would use the repatriations to increase investment and R&D and hire
workers. For example, the “Homeland Investment Coalition” (HIC) wrote a letter to the
Chairman of the key tax-writing committee in the House of Representatives and argued that a
tax holiday on repatriations would “benefit the U.S. economy by: increasing domestic
25 Unreported tests show that firms classified as being constrained repatriated significantly less during the holiday than other firms. This finding is consistent with results in Foley, Hartzell, Titman, and Twite (2007) which indicate that the repatriations of constrained firms exhibit little sensitivity to tax considerations.
23
investment in plant, equipment, R&D and job creation...”26 To test whether these firms may
have been constrained in a way not captured by traditional measures, the bottom panel of
Table 7 repeats the analysis in the top panel of the table, but divides the sample of firms in
three different ways based on their lobbying activities. Columns 1 and 2 present results for
firms that were and were not members of the HIC—the coalition formed with the sole purpose
of lobbying to reduce the tax rate on U.S. repatriations. Columns 3 and 4 present results for
subsamples created on the basis of whether the firm’s PAC made any contributions to the
members of the Senate or House tax writing committees, and columns 5 and 6 present results
for subsamples based on whether firms increased their contributions to these tax-writing
committees in 2003-2004 (when the HIA was being debated) relative to their 2000-2001
contributions. For each subsample, the estimated effects of repatriations on domestic
investment are insignificant. No matter which of the measures of lobbying is utilized,
repatriations in response to the holiday by firms that lobbied for the HIA did not significantly
increase investment in the United States.27
A final test of the extent to which firms were financially constrained involves analyzing the
relation between repatriations from affiliates to parents and provisions of new paid-in equity
capital from parents to affiliates before and during the tax holiday. If the domestic operations
of U.S. multinationals were financially constrained around the time of the tax holiday,
repatriations should be negatively correlated with infusions of new equity capital to foreign
affiliates. If firms reinvested earnings abroad in illiquid assets prior to the HIA, however,
they might decide to change the financing of these assets by increasing paid-in capital and
repatriating retained earnings. This would generate a positive correlation between
repatriations of new capital and equity infusions around the time of the holiday.
Table 8 presents the results of tests for a relationship between repatriations and equity
provisions from U.S. parent companies to their foreign affiliates, both scaled by lagged
consolidated firm assets. The specification in column 1 regresses repatriations in a particular
26 Letter to the Honorable Bill Thomas, Chairman of the Committee on Ways and Means in the U.S. House of Representatives, written by the Homeland Investment Coalition on March 21, 2003. 27 This analysis yields similar results if the dependent variable is U.S. employment compensation or R&D expenditures.
24
year on a dummy equal to one if the parent provided equity to its affiliate in that year and this
same variable interacted with a dummy variable for the year 2005. The analysis points out
correlations rather than illustrating causality. The negative but insignificant coefficient on the
Positive Equity Provision Dummy suggests that during all years except for the tax holiday,
firms in which U.S. parents increased their equity investment in affiliates abroad repatriated
less earnings. The positive and significant coefficient on the Positive Equity Provision
Dummy interacted with the 2005 Dummy, however, shows that in 2005 the relationship
between new parent equity infusions abroad and repatriations was positive and significantly
different from that in previous years.
Column 2 of Table 8 repeats the same regression with the four standard control variables used
in the other regressions, and columns 3 and 4 report the same regressions except measure
equity provisions from the U.S. parent to the foreign affiliate in the current and prior year
instead of just the current year. In column 4, the coefficient on the Positive Equity Provision
Dummy is now negative and significant, and the coefficient on this dummy interacted with
the 2005 Dummy is positive and significant. An F-test reveals that the sum of these
coefficients is also positive and significant. These results imply that U.S. multinationals were
engaging in “roundtripping”; they were injecting capital from their U.S. parents into their
foreign affiliates just as they were repatriating funds to the U.S. from their foreign affiliates at
the lower tax rate. Firms that had domestic operations that were financially constrained
would not have had funds to invest as new equity abroad. Moreover, the magnitude of this
roundtripping could have been large. The firms that repatriated $259 billion in 2005 injected
$104 billion into affiliates abroad over the 2004-2005 period.
C. Further Evidence on Governance
Examining how different kinds of firms responded to the HIA also provides information on
the role of corporate governance. Agency theory suggests that firms which are poorly
governed could use the cash accessed at a lower cost during the tax holiday in ways that do
not maximize the return to shareholders. Such cash could reduce constraints on managers and
give them more freedom to pursue projects that provide private benefits. Even if less well-
governed firms did not spend the repatriated cash immediately, they would be more likely to
25
retain the cash instead of paying it out to shareholders, possibly in order to have more
freedom to pursue projects that do not maximize value in the future.
To test if firm governance affected how firms responded to the tax holiday, Table 9 presents
results of some of the main specifications estimated on subsamples of firms that are classified
as having weak or strong governance. Firms are classified as having weak governance if their
Gompers, Ishii, and Metrick (2003) g index, as measured in 2004, is equal to or greater than
12, which is roughly the seventy-fifth percentile of this index. This subset therefore captures
firms that appear to have particularly poor governance. Firms are classified as having strong
governance if their index in 2004 has a value of 11 or less. Columns 1 and 2 present results of
the specification presented in column 2 of Table 3 that explains U.S. capital expenditures
scaled by lagged consolidated assets. The estimated coefficient on repatriations is
insignificant for firms with weak and strong governance, although it is larger in magnitude for
poorly governed firms (0.2921 as opposed to 0.0042). The results in columns 3 and 4
illustrate that repatriations also do not have a significant effect on CEO compensation for
either set of firms.
The results in columns 5 and 6, however, show a difference between the two subsamples in
the relationship between repatriations and payouts. More specifically, firms with reasonably
strong governance have a significant positive effect of repatriations under the HIA on
payouts, while firms with weak governance have an insignificant and approximately zero
effect of repatriations on payouts. These findings imply that poorly-governed firms did not
respond to the HIA by returning funds to shareholders; this effect is only apparent among
better-governed firms. Although these results do not pinpoint what happened to funds that
were repatriated by firms with weak governance, they are consistent with the hypothesis that
when well-governed firms that are not financially constrained gain access to an internal
source of cash, they return it to shareholders.
VI. Conclusion
This paper analyzes how firms responded to the temporary reduction in the tax costs of
repatriating foreign earnings under the Homeland Investment Act and reaches four main
26
conclusions. First, the domestic operations of U.S. multinationals were not financially
constrained at the time of the Act. The ability to access an internal source of capital at a
lower cost did not boost domestic investment, employment, or R&D. Statements by
Congressmen and lobbyists indicate that they believed that reducing repatriation taxes would
increase the domestic activities of U.S. MNEs. This paper’s results clearly show that the tax
holiday did not have this effect. Even firms that showed some evidence of being financially
constrained or that explicitly lobbied for the tax holiday did not increase domestic investment,
employment or R&D. Moreover, around the time of the HIA, repatriations were positively
associated with new parent equity provisions to foreign affiliates, suggesting that parent
companies substituted new paid-in capital for reinvested earnings to take advantage of the tax
holiday and repatriate. This “roundtripping” behavior is also inconsistent with the view that
parent operations were financially constrained.
Second, this paper’s results indicate that U.S. multinationals are reasonably well-governed. If
U.S. multinationals had serious agency problems, then managers would have been likely to
respond to the ability to access cash at a lower cost under the HIA in ways to maximize their
private return instead of shareholder value. For example, managers may have increased their
own compensation or engaged in empire building through acquisitions or investment.
Managers might also have reduced external debt in order to reduce future constraints on their
operations by reducing their fixed obligations. The results indicate that increases in
repatriations under the HIA did not have these effects. Instead, the estimates imply that every
extra dollar of repatriated cash was associated with an increase of $0.92 in payouts to
shareholders, largely in the form of share repurchases. Although this response was
concentrated among firms characterized by stronger corporate governance, the results indicate
that agency problems were not significant, on average, in the full sample of firms.
Third, the results in this paper have important implications for U.S. international tax policy.
Discussion of reforming the U.S. tax code often includes a debate on whether reducing or
eliminating the taxation of foreign earnings for U.S. multinationals would have any effect.
Some commentators argue that changes to repatriation taxes would have little impact because
there are numerous ways around these taxes. However, the substantial impact of the HIA on
27
repatriations – especially among firms that appear to have previously attempted to reduce
their repatriation taxes through tax planning strategies – indicates that the relatively high U.S.
tax rate, coupled with the ability to defer paying taxes on foreign earnings until they are
repatriated, provide incentives for firms to keep foreign profits abroad.
Fourth, the results do not provide evidence of a “flypaper” effect for firms. A key goal of the
HIA — and the broader series of tax changes in the AJCA — was to promote investment and
employment in the United States. The HIA and corresponding regulations included specific
guidelines on how cash repatriated at the lower tax rate could be used in order to ensure that
repatriations were mainly used to further these goals. This paper clearly shows, however, that
these guidelines were ineffective in achieving these specific goals. Estimates imply that firms
returned almost all of the repatriated cash to shareholders — a use that was explicitly not
permitted. It is important to emphasize that the results do not imply that firms violated any of
the provisions of the HIA. Rather, they reflect the fact that cash is fungible and that a tax
policy which reduces the cost of accessing a particular type of capital will have difficulty
affecting how that capital is used. This interpretation is supported by survey evidence in
Graham, Hanlon and Shevlin (2008a). Firms report that they used the repatriated cash in a
manner consistent with the HIA regulations, but the repatriations “freed up” cash to use for
other purposes. Thus, the overall effect of what firms did differed from what their public
statements indicated and from what the regulations intended.
Although the HIA does not appear to have spurred the domestic investment and employment
of firms that used the tax holiday to repatriate earnings from abroad, it may still have
benefited the U.S. economy in other ways. The tax holiday encouraged U.S. multinationals to
repatriate roughly $300 billion of foreign earnings and pay most of these earnings to
shareholders. Presumably these shareholders either reinvested these funds or used them for
consumption.28 Either of these activities could have an effect on U.S. growth, investment, and
employment.
28 See Auerbach and Hassett (1991) and Poterba (1991) for evidence on the extent to which shareholders consume out of corporate payouts. The HIA primarily led to a change in the timing of payouts to shareholders, but there is some evidence that the timing of income may affect consumption, as in Shapiro and Slemrod (1995).
28
Finally, the results in this paper suggest several related questions for future research. First,
what are the dynamic effects of tax holidays on repatriations? Will companies repatriate less
in the years immediately following the tax holiday as they hope to receive another “one-time”
tax holiday in the future? This concern may have recently increased as Congress seriously
debated another tax holiday on repatriations as part of the fiscal stimulus package enacted in
2009. Second, while the 2005 tax holiday occurred at a time of abundant credit, could a
similar tax holiday during the current crisis have a different effect because firms may now
face greater financial constraints? Both of these questions will be useful extensions when
more data become available.
29
References Albring, Susan, Ann Dzuranin, and Lillian Mills. 2005. “Tax Savings on Repatriations of Foreign Earnings Under the American Jobs Creation Act of 2004.” Tax Notes, August 8: 655-669. Altshuler, Rosanne and Harry Grubert. 2003. “Repatriation Taxes, Repatriation Strategies and Multinational Financial Policy.” Journal of Public Economics 87: 73-107. Auerbach, Alan and Kevin Hassett. 1991. “Corporate Savings and Shareholder Consumption.” In B. Douglas Bernheim and John B. Shoven, eds. National Saving and Economic Performance. Chicago: University of Chicago Press, pp. 75-98. Baghai, Ramin. 2009. “Corporate Governance and Extraordinary Earnings Repatriations.” Available at SSRN: http://ssrn.com/abstract=1311429. Baicker, Katherine and Douglas Staiger. 2005. “Fiscal Shenanigans, Targeted Federal Health Care Funds, and Patient Mortality.” Quarterly Journal of Economics 120(1): 345-386. Baker, Malcolm, Jeremy Stein and Jeffrey Wurgler. 2003. “When Does the Market Matter? Stock Prices and the Investment of Equity-Dependent Firms.” The Quarterly Journal of Economics 118(3, Aug.): 969-1005. Bates, Thomas. 2005. “Asset Sales, Investment Opportunities, and the Use of Proceeds.” Journal of Finance 60(1): 105-135. Blanchard, Olivier, Florencio López-de-Silanes, and Andrei Shleifer. 1994. “What Do Firms Do with Cash Windfalls?” Journal of Financial Economics 36(December): 337-360. Blouin, Jennifer and Linda Krull. 2008. “Bringing it Home: A Study of the Incentives Surrounding the Repatriation of Foreign Earnings Under the American Jobs Creation Act of 2004.” Working paper available at SSRN: http://ssrn.com/abstract=925348. Brennan, Thomas. 2008. “Cash-Flow and Market Response to Repatriation.” Unpublished working paper. Chetty, Raj and Emmanuel Saez. 2005. “Dividend Taxes and Corporate Behavior: Evidence from the 2003 Dividend Tax Cut.” Quarterly Journal of Economics 120(3): 791-833. Clausing, Kimberly. 2005. “Tax Holidays (and other Escapes) in the American Jobs Creation Act.” National Tax Journal 58(Sept): 331-46. Clemons, Roy and Michael Kinney. 2007. “The Who, Why and What of the One-time Tax Holiday for Repatriations Provided by the American Jobs Creation Act of 2004.” Unpublished working paper.
30
Crocker, Keith and Joel Slemrod. 2005. “Corporate Tax Evasion with Agency Costs.” Journal of Public Economics 89(9-10): 1593-1610. De Waegenaere, Anja and Richard Sansing. 2008. “Taxation of International Investment and Accounting Valuation.” Contemporary Accounting Research 25(4, winter): 1045-66. Desai, Mihir, C. Fritz Foley and James Hines. 2003. “Chains of Ownership, Regional Tax Competition, and Foreign Direct Investment.” In Heinz Hermann and Robert Lipsey, eds. Foreign Direct Investment in the Real and Financial Sector of Industrial Countries. Heidelberg: Springer Verlag, pp. 61-98. Desai, Mihir, C. Fritz Foley and James Hines. 2005. “Foreign Direct Investment and the Domestic Capital Stock.” American Economic Review: Papers and Proceedings 92(2, May): 33-8. Desai, Mihir, C. Fritz Foley and James Hines. 2007. “Dividend Policy inside the Multinational Firm.” Financial Management 36(1): 5-26. Dittmar, Amy and Jan Mahrt-Smith. 2007. “Corporate Governance and the Value of Cash Holdings.” Journal of Financial Economics 83:599-634. Fazzari, Steven, R. Glenn Hubbard, Bruce Petersen. 1988. “Financial Constraints and Corporate Investment.” Brookings Papers on Economic Activity 1: 141-95. Foley, C. Fritz, Jay Hartzell, Sheridan Titman, and Garry Twite. 2007. “Why do Firms Hold so Much Cash? A Tax-Based Explanation.” Journal of Financial Economics 86(3): 579-607. Gompers, Paul, Joy Ishii, and Andrew Metrick. 2003. “Corporate Governance and Equity Prices.” Quarterly Journal of Economics 118(1): 107-166. Gordon, Nora. 2004. “Do Federal Grants Boost School Spending? Evidence from Title I.” Journal of Public Economics 88(9-10): 1771-92. Graham, John, Michelle Hanlon, and Terry Shevlin. 2008a. “Barriers to Mobility: The Lockout Effect of US Taxation of Worldwide Corporate Profits.” Unpublished working paper. Graham, John, Michelle Hanlon, and Terry Shevlin. 2008b. “The Effect of Financial Accounting on the Location, Reinvestment, and Repatriation Decisions of Multinational Companies.” Unpublished working paper. Grubert, Harry and John Mutti. 2001. Taxing International Business Income: Dividend Exemption versus the Current System. Washington, DC: American Enterprise Institute Press. Hall, Bronwyn. 1992. “Investment and Research and Development at the Firm Level: Does the Source of Financing Matter?” NBER Working Paper #4096.

31
Hartman, David. 1985. “Tax Policy and Foreign Direct Investment.” Journal of Public Economics 26: 107-21. Himmelberg, Charles and Bruce Petersen. 1994. “R&D and Internal Finance: A Panel Study of Small Firms in High-Tech Industries.” Review of Economics and Statistics 76:38-51. Hines, James and R. Glenn Hubbard. 1990. “Coming Home to America: Dividend Repatriations by U.S. Multinationals.” In Assaf Razin and Joel Slemrod, eds. Taxation in the Global Economy. Chicago: University of Chicago Press, pp. 161-200. Hines, James and Eric Rice. 1994. “Fiscal Paradise: Foreign Tax Havens and American Business.” Quarterly Journal of Economics 109(1): 149-182 Hines, James and Richard Thaler. 1995. “Anomalies: The Flypaper Effect.” Journal of Economic Perspectives 9(4, Autumn): 217-226. Hubbard, R. Glenn. 1998. “Capital-Market Imperfections and Investment.” Journal of Economic Literature 36: 193-225. Jensen, Michael. 1986. “Agency Costs of Free Cash Flow, Corporate Finance and Takeovers.” American Economic Review: Papers and Proceedings 76 (2):323-329. Kaplan, Steven and Luigi Zingales. 1997. “Do Investment-Cash Flow Sensitivities Provide Useful Measures of Financing Constraints?” Quarterly Journal of Economics 112(1, February): 169-215. Kleinbard, Edward and Patrick Driessen. 2008. “A Revenue Estimate Case Study: The Repatriation Holiday Revisited.” Tax Notes Sept. 22: 1191-1202. Knight, Brian. 2002. “Endogenous Federal Grants and Crowd-out of State Government Spending: Theory and Evidence from the Federal Highway Aid Program.” American Economic Review 92(1, March): 71-92. Lamont, Owen. 1997. “Cash Flow and Investment: Evidence from Internal Capital Markets.” Journal of Finance 52: 83-109. Lang, Larry, Eli Ofek, and René Stulz. 1996. “Leverage, Investment and Firm Growth.” Journal of Financial Economics 40(1): 3-29. Lang, Larry, René Stulz, and Ralph Walkling. 1991. “A Test of the Free Cash Flow Hypothesis: The Case of Bidder Returns.” Journal of Financial Economics 29: 315-35. Lintner, John. 1956. “Distribution of Incomes of Corporations Among Dividends, Retained Earnings, and Taxes.” American Economic Review: Papers and Proceedings 46(2, May): 97-113.
32
Mataloni, Raymond J., Jr. 2003. “U.S. Multinational Companies: Operations in 2001.” Survey of Current Business November: 85-105. Morck, Randall, Andrei Shleifer, and Robert Vishny. 1990. “Do Managerial Objectives Drive Bad Acquisitions?” Journal of Finance 45: 31-48. Oler, Mitchell, Terry Shevlin and Ryan Wilson. 2007. “Examining Investor Expectations Concerning Tax Savings on the Repatriations of Foreign Earnings under the American Jobs Creation Act of 2004.” Journal of the American Taxation Association 29: 25-55. Pack, Howard and Janet R. Pack. 1993. “Foreign Aid and the Question of Fungibility.” Review of Economics and Statistics 75(2,May): 258-65. Poterba, James. 1991. “Dividends, Capital Gains, and the Corporate Veil: Evidence from Britain, Canada, and the United States.” In B. Douglas Bernheim and John B. Shoven, eds. National Saving and Economic Performance. Chicago: University of Chicago Press, pp. 79-71. Rauh, Joshua D. 2006. “Investment and Financing Constraints: Evidence from the Funding of Corporate Pension Plans.” Journal of Finance 61(1): 33-71. Redmiles, Melissa. 2008. “The One-Time Received Dividend Deduction.” Statistics of Income Bulletin Spring: 102-114. Shapiro, Matthew D. and Slemrod, Joel. 1995. “Consumer Response to the Timing of Income: Evidence from a Change in Tax Withholding.” American Economic Review 85(1): 274-283. Sinn, Hans-Werner. 1984. “Die Bedeutung des Accelerated Cost Recovery System für den internationalen Kapitalverkehr.” Kyklos 37: 542-76. Stein, Jeremy. 2003. “Agency, Information and Corporate Investment.” In George Constantinides, Milt Harris and René Stulz, eds. Handbook of the Economics of Finance, pp. 111-65. Stock, James and Motohiro Yogo. 2005. “Testing for Weak Instruments in Linear IV Regression.” In J.H. Stock and D.W.K. Andrews, eds. Identification and Inference for Econometric Models: Essays in Honor of Thomas J. Rothenberg. New York: Cambridge University Press, pp. 80-108. Van De Walle, Dominique. 2007. “Fungibility and the Flypaper Effect of Project Aid: Micro-Evidence for Vietnam.” Journal of Development Economics 84(2, Nov.): 667-85. Weichenrieder, Alfons. 1996. “Anti Tax-avoidance Provisions and the Size of Foreign Direct Investment.” International Tax and Public Finance 3:67-81.
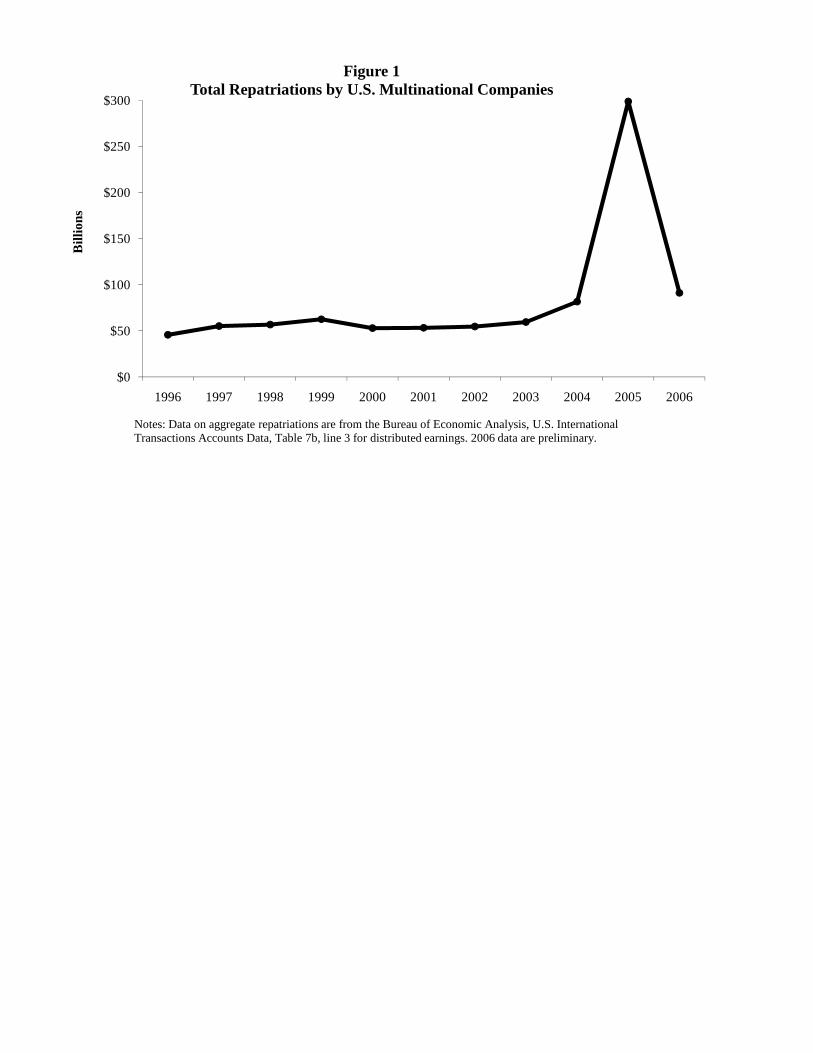
$0
$50
$100
$150
$200
$250
$300
1996 1997 1998 1999 2000 2001 2002 2003 2004 2005 2006
Bil
lion
s
Notes: Data on aggregate repatriations are from the Bureau of Economic Analysis, U.S. International Transactions Accounts Data, Table 7b, line 3 for distributed earnings. 2006 data are preliminary.
Figure 1Total Repatriations by U.S. Multinational Companies
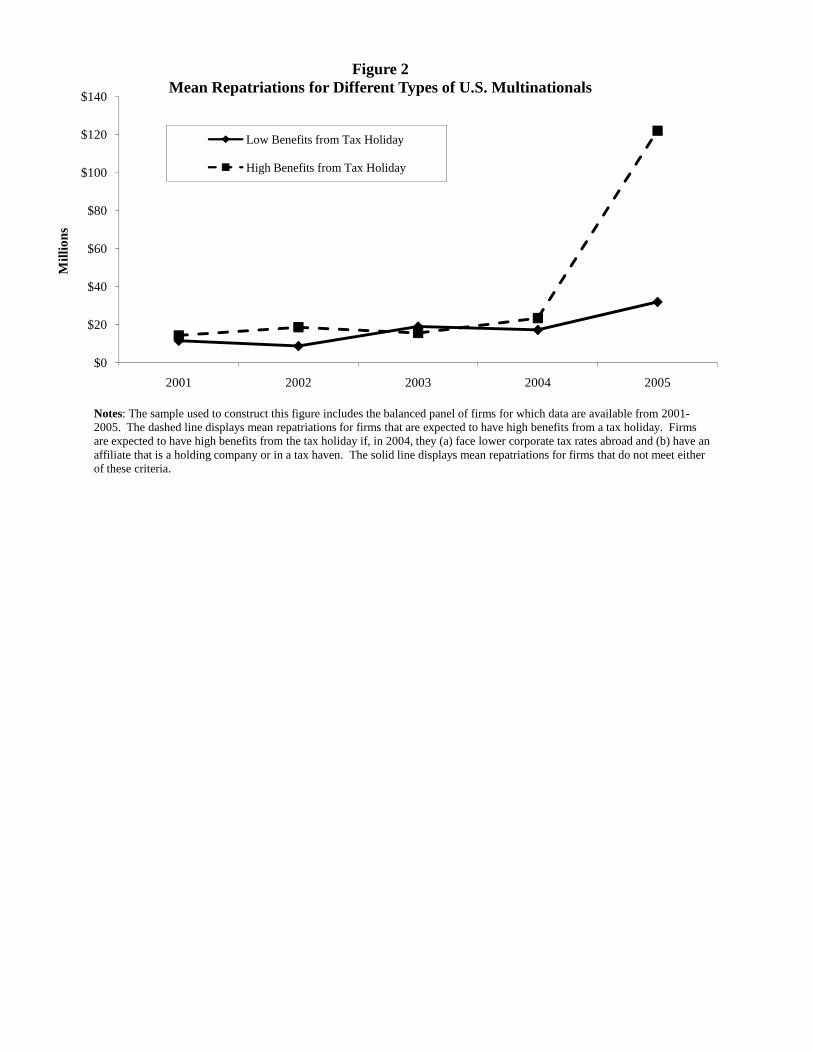
$0
$20
$40
$60
$80
$100
$120
$140
2001 2002 2003 2004 2005
Mil
lion
sFigure 2
Mean Repatriations for Different Types of U.S. Multinationals
Low Benefits from Tax Holiday
High Benefits from Tax Holiday
Notes: The sample used to construct this figure includes the balanced panel of firms for which data are available from 2001-2005. The dashed line displays mean repatriations for firms that are expected to have high benefits from a tax holiday. Firms are expected to have high benefits from the tax holiday if, in 2004, they (a) face lower corporate tax rates abroad and (b) have an affiliate that is a holding company or in a tax haven. The solid line displays mean repatriations for firms that do not meet either of these criteria.
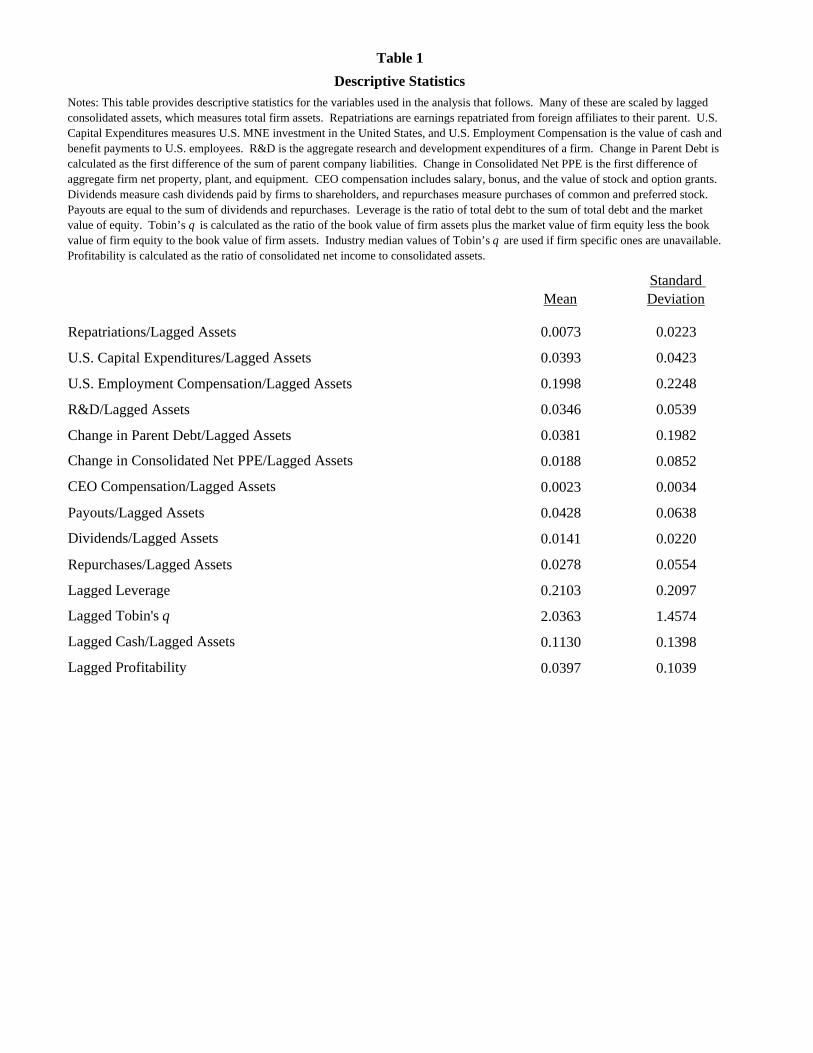
MeanStandard Deviation
Repatriations/Lagged Assets 0.0073 0.0223
U.S. Capital Expenditures/Lagged Assets 0.0393 0.0423
U.S. Employment Compensation/Lagged Assets 0.1998 0.2248
R&D/Lagged Assets 0.0346 0.0539
Change in Parent Debt/Lagged Assets 0.0381 0.1982
Change in Consolidated Net PPE/Lagged Assets 0.0188 0.0852
CEO Compensation/Lagged Assets 0.0023 0.0034
Payouts/Lagged Assets 0.0428 0.0638
Dividends/Lagged Assets 0.0141 0.0220
Repurchases/Lagged Assets 0.0278 0.0554
Lagged Leverage 0.2103 0.2097
Lagged Tobin's q 2.0363 1.4574
Lagged Cash/Lagged Assets 0.1130 0.1398
Lagged Profitability 0.0397 0.1039
Table 1
Descriptive Statistics
Notes: This table provides descriptive statistics for the variables used in the analysis that follows. Many of these are scaled by lagged consolidated assets, which measures total firm assets. Repatriations are earnings repatriated from foreign affiliates to their parent. U.S. Capital Expenditures measures U.S. MNE investment in the United States, and U.S. Employment Compensation is the value of cash and benefit payments to U.S. employees. R&D is the aggregate research and development expenditures of a firm. Change in Parent Debt is calculated as the first difference of the sum of parent company liabilities. Change in Consolidated Net PPE is the first difference of aggregate firm net property, plant, and equipment. CEO compensation includes salary, bonus, and the value of stock and option grants. Dividends measure cash dividends paid by firms to shareholders, and repurchases measure purchases of common and preferred stock. Payouts are equal to the sum of dividends and repurchases. Leverage is the ratio of total debt to the sum of total debt and the market value of equity. Tobin’s q is calculated as the ratio of the book value of firm assets plus the market value of firm equity less the book value of firm equity to the book value of firm assets. Industry median values of Tobin’s q are used if firm specific ones are unavailable. Profitability is calculated as the ratio of consolidated net income to consolidated assets.
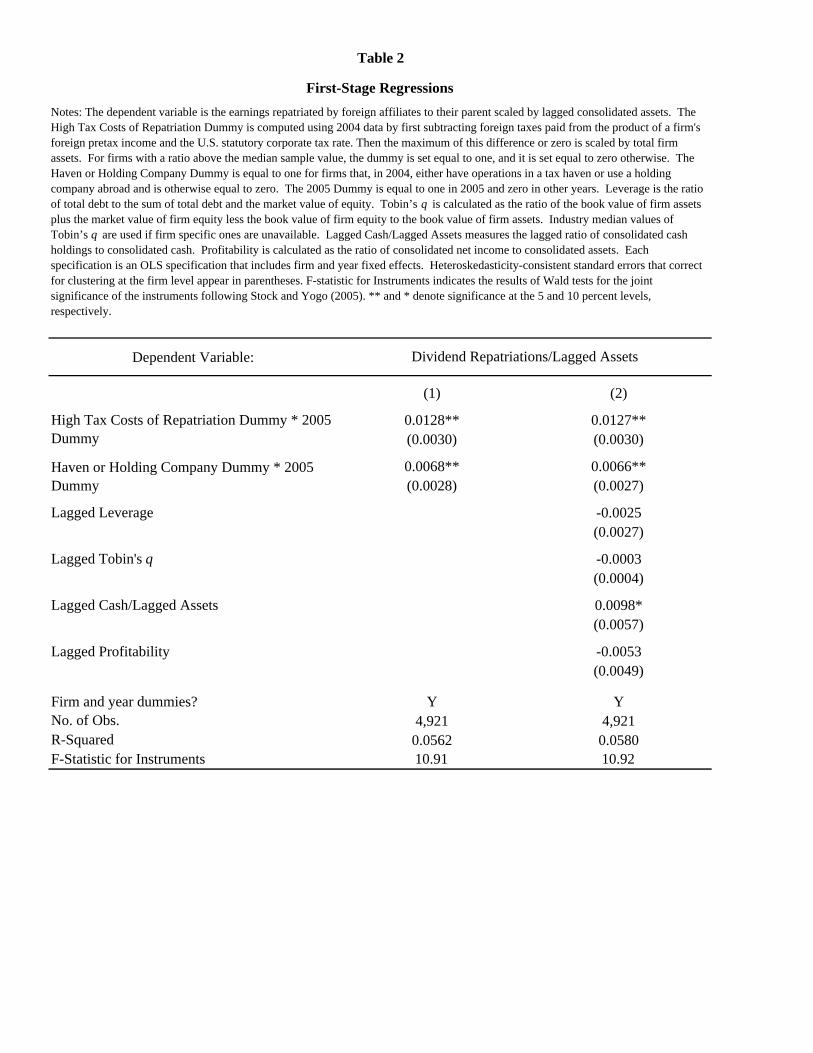
Dependent Variable:
(1) (2)
0.0128** 0.0127**(0.0030) (0.0030)
0.0068** 0.0066**(0.0028) (0.0027)
-0.0025(0.0027)
-0.0003(0.0004)
0.0098*(0.0057)
Lagged Profitability -0.0053(0.0049)
Firm and year dummies? Y YNo. of Obs. 4,921 4,921R-Squared 0.0562 0.0580F-Statistic for Instruments 10.91 10.92
Table 2
Lagged Tobin's q
High Tax Costs of Repatriation Dummy * 2005 Dummy
Lagged Cash/Lagged Assets
Notes: The dependent variable is the earnings repatriated by foreign affiliates to their parent scaled by lagged consolidated assets. The High Tax Costs of Repatriation Dummy is computed using 2004 data by first subtracting foreign taxes paid from the product of a firm's foreign pretax income and the U.S. statutory corporate tax rate. Then the maximum of this difference or zero is scaled by total firm assets. For firms with a ratio above the median sample value, the dummy is set equal to one, and it is set equal to zero otherwise. The Haven or Holding Company Dummy is equal to one for firms that, in 2004, either have operations in a tax haven or use a holding company abroad and is otherwise equal to zero. The 2005 Dummy is equal to one in 2005 and zero in other years. Leverage is the ratio of total debt to the sum of total debt and the market value of equity. Tobin’s q is calculated as the ratio of the book value of firm assets plus the market value of firm equity less the book value of firm equity to the book value of firm assets. Industry median values of Tobin’s q are used if firm specific ones are unavailable. Lagged Cash/Lagged Assets measures the lagged ratio of consolidated cash holdings to consolidated cash. Profitability is calculated as the ratio of consolidated net income to consolidated assets. Each specification is an OLS specification that includes firm and year fixed effects. Heteroskedasticity-consistent standard errors that correct for clustering at the firm level appear in parentheses. F-statistic for Instruments indicates the results of Wald tests for the joint significance of the instruments following Stock and Yogo (2005). ** and * denote significance at the 5 and 10 percent levels, respectively.
Lagged Leverage
First-Stage Regressions
Dividend Repatriations/Lagged Assets
Haven or Holding Company Dummy * 2005 Dummy
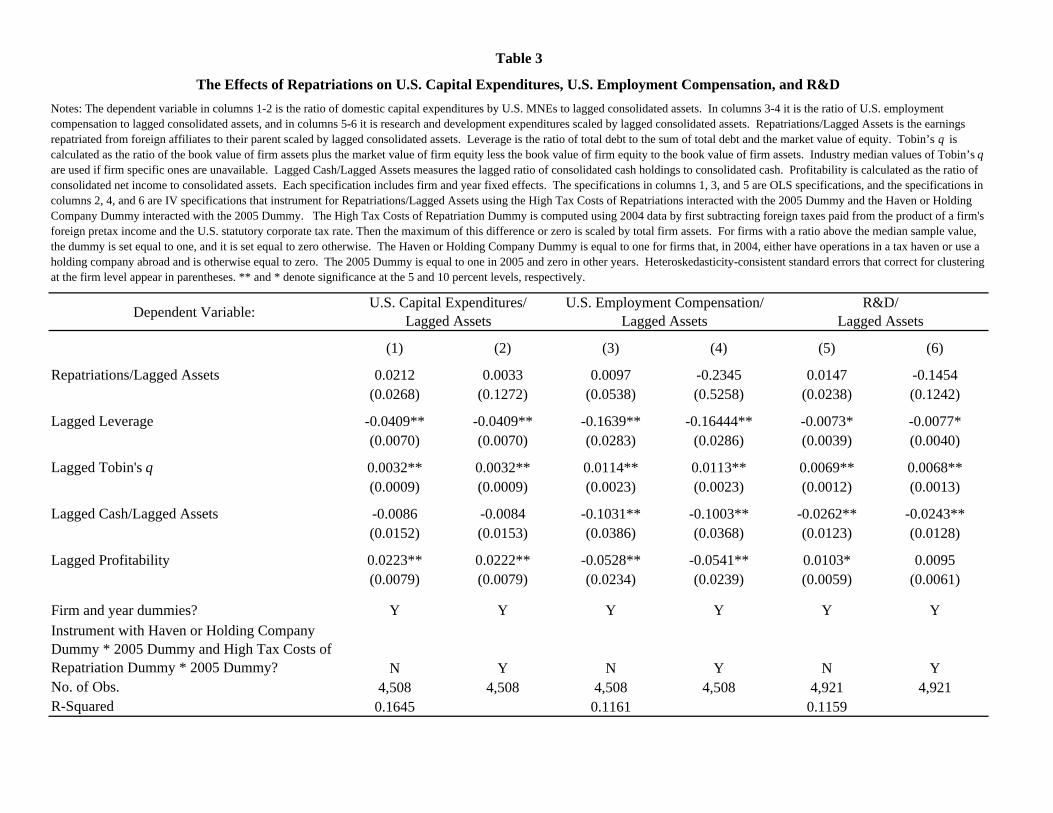
Dependent Variable:
(1) (2) (3) (4) (5) (6)
0.0212 0.0033 0.0097 -0.2345 0.0147 -0.1454(0.0268) (0.1272) (0.0538) (0.5258) (0.0238) (0.1242)
-0.0409** -0.0409** -0.1639** -0.16444** -0.0073* -0.0077*(0.0070) (0.0070) (0.0283) (0.0286) (0.0039) (0.0040)
0.0032** 0.0032** 0.0114** 0.0113** 0.0069** 0.0068**(0.0009) (0.0009) (0.0023) (0.0023) (0.0012) (0.0013)
-0.0086 -0.0084 -0.1031** -0.1003** -0.0262** -0.0243**(0.0152) (0.0153) (0.0386) (0.0368) (0.0123) (0.0128)
Lagged Profitability 0.0223** 0.0222** -0.0528** -0.0541** 0.0103* 0.0095(0.0079) (0.0079) (0.0234) (0.0239) (0.0059) (0.0061)
Firm and year dummies? Y Y Y Y Y YInstrument with Haven or Holding Company Dummy * 2005 Dummy and High Tax Costs of Repatriation Dummy * 2005 Dummy? N Y N Y N YNo. of Obs. 4,508 4,508 4,508 4,508 4,921 4,921R-Squared 0.1645 0.1161 0.1159
R&D/ Lagged Assets
Table 3
The Effects of Repatriations on U.S. Capital Expenditures, U.S. Employment Compensation, and R&D
U.S. Capital Expenditures/ Lagged Assets
U.S. Employment Compensation/ Lagged Assets
Notes: The dependent variable in columns 1-2 is the ratio of domestic capital expenditures by U.S. MNEs to lagged consolidated assets. In columns 3-4 it is the ratio of U.S. employment compensation to lagged consolidated assets, and in columns 5-6 it is research and development expenditures scaled by lagged consolidated assets. Repatriations/Lagged Assets is the earnings repatriated from foreign affiliates to their parent scaled by lagged consolidated assets. Leverage is the ratio of total debt to the sum of total debt and the market value of equity. Tobin’s q is calculated as the ratio of the book value of firm assets plus the market value of firm equity less the book value of firm equity to the book value of firm assets. Industry median values of Tobin’s q are used if firm specific ones are unavailable. Lagged Cash/Lagged Assets measures the lagged ratio of consolidated cash holdings to consolidated cash. Profitability is calculated as the ratio of consolidated net income to consolidated assets. Each specification includes firm and year fixed effects. The specifications in columns 1, 3, and 5 are OLS specifications, and the specifications in columns 2, 4, and 6 are IV specifications that instrument for Repatriations/Lagged Assets using the High Tax Costs of Repatriations interacted with the 2005 Dummy and the Haven or Holding Company Dummy interacted with the 2005 Dummy. The High Tax Costs of Repatriation Dummy is computed using 2004 data by first subtracting foreign taxes paid from the product of a firm's foreign pretax income and the U.S. statutory corporate tax rate. Then the maximum of this difference or zero is scaled by total firm assets. For firms with a ratio above the median sample value, the dummy is set equal to one, and it is set equal to zero otherwise. The Haven or Holding Company Dummy is equal to one for firms that, in 2004, either have operations in a tax haven or use a holding company abroad and is otherwise equal to zero. The 2005 Dummy is equal to one in 2005 and zero in other years. Heteroskedasticity-consistent standard errors that correct for clustering at the firm level appear in parentheses. ** and * denote significance at the 5 and 10 percent levels, respectively.
Repatriations/Lagged Assets
Lagged Leverage
Lagged Tobin's q
Lagged Cash/Lagged Assets
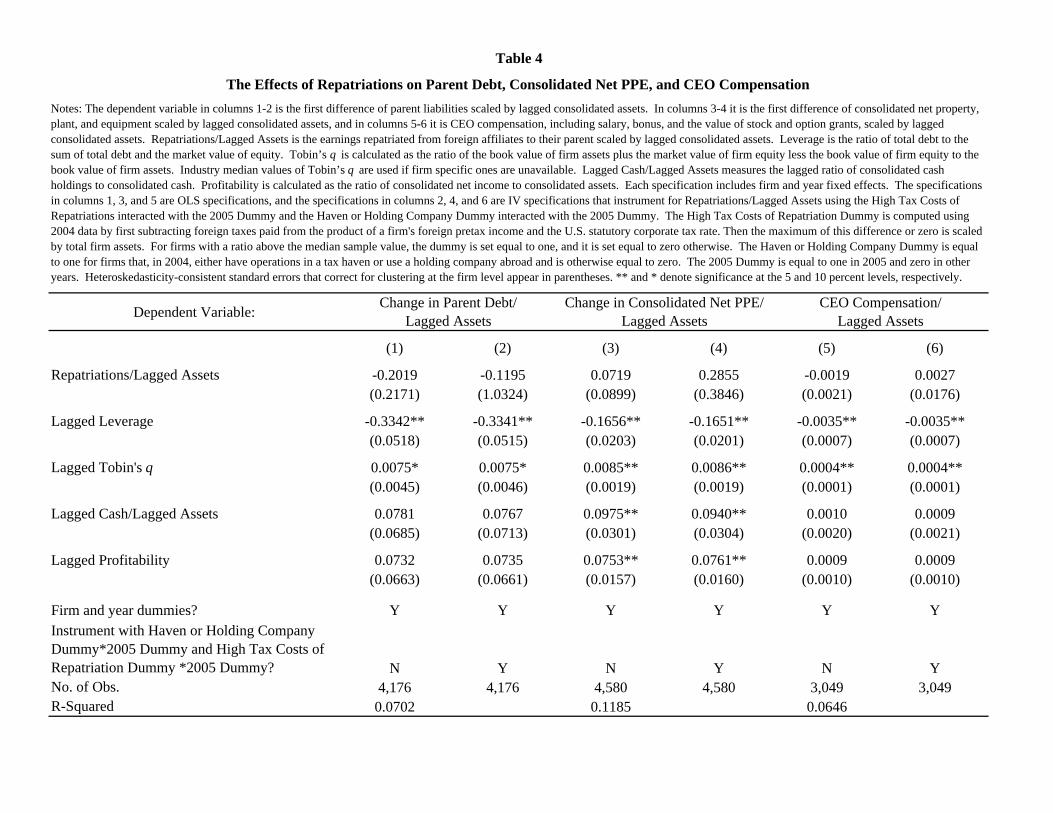
Dependent Variable:
(1) (2) (3) (4) (5) (6)
-0.2019 -0.1195 0.0719 0.2855 -0.0019 0.0027(0.2171) (1.0324) (0.0899) (0.3846) (0.0021) (0.0176)
-0.3342** -0.3341** -0.1656** -0.1651** -0.0035** -0.0035**(0.0518) (0.0515) (0.0203) (0.0201) (0.0007) (0.0007)
0.0075* 0.0075* 0.0085** 0.0086** 0.0004** 0.0004**(0.0045) (0.0046) (0.0019) (0.0019) (0.0001) (0.0001)
0.0781 0.0767 0.0975** 0.0940** 0.0010 0.0009(0.0685) (0.0713) (0.0301) (0.0304) (0.0020) (0.0021)
Lagged Profitability 0.0732 0.0735 0.0753** 0.0761** 0.0009 0.0009(0.0663) (0.0661) (0.0157) (0.0160) (0.0010) (0.0010)
Firm and year dummies? Y Y Y Y Y YInstrument with Haven or Holding Company Dummy*2005 Dummy and High Tax Costs of Repatriation Dummy *2005 Dummy? N Y N Y N YNo. of Obs. 4,176 4,176 4,580 4,580 3,049 3,049R-Squared 0.0702 0.1185 0.0646
Table 4
The Effects of Repatriations on Parent Debt, Consolidated Net PPE, and CEO Compensation
Repatriations/Lagged Assets
Notes: The dependent variable in columns 1-2 is the first difference of parent liabilities scaled by lagged consolidated assets. In columns 3-4 it is the first difference of consolidated net property, plant, and equipment scaled by lagged consolidated assets, and in columns 5-6 it is CEO compensation, including salary, bonus, and the value of stock and option grants, scaled by lagged consolidated assets. Repatriations/Lagged Assets is the earnings repatriated from foreign affiliates to their parent scaled by lagged consolidated assets. Leverage is the ratio of total debt to the sum of total debt and the market value of equity. Tobin’s q is calculated as the ratio of the book value of firm assets plus the market value of firm equity less the book value of firm equity to the book value of firm assets. Industry median values of Tobin’s q are used if firm specific ones are unavailable. Lagged Cash/Lagged Assets measures the lagged ratio of consolidated cash holdings to consolidated cash. Profitability is calculated as the ratio of consolidated net income to consolidated assets. Each specification includes firm and year fixed effects. The specifications in columns 1, 3, and 5 are OLS specifications, and the specifications in columns 2, 4, and 6 are IV specifications that instrument for Repatriations/Lagged Assets using the High Tax Costs of Repatriations interacted with the 2005 Dummy and the Haven or Holding Company Dummy interacted with the 2005 Dummy. The High Tax Costs of Repatriation Dummy is computed using 2004 data by first subtracting foreign taxes paid from the product of a firm's foreign pretax income and the U.S. statutory corporate tax rate. Then the maximum of this difference or zero is scaled by total firm assets. For firms with a ratio above the median sample value, the dummy is set equal to one, and it is set equal to zero otherwise. The Haven or Holding Company Dummy is equal to one for firms that, in 2004, either have operations in a tax haven or use a holding company abroad and is otherwise equal to zero. The 2005 Dummy is equal to one in 2005 and zero in other years. Heteroskedasticity-consistent standard errors that correct for clustering at the firm level appear in parentheses. ** and * denote significance at the 5 and 10 percent levels, respectively.
Change in Consolidated Net PPE/ Lagged Assets
Change in Parent Debt/ Lagged Assets
CEO Compensation/ Lagged Assets
Lagged Cash/Lagged Assets
Lagged Leverage
Lagged Tobin's q

Dependent Variable:
(1) (2) (3) (4) (5) (6)
0.1018* 0.9244** 0.0102 0.1546 0.0882* 0.7893**(0.0589) (0.4192) (0.0127) (0.1082) (0.0511) (0.3606)
-0.0389** -0.0363** -0.0176** -0.0172** -0.0144* -0.0124(0.0106) (0.0112) (0.0033) (0.0033) (0.0086) (0.0090)
0.0038** 0.0042** -0.0003 -0.0003 0.0049** 0.0052**(0.0019) (0.0020) (0.0006) (0.0006) (0.0015) (0.0015)
0.0707** 0.0605** 0.0121* 0.0105 0.0544** 0.0450**(0.0181) (0.0182) (0.0068) (0.0067) (0.0138) (0.0139)
Lagged Profitability 0.0486** 0.0522** 0.0094** 0.0101** 0.0406** 0.0440**(0.0103) (0.0119) (0.0034) (0.0034) (0.0086) (0.0102)
Firm and Year Dummies? Y Y Y Y Y YInstrument with Haven or Holding Company Dummy*2005 Dummy and High Tax Costs of Repatriation Dummy*2005 Dummy? N Y N Y N YNo. of Obs. 4,581 4,581 4,848 4,848 4,649 4,649R-Squared 0.0796 0.0489 0.0675
Repurchases/ Lagged Assets
Payouts/ Lagged Assets
Lagged Tobin's q
Lagged Cash/Lagged Assets
Notes: The dependent variable in columns 3-4 is the ratio of cash dividends to lagged consolidated assets; in columns 5-6 it is the ratio of repurchases of common and preferred shares to lagged consolidated assets, and in columns 1-2 it is the sum of these two. Repatriations/Lagged Assets is the earnings repatriated from foreign affiliates to their parent scaled by lagged consolidated assets. Leverage is the ratio of total debt to the sum of total debt and the market value of equity. Tobin’s q is calculated as the ratio of the book value of firm assets plus the market value of firm equity less the book value of firm equity to the book value of firm assets. Industry median values of Tobin’s q are used if firm specific ones are unavailable. Lagged Cash/Lagged Assets measures the lagged ratio of consolidated cash holdings to consolidated cash. Profitability is calculated as the ratio of consolidated net income to consolidated assets. Each specification includes firm and year fixed effects. The specifications in columns 1, 3, and 5 are OLS specifications, and the specifications in columns 2, 4, and 6 are IV specifications that instrument for Repatriations/Lagged Assets using the High Tax Costs of Repatriations interacted with the 2005 Dummy and the Haven or Holding Company Dummy interacted with the 2005 Dummy. The High Tax Costs of Repatriation Dummy is computed using 2004 data by first subtracting foreign taxes paid from the product of a firm's foreign pretax income and the U.S. statutory corporate tax rate. Then the maximum of this difference or zero is scaled by total firm assets. For firms with a ratio above the median sample value, the dummy is set equal to one, and it is set equal to zero otherwise. The Haven or Holding Company Dummy is equal to one for firms that, in 2004, either have operations in a tax haven or use a holding company abroad and is otherwise equal to zero. The 2005 Dummy is equal to one in 2005 and zero in other years. Heteroskedasticity-consistent standard errors that correct for clustering at the firm level appear in parentheses. ** and * denote significance at the 5 and 10 percent levels, respectively.
Table 5
Repatriations/Lagged Assets
Lagged Leverage
The Effects of Repatriations on Dividends and Repurchases
Dividends/ Lagged Assets

Measure of Financial Constraints: KZ Index Payouts Bond Ratings
(1) (2) (3)
All Firms 34.0% 48.1% 89.0%
Multinational Firms 26.5% 42.0% 84.9%
Non-Multinational Firms 37.0% 50.4% 90.3%
Table 6
Share of Firms Facing Financial Constraints
Notes: This table displays the share of Compustat firms that appear to face financial constraints in 2004, using three different measures of constraints. In column 1, firms are identified as being financially constrained if their KZ index, computed following the technique in Kaplan and Zingales (1997), is among the bottom one third of Compustat firms. In column 2, firms are identified as being financially constrained if they do not pay dividends to common or preferred shareholders or repurchase shares. In column 3, firms are characterized as being financially constrained if their S&P long-term debt rating is below BBB or if they do not have a rating. Multinational Firms are those firms that report pretax foreign income (data item 273).
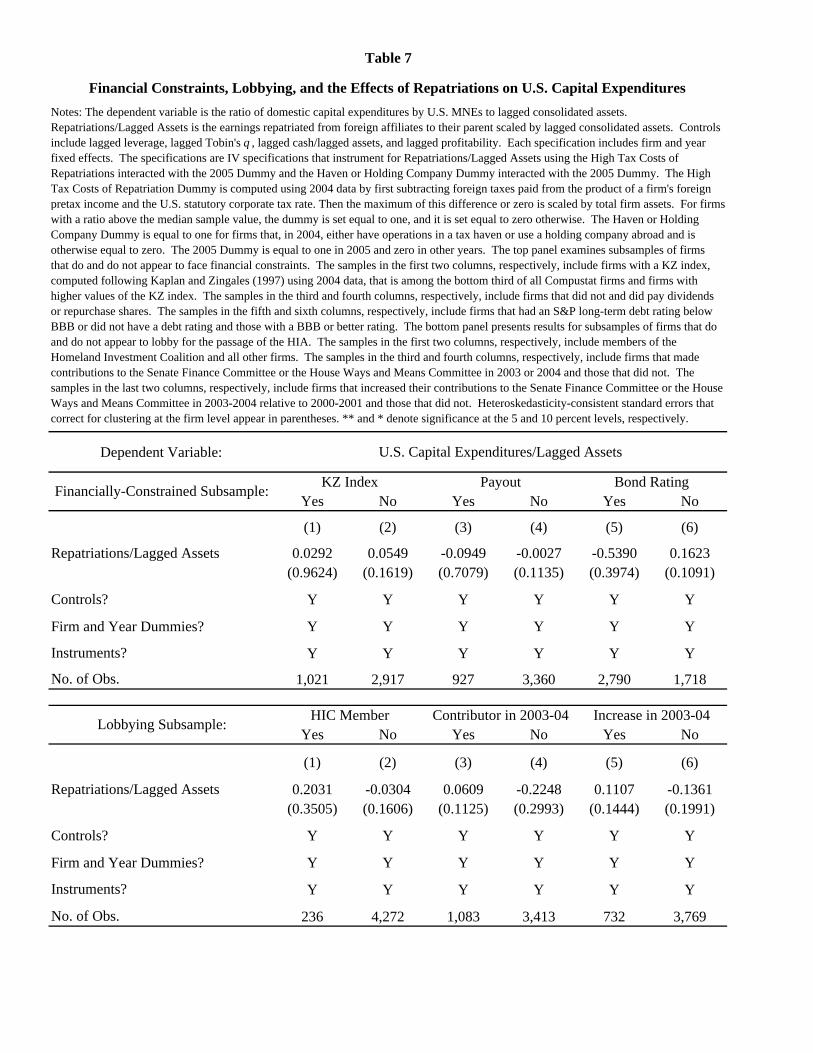
Dependent Variable:
Yes No Yes No Yes No
(1) (2) (3) (4) (5) (6)
0.0292 0.0549 -0.0949 -0.0027 -0.5390 0.1623(0.9624) (0.1619) (0.7079) (0.1135) (0.3974) (0.1091)
Controls? Y Y Y Y Y Y
Firm and Year Dummies? Y Y Y Y Y Y
Instruments? Y Y Y Y Y Y
No. of Obs. 1,021 2,917 927 3,360 2,790 1,718
Yes No Yes No Yes No
(1) (2) (3) (4) (5) (6)
0.2031 -0.0304 0.0609 -0.2248 0.1107 -0.1361(0.3505) (0.1606) (0.1125) (0.2993) (0.1444) (0.1991)
Controls? Y Y Y Y Y Y
Firm and Year Dummies? Y Y Y Y Y Y
Instruments? Y Y Y Y Y Y
No. of Obs. 236 4,272 1,083 3,413 732 3,769
Increase in 2003-04
Repatriations/Lagged Assets
Repatriations/Lagged Assets
Table 7
Financial Constraints, Lobbying, and the Effects of Repatriations on U.S. Capital Expenditures
Notes: The dependent variable is the ratio of domestic capital expenditures by U.S. MNEs to lagged consolidated assets. Repatriations/Lagged Assets is the earnings repatriated from foreign affiliates to their parent scaled by lagged consolidated assets. Controls include lagged leverage, lagged Tobin's q , lagged cash/lagged assets, and lagged profitability. Each specification includes firm and year fixed effects. The specifications are IV specifications that instrument for Repatriations/Lagged Assets using the High Tax Costs of Repatriations interacted with the 2005 Dummy and the Haven or Holding Company Dummy interacted with the 2005 Dummy. The High Tax Costs of Repatriation Dummy is computed using 2004 data by first subtracting foreign taxes paid from the product of a firm's foreign pretax income and the U.S. statutory corporate tax rate. Then the maximum of this difference or zero is scaled by total firm assets. For firms with a ratio above the median sample value, the dummy is set equal to one, and it is set equal to zero otherwise. The Haven or Holding Company Dummy is equal to one for firms that, in 2004, either have operations in a tax haven or use a holding company abroad and is otherwise equal to zero. The 2005 Dummy is equal to one in 2005 and zero in other years. The top panel examines subsamples of firms that do and do not appear to face financial constraints. The samples in the first two columns, respectively, include firms with a KZ index, computed following Kaplan and Zingales (1997) using 2004 data, that is among the bottom third of all Compustat firms and firms with higher values of the KZ index. The samples in the third and fourth columns, respectively, include firms that did not and did pay dividends or repurchase shares. The samples in the fifth and sixth columns, respectively, include firms that had an S&P long-term debt rating below BBB or did not have a debt rating and those with a BBB or better rating. The bottom panel presents results for subsamples of firms that do and do not appear to lobby for the passage of the HIA. The samples in the first two columns, respectively, include members of the Homeland Investment Coalition and all other firms. The samples in the third and fourth columns, respectively, include firms that made contributions to the Senate Finance Committee or the House Ways and Means Committee in 2003 or 2004 and those that did not. The samples in the last two columns, respectively, include firms that increased their contributions to the Senate Finance Committee or the House Ways and Means Committee in 2003-2004 relative to 2000-2001 and those that did not. Heteroskedasticity-consistent standard errors that correct for clustering at the firm level appear in parentheses. ** and * denote significance at the 5 and 10 percent levels, respectively.
U.S. Capital Expenditures/Lagged Assets
Financially-Constrained Subsample:KZ Index Payout Bond Rating
Lobbying Subsample:HIC Member Contributor in 2003-04
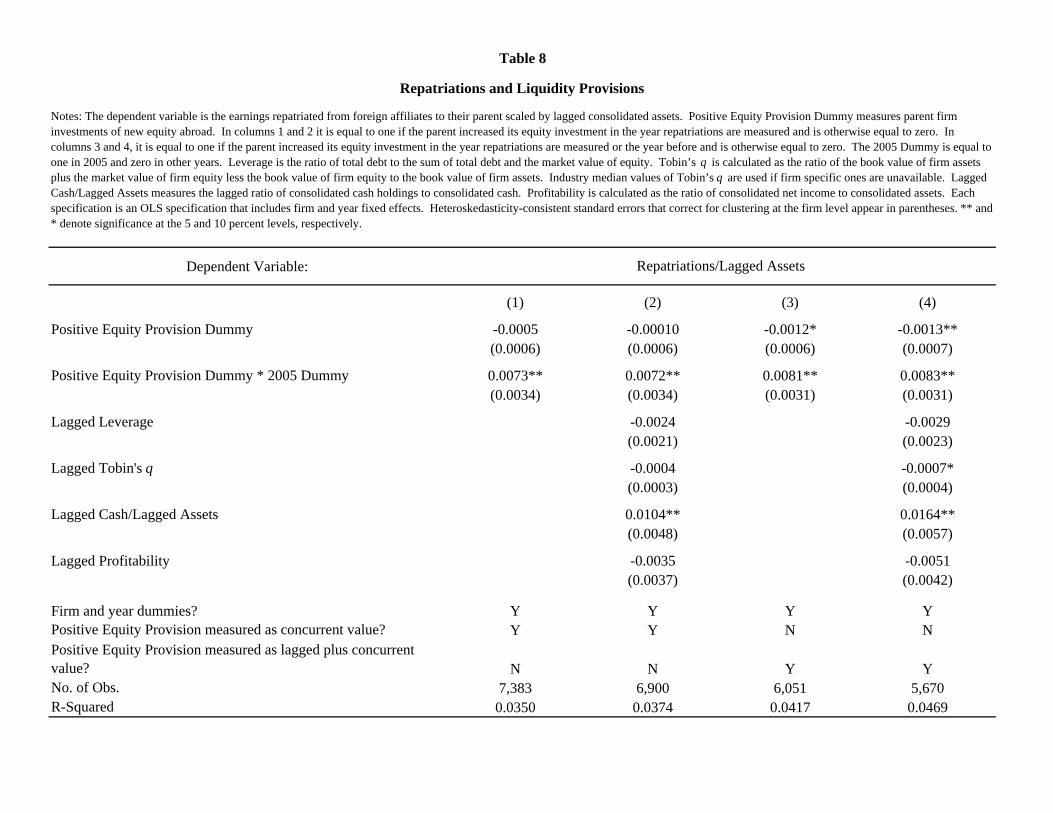
Dependent Variable:
(1) (2) (3) (4)
Positive Equity Provision Dummy -0.0005 -0.00010 -0.0012* -0.0013**(0.0006) (0.0006) (0.0006) (0.0007)
0.0073** 0.0072** 0.0081** 0.0083**(0.0034) (0.0034) (0.0031) (0.0031)
-0.0024 -0.0029(0.0021) (0.0023)
-0.0004 -0.0007*(0.0003) (0.0004)
0.0104** 0.0164**(0.0048) (0.0057)
Lagged Profitability -0.0035 -0.0051(0.0037) (0.0042)
Firm and year dummies? Y Y Y YPositive Equity Provision measured as concurrent value? Y Y N NPositive Equity Provision measured as lagged plus concurrent value? N N Y YNo. of Obs. 7,383 6,900 6,051 5,670R-Squared 0.0350 0.0374 0.0417 0.0469
Repatriations/Lagged Assets
Lagged Leverage
Lagged Tobin's q
Lagged Cash/Lagged Assets
Table 8
Repatriations and Liquidity Provisions
Positive Equity Provision Dummy * 2005 Dummy
Notes: The dependent variable is the earnings repatriated from foreign affiliates to their parent scaled by lagged consolidated assets. Positive Equity Provision Dummy measures parent firm investments of new equity abroad. In columns 1 and 2 it is equal to one if the parent increased its equity investment in the year repatriations are measured and is otherwise equal to zero. In columns 3 and 4, it is equal to one if the parent increased its equity investment in the year repatriations are measured or the year before and is otherwise equal to zero. The 2005 Dummy is equal to one in 2005 and zero in other years. Leverage is the ratio of total debt to the sum of total debt and the market value of equity. Tobin’s q is calculated as the ratio of the book value of firm assets plus the market value of firm equity less the book value of firm equity to the book value of firm assets. Industry median values of Tobin’s q are used if firm specific ones are unavailable. Lagged Cash/Lagged Assets measures the lagged ratio of consolidated cash holdings to consolidated cash. Profitability is calculated as the ratio of consolidated net income to consolidated assets. Each specification is an OLS specification that includes firm and year fixed effects. Heteroskedasticity-consistent standard errors that correct for clustering at the firm level appear in parentheses. ** and * denote significance at the 5 and 10 percent levels, respectively.
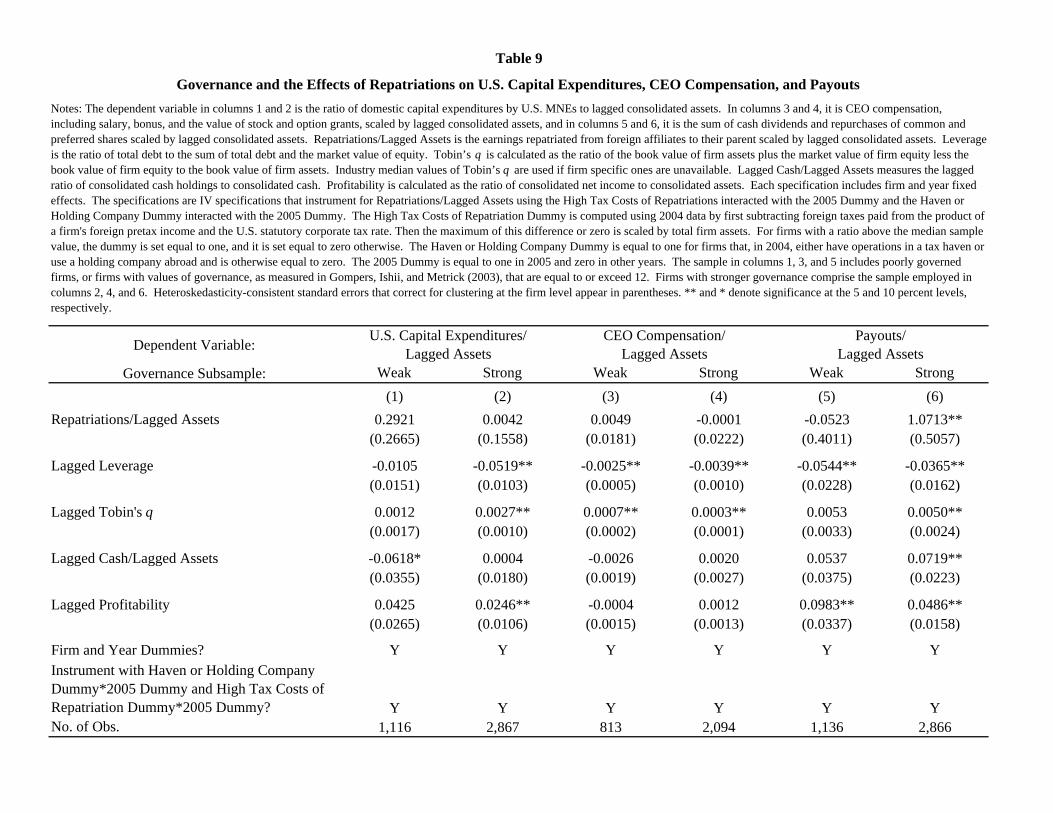
Dependent Variable:
Governance Subsample: Weak Strong Weak Strong Weak Strong
(1) (2) (3) (4) (5) (6)
0.2921 0.0042 0.0049 -0.0001 -0.0523 1.0713**(0.2665) (0.1558) (0.0181) (0.0222) (0.4011) (0.5057)
-0.0105 -0.0519** -0.0025** -0.0039** -0.0544** -0.0365**(0.0151) (0.0103) (0.0005) (0.0010) (0.0228) (0.0162)
0.0012 0.0027** 0.0007** 0.0003** 0.0053 0.0050**(0.0017) (0.0010) (0.0002) (0.0001) (0.0033) (0.0024)
-0.0618* 0.0004 -0.0026 0.0020 0.0537 0.0719**(0.0355) (0.0180) (0.0019) (0.0027) (0.0375) (0.0223)
Lagged Profitability 0.0425 0.0246** -0.0004 0.0012 0.0983** 0.0486**(0.0265) (0.0106) (0.0015) (0.0013) (0.0337) (0.0158)
Firm and Year Dummies? Y Y Y Y Y YInstrument with Haven or Holding Company Dummy*2005 Dummy and High Tax Costs of Repatriation Dummy*2005 Dummy? Y Y Y Y Y YNo. of Obs. 1,116 2,867 813 2,094 1,136 2,866
Lagged Leverage
Lagged Tobin's q
Lagged Cash/Lagged Assets
Payouts/ Lagged Assets
Repatriations/Lagged Assets
Table 9
Governance and the Effects of Repatriations on U.S. Capital Expenditures, CEO Compensation, and Payouts
Notes: The dependent variable in columns 1 and 2 is the ratio of domestic capital expenditures by U.S. MNEs to lagged consolidated assets. In columns 3 and 4, it is CEO compensation, including salary, bonus, and the value of stock and option grants, scaled by lagged consolidated assets, and in columns 5 and 6, it is the sum of cash dividends and repurchases of common and preferred shares scaled by lagged consolidated assets. Repatriations/Lagged Assets is the earnings repatriated from foreign affiliates to their parent scaled by lagged consolidated assets. Leverage is the ratio of total debt to the sum of total debt and the market value of equity. Tobin’s q is calculated as the ratio of the book value of firm assets plus the market value of firm equity less the book value of firm equity to the book value of firm assets. Industry median values of Tobin’s q are used if firm specific ones are unavailable. Lagged Cash/Lagged Assets measures the lagged ratio of consolidated cash holdings to consolidated cash. Profitability is calculated as the ratio of consolidated net income to consolidated assets. Each specification includes firm and year fixed effects. The specifications are IV specifications that instrument for Repatriations/Lagged Assets using the High Tax Costs of Repatriations interacted with the 2005 Dummy and the Haven or Holding Company Dummy interacted with the 2005 Dummy. The High Tax Costs of Repatriation Dummy is computed using 2004 data by first subtracting foreign taxes paid from the product of a firm's foreign pretax income and the U.S. statutory corporate tax rate. Then the maximum of this difference or zero is scaled by total firm assets. For firms with a ratio above the median sample value, the dummy is set equal to one, and it is set equal to zero otherwise. The Haven or Holding Company Dummy is equal to one for firms that, in 2004, either have operations in a tax haven or use a holding company abroad and is otherwise equal to zero. The 2005 Dummy is equal to one in 2005 and zero in other years. The sample in columns 1, 3, and 5 includes poorly governed firms, or firms with values of governance, as measured in Gompers, Ishii, and Metrick (2003), that are equal to or exceed 12. Firms with stronger governance comprise the sample employed in columns 2, 4, and 6. Heteroskedasticity-consistent standard errors that correct for clustering at the firm level appear in parentheses. ** and * denote significance at the 5 and 10 percent levels, respectively.
U.S. Capital Expenditures/ Lagged Assets
CEO Compensation/ Lagged Assets